 David K. Schnake
 Jodi A. Forrester
 Andrew J. Sánchez Meador
 David J. Mladenoff4
- 1Department of Forestry and Environmental Resources, College of Natural Resources, North Carolina State University, Raleigh, NC, United States
- 2Ecological Restoration Institute, College of the Environment, Forestry, and Natural Sciences, Northern Arizona University, Flagstaff, AZ, United States
- 3School of Forestry, College of the Environment, Forestry, and Natural Sciences, Northern Arizona University, Flagstaff, AZ, United States
- 4Department of Forestry and Wildlife Ecology, College of Agriculture and Life Sciences, University of Wisconsin–Madison, Madison, WI, United States
Introduction: Field experiments of gap-based harvest systems in temperate northern hardwood forests have provided inconsistent support for the theory that such regeneration approaches can improve regeneration success among increasingly underrepresented tree species intermediate in shade tolerance. We established a field experiment in Wisconsin, USA testing the long-term response of tree regeneration to group selection harvesting that created small (50 m2–D:H 0.32), medium (200 m2—D:H 0.64) and large (380 m2—D:H 0.88) gaps.
Materials and methods: Light levels were modeled to test the assumption of resource heterogeneity within and across these gap sizes. Spatial statistics were used to assess whether the point patterns of saplings of several midtolerant tree species (Betula alleghaniensis, Carya cordiformis, Fraxinus spp.) mapped in harvest gaps provided evidence for partitioning across resource gradients 9 years post-harvest. Finally, we measured occurrence and height of all saplings within the harvest gaps to test the effects of gap size and deer exclusion fencing on the density and total height of shade-tolerant and midtolerant tree regeneration.
Results and discussion: Light levels progressively increased with gap size, varied by position within gaps, and provided significant evidence of resource heterogeneity. The complex light gradients formed both within and across the three gap sizes may partially explain the statistically significant clustering of Fraxinus spp. saplings in gap centers and north and east into the forested edge of medium and large gaps, C. cordiformis on the west sides of forested transitions surrounding large gaps, and B. alleghaniensis in the centers of large gaps. Densities of tolerant and midtolerant saplings were similar in medium and large gaps after nine growing seasons, though tolerant saplings averaged two meters taller across all three gap sizes. Our results show that gap-based silvicultural systems can create resource gradients that are sufficient to regenerate mixtures of species with high to intermediate tolerance of shade. However, prescriptions beyond harvesting and deer exclusion fencing may be necessary for the recruitment of midtolerant species to canopy positions.
1. Introduction
Group selection harvesting (“GSH”) is a gap-scale silvicultural system in which groups of overstory trees are harvested to emulate canopy gap formation following natural disturbances of low to moderate severity. Long-term implementation of GSH can result in a complex mosaic of clustered tree ages at the stand scale and has been linked to increases in both structural and compositional diversity (Leak, 1999; Halpin et al., 2017). These attributes of GSH are of particular importance given that compositional and structural diversity can improve ecosystem function and may ultimately increase ecosystem resilience and adaptability (Franklin et al., 2018). While GSH can certainly present some economic and environmental disadvantages (Shaffer et al., 1993; Hood et al., 2002), it can also be efficient in both layout and harvest and create fewer adverse visual impacts than clear-cut harvesting (Miller et al., 1995; Ashton and Kelty, 2017). As such, GSH can provide forest managers with an ecologically justifiable, operationally-feasible, and publicly acceptable approach for reintroducing compositional and structural complexity to forest stands.
Northern hardwood forests of the Lake States (Michigan, Wisconsin and Minnesota, USA) (“LS-NH”) are a prime example of a forest system in which GSH may partially emulate the region’s gap-scale disturbance regime (Palik et al., 2020). Combinations of wind, ice, forest pests, and disease frequently create canopy gaps ranging between approximately 50 m2 to 400 m2, although larger gaps can infrequently occur, following medium to high-severity disturbances (Frelich and Lorimer, 1991; Goodburn, 1996). In older, mixed species, multi-aged stands, such gaps have historically been sufficient for establishment and canopy recruitment of species midtolerant to tolerant of shade in LS-NH forests (Webster and Lorimer, 2005). Complex stands are now atypical, with much of the region now dominated by even-aged, often Acer saccharum-dominated stands that regenerated naturally in the early- to mid-1900 s following extensive logging in the region (Schulte et al., 2007). Once-prevalent midtolerant tree species such as Betula alleghaniensis, Quercus rubra, and Tilia americana, among others (Curtis, 1959), are now increasingly underrepresented in contemporary LS-NH forests (Schulte et al., 2007). While midtolerant species still occur in many contemporary stands, the midtolerant component of such stands often consists of Fraxinus spp., for which high densities are also a legacy effect of past logging (Curtis, 1959; Rhemtulla et al., 2009).
Experiments testing GSH in LS-NH forests, even when creating large gaps (> 400 m2), have unfortunately not provided evidence of consistent regeneration, or expected canopy recruitment of midtolerant species (Forrester et al., 2014; Willis et al., 2016; Kern et al., 2017; Knapp et al., 2019a,b,2021; Reuling et al., 2019; Sabo et al., 2019). Many studies have reported increased regeneration of midtolerant species following GSH, but the regeneration and potential gap winners are typically dominated by shade tolerant species, and most often A. saccharum and Ostrya virginiana. The potential effects of gap size, and hard-to-predict factors like competing vegetation, seed source availability, selective herbivory from white-tailed deer (Odocoileus virginianus), and others on regeneration outcomes have also been complex and inconsistent across these and other studies (Kern et al., 2017). GSH studies from the LS-NH forest system have also occurred primarily on sites underlain by mesic but still well drained to somewhat well drained sandy loam or silt loam soils with medium to rich nutrient regimes, where A. saccharum is known to be highly competitive and capable of dominating all strata (Kotar et al., 2002; Knapp et al., 2021). As such, GSH shows promise but would benefit from additional experimentation, particularly with attention paid to the spatial structures among regeneration across a broader range of gap sizes and biotic and abiotic conditions.
GSH is thought to promote increased tree species diversity among regeneration by enabling species with differing physiological characteristics to coexist. This coexistence is purportedly facilitated by species partitioning across the gradient of light, temperature, and substrate conditions formed within the gap environment and more broadly across gaps of different sizes, an idea referred to as the Gap Partitioning Hypothesis (Ricklefs, 1977; Denslow, 1980). Experiments from northern temperate latitudes reveal that light generally decreases from north to south within gaps due primarily to the southerly angle of the sun and shade cast by surrounding vegetation, and thus supports the assumption of heterogeneity of resources (Marquis, 1965; Canham et al., 1990; Gendreau-Berthiaume and Kneeshaw, 2009). Additionally, several studies from northern temperate regions report evidence of niche partitioning among tree regeneration (Sipe and Bazzaz, 1994, 1995; Gray and Spies, 1996; Poznanovic et al., 2014; Vilhar et al., 2015; Lu et al., 2018, 2021, Martin et al., 2021). However, given the often less-than-favorable results following GSH in LS-NH forests, additional research exploring the extent to which species partitioning is associated with resource gradients across a broader range of gap sizes and biotic and abiotic conditions is warranted.
In this study, we used the infrastructure of The Flambeau Experiment, a long-term field experiment testing the effects of restoring forest structure on ecosystem processes to conduct a series of analyses to evaluate the effectiveness of GSH to increase tree species diversity. Specifically, we use a combination of solar radiation estimates, stem mapping, and plot data to answer the following questions:(1) Is there significant resource heterogeneity within and among harvested gaps that approximately span the range of sizes currently recommended in the Lake States?; (2) Do the spatial patterns of mapped midtolerant saplings (dbh ≥ 0.5 cm and < 10 cm) that regenerated following GSH provide evidence of resource partitioning?; and (3) What are the effects of gap size and deer fencing on density and total height of shade tolerant and midtolerant tree species regeneration nine growing seasons after GSH? Broadly, this research revisits the early (< 10 year) regeneration outcomes in a typical, homogenized, second growth LS-NH stand to track changes following the initial response (Forrester et al., 2014). On a finer scale, these results characterize potential patterns of heterogeneity among light and sapling regeneration. These collective results will be valuable to researchers and practitioners trying to design, implement, and assess the outcomes of gap-based silvicultural treatments used to restore ecosystem structure and composition.
2. Materials and methods
2.1. Study site
The study site is located on the Flambeau River State Forest in north-central Wisconsin, USA (45°37.4 N, 90°47.8 W). Mean annual precipitation is 84 mm of rain and 1,330 mm of snow (1971—2000). The site has a mean January air temperature of −13° C but a mild summer mean air temperature of 19° C in July. The growing season averages approximately 118 days, from approximately 26 May to 20 September (averages 1981–2010, base temperature = 0°C, Jump River 3E. WI, USA, Midwest Regional Climate Center)1. The site is generally flat with mean elevation of 427 m. Magnor (Coarse-loamy, mixed, superactive, frigid Aquic Glossudalfs), Ossmer (Coarse-loamy over sandy or sandy-skeletal, mixed, superactive, frigid Aquic Glossudalfs), and Freeon (Coarse-loamy, mixed, superactive, frigid Oxyaquic Glossudalfs) soils, all deep silt loams overlaying dense glacial till (David Hvizdak, USDA, NRCS), dominate the site. Somewhat poorly drained Magnor and Ossmer soils and the moderately well-drained Freeon are seasonally perched, while the poorly to very poorly drained Cebana and Capitola soils have high water tables. These soils result in a mesic moisture regime and a rich to very rich nutrient regime capable of supporting high species diversity (Kotar et al., 2002).
The even-aged stand that dominates the site regenerated following a clear-cut harvest in the mid-to-late 1920s, giving the stand an effective age of approximately 80 years when the treatments associated with this experiment were implemented in 2007. The overstory basal area is dominated by A. saccharum, T. americana, and F. americana (Table 1). Shade tolerant species overwhelmingly dominate the midstory, but there are relatively high sapling densities among midtolerant Fraxinus spp. and C. cordiformis, some being large (dbh > 5 cm) and thus demonstrating an ability to become established and compete. A. saccharum dominated the seedling layer (Forrester et al., 2014). Mean height of canopy trees was approximately 25 m and the density of white-tailed deer ranged from 8 to 15 deer per km–2 over the course of this study (Forrester et al., 2014; Sabo et al., 2019).
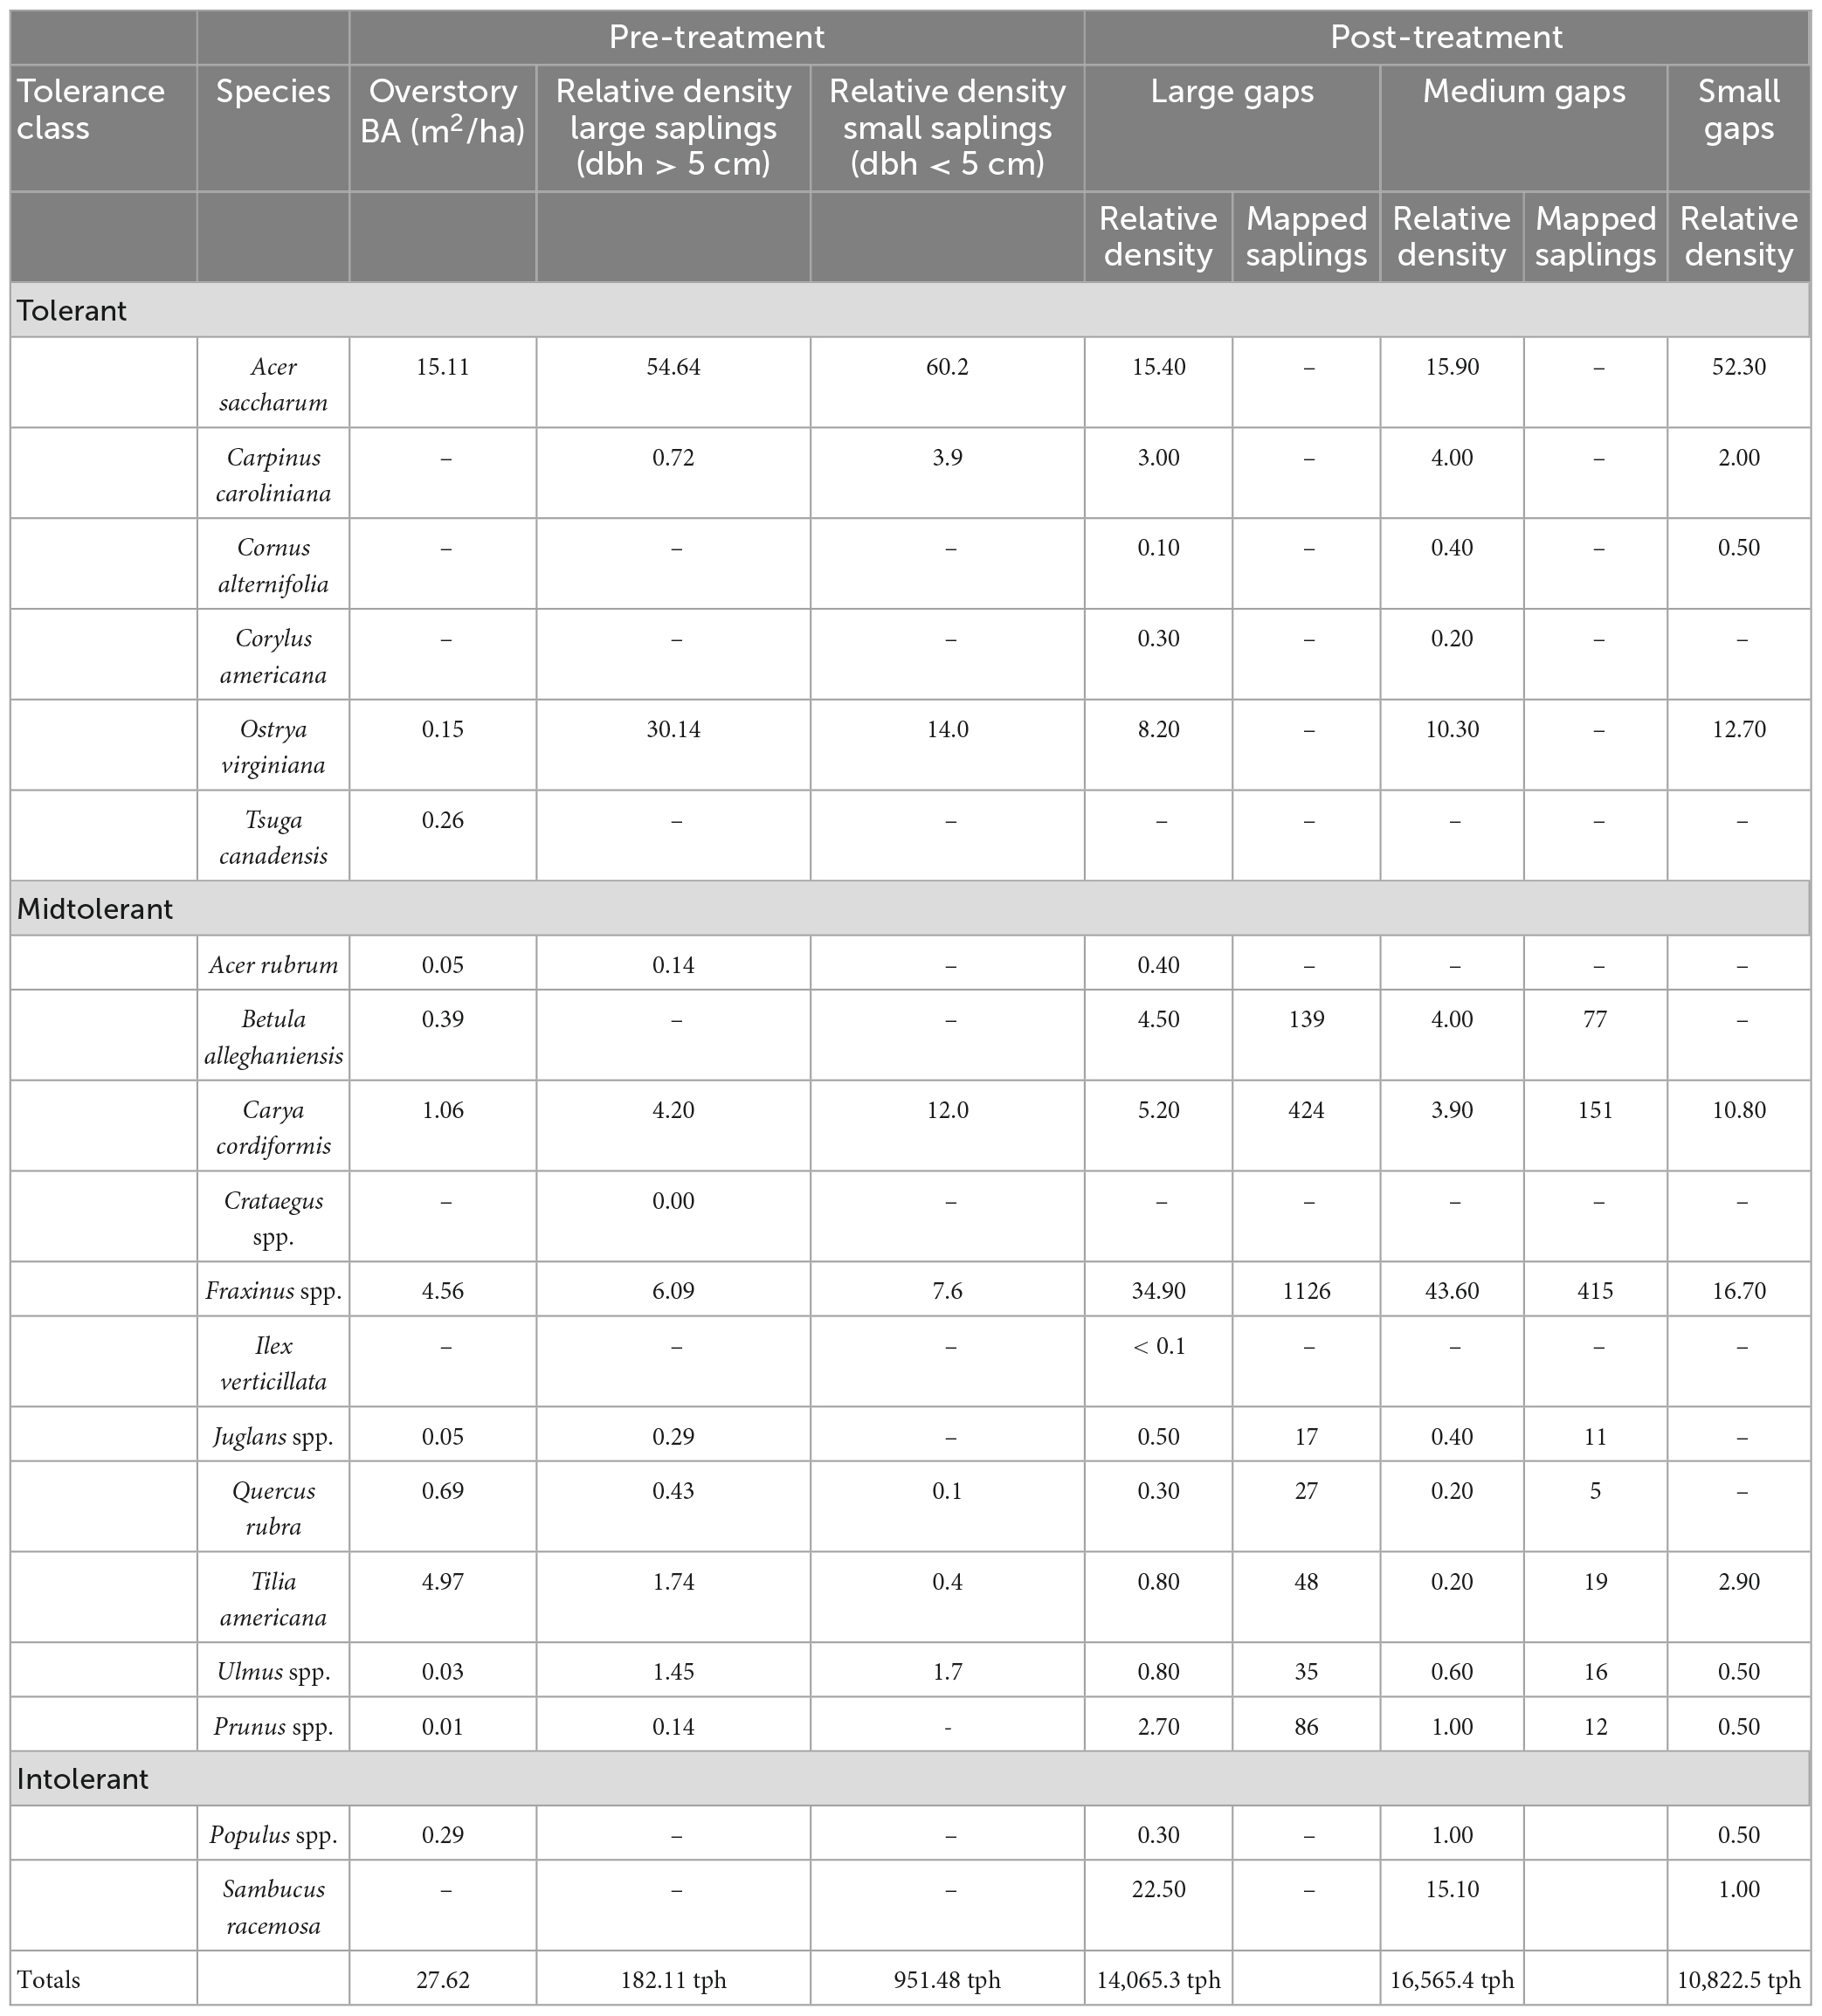
Table 1. Shade tolerance classes of northern hardwood species used in the Flambeau Experiment [adapted from Niinemets and Valladares (2006)], sapling relative density (2007 and 2016) in the 15 plots that received any variation of GSH treatments and number of mapped individuals (2018) in central zones of the 10 large and medium subplots receiving GSH and GSH + deer exclusion treatments where saplings were mapped.
2.2. Experimental design
This experiment utilizes a combination of whole plot and subplot treatments to test the effects of deer exclusion fencing and GSH gap size, respectively, on tree regeneration 9 years post-harvest. Fifteen, 80 x 80 m (0.64 ha) plots distributed across the 280-ha study area were randomly assigned to one of two whole-plot treatments: GSH (n = 10) or GSH + deer exclusion (n = 5). To test the effect of GSH gap size on tree regeneration, three non-overlapping circular subplots, hereinafter “gaps,” of three different sizes are randomly arranged within each plot (Figure 1). Small gaps have a diameter of 8 m, medium gaps have a diameter of 16 m, and large gaps have a diameter of 22 m. Gaps are divided into “central” and “transition” zones, each accounting for half of the gap diameter width. The central and transition zones are further divided into cardinal direction-oriented quadrants (Figure 1).
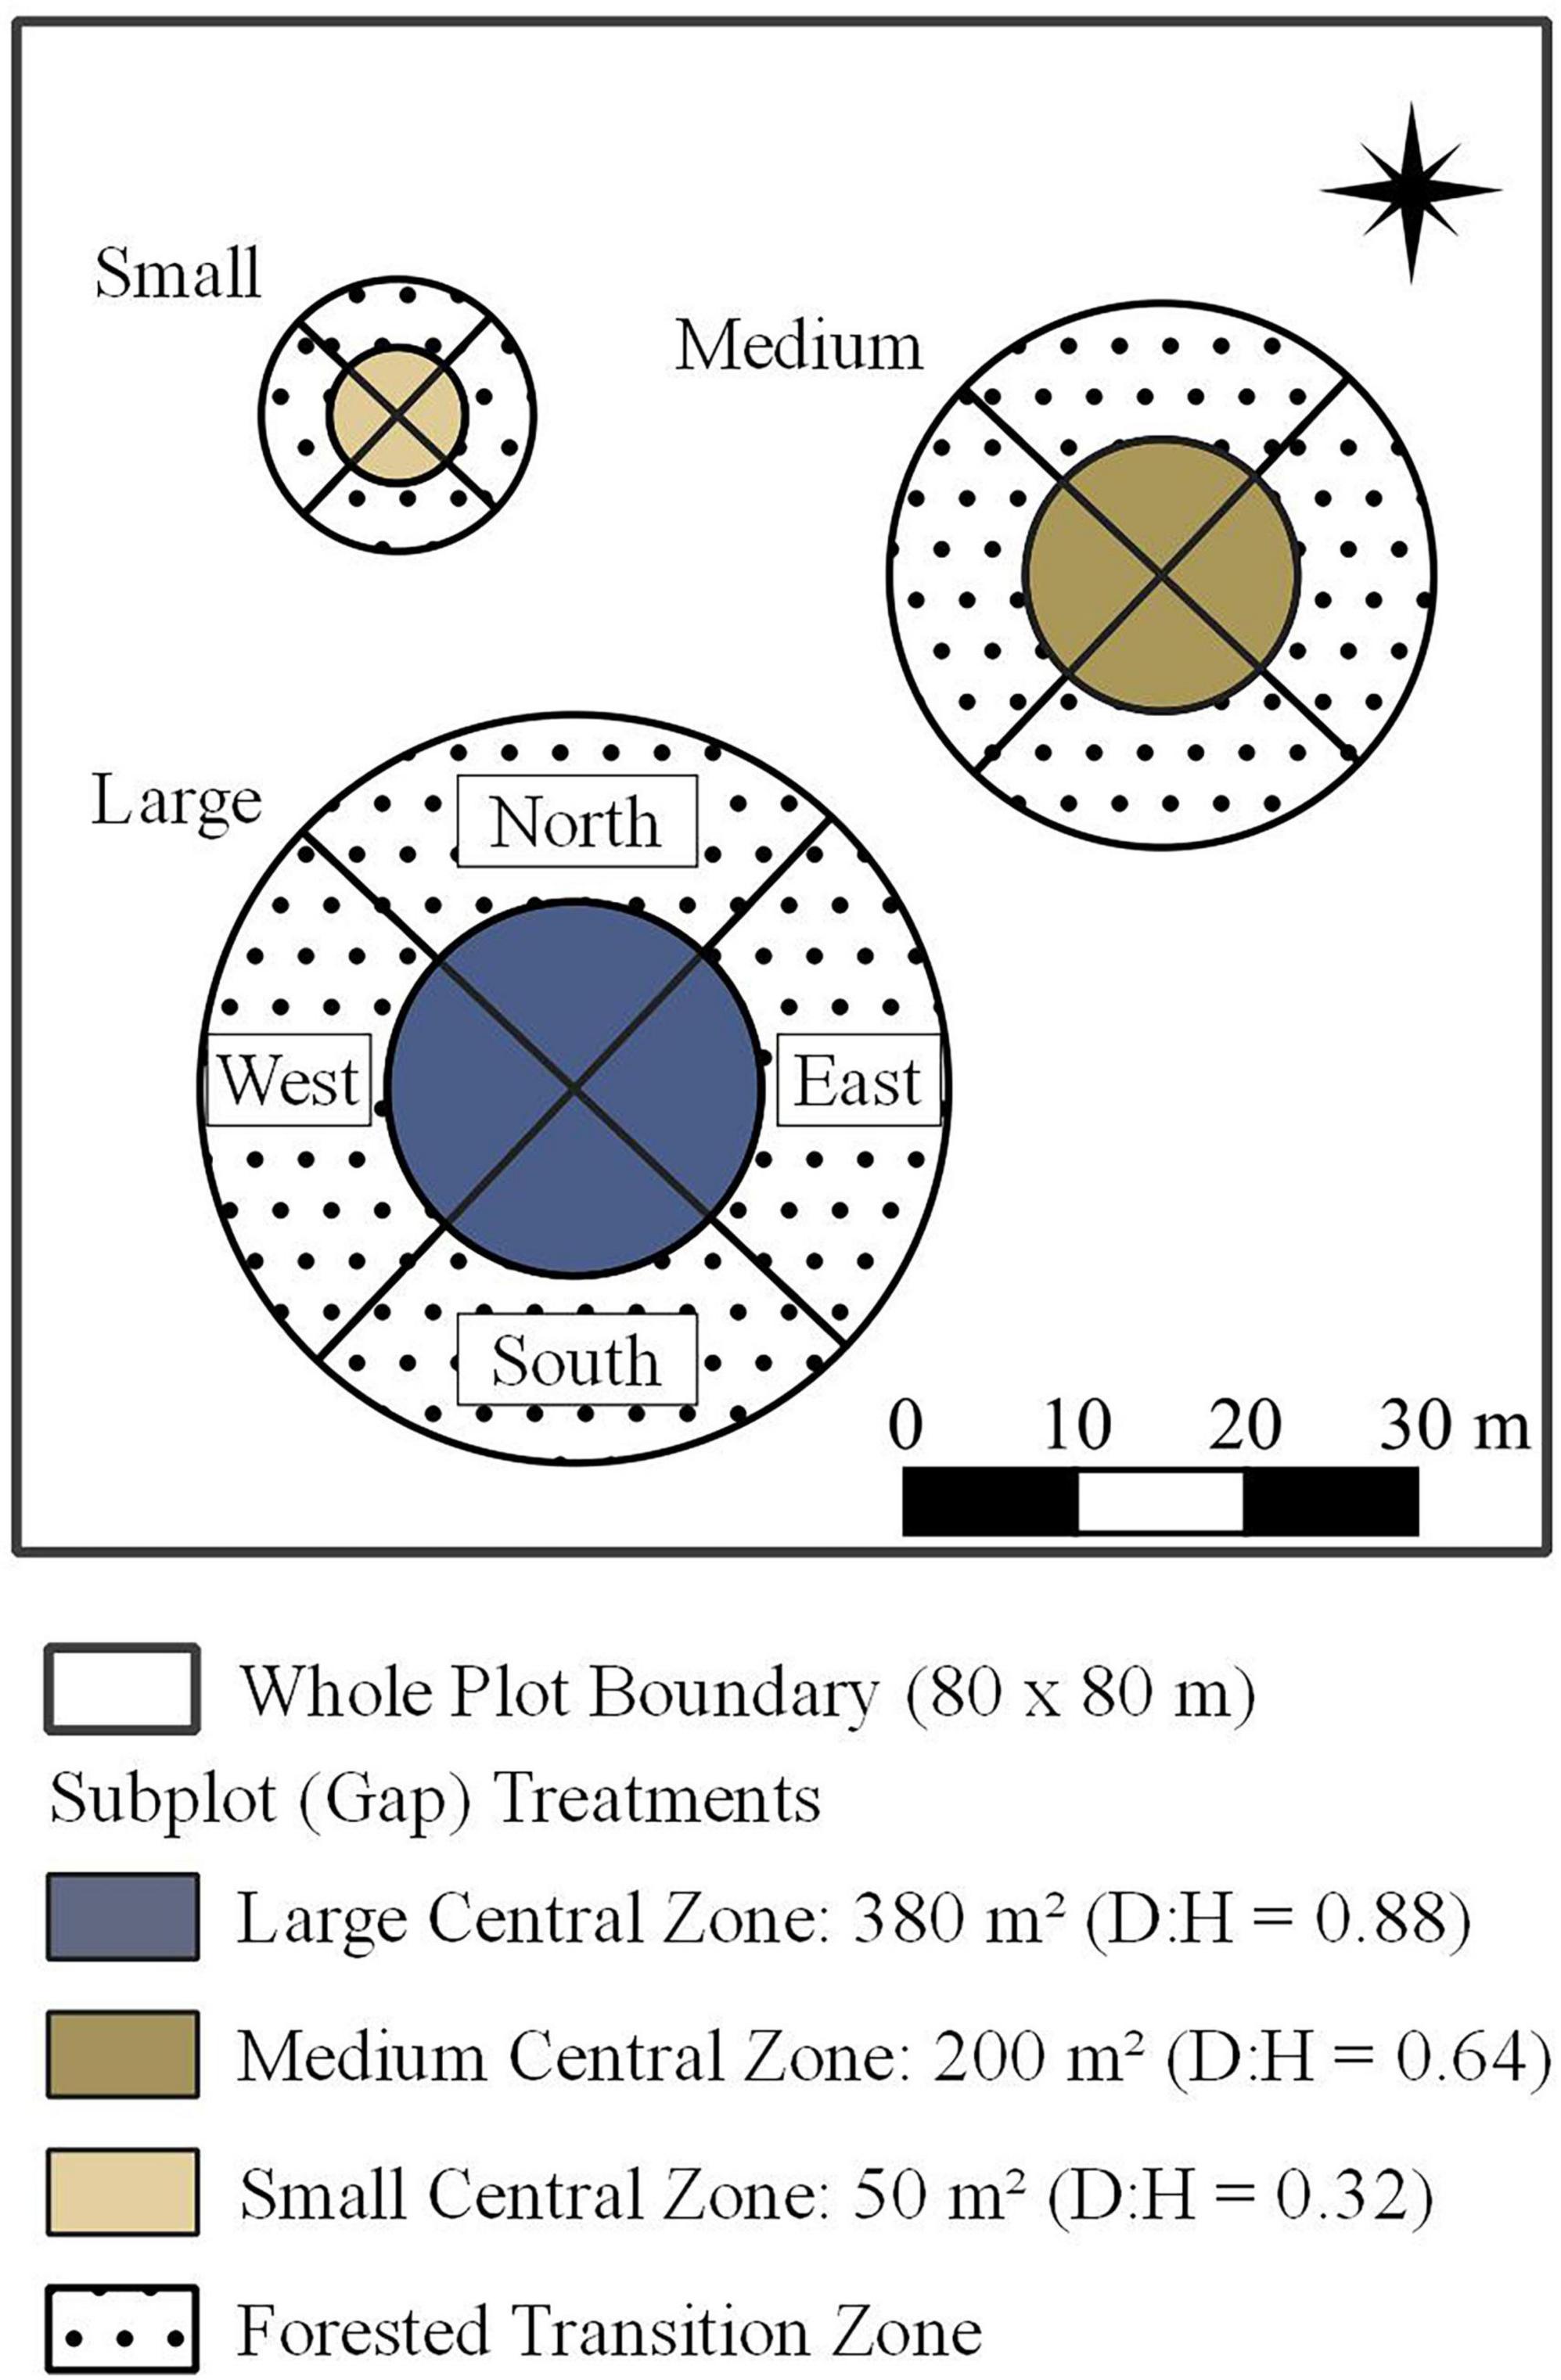
Figure 1. Whole plot layout with subplot (gap size) treatments. Concentric circles depict zones: the central zone was harvested, and transition zone surrounds closed canopy.
Gaps were formed by harvesting all stems ≥ 5 cm dbh within the central zones of gaps in the 15 plots assigned GSH or GSH + deer exclusion treatments (hereinafter, “treatments.”) Gap sizes ranged from those typical of single-tree to medium and large groups selection harvests. In this second-growth stand, this meant approximately 1.5, 9 and 20 trees were harvested per small medium, and large gap, respectively, Schatz et al. (2012). The harvests were conducted in January 2007 over frozen, snow-packed ground and created expanded gap areas (sensu Runkle, 1981) of 50, 200, 380 m2 in small, medium, and large subplots, respectively, and gap diameter and surrounding vegetation height ratios (D:H) of 0.32, 0.64, and 0.88. In August 2007, polypropylene fences (45 mm x 50 mm mesh) measuring 2.1 m in height were installed around the entire 80 x 80-m perimeter of the five plots assigned the GSH + deer exclusion treatments. Deer fencing was inspected regularly and repaired as needed.
2.3. Data collection and post-processing
In summer 2016, a total census of saplings was conducted in the central zone of each gap. Saplings were tagged and measured periodically since treatments were established (for additional details see Forrester et al., 2014, Sabo et al., 2019, Bakken et al., 2021). Briefly, the species and status (live vs. dead) for each sapling within the central zone was recorded by quadrant (Figure 1). Sapling heights were subsampled by recording the height (m) of the three tallest saplings of each species within each central zone quadrant. Saplings were assigned to a shade tolerance class based on methods proposed by Niinemets and Valladares (2006) (Table 1).
Midtolerant saplings were mapped in summer 2018 by recording their distance (± 4 cm) and azimuth (± 0.5 degrees) from gap center within medium and large gaps in a subsample of plots that received GSH (n = 5) and GSH + deer exclusion (n = 5) treatments. Saplings were mapped within both the central zone and the adjacent forested transition zones (Figure 1). Two non-overlapping methods of subsampling were employed to simplify sapling stem mapping. When clusters of conspecifics of similar size were encountered, the sapling representing the cluster centroid was mapped, akin to methods described by Ziegler et al. (2017). The number of similar saplings within 1 m of the mapped sapling (i.e., the cluster centroid) were recorded and points representing the unmapped saplings were randomly generated post hoc at coordinates within 1 m of cluster centroids to which they were associated. In all, 49 clusters averaging 3.6 saplings per cluster were mapped and 125 saplings total were added to the dataset through this method.
Eight gaps (three large, five medium) had an abundance of Fraxinus spp. regeneration that were dispersed or in approximate clumps much larger than 1 m. Crews mapped every 3rd Fraxinus spp. sapling, then two points representing the unmapped Fraxinus spp. stems were randomly generated post hoc. However, as there was no defined radius bounding these unmapped saplings, the points were established at coordinates with an azimuth and a distance randomly drawn from the distribution of nearest-neighbor distances among Fraxinus spp. saplings. A total of 418 Fraxinus spp. saplings were mapped using this method. These combined with the cluster subsampling, accounted for only 21% of the individuals comprising the mapped midtolerant sapling dataset (2,608 saplings in total) (Table 1).
2.4. Modeling solar radiation in the gap environments
We used the Voxel Octree Solar Toolkit (Bechtold and Höfle, 2020), or VOSTOK, to estimate daily incoming solar radiation (watt-hour/m2) reaching the forest floor across the study area in 2007, the first growing season after treatments were implemented in this experiment. We manipulated an airborne lidar point cloud (2.38 points/m2)2 to represent immediate post-harvest conditions by eliminating points representing vegetation within the central zones of gaps. The remaining vegetation points within the study area were converted to volumetric pixels or voxels with dimensions of 0.85 m. Estimates of incoming solar radiation over the growing season were ray cast through the voxelated vegetation and onto the lidar ground points. This approach accounted for the potential shadow casting of and light penetration through the voxelated vegetation surrounding the central zones of gaps.
The solar radiation-valued cloud of ground points was converted to a 1-m resolution raster image with each cell valued by the percent of daily available solar radiation (“light”) received over the growing season. We calculated the mean light value among raster cells in each quadrant in the central and adjacent forested transition zones (Figure 1) for each gap in the 10 plots where gaps were created and midtolerant saplings were mapped. The azimuth-orientation and zonal location of each quadrant was combined into one descriptive variable (e.g., transition north, central zone south, etc.) henceforth referred to as “section.” Light served as the response variable to test for differences in modeled light levels both within and across three gap sizes included in this study (Model 1, Table 2). Gap size, section, and their interactions were included as fixed effects and plot was included as a random effect to account for potential variation in factors like the height or density of surrounding vegetation between the 10 plots (Table 2).
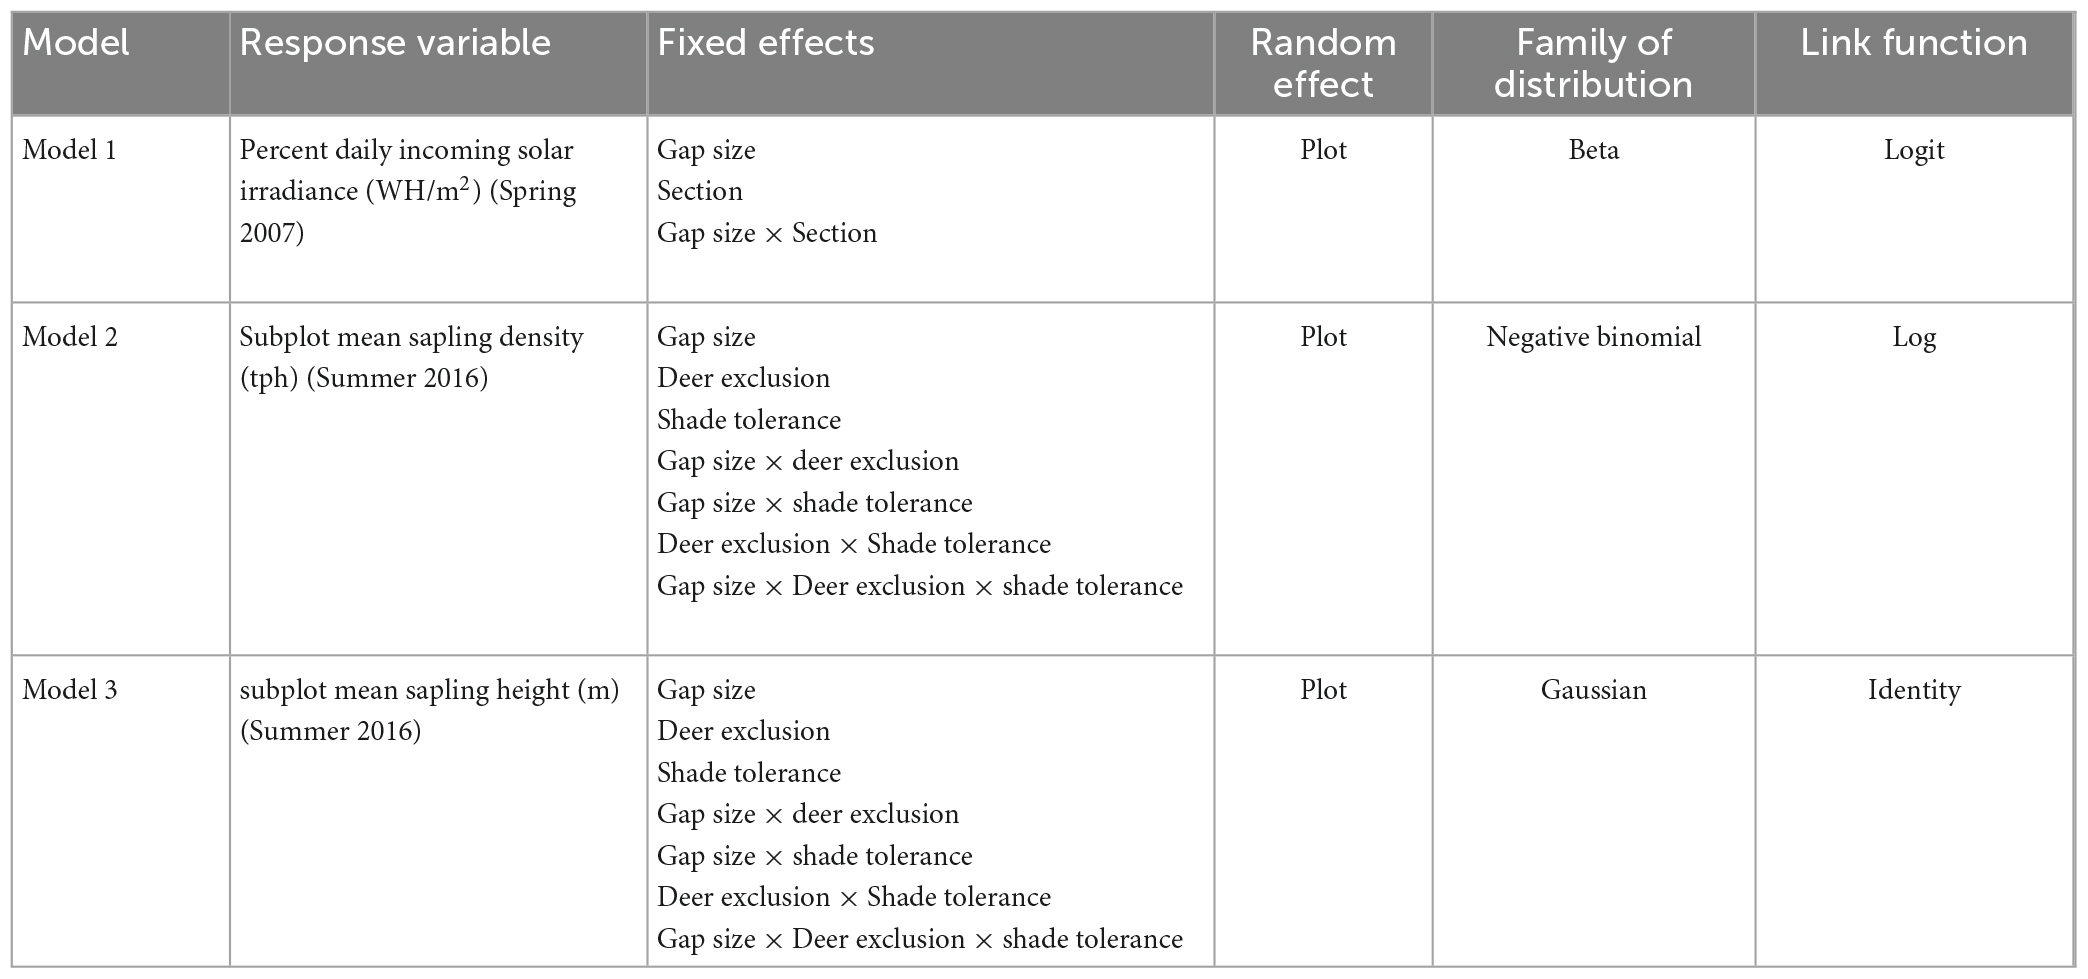
Table 2. Response variables, fixed effects, random effects, distribution families, and link functions used to analyze three proposed models of factors effecting light and sapling dynamics.
To complement our light estimates, we summarized meteorological data collected from three large gaps during the 2008 growing season (Table 3). Sensors were located north and south of gap centers in both the central and transition zones and within the eastern and western transition zones (Figure 1) as described in Stoffel et al. (2010). Micrometeorological stations were assembled using an array of nine sensors from Campbell Scientific and Decagon. Sensors measured air temperature and relative humidity (CS215L probes mounted at 1 m), photosynthetically active radiation (LI 190SB Quantum sensors mounted at 1 m) and volumetric soil moisture (Decagon Ech2o probes, 20 cm installed horizontally at 3.2 cm depth) and temperature (buried thermocouple wire, 2 cm depth). While these sensors offer only limited coverage of the study area, these data were nonetheless included ex-post to facilitate interpretation of our modeled light levels in the context of other light-related environmental variables like soil moisture, temperature, and humidity as reported in Schatz et al. (2012). Given that there can be temporal variation in microclimate within and around gaps (Wayne and Bazzaz, 1993), we summarized mean variables by morning and afternoon hours.
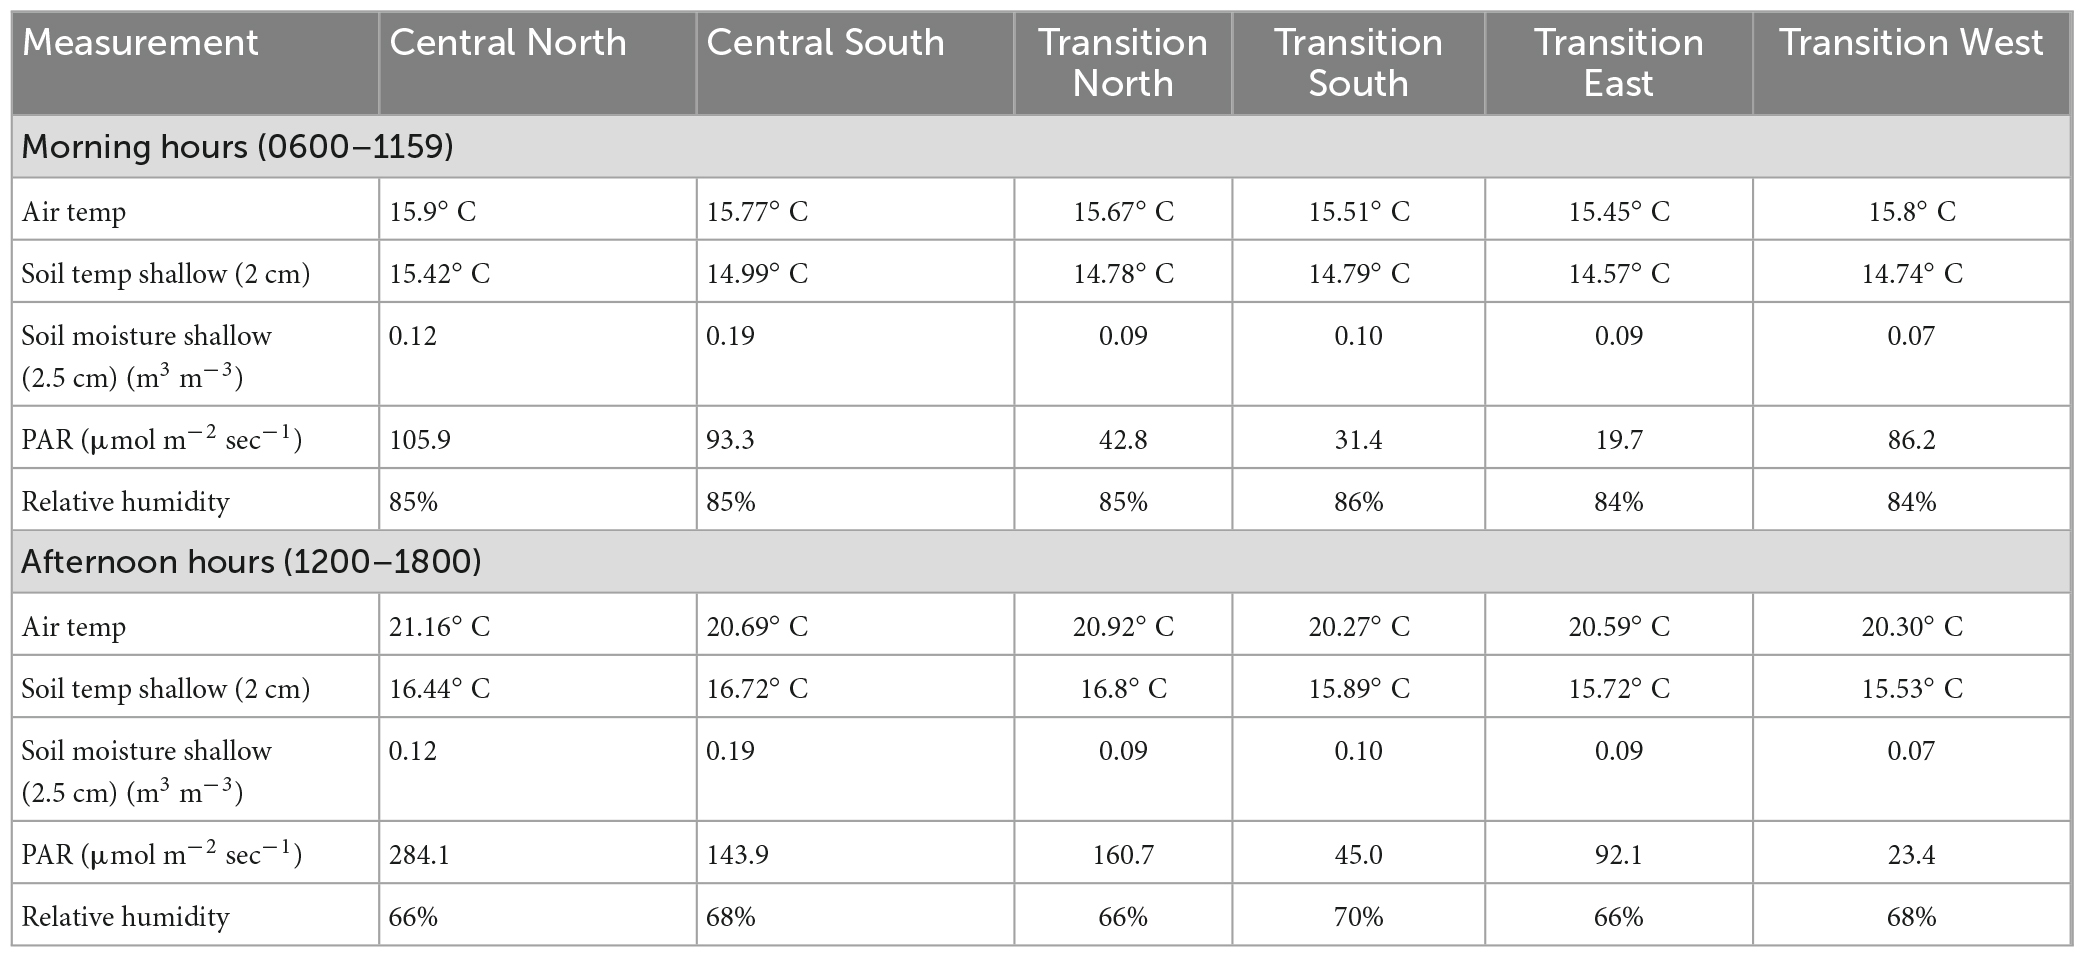
Table 3. Mean values of microclimate variables collected May 26–20 September 2008, from the N–S quadrants within the central zone and N-S-E-W quadrants of transition zones of three large subplots that received GSH treatments.
2.5. Multivariate analysis
Sapling composition was compared among gap creation treatments using Bray-Curtis ordination PC-ORD v 7.0 (McCune and Mefford, 2016). Sapling density by quadrant was relativized and arranged based on Sorenson distances. The proportion of species density in each tolerance group was calculated for each zonal location and tested for association, in addition to light calculated according to estimation methods described above.
2.6. Spatial point pattern analysis of midtolerant tree species
Evidence of partitioning among tree species across the gap environment was evaluated using spatial point pattern analysis of mapped midtolerant saplings in the large and medium subplots of the 10 plots that received treatments. We restricted our analysis to B. alleghaniensis, C. cordiformis, and Fraxinus spp. as these were the most abundant midtolerant species (Table 1). We prepared our data for analysis by aligning the 10 replicated point patterns of each subplot size on common anchor points. The anchor points were the center of 22 and 16-m radius circles encompassing the central and adjacent forested transition zones of the large and medium subplots. This method maintained each point’s original position in relation to its subplot center. The aligned point patterns of the replicates where then merged into one pooled dataset per species and gap size.
We calculated the Hopkins-Skellam Index (Hopkins and Skellam, 1954) of our three species by gap to characterize the spatial structure of our data and determine whether there was evidence that the patterns of sapling for our three focal species deviated from complete spatial randomness (CSR). We assumed that patterns showing characteristics of CSR signaled no evidence of gap partitioning theory among our data. Alternatively, patterns showing characteristics of spatial clustering or regularity would both warrant additional investigation and elucidate which statistical approach would be most appropriate for further analysis. This exploratory analysis provided evidence that the patterns of mapped saplings deviated from CSR toward clustering in both gap sizes (Table 4), leading us to conduct additional analysis suitable for clustered patterns in order to test for evidence of spatial partitioning.

Table 4. Hopkins-Skellam Index scores for large and medium gaps.
We tested for significant clustering of high or low sapling density among our data by calculating the Local Getis-Ord Gi* (Getis and Ord, 1992; Ord and Getis, 1995) statistic or “Hot Spot Analysis,” for each polygon section in a set of value-weighted polygons created from our pooled point patterns. Gaps were divided into 32 polygons to appropriately calculate a z-score from the Gi* statistic. Gap Central and transition zones were first divided by half into concentric rings with equal widths of 5.5 m for large gaps and 4 m for medium gaps. The concentric rings were then split along lines radiating from plot center along cardinal and sub cardinal azimuths. These polygons were assigned density (tph) values calculated by multiplying the number of mapped sapling points counted within each polygon by an expansion factor based on polygon area. Gi* was calculated for each polygon by species and gap size using fixed Euclidean distance bands of 15 and 11 m for the large and medium gaps, respectively, to ensure that the Gi* statistic was calculated in the recommended context of at least eight neighboring polygons (Getis and Ord, 1992). Statistical significance of clusters was assessed using a false discovery rate (FDR) correction to account for multiple comparisons and potential spatial dependence in the data (Caldas, de Castro and Singer, 2006). FDR correction ranks statistically significant p-values by strength and then uses estimates of the number of false positives for each confidence level to remove the weakest p-values, thus potentially reducing the critical p-value thresholds for significance. This approach has higher performance than other multiple testing procedures when applied to local statistics of spatial association (Caldas, de Castro and Singer, 2006). These analyses were conducted in ArcGIS Pro (V 2.6.2, ESRI Inc. 2020).
2.7. Midtolerant sapling density and height, 9 years post-treatment
Models 2 and 3 (Table 2) focused on the effects of gap size (subplot treatment) and deer exclusion (whole plot fencing; “fencing”) on sapling density (Model 2) and mean height (Model 3) of tolerant and midtolerant tree species in the harvested central zones of gaps after nine growing seasons, respectively. Mean sapling density (tph) and mean sapling height (m) by gap size and shade tolerance class within each gap (n = 45) served as our response variables (Table 2). Fencing, gap size, and shade tolerance class, as well as their interactions, were included as fixed effects in both models 2 and 3. Plot was included in the models as a random effect. Shade intolerant species were not included in these analyses because they were either extremely rare, and thus led to zero inflation, or abundant in only a very limited number of gaps, further hindering model fit. Four subplots had true zero values for density resulting from an absence of midtolerant saplings and thus no value for height. We used the mice package (van Buuren and Groothuis-Oudshoorn, 2011) in R (R Core Team, 2020) to impute these missing height values via multivariate imputation by chained equations using classification and regression trees (CART) (Breiman et al., 1984).
2.8. Model selection, assessing statistical significance, and pairwise comparisons
Visual evidence of non-normality among response variables for our models led us to analyze Models 1—3 using generalized linear mixed models. Analysis was completed via the Laplace method (Raudenbush et al., 2000) of maximum likelihood estimation using the glmmTMB package (Brooks et al., 2017) in R (R Core Team, 2020). We completed model diagnostics through the DHARMa package (Hartig, 2021) to aid in selecting the distribution and link functions that best fit the data for each model (Table 2). We used the same package to test for overdispersion, zero-inflation, and outliers. As all main effects included in the design of the Flambeau Experiment were selected based on ecological theory and prior research, and were of interest, all main effects and their interactions were retained in our models regardless of statistical significance.
The significance of main effects and interactions were assessed through Analysis of Deviance using Wald χ2-tests. Type II tests were conducted given the imbalance among our treatments in Models 2 and 3 (Langsrud, 2003). We interpret the p-values of our main effects and interactions calculated through analysis of deviance as continuous measures of the strength of evidence against our null hypotheses (Murtaugh, 2014). We conducted pairwise comparisons of estimated marginal means for main effects and interactions with p-values less than 0.11 using the emmeans package (Length, 2021). We used Sidak’s method of confidence level adjustment and Tukey’s method for p-value adjustment. Given that we allowed a wider-than-normal range of p-values to assign statistical significance to main effects and interactions, we analyzed our pairwise means separation tests more conservatively using a critical value of α = 0.05.
3. Results
3.1. Solar radiation analysis
The light model (Model 1) offered convincing evidence that gap size and section had significant (p < 0.0001) interacting effects on light reaching the forest floor during the first growing season (Table 5). The ground within central zones of gaps generally received significantly more light than in the surrounding forested transition environment, although the significance of these differences dissipated as gap size decreased (Figure 2). Light also increased, nearly always significantly, from south to north across the gap environment and as gap size increased (Figure 2). Meteorological data from 2008 showed a similar north-south gradient (Table 3), as was also reported by Schatz et al. (2012). Also, the amount of light reaching the forest floor in eastern and western sections within central zones was often intermediate between amounts reaching northern and southern sections and the differences were frequently significant when within-gap sections were considered. Our meteorological data also showed diurnal variation in light levels (Table 3), with western portions of the gap environment receiving more direct light in the morning and eastern portions receiving most direct light in the afternoon. This diurnal variation appeared to influence environmental variables like soil moisture, temperature, and humidity as described in Schatz et al. (2012). Acknowledging that extreme values and variability among meteorological data (i.e., frost) could be consequential to sapling survivorship and growth, future research would benefit from increasing replication and pairing of in-field sensors and remotely-sensed data. Overall, there was overlap in light levels within and across gap sizes, depending on the section being considered.
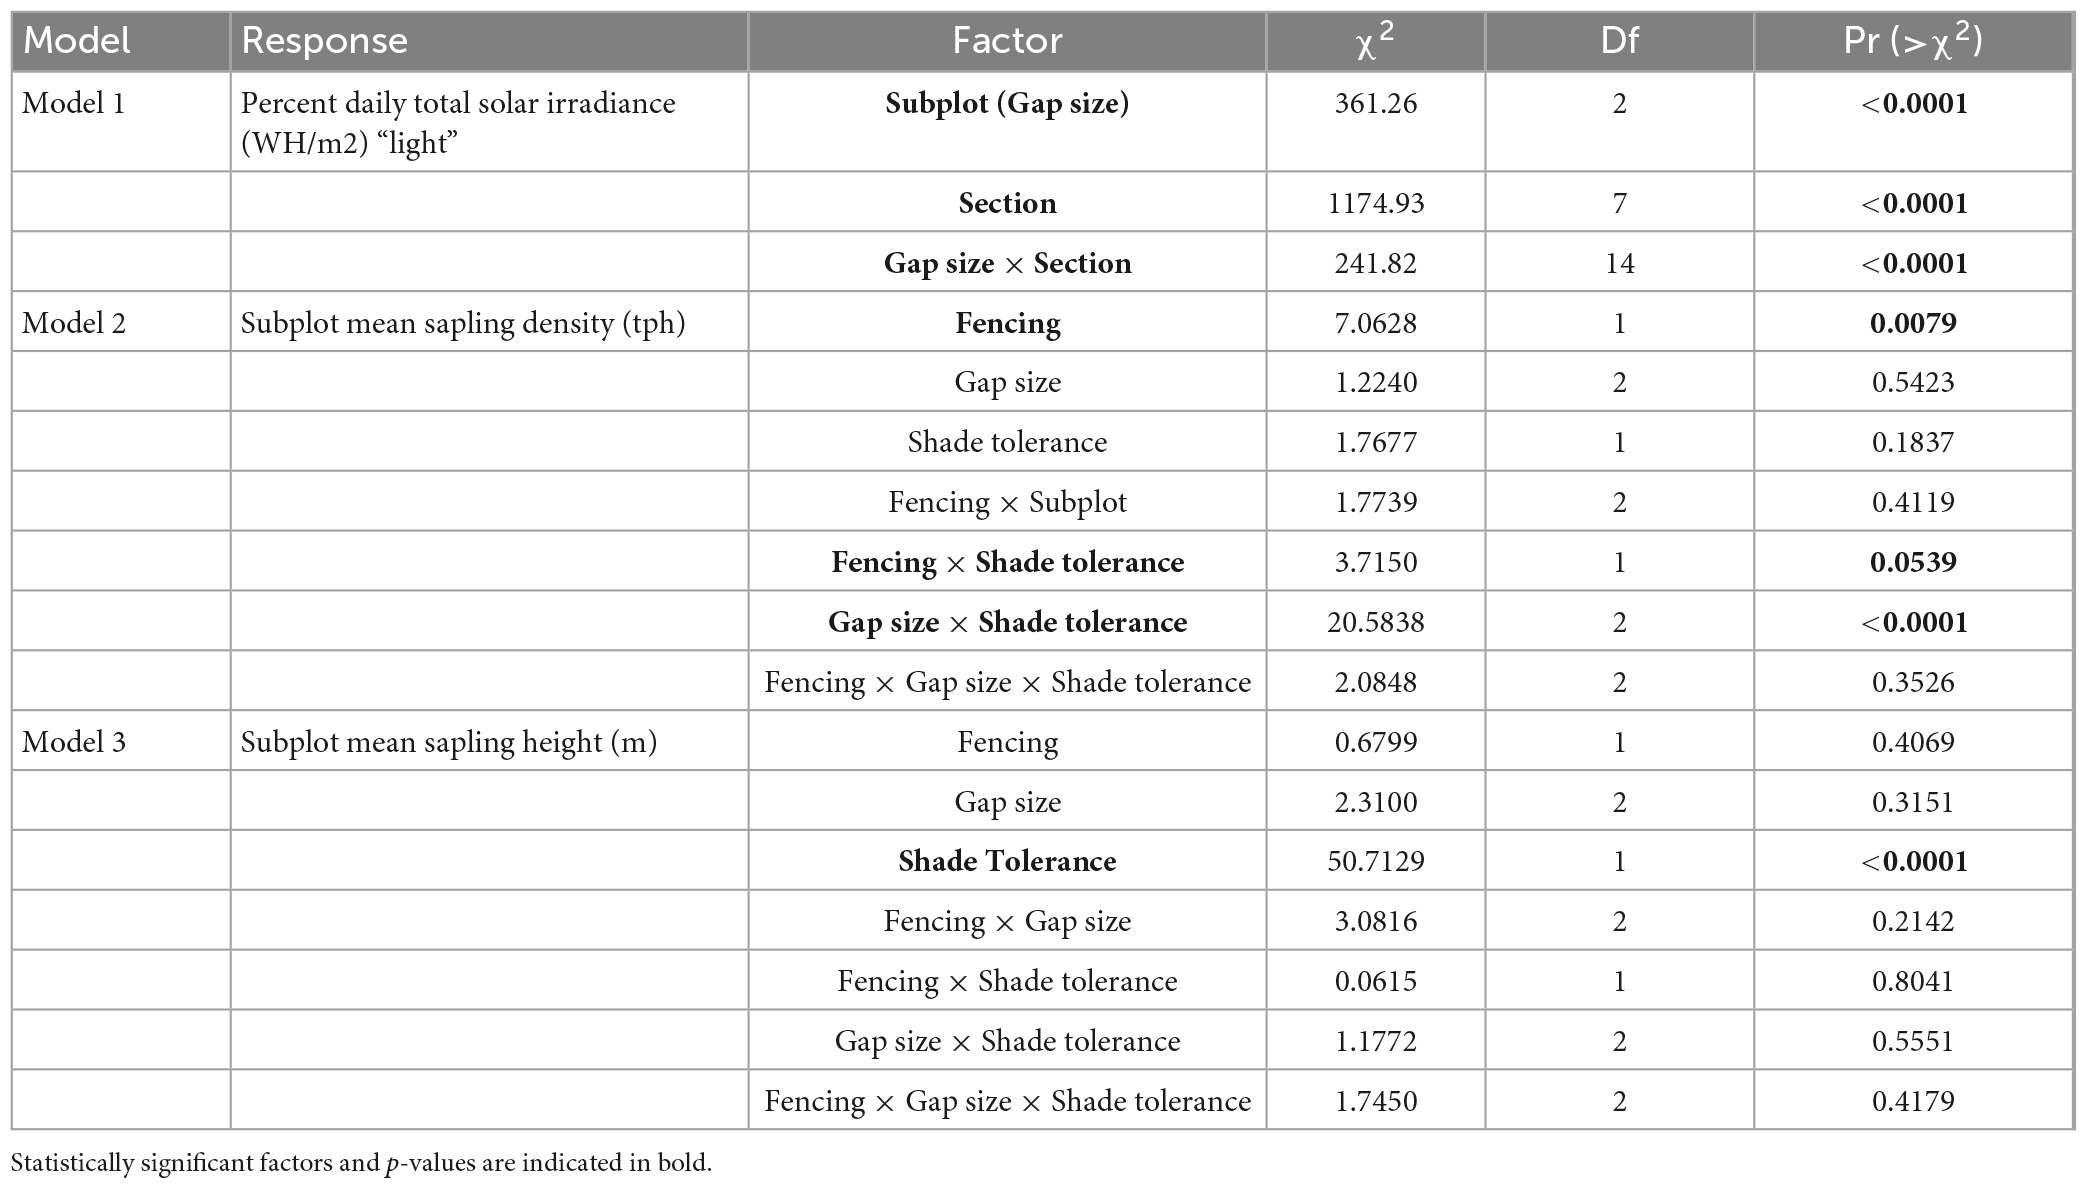
Table 5. Analysis of deviance tables (Type II Wald χ2-tests) for Models 1–3.
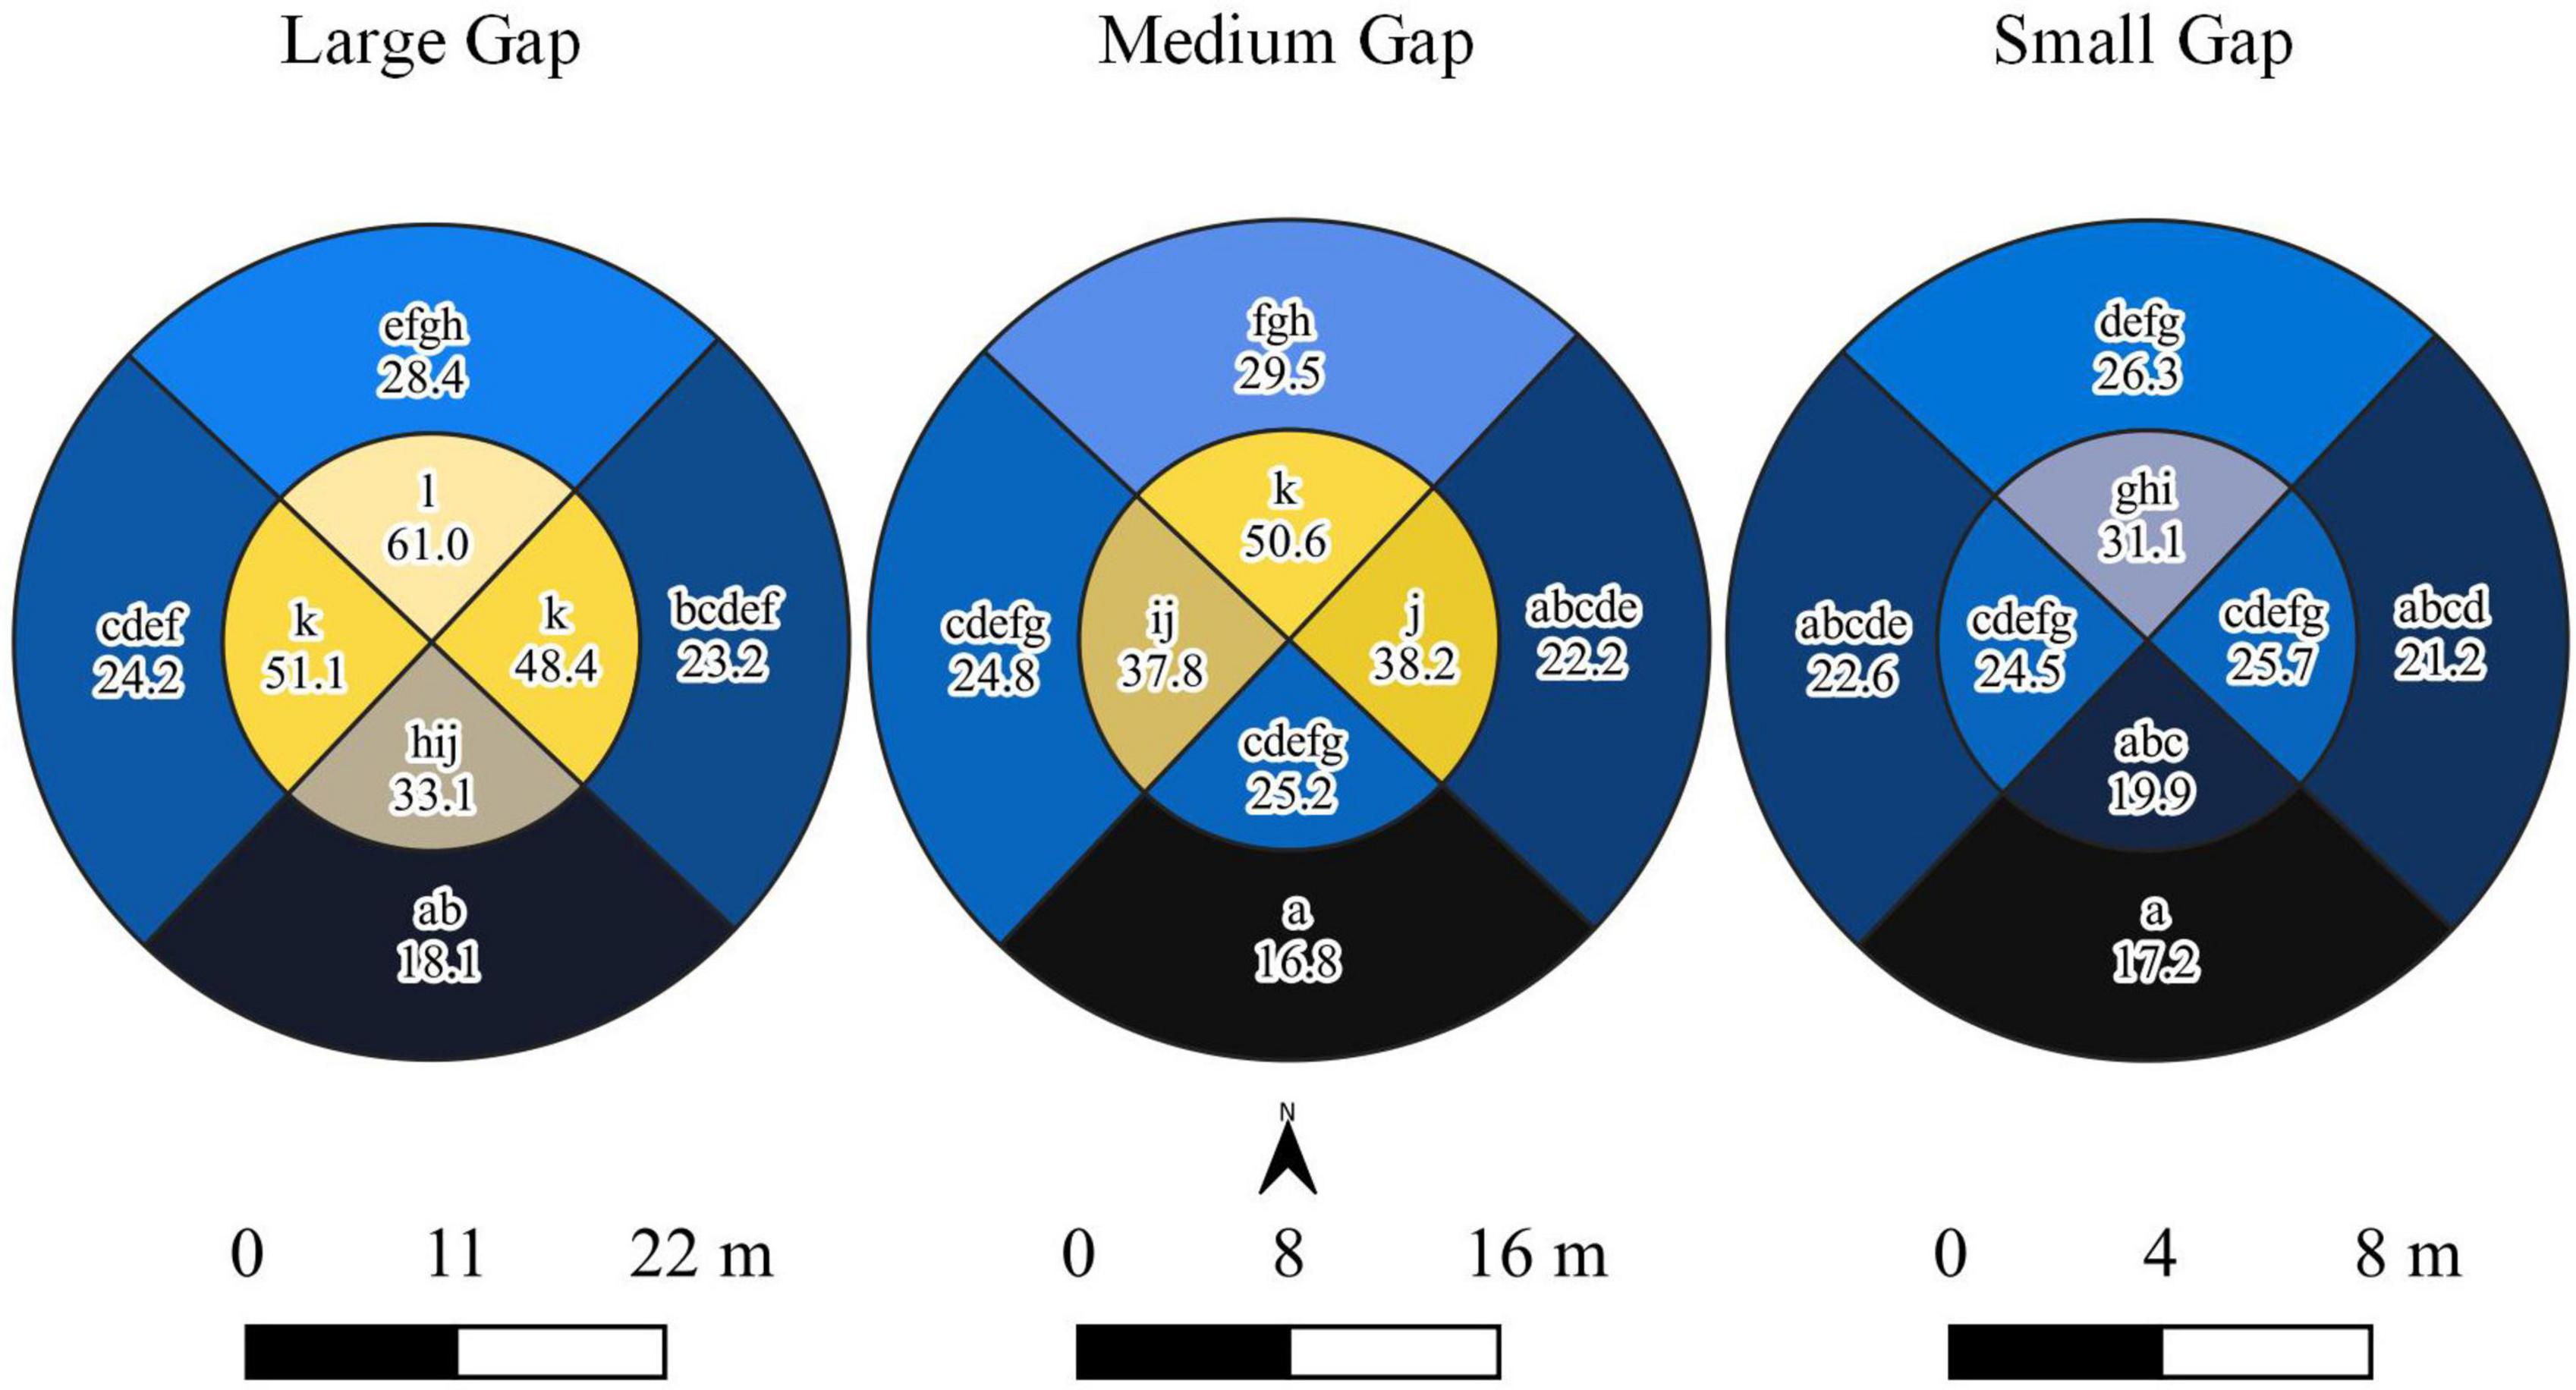
Figure 2. Pairwise differences in percent seasonal direct solar radiance by gap size and section. Polygons of different colors and not connected by the same letters are significantly different at an α = 0.05.
3.2. Multivariate analysis
Sapling composition varied based on the zone of occurrence and gap size (Figure 3). Plots separated based on several of the most abundant species and their associated tolerance, with plots high in A. saccharum differentiating from Fraxinus spp. along Axis 1 that described 17% of the variation in sapling density (Axis 1: ACSA tau = −0.421, FRAM tau = 0.448). Sambucus was strongly and positively correlated with Axis 2 (r2 = 0.457), while O. virginiana was negatively associated (tau = −0.471) (Axis 2 = 10% variation). The relative importance of tolerant species was higher in plots occurring in transition zone and small gaps (% tolerant species negatively correlated with Axis 1, tau = −0.434). Plots dominated by intolerant species clustered high in ordination space, most often these plots were in large and medium gaps (%intolerants r2 with Axis 2 = 0.473). A higher proportion of midtolerant species also occurred in the central zones of large and medium gaps (% midtolerants Axis 2 tau = 0.380). As expected, higher light was associated with the species occurring in the large and medium central zones (tau = 0.250). Patterns by treatment and quadrant were not apparent (not shown). However, species generally sorted along both axes, and thus provide some evidence that species had partitioned across the ordination space over nine growing seasons (Figure 3).
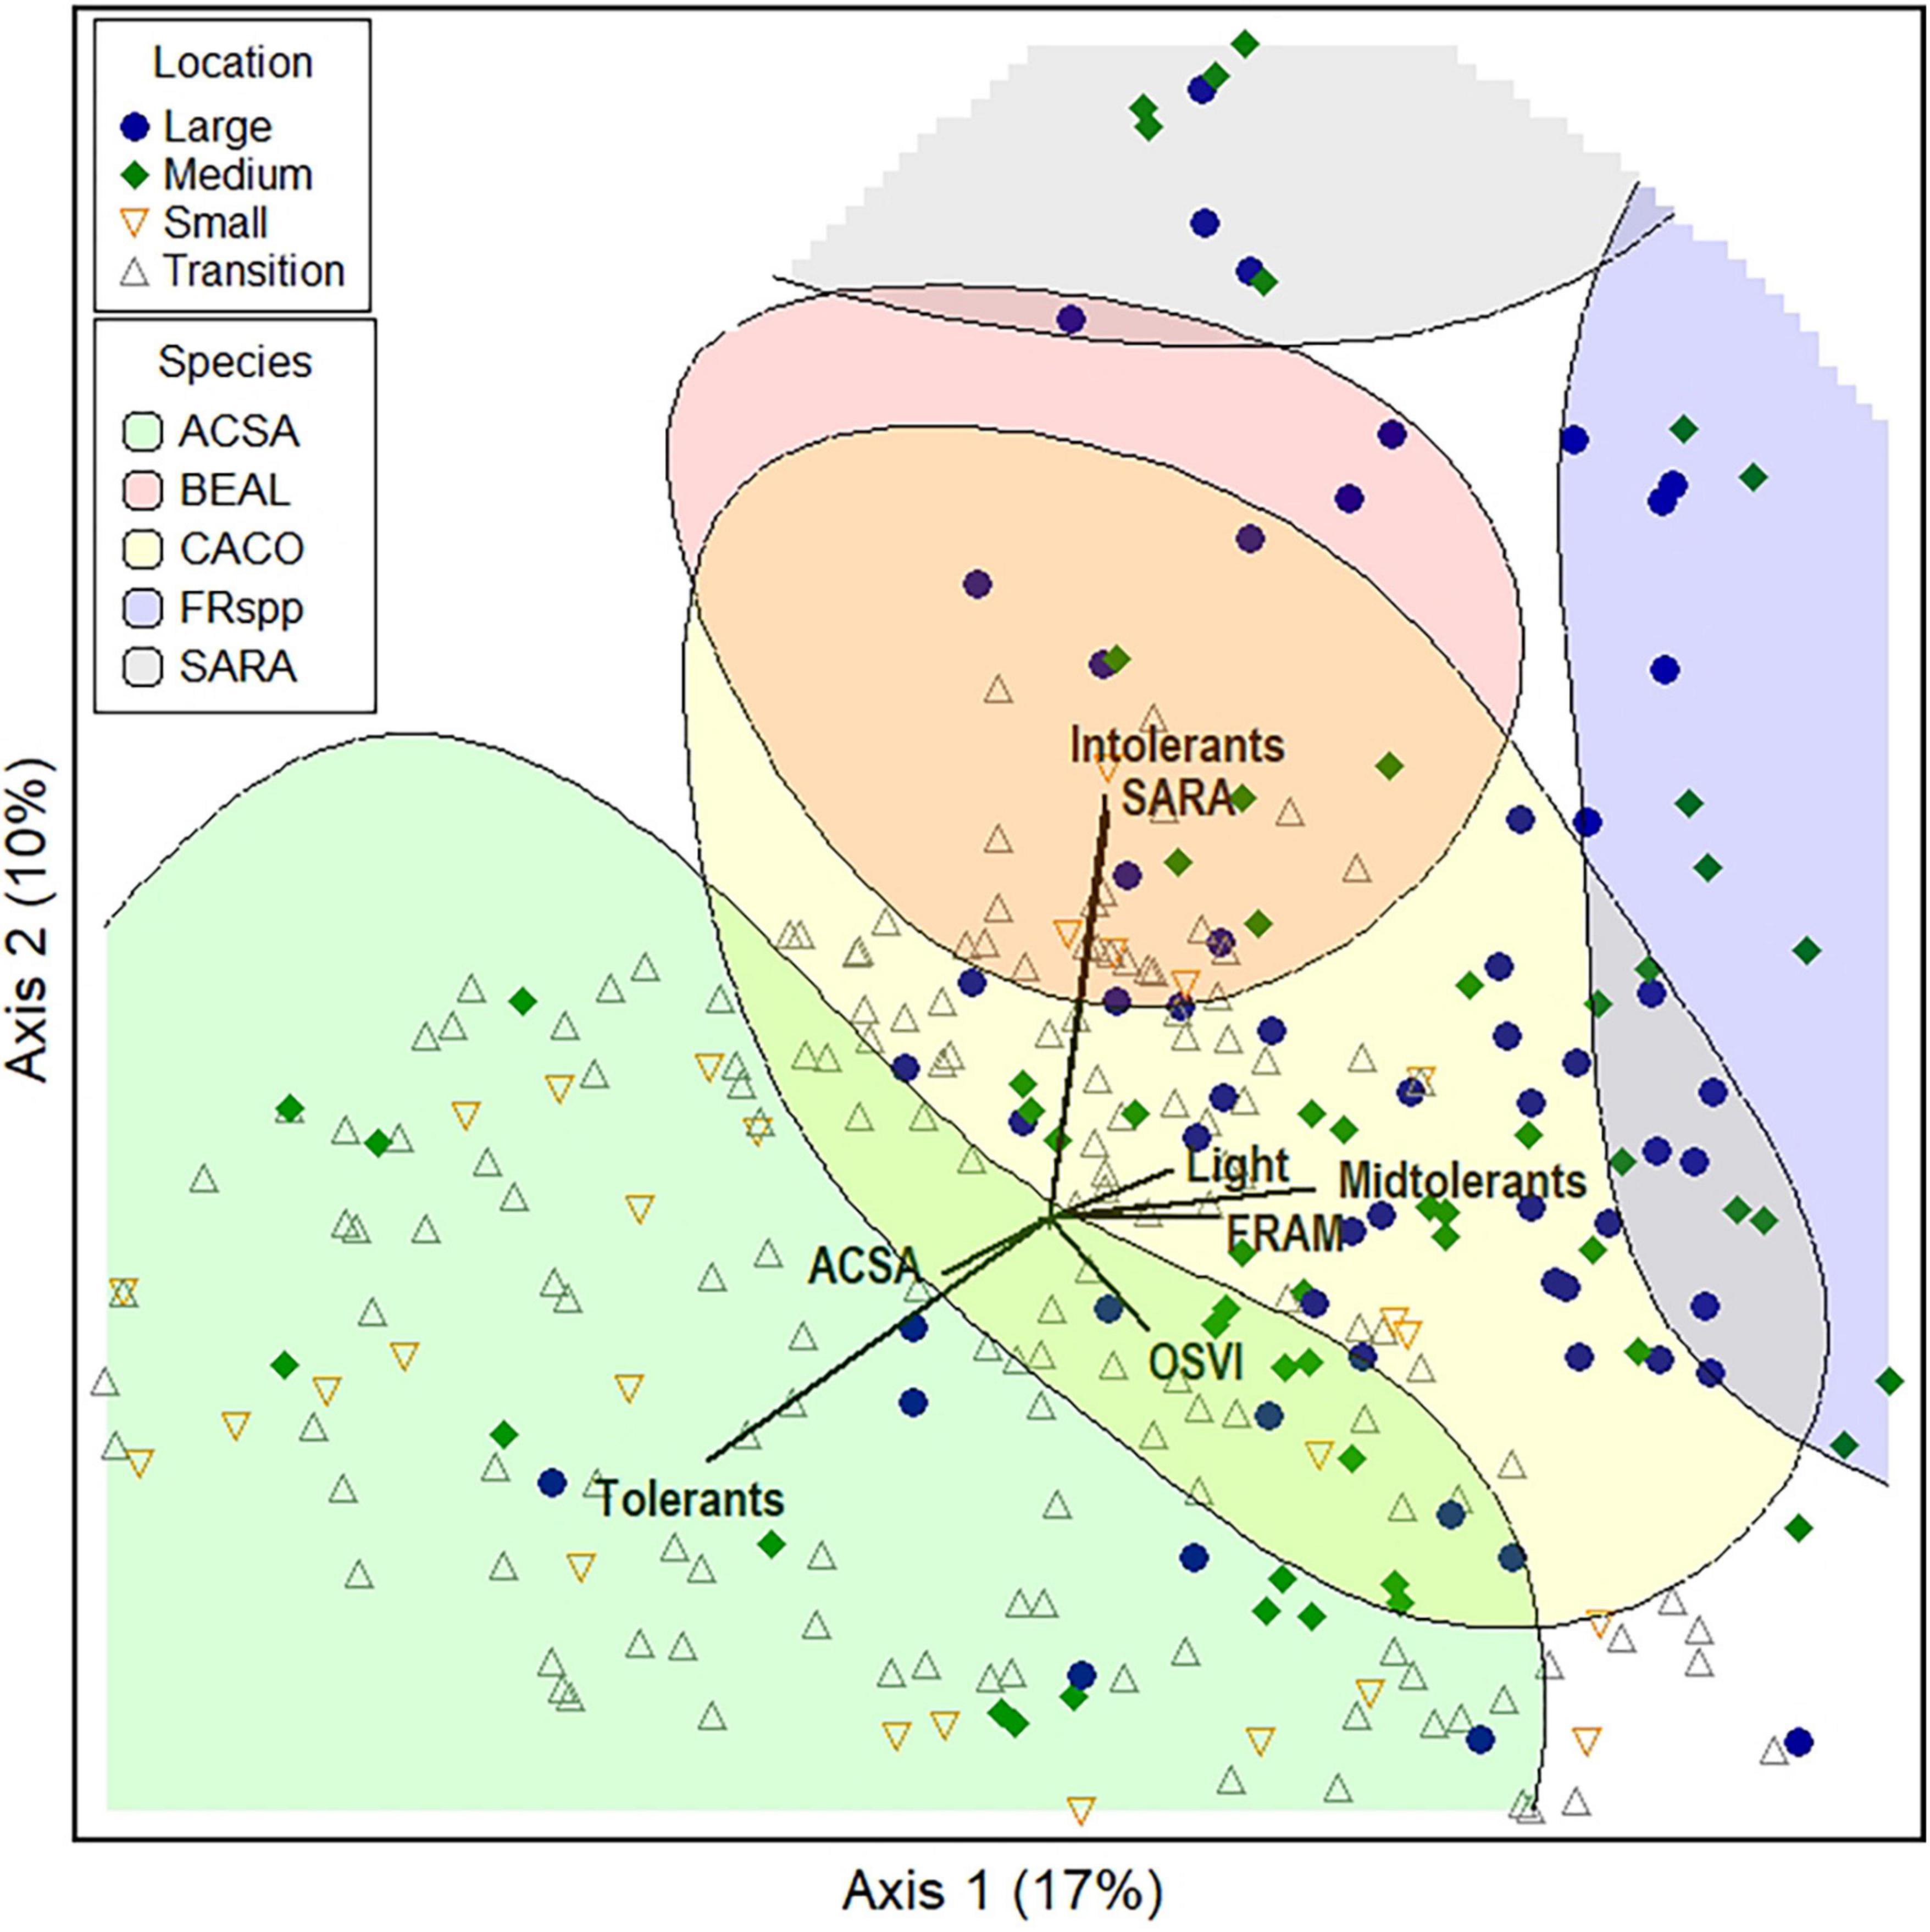
Figure 3. Bray-Curtis ordination of sapling density in permanent plots measured 9 years post-harvest. Species hilltops highlight the upper 20% of plots where these species occur. Vectors indicate association of specific species or tolerance groupings with particular plots. Light availability was modeled (section “2.1. Study site”).
3.3. Spatial point pattern analysis
Hot spot analysis provided evidence that significant (90–99% confidence) clusters of high Fraxinus spp. sapling densities occurred in eastern portions of the gaps and slightly into the forested transition environment surrounding large subplots (Figure 3). Significant clustering (90–99% confidence) of high Fraxinus spp. sapling densities shifted to northeastern and northern sections of the gap central zones and slightly into the forested transition environment in medium subplots (Figure 4). Significant (90–95% confidence) clusters of low Fraxinus spp. density occurred in the western to southwestern portions of the transition of both gap sizes.
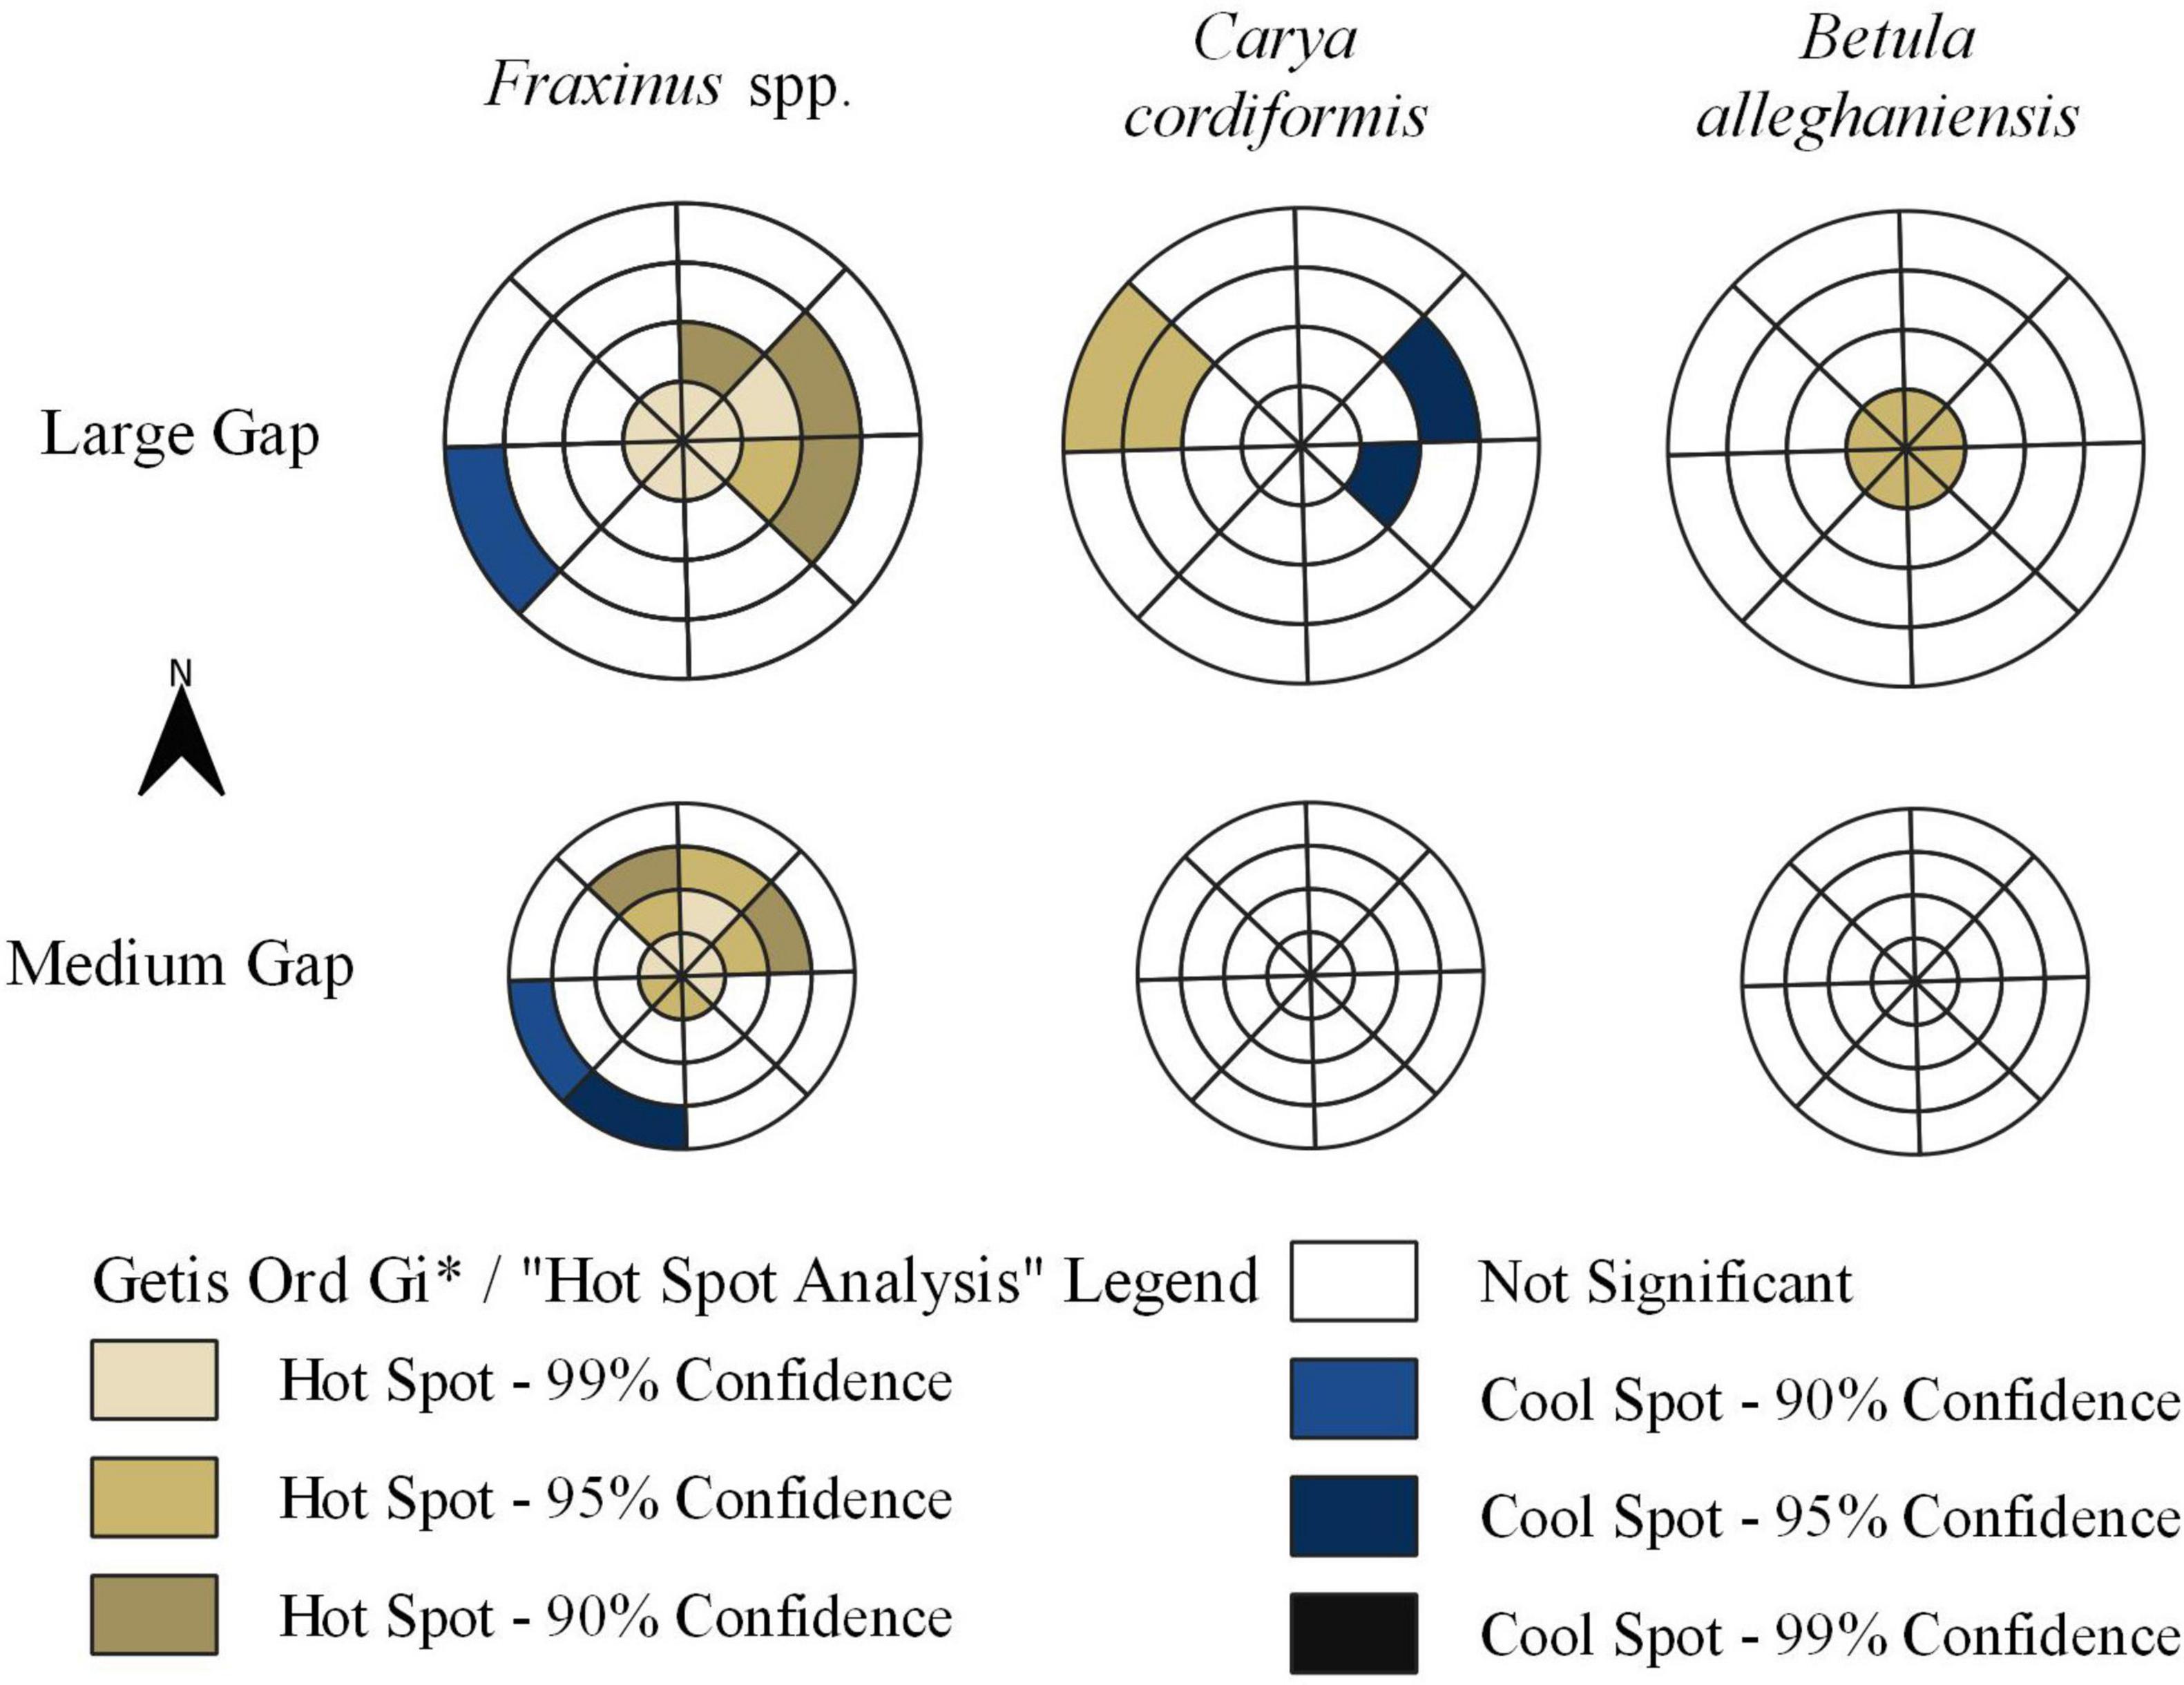
Figure 4. Statistical significance of the G statistics for tph-value-weighted polygons representing different azimuth orientations and zones where midtolerant saplings were mapped. Note that the inner two rings correspond to the central zone where overstory trees were harvested.
Significant clustering (95% confidence) of high C. cordiformis density occurred only in the northwestern portions of the forested transition of large gaps (Figure 4). A significant cluster (90% confidence) of low density was also measured in the east-northeast sections of large gaps (Figure 4). We found evidence (90–99% confidence) of significant clustering of high B. alleghaniensis density in the harvested central zone of large gaps and south-southwestern sections of the central zone of medium gaps.
3.4. Sapling density and mean height
Our data provided convincing evidence that gap size and shade tolerance class significantly (p < 0.001) interacted to explain the density of sapling regeneration after nine growing seasons (Model 2; Table 5). Densities of shade tolerant and midtolerant saplings were similar in the harvested central zones of large gaps (p = 0.89) and medium gaps (p = 0.99) but shade tolerant saplings significantly outnumbered (p = 0.0003) midtolerant saplings in the central zones of small gaps (Figure 5A). There was a weak pattern (p = 0.054) to suggest fencing influenced sapling density but pairwise comparisons nonetheless showed that fencing positively influenced midtolerant sapling density with greater densities (p = 0.004) in fenced plots than in unfenced plots (Figure 5B). However, tolerant sapling density was not significantly affected by fencing (p = 0.55), and both shade tolerance classes had similar sapling densities in fenced plots (p > 0.99). Across all gap sizes, there was convincing evidence (p ≤ 0.0001, Table 5) that shade tolerant saplings were significantly (p > 0.001) taller than midtolerants (means of 6.8 m vs. 4.6 m, respectively) after nine growing seasons (Figure 5C). This pattern was consistent whether the plots were fenced or open.
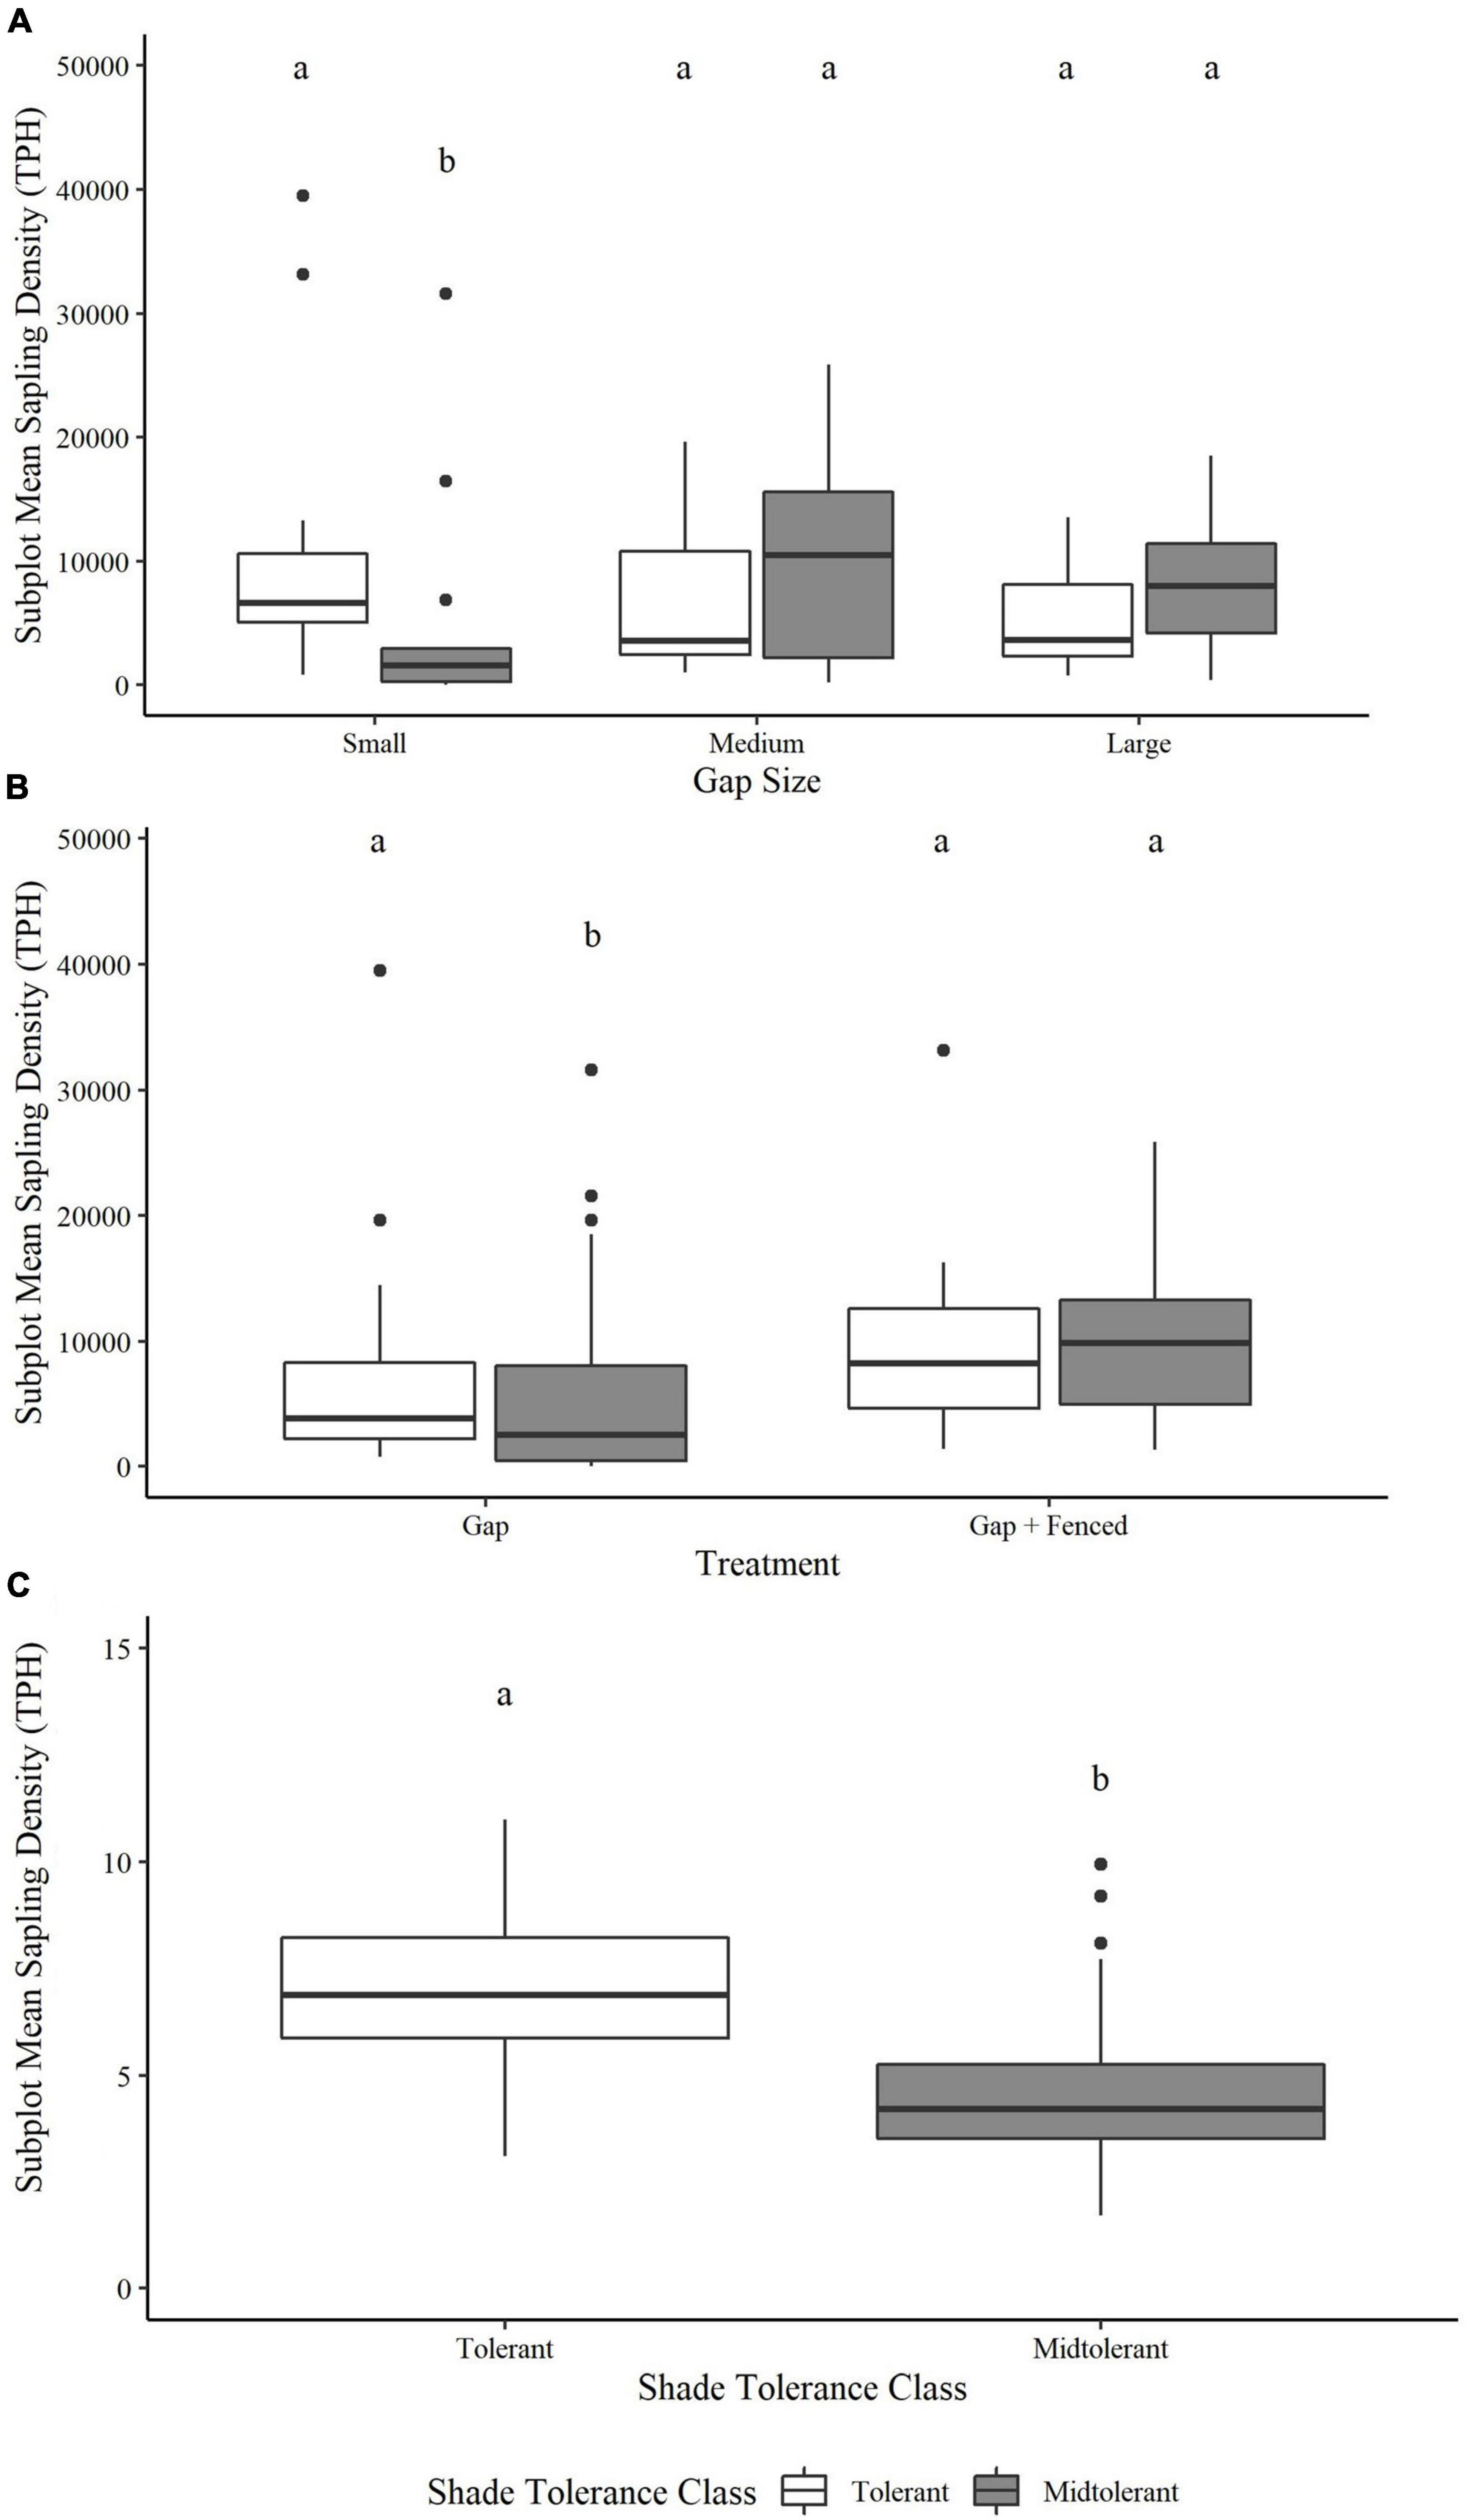
Figure 5. Pairwise comparisons of the (A) subplot/gap size x shade tolerance class interaction and (B) subplot/gap size x shade tolerance class interaction on subplot-level estimated marginal mean sapling density (TPH) and (C) the fixed effect of shade tolerance class on estimated marginal mean sapling height (m). Boxes not connected by the same letter are significantly different at an α = 0.05.
4. Discussion
4.1. Minimum gap size and light intensity for midtolerant species
In our earlier studies, we established that regeneration of midtolerant species is possible in GSH expanded gap areas of at least 200 m2 (Forrester et al., 2014; Sabo et al., 2019). Here, with these 9-year results we demonstrate that midtolerant regeneration is not only possible, but that it indeed can be abundant. After nine growing seasons, the ratio of tolerant saplings to midtolerant saplings was approximately balanced (Figure 5A). Such high representation of midtolerant tree species among regeneration differs greatly from the regeneration outcomes that have been reported in other gap-based silviculture experiments from the LS-NH forests where tolerant regeneration overwhelmingly dominated post-harvest regeneration (Willis et al., 2016; Kern et al., 2017; Knapp et al., 2019a,b,2021; Reuling et al., 2019; Sabo et al., 2019).
We propose that interactions of site quality and pre-treatment overstory diversity were the primary drivers to the relative success of midtolerant species in this experiment. As noted by Knapp et al. (2021), the high competitiveness of A. saccharum on mesic but relatively well drained and less nutrient-rich sites may limit diversity among regeneration. These characteristics describe site conditions and the reported role of A. saccharum on a majority of similar GSH experiments in LS-NH systems. Conversely, mesic, less well drained, and seasonally-perched sites with rich to very-rich nutrient regimes, which describes site condition for this experiment, can be more species rich (Kotar et al., 2002). The pre-harvest stand conditions from this experiment (Table 1) provide some evidence of this, with midtolerant tree species accounting for a higher proportion of pre-treatment overstory basal area and midstory sapling density than reported in most other LS-NH GSH studies. Our 9-year post-treatment results provide further evidence by demonstrating that many species other than A. saccharum have both regenerated and persisted within harvested gaps on this site. Except for T. americana, which accounted for nearly 18% of the overstory basal area prior to our treatments yet was underrepresented among post-treatment regeneration, the species that dominated the overstory prior to harvest were also the most abundant among regeneration. This relationship between pre-and post-treatment diversity underscores the importance of maintaining ecological memory through deliberate management to promote high overstory species diversity (i.e., maintaining seed sources) and forming complex forest structures that increase the germination, regeneration, and recruitment of a variety of species (Willis et al., 2016; Webster et al., 2018), especially on rich to very-rich sites.
We partially attribute the high densities of midtolerant saplings among regeneration in this study to light availability. All three gap sizes received an average of at least 25% of above canopy light levels, which prior studies (Logan, 1965, 1973; Walters et al., 2016) and indeed our own results show is sufficient for the regeneration of many midtolerant tree species within our study area. However, the relative success of midtolerant regeneration in this experiment was heavily influenced by the high densities of midtolerant Fraxinus spp., C. cordiformis, and to a lesser degree B. alleghaniensis, saplings within the medium and large gaps subplots (Table 1). After nine growing seasons, these three species accounted for approximately 40% of total sapling regeneration in the central zones of medium and large gaps. We posit that the high densities of these species was facilitated by the central zones of medium and large gaps averaging 38 and 48% light, respectively, which aligns with the findings from others that approximately 45% light is ideal for seedling development and competitiveness among several midtolerant northern hardwood species including Fraxinus spp. and B. alleghaniensis (Godman and Krefting, 1960; Logan, 1965, 1973; Walters et al., 2016).
Less is known about the light requirements of C. cordiformis, and for that matter the ecology and silvics of Carya spp. in general (Pile Knapp et al., 2021). However, these results are suggestive that C. cordiformis can also develop well when receiving approximately 45% light, although results from Walters et al. (2016) show impressive height growth is possible at even lower light levels. Thus, the medium and large gaps created through GSH in this experiment seemingly created ideal light conditions for the establishment and development of these three midtolerant species, but particularly Fraxinus spp.
While our results related to sapling density provided favorable support for GSH as a silvicultural approach to regenerating midtolerant species on rich to very-rich sites, tolerant saplings were, on average, taller than midtolerant saplings within our gaps after nine growing seasons. This result aligns with other LS-NH studies focused on GSH and is likely due to operational harvest specification norms that do not require felling of small saplings, in our case less than 5 cm dbh, during harvests. Our results suggest that the GSH may have served as a release event for established advance reproduction of shade tolerant species, especially A. saccharum and O. virginiana, which overwhelmingly dominated the pre-treatment midstory strata within our study area (Table 1). Continued monitoring of regeneration in these gaps will be necessary to determine whether midtolerant species ascend to canopy positions given their current height disadvantage. We believe these findings related to height accentuate the importance of additional research on whether implementing stand tending practices, such as pre- or post-harvest control of advance regeneration of tolerant species, in conjunction with GSH, can lead to long-term improvements in the competitiveness an eventual canopy co-dominance of midtolerant tree species.
An important caveat when considering these results is that B. alleghaniensis, T. americana, Q. rubra, and Tsuga canadensis, which likely would have dominated this site prior to extensive logging in the late 1800s to early 1900s (Curtis, 1959), remain underrepresented among the post-treatment regeneration. In fact, GSH seem to have led to an undesired effect of even further reductions of T. americana within the study site, at least within the central zones of gaps. Thus, while gap-based silviculture indeed helped increase representation among midtolerant species, these 9-year results do not provide confidence that these treatments will shift the composition toward similarity to that of remnant old growth forests growing on similar sites. In fact, our results suggest that continued implementation of GSH on such sites may perpetuate the novel, albeit still relatively species-rich compositions currently found in many second-growth LS-NH forests. If shifts to pre-settlement old-growth LS-NH forest compositions are desired, the effects of more intensive silvicultural interventions, such as underplanting desired species and pre- and post-harvest competition control to favor their establishment and development should be explored in future field experiments.
4.2. Implications for the gap partitioning hypothesis
Our light modeling analysis provided convincing evidence that complex light gradients initially formed within, around, and across the three GSH gap sizes created in this even-aged, second-growth northern hardwood stand. Whether assessed at the gap-level, or section-to-section across gap sizes, mean light levels from the harvested central zones provided clear evidence of a positive relationship between gap size and gap light. This relationship, as well as the north-south light gradient almost certainly formed through a combination of shade cast by vegetation surrounding the central zones of gaps and the low solar angle during the growing season at a latitude of 45.6°, similar to earlier studies (Marquis, 1965; Canham et al., 1990; Gendreau-Berthiaume and Kneeshaw, 2009; Prévost and Raymond, 2012; Vilhar et al., 2015). However, our results underscore the finer-scale heterogeneity possible within and between harvest gaps of different sizes. The difference in light ranges within gap central zones spanned from 43% in large gaps to just 14% in small gaps. While much of this is due to the north-south gradient, where differences in mean light between northern and southern sections of the central zones declined from 28 to 26 and just 11% among large, medium, and small gaps, respectively, our results show that an interesting and less-studied east-west gradient also contributed to the light heterogeneity within and between gaps.
When the results of our solar radiation analysis is coupled with previously-summarized meteorological data from this long-term experiment (Stoffel et al., 2010; Schatz et al., 2012), the potential importance of the diurnal variability of light along the east-west gradient becomes clear: Daily average light levels between eastern and western portions of subplots were similar, but when viewed hourly, western portions received more direct sunlight in the morning when temperatures were cooler and relative humidity was higher and eastern portions of the gaps received more direct sunlight in the warmer, less humid afternoon hours (Table 3). Similar trends have been reported by others and attributed to important tree responses, such as net photosynthetic rates and carbon fixation among some northern hardwood species (Canham et al., 1990; Wayne and Bazzaz, 1993; Potter and Croft, 2000; Guo et al., 2001). Thus, this often-unmeasured gradient may provide a meaningful source of heterogeneity in potentially species-rich cover types and appears to have influenced the spatial patterns we measured among mapped midtolerant saplings.
Our ordinations provided preliminary evidence of gap partitioning in that species densities sorted strongly between two axes and varied in their overlap within the ordination space. Based on the silvics of the species considered, Axis 2 appeared to be capturing gradients of light increasing bottom to top, with Axis 1 likely accounting for other environmental factors like soil moisture and temperature, with temperature and dryness increasing from left to right. A. saccharum and O. virginiana densities were highest in the lower light environments, and in mostly similar species space along Axis 1, which based on our solar analysis we speculate were likely cooler, moister environments. Conversely, Sambucus spp. (SARA) densities were high in the highest light environments, followed by B. alleghaniensis and Fraxinus spp. There was variation between the densities of these species along Axis 2, particularly between Fraxinus spp. in what we expect were the warmer, drier environments on the far right of Axis 1, and B. alleghaniensis and Sambucus spp. in more moderate environments. Densities of C. cordiformis were surprisingly well distributed along both axis and overlapped with the most species within the ordination space. This may indicate that this species can persist across a wide range of light and environmental gradients. Again, this is aligned with Walters et al. (2016) whose data shows that C. cordiformis height growth can be similar throughout a range of 10—50% gap light.
Our hot spot analysis reinforced and tested the trends we found in our ordination, although the results of our analysis were strongest among large gaps. The low number of cool spots among our mapped midtolerant species suggests that Fraxinus spp., C. cordiformis, and B. alleghaniensis are generally able to regenerate throughout the gap environment of GSH gaps with D:H ≥ 0.64. However, in large gaps hot spots of Fraxinus spp. and C. cordiformis densities occurred on opposite, eastern-northeastern and western-northwestern sections of the gap environment, respectively, and hot spots of B. alleghaniensis were sparse and restricted to the very center of large gaps. We again attribute these trends to temporal differences in light across the gap environments created by the three gap sizes tested in this experiment (Table 3). Fraxinus spp. appears to be highly competitive in gap positions that receive moderate light levels of approximately 45%, and where most of direct light is received in the warmer and drier afternoon hours. Conversely, C. cordiformis appears to tolerate a very wide range of site conditions but can be highly competitive in western portions of central zones and into adjacent forested matrix which received ample morning sun, but nonetheless retain cooler and moisture growing conditions. B. alleghaniensis appears to be most competitive in the higher end of still moderate light conditions found in the very center of the central zone, but where direct sun occurs mid-day and temperature and moisture conditions are likely in turn more moderate. However, we also speculate that the scarcity of B. alleghaniensis hot spots may also have been impacted by competition from Fraxinus spp. and intolerant Sambucus racemosa, which our collective analyses showed co-occurred in such gap positions, often in high relative densities (Table 1).
It is also possible that differences in seed size, presence, dispersal, and germination methods between our three focal midtolerant tree species influenced the spatial patterns we have reported. Fraxinus spp. can be prolific seeders capable of dispersing seed over 100 m downwind of parent trees (Schlesinger, 1990). Importantly, F. americana and F. pennsylvanica, which formed a majority of the Fraxinus spp. species group in this experiment, seed can bank on the forest floor and remain viable for several years prior to epigeal germination (Kennedy, 1990; Schlesinger, 1990). Thus, high densities of Fraxinus spp. on the eastern side of gaps may be a function of both seed banking on the suitable microsites east of gap center and continued seed rain from overstory Fraxinus spp. westward and upwind of the gaps. Conversely, C. cordiformis seed dissemination is largely gravity driven and the seed does not readily bank prior to hypogeal germination (Smith, 1990). Thus, the hot spotting of C. cordiformis west of gap center may be the result of both suitable microsite for germination of this species and continued seed dissemination from overstory C. cordiformis in the forested transition environment. Put differently, we may not be seeing hot spots of C. cordiformis within in the gaps because seed bearing trees were harvested and there is now little opportunity for new seed to reach within-gap locations. We speculate that the patterns among B. alleghaniensis saplings may have been influenced by both lack of seed source and unsuitable substrate conditions within our gaps. B. alleghaniensis can be a prolific seeder capable of disseminating seed very far from parent trees by wind, particularly when the seed falls on snow packed ground (Gilbert, 1965; Erdmann, 1990). Overstory B. alleghaniensis comprised less than 1.5% of the overstory basal area of the study area prior to harvest (Table 1). As such, the seed source was likely lacking relative to other prolific seeders like A. saccharum and Fraxinus spp. Further, epigeal germination of B. alleghaniensis seed is most successful on exposed mineral soil or downed decaying wood (Gilbert, 1965; Erdmann, 1990). The second-growth even-aged forest where these gaps were harvested largely lacked downed decaying wood or tip-up mounds, and harvesting was conducted in winter over snow-packed ground which limited exposure of bare mineral soil. As such, the limited seed that may have been available on this site likely lacked the appropriate substrate to regenerate. The concentrated high densities of B. alleghaniensis in the center of large gaps may have been a function of that being the microclimate where they were most competitive, and perhaps where harvest activity would have been intensive enough to expose bare mineral soil to enable germination.
4.3. Impacts of deer and other pests and pathogens
We provide only moderate evidence that deer exclusion fencing increased the density of tree regeneration within gaps. However, the threefold improvement in midtolerant sapling densities we measured in gaps where deer had been excluded are meaningful. The result aligns with previously published work from the Flambeau Experiment related to the combined benefits of deer exclusion fencing and GSH on tree species diversity (Sabo et al., 2019) and understory plant diversity (Burton et al., 2021). Additionally, these results align with Jones et al. (2023), who recently reported that the relatively moderate levels of deer browse within the Flambeau Experiment did not significantly influence survival or height growth of A. saccharum and Fraxinus spp., the two most abundant tree species among regeneration in this experiment. Further, Jones et al. (2023) found that browse levels were similar across the gap, forested transition, and the surrounding closed canopy forest matrix locations. Thus, deer browse likely did not heavily influence the spatial patterns we observed among Fraxinus spp. However, we cannot exclude the possibility that preferential browsing influenced the patterns of any of the species we mapped. Even the low levels of browse measured in the Flambeau Experiment gaps, particularly shortly after regeneration when browse levels were highest (Jones et al., 2023), could potentially reduce hot spotting for a moderately to highly palatable species such as Fraxinus spp. or B. alleghaniensis (Hanberry and Abrams, 2019) and shift competitiveness to a species with lower browse preference, such as C. cordiformis. We are unfortunately limited to growing season 10 data among mapped saplings and lack long-term data on species-level browsing patterns from this experiment to further explore these possibilities.
While deer can certainly be a major contributor to unmet regeneration objectives, our collective results reveal some of the other long-term challenges LS-NH forests may face. Since 2010, approximately 84% of the C. cordiformis with dbh > 10 cm on our study site have succumbed to mortality due to an exotic pathogenic fungus (Ceratocystis smalleyi) and hickory bark beetle (Scolytus quadrispinosus) (Bakken et al., 2021). The exotic emerald ash borer (Agrilus planipennis) is also moving toward the site and threatens to dramatically reduce the Fraxinus spp. component. These two species contributed greatly to the relatively successful regeneration outcome we report here. While both tree species are capable of regenerating and persisting in spite of these health issues, both of which tend to have their highest impacts on overstory trees (Klooster et al., 2014; Kashian, 2016; Bakken et al., 2021), continued monitoring of this site will be necessary to see the impact of these pests and pathogens on this forest in the future.
5. Conclusion
Our results show that at a latitude of approximately 45°, creating harvest gaps with D:H ratios between 0.32 and 0.88 can result in complex and often overlapping light gradients. Gaps within this size range can provide sufficient light conditions for the development of competitive regeneration of midtolerant tree species. Regeneration of midtolerant tree species can occur throughout the gap environment of gaps with D:H ratios of at least 0.64. However, there is some evidence that species may achieve higher densities in specific portions of the gap environment relative to others, particularly in gaps D:H ratios of approximately 0.88. Thus, it is possible to regenerate mixtures of both shade tolerant and midtolerant tree species through GSH approaches that result in gaps with D:H ratios between 0.32 and 0.88, but there may be differential segregation of species along environmental gradients, even within the same shade tolerance class. This may be particularly true when such harvest gaps are created in mature, even-aged, forests with high overstory species diversity growing on high quality sites.
The regeneration achieved through this implementation of GSH consisted of a mixture of new regenerants and released advanced reproduction, largely dominated by species that were relatively abundant within the stand prior to harvest. Importantly, released advance reproduction maintained a height advantage over other regeneration sources after nearly a decade on this site, and we would expect that this may also occur elsewhere, especially among shade tolerant tree species. Managers would thus benefit from research focused on whether targeted silvicultural treatments, such as pre-harvest midstory control or post-harvest release, can be used to manipulate species composition through improving the competitiveness of the potentially abundant midtolerant regeneration.
The better forest managers understand differential competitive abilities across resource gradients among the local tree species pools, the more forest management can be tailored to meet complex objectives like increasing and maintaining diverse compositions and structures for a more resilient future forest. The results of this experiment show that gap size, composition and structure of the forest, site quality, and harvest specifications must all be considered prior to implementation of GSH if the objective is regenerating specific species, mixtures of species, or even broad shade tolerance classes. However, deer and invasive pests and pathogens are and will continue to alter regeneration dynamics in these hardwood forests. Continued monitoring, acceptance of uncertainty, and creative adaptive management will likely be essential to sustainable management of LS-NH forests.
Data availability statement
The raw data supporting the conclusions of this article will be made available by the authors, without due reservation.
Author contributions
DS collected the 2018 field data, conducted the density, height, solar radiation and spatial analyses, and prepared this manuscript. JF contributed the 2016 sapling inventory, meteorological data, the multivariate analyses, and wrote this manuscript. AS assisted with the solar radiation and spatial analyses, and provided edits to this manuscript. CL and DM conceptualized the Flambeau Experiment and contributed edits during the preparation of this manuscript. All authors contributed to the article and approved the submitted version.
Funding
This research was supported by the Renewable Energy, Natural Resources, and Environment: Agroecosystem Management from the USDA National Institute of Food and Agriculture (Grant No. 2015-08649), Previous Support: National Research Initiative of the USDA CSREES (Grant No. 2006-55101-17060), and WI DNR Division of Forestry and Bureau of Integrated Science Services.
Acknowledgments
We thank Kelsey Bakken, Dr. Autumn Sabo, Blake Newton, Harrison Brown, and the Flambeau River State Forest staff, especially Heidi Brunkow, for their assistance in the field during various phases of this experiment. We also thank J. Burton, S. T. Gower, and the many other researchers who worked on The Flambeau Experiment and whose research helped influence this experiment. We appreciate thoughtful comments from two reviewers.
Conflict of interest
The authors declare that the research was conducted in the absence of any commercial or financial relationships that could be construed as a potential conflict of interest.
Publisher’s note
All claims expressed in this article are solely those of the authors and do not necessarily represent those of their affiliated organizations, or those of the publisher, the editors and the reviewers. Any product that may be evaluated in this article, or claim that may be made by its manufacturer, is not guaranteed or endorsed by the publisher.
Footnotes
References
Ashton, M. S., and Kelty, M. J. (2017). The Practice of Silviculture: Applied Forest Ecology, 10th Edn. Hoboken, NJ: Wiley.
Bakken, K. A., Forrester, J. A., Mladenoff, D. J., Leggett, Z., Juzwik, J., and Jetton, R. M. (2021). Mortality patterns following a hickory decline event – is density reduction key to maintaining bitternut hickory? For. Ecol. Manag. 485:118956. doi: 10.1016/j.foreco.2021.118956
Bechtold, S., and Höfle, B. (2020). VOSTOK - the Voxel Octree Solar Toolkit.” heiDATA, V1. Available online at: https://doi.org/10.11588/data/QNA02B (accessed April 23, 2021).
Breiman, L., Friedman, J. H., Olshen, R. A., and Stone, C. J. (1984). Classification and Regression Trees. Wadsworth: CRC Press.
Brooks, M. E., Kristensen, K., van Benthem, K. J., Magnusson, A., Berg, C. W., Nielsen, A., et al. (2017). GlmmTMB balances speed and flexibility among packages for zero-inflated generalized linear mixed modeling. R J. 9, 378–400. doi: 10.32614/RJ-2017-066
Burton, J. I., Mladenoff, D. J., Forrester, J. A., and Clayton, M. K. (2021). Effects of forest canopy gaps on the ground-layer plant community depend on deer: evidence from a controlled experiment. J. Veg. Sci. 32:e12969. doi: 10.1111/jvs.12969
Caldas, de Castro, M., and Singer, B. H. (2006). Controlling the false discovery rate: a new application to account for multiple and dependent test in local statistics of spatial association. Geogr. Anal. 38, 180–208. doi: 10.1111/j.0016-7363.2006.00682.x
Canham, C. D., Denslow, J. S., Platt, W. J., Runkle, J. R., Spies, T. A., and White, P. S. (1990). Light regimes beneath closed canopies and tree-fall gaps in temperate and tropical forests. Can. J. For. Res. 20, 620–631. doi: 10.1139/x90-084
Curtis, J. T. (1959). The Vegetation of Wisconsin: an Ordination of Plant Communities. Madison, WI: University of Wisconsin press.
Denslow, J. S. (1980). Gap partitioning among tropical rainforest trees. Biotropica 12, 47–55. doi: 10.2307/2388156
Erdmann, G. G. (1990). “Betula alleghaniensis britton. yellow birch,” in Silvics of North America. Vol. 2: Hardwoods, eds R. M. Burns and B. H. Honkala (Washington, DC: USDA Forest Service).
Forrester, J. A., Lorimer, C. G., Dyer, J. H., Gower, S. T., and Mladenoff, D. M. (2014). Response of tree regeneration to experimental gap creation and deer herbivory in north temperate forests. For. Ecol. Manag. 329, 137–147. doi: 10.1016/j.foreco.2014.06.025
Franklin, J. F., Johnson, K. N., and Johnson, D. L. (2018). Ecological Forest Management. Long Grove, IL: Waveland Press.
Frelich, L. E., and Lorimer, C. G. (1991). Natural disturbance regimes in hemlock-hardwood forests of the upper great lakes region. Ecol. Monogr. 61, 145–164. doi: 10.2307/1943005
Gendreau-Berthiaume, B., and Kneeshaw, D. (2009). Influence of gap size and position within gaps on light levels. Int. J. For. Res. 2009. doi: 10.1155/2009/581412
Getis, A., and Ord, J. K. (1992). The analysis of spatial association by use of distance statistics. Geogr. Anal. 24, 189–206. doi: 10.1111/j.1538-4632.1992.tb00261.x
Gilbert, A. M. (1965). “Yellow Birch (Betula alleghaniensis Britton),” in Silvics of forest trees of the United States, ed. Fowells, H. A. Washington, DC: U.S. Department of Agriculture.
Godman, R. M., and Krefting, L. W. (1960). Factors important to yellow birch establishment in upper michigan. Ecology 41, 18–28. doi: 10.2307/1931935
Goodburn, J. M. (1996). Comparison of Forest Habitat Structure and Composition in Old-Growth and Managed Northern Hardwoods in Wisconsin and Michigan. Madison, WI: University of Wisconsin.
Gray, A. N., and Spies, T. A. (1996). Gap size, within-gap position and canopy structure effects on conifer seedling establishment. J. Ecol. 84, 635. doi: 10.2307/2261327
Guo, Y., Shelton, M. G., and Lockhart, B. R. (2001). Effects of light regimes on the growth of cherrybark oak seedlings. For. Sci. 47, 270–277.
Halpin, C. R., Lorimer, C. G., Hanson, J. J., and Palik, B. J. (2017). Predicted long-term effects of group selection on species composition and stand structure in northern hardwood forests. For. Ecol. Manag. 400, 677–691. doi: 10.1016/j.foreco.2017.06.037
Hanberry, B. B., and Abrams, M. D. (2019). Does white-tailed deer density affect tree stocking in forests of the Eastern United States? Ecol. Process. 8:30. doi: 10.1186/s13717-019-0185-5
Hartig, F. (2021). DHARMa: Residual Diagnostics for Hierarchical (Multi-Level/Mixed) Regression Models. Available online at: http://florianhartig.github.io/DHARMa/ (accessed May 1, 2021).
Hood, S. M., Zedaker, S. M., Aust, W. M., and Smith, D. W. (2002). Universal soil loss equation (USLE)-predicted soil loss for harvesting regimes in appalachian hardwoods. Northen J. Appl. For. 19, 53–58. doi: 10.1093/njaf/19.2.53
Hopkins, B., and Skellam, J. G. (1954). A new method of determining the type of distribution of plant individuals. Ann. Bot. 18, 213–227. doi: 10.1093/oxfordjournals.aob.a083391
Jones, P. D., Sabo, A. E., Forrester, J. A., Mladenoff, D. J., and McDill, M. E. (2023). Northern hardwoods seedling respond to a complex of environmental factors when deer herbivory is limited. For. Ecol. Manag. 527:120600. doi: 10.1016/j.foreco.2022.120600
Kashian, D. M. (2016). Sprouting and seed production may promote persistence of green ash in the presence of the emerald ash borer. Ecosphere 7: e01332. doi: 10.1002/ecs2.1332
Kennedy, H. E. (1990). “Fraxinus pennsylvanica marsh. green ash,” in Silvics of North America. Vol. 2: Hardwoods, eds R. M. Burns and B. H. Honkala (Washington, DC: USDA Forest Service).
Kern, C. C., Burton, J. I., Raymond, P., D’Amato, A. W., Keeton, W. S., Royo, A. A., et al. (2017). Challenges facing gap-based silviculture and possible solutions for Mesic Northern forests in North America. Forestry 90, 4–17. doi: 10.1093/forestry/cpw024
Klooster, W. S., Herms, D. A., Knight, K. S., Herms, C. P., McCullough, D. G., Smith, A., et al. (2014). Ash (Fraxinus Spp.) mortality, regeneration, and seed bank dynamics in mixed hardwood forests following invasion by Emerald Ash Borer (Agrilus Planipennis). Biol. Invasions 16, 859–873. doi: 10.1007/s10530-013-0543-7
Knapp, S. P., Kern, C. C., and Webster, C. R. (2021). Harvested opening size affects cohort development and failures in a second-growth northern hardwood forest. For. Ecol. Manag. 482:118804. doi: 10.1016/j.foreco.2020.118804
Knapp, S. P., Webster, C. R., and Kern, C. C. (2019a). Can group selection with legacy retention change compositional trajectories in conventionally managed hardwoods? For. Ecol. Manag. 448, 174–186. doi: 10.1016/j.foreco.2019.06.005
Knapp, S. P., Webster, C. R., and Kern, C. C. (2019b). The composition and height of saplings capturing silvicultural gaps at two long-term experiments in managed Northern hardwood forests. Forests 10:855. doi: 10.3390/f10100855
Kotar, J., Burger, T., and Kovach, J. A. (2002). A Guide to Forest Communities and Habitat Types of Northern Wisconsin, 2nd Edn. Madison, WI: University of Wisconsin-Madison.
Langsrud, Ø (2003). ANOVA for unbalanced data: use type II instead. Stat. Comput. 1969, 163–167. doi: 10.1023/A:1023260610025
Leak, W. B. (1999). Species composition and structure of a northern hardwood stand after 61 years of group/patch selection. Northen. J. Appl. For. 16, 151–153. doi: 10.1093/njaf/16.3.151
Length, R. (2021). Emmeans: Estimated marginal means, Aks least-square means. R package version 1.6.0. Available online at: https://CRAN.R-project.org/package=emmeans (accessed May 1, 2021).
Logan, K. T. (1965). Growth of Tree Seedlings as Affected by Light Intensity. Part I: White Birch, Yellow Birch, Sugar Maple and Silver Maple. Ottowa, ON: Department of Forestry Publication.
Logan, K. T. (1973). Growth of Tree Seedlings as Affected by Light Intensity. Part V: White Ash, Beech, Eastern Hemlock, and General Conclusions. Ottowa, ON: Department of the Environment, Canadian Forestry Service.
Lu, D., Wang, G. G., Yan, O., Gao, T., and Zhu, J. (2018). Effects of gap size and within-gap position on seedling growth and biomass allocation: is the gap partitioning hypothesis applicable to the temperate secondary forest ecosystems in Northeast China? For. Ecol. Manag. 429, 351–362. doi: 10.1016/j.foreco.2018.07.031
Lu, D., Zhu, J., Wang, X., Hao, G., and Wang, G. G. (2021). A systematic evaluation of gap size and within-gap position effects on seedling regeneration in a temperate secondary forest. Northeast China. For. Ecol. Manag. 490:119140. doi: 10.1016/j.foreco.2021.119140
Marquis, D. A. (1965). Controlling Light in Small Clearcuttings. Res. Pap. NE-39. Upper Darby, PA: U. S. Department of Agriculture, Forest Service.
Martin, M., Woodbury, D., Glogower, Y., Duguid, M., Frey, B., and Ashton, M. (2021). Within-gap position shapes fifty years of forest dynamics in a temperate hardwood forest in connecticut. USA. For. Ecol. Manag. 494:119311. doi: 10.1016/j.foreco.2021.119311
McCune, B., and Mefford, M. J. (2016). PC-ORD, Multivariate Analysis of Ecological Data, Version 7 for Windows Edition. Oregon: MjM Software Design.
Miller, G. W., Schuler, T. M., and Smith, H. C. (1995). Method for Applying Group Selection in Central Appalachian Hardwoods Res. Pap. NE-696. Radnor, PA: US. Department of Agriculture, Forest Service. doi: 10.2737/NE-RP-696
Niinemets, Ü, and Valladares, F. (2006). Tolerance to shade, drought, and waterlogging of temperate northern hemisphere trees and shrubs. Ecol. Monogr. 76, 521–547. doi: 10.1890/0012-9615(2006)076[0521:TTSDAW]2.0.CO;2
Ord, J. K., and Getis, A. (1995). Local spatial autocorrelation statistics: distributional issues and an application. Geogr. Anal. 27, 286–306. doi: 10.1111/j.1538-4632.1995.tb00912.x
Palik, B. J., D’Amato, A. W., Franklin, J. F., and Johnson, K. N. (2020). Ecological Silviculture: Foundations and Applications. Long Grove: Waveland Press.
Pile Knapp, L. S., Snell, R., Vickers, L. A., Hutchinson, T., Kabrick, J., Jenkins, M. A., et al. (2021). The ‘other’ hardwood: growth, physiology, and dynamics of hickories in the central hardwood region, USA. For. Ecol. Manag. 497:119513. doi: 10.1016/j.foreco.2021.119513
Potter, B. E., and Croft, P. J. (2000). “Spatial variation in growing season heat sums within northern hardwood forest canopy gaps,” in Proceedings of the Second Symposium on Environmental Applications, (Boston, MA: American Meterological Society).
Poznanovic, S. K., Poznanovic, A. J., Webster, C. R., and Bump, J. K. (2014). Spatial patterning of underrepresented tree species in canopy gaps 9 years after group selection cutting. For. Ecol. Manag. 331, 1–11. doi: 10.1016/j.foreco.2014.06.029
Prévost, M., and Raymond, P. (2012). Effect of gap size, aspect and slope on available light and soil temperature after patch-selection cutting in yellow birch-conifer stands, Quebec, Canada. For. Ecol. Manag. 274, 210–221. doi: 10.1016/j.foreco.2012.02.020
R Core Team (2020). R: A language and environment for statistical computing. Vienna: R Foundation for Statistical Computing. Available online at: https://www.R-project.org/
Raudenbush, S. W., Yang, M. L., and Yosef, M. (2000). Maximum likelihood for generalized linear models with nested random effects via high-order, multivariate laplace approximation. J. Comput. Graph. Stat. 9, 141–157. doi: 10.1080/10618600.2000.10474870
Reuling, L. F., D’amato, A. W., Palik, B. J., Martin, K. J., and Fassnacht, D. S. A. (2019). Initial tree regeneration response to natural-disturbance-based silviculture in second-growth northern hardwood forests. Can. J. For. Res. 49, 628–639. doi: 10.1139/cjfr-2018-0406
Rhemtulla, J. M., Mladenoff, D. J., and Clayton, M. K. (2009). Legacies of historical land use on regional forest composition and structure in Wisconsin, USA (Mid-1800s-1930s-2000s). Ecol. Appl. 19, 1061–1078. doi: 10.1890/08-1453.1
Ricklefs, R. E. (1977). Environmental heterogeneity and plant species diversity: a hypothesis. Am. Nat. 111, 376–381. doi: 10.1086/283169
Runkle, J. R. (1981). Gap regeneration in some old-growth forests of the Eastern United States. Ecology 62, 1041–1051. doi: 10.2307/1937003
Sabo, A. E., Forrester, J. A., Burton, J. I., Jones, P. D., Mladenoff, D. J., and Kruger, E. L. (2019). Ungulate exclusion accentuates increases in woody species richness and abundance with canopy gap creation in a temperate hardwood forest. For. Ecol. Manag. 433, 386–395. doi: 10.1016/j.foreco.2018.11.004
Schatz, J. D., Forrester, J. A., and Mladenoff, D. J. (2012). Spatial patterns of soil surface C flux in experimental canopy gaps. Ecosystems 15, 616–623. doi: 10.1007/s10021-012-9535-1
Schlesinger, R. C. (1990). “Fraxinus americana L. white ash,” in Silvics of North America. Vol. 2: Hardwoods, eds R. M. Burns and B. H. Honkala (Washington, DC: USDA Forest Service).
Schulte, L. A., Mladenoff, D. J., Crow, T. R., Merrick, L. C., and Cleland, D. T. (2007). Homogenization of Northern U.S. Great Lakes Forests Due to Land Use. Landsc. Ecol. 22, 1089–1103. doi: 10.1007/s10980-007-9095-5
Shaffer, R. M., Brummel, K. R., Reisinger, T. W., and Stokes, B. J. (1993). Impact of Group Selection Silviculture on Timber Harvesting Productivity and Cost in Appalachian Hardwood Timber Stands. Northen. J. Appl. For. 10, 170–174. doi: 10.1093/njaf/10.4.170
Sipe, T. W., and Bazzaz, F. A. (1994). Gap Partitioning among Maples (Acer) in Central New England: Shoot Architecture and Photosynthesis. Ecology 75, 2318–2332. doi: 10.2307/1940887
Sipe, T. W., and Bazzaz, F. A. (1995). Gap Partitioning Among Maples (Acer) in Central New England: Survival and Growth. Ecology 76, 1587–1602. doi: 10.2307/1938160
Smith, H. C. (1990). “Carya cordiformis (Wangenh.) K. Koch. Bitternut Hickory,” in Silvics of North America. Vol. 2: Hardwoods, eds R. M. Burns and B. H. Honkala (Washington, DC: USDA Forest Service).
Stoffel, J. L., Gower, S. T., Forrester, J. A., and Mladenoff, D. J. (2010). Effects of winter selective tree harvest on soil microclimate and surface CO2 flux of a northern hardwood forest. For. Ecol. Manag. 259, 257–265. doi: 10.1016/j.foreco.2009.10.004
van Buuren, S. V., and Groothuis-Oudshoorn, K. (2011). Mice: multivariate imputation by chained equations in R. J. Stat. Soft. 45, 1–67. doi: 10.18637/jss.v045.i03
Vilhar, U., Roženbergar, D., Simončič, P., and Diaci, J. (2015). Variation in irradiance, soil features and regeneration patterns in experimental forest canopy gaps. Ann. For. Sci. 72, 253–266. doi: 10.1007/s13595-014-0424-y
Walters, M. B., Farisoni, E. J., Willis, J. L., and Gottschalk, K. W. (2016). Managing for diversity: harvest gap size drives complex light, vegetation, and deer herbivory impacts on tree seedlings. Ecosphere 7:e01397. doi: 10.1002/ecs2.1397
Wayne, P. M., and Bazzaz, F. A. (1993). Morning vs afternoon sun patches in experimental forest gaps: consequences of temporal incongruency of resources to birch regeneration. Oecologia 94, 235–243. doi: 10.1007/BF00341322
Webster, C. R., Dickinson, Y. L., Burton, J. I., Frelich, L. E., Jenkins, M. A., Kern, C. C., et al. (2018). Promoting and maintaining diversity in contemporary hardwood forests: confronting contemporary drivers of change and the loss of ecological memory. For. Ecol. Manag. 421, 98–108. doi: 10.1016/j.foreco.2018.01.010
Webster, C. R., and Lorimer, C. G. (2005). Minimum opening sizes for canopy recruitment of midtolerant tree species: a retrospective approach. Ecol. Appl. 15, 1245–1262. doi: 10.1890/04-0763
Willis, J. L., Walters, M. B., and Farinosi, E. (2016). Local seed source availability limits young seedling populations for some species more than other factors in North Hardwood forests. For. Sci. 64, 440–448. doi: 10.5849/forsci.15-143
Keywords: group selection, gap partitioning hypothesis, gap, regeneration, solar radiation, northern hardwood
Citation: Schnake DK, Forrester JA, Sánchez Meador AJ, Mladenoff DJ and Lorimer CG (2023) Tree regeneration and spatial patterning among midtolerant tree species following gap-based harvesting in a temperate hardwood forest. Front. For. Glob. Change 6:1144091. doi: 10.3389/ffgc.2023.1144091
Received: 13 January 2023; Accepted: 15 March 2023;
Published: 30 March 2023.
Edited by:
Ana Cristina Gonçalves, University of Évora, PortugalReviewed by:
Matthew Olson, Stockton University, United StatesMike Walters, Michigan State University, United States
Copyright © 2023 Schnake, Forrester, Sánchez Meador, Mladenoff and Lorimer. This is an open-access article distributed under the terms of the Creative Commons Attribution License (CC BY). The use, distribution or reproduction in other forums is permitted, provided the original author(s) and the copyright owner(s) are credited and that the original publication in this journal is cited, in accordance with accepted academic practice. No use, distribution or reproduction is permitted which does not comply with these terms.
*Correspondence: David K. Schnake, ZGtzY2huYWtAbmNzdS5lZHU=