 Muhammad Yaseen1,2
 Waseem Razzaq Khan3*
 Saraj Bahadur1,2Farwa Batool1,2Farhan Khalid4Umair Ahmed5Maria Ashraf6,7
- 1Wuzhishan National Long-Term Forest Ecosystem Monitoring Research Station, College of Forestry, Hainan University, Haikou, China
- 2Hainan Key Laboratory for Sustainable Utilization of Tropical Bioresource, College of Forestry, Hainan University, Haikou, China
- 3Department of Forestry Science, Faculty of Agricultural and Forestry Sciences, Universiti Putra Malaysia Kampus Bintulu Sarawak Jalan Nyabau, Bintulu, Sarawak, Malaysia
- 4Faculty of Agriculture and Environment, The Islamia University of Bahawalpur, Bahawalpur, Pakistan
- 5College of Horticulture and Forestry Sciences, Huazhong Agriculture University, Wuhan, China
- 6Key Laboratory of Agroforestry Environmental Process and Ecological Regulation of Hainan Province, Hainan University, Haikou, China
- 7College of Ecology and Environment, Hainan University, Haikou, China
In the context of tropical monsoonal dwarf forest restoration, it is well known that the interaction between soil properties and plant functional traits influences the dynamics and forest composition of plant communities. The main aim of this study was to determine the relationships and variations between the plant functional traits and environmental variables in tropical coastal secondary forests. However, it is undisputed whether trait variation is coordinated and whether there is a relationship between the community-weighted mean (CWM) traits and soil variables. TNNR conducted a ground survey to collect actual ground data on the biophysical characteristics of individual trees and shrubs, along with soil sample data. All soil samples and plant materials were collected at the end of June, in the 2020 growing season (July and August), in each quadrat with a 400-m2 area. To gain insight into these questions, a total of 4 plant functional traits of 167 species and 5 soil nutrients from 128 soil samples were analyzed from 128 plots in a tropical evergreen monsoon forest on Hainan Island. Using SMA (standardized major axis), wood density (WD), and leaf thickness (LT), as well as specific leaf area (SLA) and relative leaf water content (RLWC), were significantly positively correlated. Using Pearson correlation analysis, leaf thickness (LT) was significantly positively correlated with soil organic matter (OM). Using principal component analysis (PCA), we also found that soil TN and OM were the strongest predictors for functional traits, i.e., WD and LT. Moreover, using path analysis, OM and TN have a major impact on plant CWM traits, e.g., SLA and RLWC. Our results show a significant relationship between functional traits and soil pH and soil nutrients in tropical coastal secondary forests. Our results highlight that plant traits can be used to predict specific soil nutrients and ecosystem functioning in tropical secondary forests, but we are concerned about how variation in the physical structure of plant affect ecosystem function in forest communities. This research can help us to better understand the restoration of habitats and green infrastructure design, suggesting that selecting different species across multiple trait axes can help ensure functionality at the maximum level.
Introduction
Analysis of plant functional traits is becoming a more and more useful ecological approach for understanding plant community assembly (Funk et al., 2017). Plant functional traits are increasingly recognized as a powerful framework for understanding shifts in species distribution and responses to environmental change (Funk et al., 2017; Costa et al., 2018; Griffin-Nolan et al., 2018), and this could provide a powerful framework to generate insights into how simultaneous changes in drought and nutrient availability differentially impact coexisting dryland species. For example, a rapid or slow strategy needs the same sets of leaf, root, and stem features regardless of whether the main limiting factor is light, N, P, water, or temperature due to the small number of coupled resources in plant economics (Reich, 2014). Rather, certain species have characteristics that relate to their ability to store resources in protected tissues, which is referred to as a conservation strategy (Reich, 2014). It is demonstrated in the experimental data that abiotic stress factors, i.e., due to less availability of nutrients and light (Lohbeck et al., 2015), the plant functional traits and plant species composition can change, leading to changes from an acquisitive strategy to a conservative strategy (Raevel et al., 2012). In this way, changes in leaf functional traits (LFTs) may reflect changes in the environment, such as light and soil property variations (Reich, 2014). Hodgson et al. (2011) revealed that specific leaf area (SLA), a key component of the worldwide leaf economic spectrum, is the preferred soft (morphological) plant trait for assessing soil fertility. At present, the intraspecific variation at a community level has been consistently reported, but its consequences have not been completely explored (Siefert, 2014).
Recently, empirical studies have quantified the relative amount of intraspecific trait variation (ITV) compared to interspecific variation for various plant functional traits and communities (e.g., Messier et al., 2010; Auger and Shipley, 2013). Therefore, quantifying intraspecific trait variability as well as interspecific variability is important for understanding niche segregation and species distribution at the regional level.
Differences in forest composition, i.e., age, size, and spatial arrangement within a forest stand, have been influenced by the distribution of environmental factors such as soil nutrients and soil pH (Spence et al., 2008). Plant functional traits (PFTs) aggregate features of individual plants with similar activities in an ecosystem and similar responses to external factors such as water and nutrient availability based on a finite number of static parameters (Kattge et al., 2011). The relationships among traits, resources, and biodiversity are supported by parallel gradients in species abundances and traits (i.e., fast–slow variation) with respect to soil nutrients, e.g., phosphorus (P) gradients. For example, with limited resources of soil P in Western Australia, plants with slow functional traits compete a little with each other, resulting in high diversity (Lambers et al., 2013), like the less availability of soil nitrogen (N) in temperate grasslands (Clark and Tilman, 2008). Increased plant diversity due to reduced soil fertility most likely reflects global patterns (Laliberté et al., 2013). For example, several long-term soil chrono sequences around the world have shown that local plant species richness increases with soil age. This is associated with low P in older soils (Laliberté et al., 2013). These patterns raise the possibility that P limitation itself promotes plant species coexistence (Olde Venterink, 2011). This may be related to the fact that soil phosphorus exists in many chemical forms and several different phosphorus uptake strategies can target specific forms (Lambers et al., 2006, 2008). Soil P gradients related to soil substrate type or age are important with respect to economic plant attributes, whether the gradients are landscape or regional (Lambers et al., 2013). Despite these identified patterns, very little research has been done about the relationship between plant functional traits and soil properties under specific climatic conditions.
Aboveground and belowground feature variability can be incorporated into dynamic global vegetation models (DGVMs) in several ways. One approach is to vary parameters within the PFT as a function of environment variables. One such approach has the rationale that community mean trait values (or PFTs) are selected by environmental conditions, thereby triggering trait convergence. This environmental selection may influence functional leaf traits by climate (Wright et al., 2005), soil fertility (Ordoñez et al., 2009), or a combination thereof (e.g., van Ommen Kloeke et al., 2012). The incorporation of empirical feature–environment relationships into the JSBACH DGVM, part of the Max Planck Institute Earth System Model (MPI-ESM), suggests a large impact of feature variability on vegetation and carbon dynamics in the present climate (Verheijen et al., 2013). The second approach is to use trait variability to predict survival of the fittest trait combinations for a range of environmental variables using tradeoffs between traits and evolutionary rules (Langan et al., 2017). It is documented in a few studies about how plant functional traits respond to environmental variables, e.g., soil pH, and nutrients, such as N and P in soil, play an important role, all of which influence plant functional traits (Pan et al., 2018). On the other hand, the leaf morphological properties, i.e., leaf thickness (LT), leaf area (LA), specific leaf area (SLA), and leaf dry matter content (LDMC) are functional traits that can be easily measured to designate the resource strategies and adaptive traits of a plant in relation to its environment (Vendramini et al., 2002). It is therefore important to realize how functional traits express plant strategies when changes occur in plant functional traits due to the effect of soil nutrients. To identify factors related to alterations in community functional traits, it is also necessary to determine the relationship between the functional traits of plants and surrounding environmental conditions (Reich et al., 2003). Therefore, experimental projects that aim to better understand the relationships between plant functional traits and soil properties in natural forest communities are needed (Wardle, 2016). These linkages may support identifying the factors that influence changes in plant functional traits and the composition of tropical forest communities. The significant intraspecific variation at the local level and environmental variation at the larger level have been consistently reported; nonetheless, their significance is still under investigation (Siefert et al., 2015).
A comparative study of plant functional trait (PFTs) dynamics in species provides one basis for the identification of life history strategies (Adler et al., 2014) and parameterization of dynamic vegetation models (Atkin et al., 2015). Some leaves, trees, and seed characteristics are thought to indicate that the plant receives resources, reproduces, and competes with other plants (Westoby et al., 2002). While there is a wide variety of variables that determine fundamental strategies worldwide, recent research has shown that at the local scale, this relationship will be weak (Messier et al., 2017), and the intraspecific relationship differing between sites characterized by different species and/or growing conditions (Lira-Martins et al., 2019) or within the species (Anderegg et al., 2018). This means that a general equation for estimating one of the other parameters will not affect multiple measurements. The change in productivity may be related to the type of harvest as well as the environmental conditions in which individuals grow (Garnier et al., 2016). Geographic gradients, where a group of species is repeatedly found in different conditions, provide a natural laboratory for investigating the relative impact of taxonomic and environmental plasticity on differences (Turnbull et al., 2016). Hence, to fill this gap, the main objective of our study was to examine the linkages and changes between selected functional traits and soil abiotic properties in tropical coastal secondary forests. Hainan Island, off the northeastern coast of China, is known for its tropical coastline forests. The changes in leaf functional traits (LFTs) may reflect environmental variations such as light and soil property variations (Reich, 2014). One of the characteristics of tropical monsoonal cloud forest (TMCF) is the persistent existence of haze or low clouds, resulting in waterlogging on plants (Bruijnzeel and Veneklaas, 1998), less solar radiation, and lower soil temperatures compared to tropical rain forests (Vitousek and Sanford, 1986). However, the tropical monsoonal dwarf forests of TNNR have been severely affected by human disturbances, i.e., shifting cultivation and slash and burn, and natural catastrophe such as typhoons (Long et al., 2018). Tongguling National Nature Reserve (TNNR) in Wenchang County, Hainan Province, is surrounded on three sides by the sea (Si tu, 1987). It has lateritic soil (Long et al., 2012). Only a few similar ecosystems exist in the TNNR monsoonal evergreen forest, which is the natural forest vegetation in southern China (Wu, 1995). Therefore, the most important issues in this county are natural environmental monitoring, biodiversity conservation, and typhoon mitigation (Long et al., 2018). At present, the tropical secondary forests have been restored. Therefore, our research was on productive or rich species in tropical coastal secondary forests in a TNNR region with an attempt to answer the following questions: (a) Are plant functional traits linked to soil nutrients, and which nutrients contribute most to community assembly? (b) Are variations in plant functional traits distinctly affected by soil properties in the forest community? We predicted that plant morphological traits related to soil nutrients would show consistent relationships in tropical forest community. Second, we expected that plant functional traits and soil properties (i.e., using community-weighted mean (CWM) trait values) would predict ecosystem processes.
Materials and methods
Study site
The current survey was conducted in 2020 in TNNR, located in the northeastern part of Hainan Island in southern China (19°36′19°41′ N 110°58′111°03′ E). TNNR is a 44-square-kilometer nature reserve with an elevation of 338 m.a.s.l. above sea level. It has a tropical monsoon climate. From May until October is the wet season and from November until April is the dry season. The average annual temperature is 23.9°C and the precipitation is 1,721.6 mm. The tropical evergreen monsoonal forest possesses a lateritic soil type (Long et al., 2012). The predominant forest type in TNNR is tropical evergreen monsoonal forest, which covers the total area. Before the year 1980, all these forests had been logged and altered into shrublands, grassland, or second-growth forests. Deforestation was restricted once the TNNR was established in 1983, and forests have been well-recovered (Long et al., 2018).
Plant sampling
In the area of TNNR, tropical evergreen monsoonal forest, we randomly established nine 50 × 50 m (2,500 m2) plots. To precisely measure tree coordinates, 128 plots were divided into 20 × 20-m quadrates and any two plots were always separated by more than 50 m. TNNR conducted a ground survey to collect actual ground data on the biophysical characteristics of individual trees and shrubs, along with soil sample data. The Flora of the Republic of China helped identify the species (Editorial Committee of Flora of China) (Wu, 1995). We collected all soil samples and plant material at the end of June, in the 2020 growing season (July and August), in each quadrat with a 400-m2 area.
However, we conducted our study at the plot level in a vegetation community with the same type of topography and climatic condition, i.e., the inclination of gradient, parental substances, and aspects.
Soil sampling and analysis
During the rainy season in July 2020, soil samples were collected from the top 0–20 cm of the mineral soil in the center of each quadrat in a total of 128 20 × 20 m (400 m2) plots. The nutrients and transformation fluxes were calculated using a compound sample made up of these samples (described in a later section). During the growing season (July and August), a total of 128 soil samples were taken in TNNR.
Soil pH, organic matter (OM), total nitrogen (TN), total phosphorus (TP), and soil water content (SWC) were all tested during the wet season. Five soil profiles were randomly selected from each 20 × 20-m (400 m2) plot, and samples were taken from each plot. Then, for each profile, the grass layer above the soil was removed, and a sample from the soil surface specimen (0–20 cm) was collected (Jobbagy and Jackson, 2001). The soil sample was mixed well, air-dried, and then milled into a fine powder. The samples were then manually screened and examined (Anderson and Ingram, 1989).
For the analysis of the concentration of OM (g. kg-1), 5 mL of 1N potassium dichromate (K2Cr2O7) solution and 5 mL of 98% sulfuric acid (H2SO4) solution were mixed with 0.5 g of soil and kept at room temperature for 30 min. After adding deionized water, the color changes from blue to green, add concentrated phosphoric acid (H3PO4), and then added 0.5 M iron ammonium sulfate (NH4) 2Fe (SO4)2.6H2O titrate the mercury solution. Finally, the titration was repeated till the color changed from violet-blue to green.
For pH analysis, 25 g of soil was carefully mixed with deionized water and stirred. The pH of the suspension was then determined using a pH electrode at a temperature in the range of 20°C to 25°C (Phoenix Electrode Company, Houston, TX, USA).
To measure the concentration of TN (g. kg−1), 1.0 g of soil was digested with potassium sulfate, copper sulfate (K2SO4-CuSO4 × 5), and hydroxy selenide (H2O–Se) in 98% sulfuric acid (H2SO4). After that, ammonium nitrogen was extracted from the digest using steam and a pH increase of 0.1 M sodium hydroxide (NaOH). Third, the distillate was obtained in 2% H3BO3 and titrated with 0.05 H2SO4 to give a pH of 5.0. Finally, the TN concentration was computed based on the volume change of a 0.05 M sulfuric acid (H2SO4) solution.
To determine the TP concentration (g. kg−1), 0.25 g of soil was carefully mixed with a 60% HClO4 solution. The mixture was then diluted with standard and sample vanadium-molybdate reagents at a wavelength of 700 nm. Finally, TP was calculated using the calibration curve.
For soil water content (SWC) calculation, the Gravimetric method was used in the laboratory. A detailed amount of soil was placed in a container that is heated to 105°C and dried until all moisture has evaporated (Liu et al., 2016). The gravimetric method, also known as the drying method, is a direct way of assessing the moisture content of a soil sample by drying it and calculating the difference in weight between the wet and dry samples. The soil water content was calculated as the following: water content (%) = fresh weight-dry weight divided by dry weight multiplied by 100.
Trait collection and measurements
Plant functional traits (PFTs) were measured using a standardized protocol on sun-exposed leaves from the tops of crowns (Cornelissen et al., 2003). In many cases, a 3–4-m long pruning pole was used for smaller trees. When necessary, we used climbing tools and a pruning pole to reach the high tops of larger tree crowns. We collected trait data of species present during surveys using standard methods (Libalah et al., 2017). Using a clinometer, the height of all individual trees in each plot was investigated with a dbh ≤ 5 (diameter at breast height). To investigate the functional properties of the plants, 2–3 freshly emerged sun-exposed leaves on the current-year shoots were taken from each plant and measured on 3 standard trees of each species. Leaf thickness was measured using a digital reading caliper (SF2000, Guilin, China; Long et al., 2022; Yaseen et al., 2022). In addition, leaf area was measured using a leaf area meter (LI-COR 3100C Area Meter, LI-COR, Lincoln, NE, USA). The leaves were first dried at 70°C for at least 72 h to constant weight, weighed on a digital balance (Ohaus Adventurer AR2140 Analytical Balance, Hayward, CA, USA), and leaf area and dry matter were used to calculate the specific leaf area (SLA) (mm2 mg−1) for each tree. We focused on four plant functional traits: wood density (WD-g.cm−3), leaf thickness (LT-mm), specific leaf area (SLA-mm2.g−1), and relative leaf water content (RLWC %) across the 167 species in our dataset. Within 6 to 24 h, the fresh weight of the leaves was measured immediately with a SE202F electronic balance (Ohaus Corp., Parsippany, NJ, US), then stored in damp paper towels and placed in the refrigerator. The average area of the three leaves (LA) per tree was calculated, and the ratio between LA and SLA (cm2g−1) (the average mass of the three leaves) was calculated (Pérez-Harguindeguy et al., 2016). SLA is also associated with competitive ability, as species with low SLA compete better for scarce resources such as nitrogen (Weiher et al., 1999). Similarly, SLA is linked to growth rate and stress tolerance, with higher SLA associated with species that develop faster and are less stress-tolerant (Wright et al., 2004). Before measuring the mass and area of the fresh leaves, the leaf samples were stored in a wet bag below 4°C for up to 72 h. A leaf area meter was used to measure the size of the leaves (LI-COR 3100C Area Meter, LICOR), while the dry leaf mass was calculated after drying in the oven at 70°C for 72 h. After drying for at least 72 h at 70°C and weighing to the nearest 0.01 g, leaf mass per unit area (mg.mm2) was calculated for each tree based on leaf area and dry mass. We collected three twigs (width 1–2 cm) from each representative individual collected for leaf attributes to describe the species (WD, g.cm3) (501 twigs in total). We removed the pith, phloem, and bark from the branch after at least 3 days at 70°C, measured fresh volume with water displacement on the rest of the branch, and calculated dry mass (Cornwell et al., 2006). Branch density is strongly associated with core wood density for mature trees in TNNR by dividing the dry mass of the rest of the branch (excluding the pith, phloem, and bark) by its volume (Bu et al., 2014). The relative leaf water content (RLWC) was calculated as the following: water content (%) = fresh weight-dry weight divided by fresh weight multiplied by 100 (Jin et al., 2017). Each sample was measured in biological triplicate. Thus, the leaf thickness was calculated by a digital vernier caliper (Long et al., 2022; Yaseen et al., 2022).
Statistical analysis
Before the analysis, a principal component analysis (PCA) was used to explain the multivariate variations in soil variables and CWM functional traits of each species (Libalah et al., 2017), with data Box–Cox transformations (Box and Cox 1964). After that, to conduct mean standardized major axis analysis (Figure 1), the scatter plots with trend lines were created using the “smatr” package while graphs were created using the plot function from the “base” package. For bar graph implementation to see the variation in CWM values of plant functional traits across dominant species (Figure 2), the “ggplot2” package was applied. For Pearson correlation analysis (Figure 3), the “lm” function is to build the model using the “ggmisc” package along with the “ggplot2” package for visualization. The R-value indicated Pearson correlation and a probability value lower than 0.05 indicated that there is a significant association between the variables. In addition, a biplot was created (Figure 4) to see the relationship between CWM plant functional traits and soil abiotic properties using “factoextra” package. Finally, to conduct path analysis graphical representation (Figure 5), the library “lavann”, “semPlot”, “OpenMx”, “tidyverse”, “knitr”, “kableExtra”, and “GGally” packages were used. All analyses were performed in R software 4.0.2 (R Core Development Team, 2016).
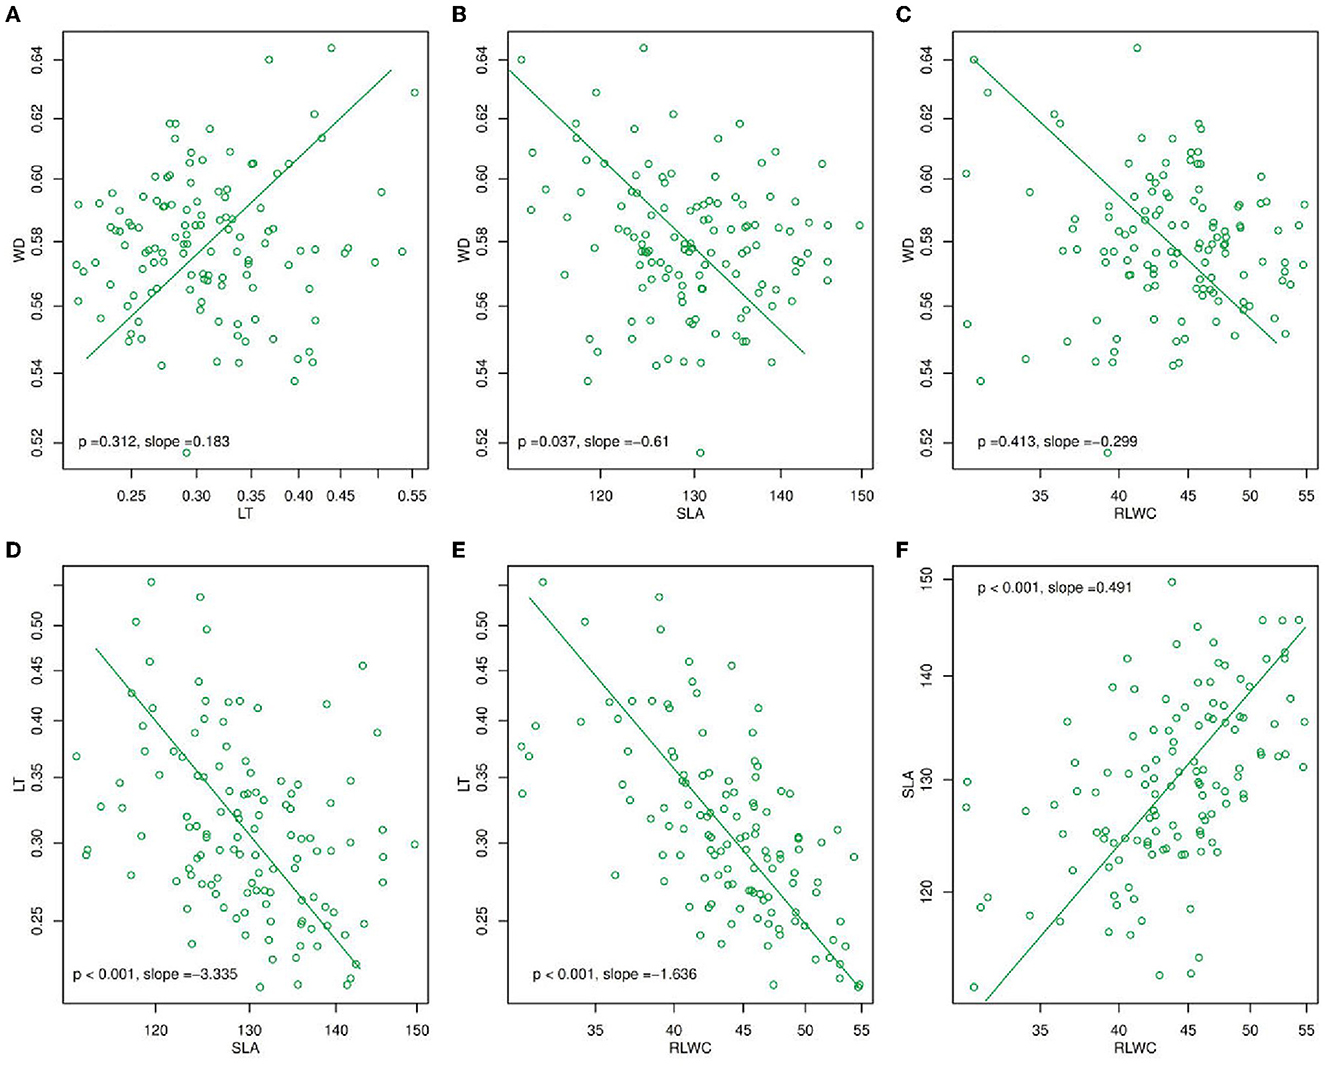
Figure 1. Mean standardized major axis (SMA) slopes for (A) WD and LT, (B) WD and SLA, (C) WD and RLWC, (D) LT and SLA, (E) LT and RLWC, and (F) SLA and RLWC. The slope values in (A–F) were calculated as the mean value for each trait pair across all species at the within-species level, and the p-value (p < 0.05) was derived from a Student's t-test which determines whether slopes differed significantly from zero. LT, leaf thickness; WD, wood density; SLA, specific leaf area; RLWC, relative leaf water content.
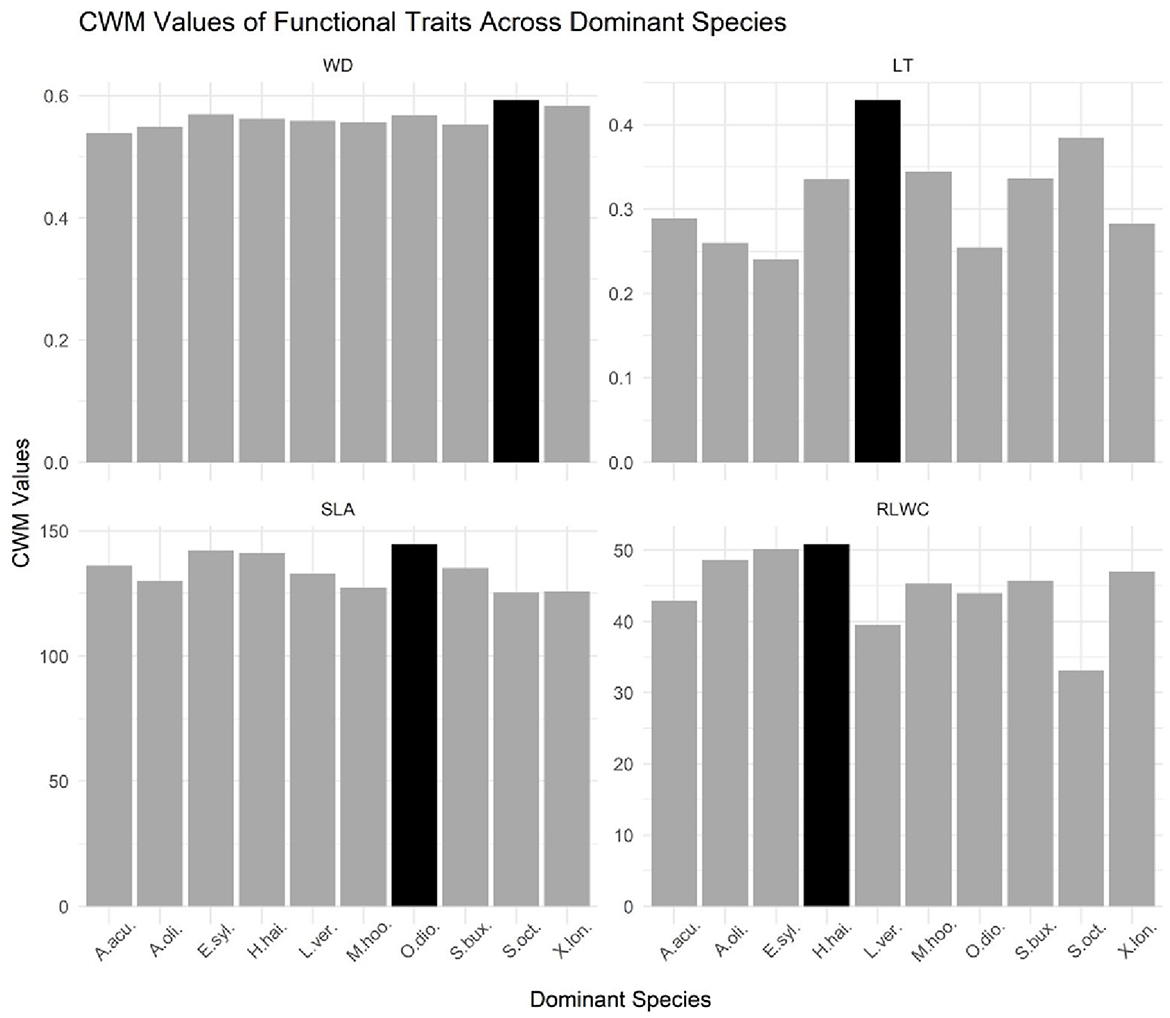
Figure 2. Bar graph of CWM values of functional traits across dominant species in a tropical evergreen monsoonal forest. LT, leaf thickness; WD, stem density; SLA, specific leaf area; RLWC, relative leaf water content. The black bar in each facet represents the maximum value for this variable across all dominant species, while the dark gray bars represent the values for a single species.
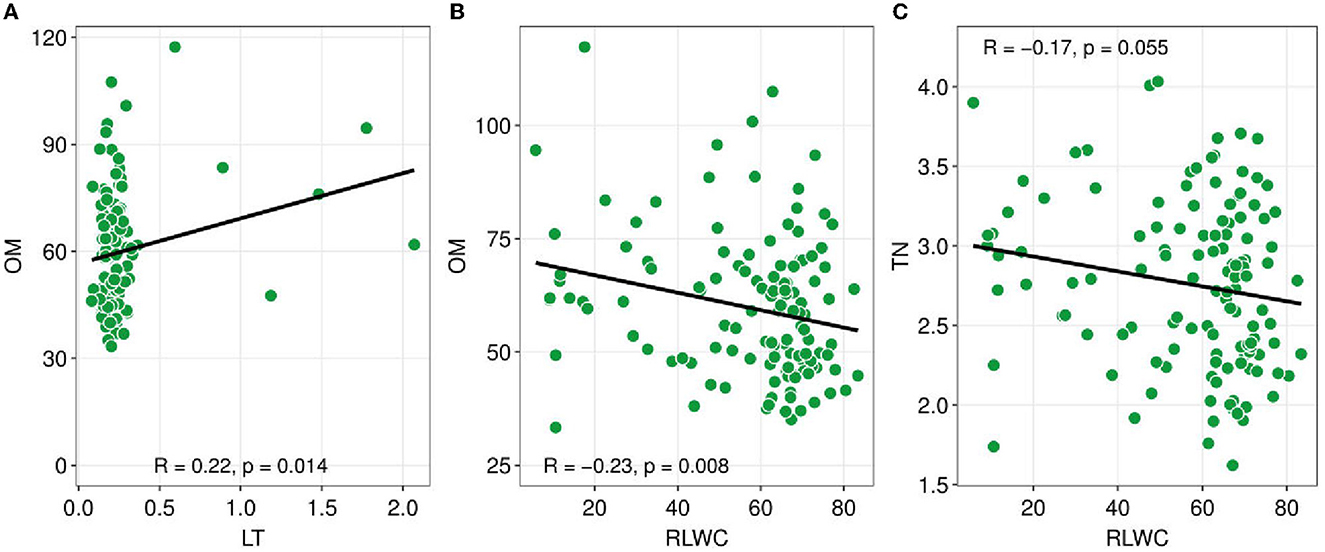
Figure 3. Pearson correlation coefficients between soil nutrients and plant functional traits. Soil nutrients such as TN (total nitrogen), OM (organic matter), versus plant functional traits e.g., LT (leaf thickness), and RLWC (relative leaf water content). Green dots show the sites. The black line is a trend line, and the grey-shaded area represents the SE (standard error). The R-value indicated Pearson correlation and a probability value lower than 0.05 indicates there is a significant association between the variables.
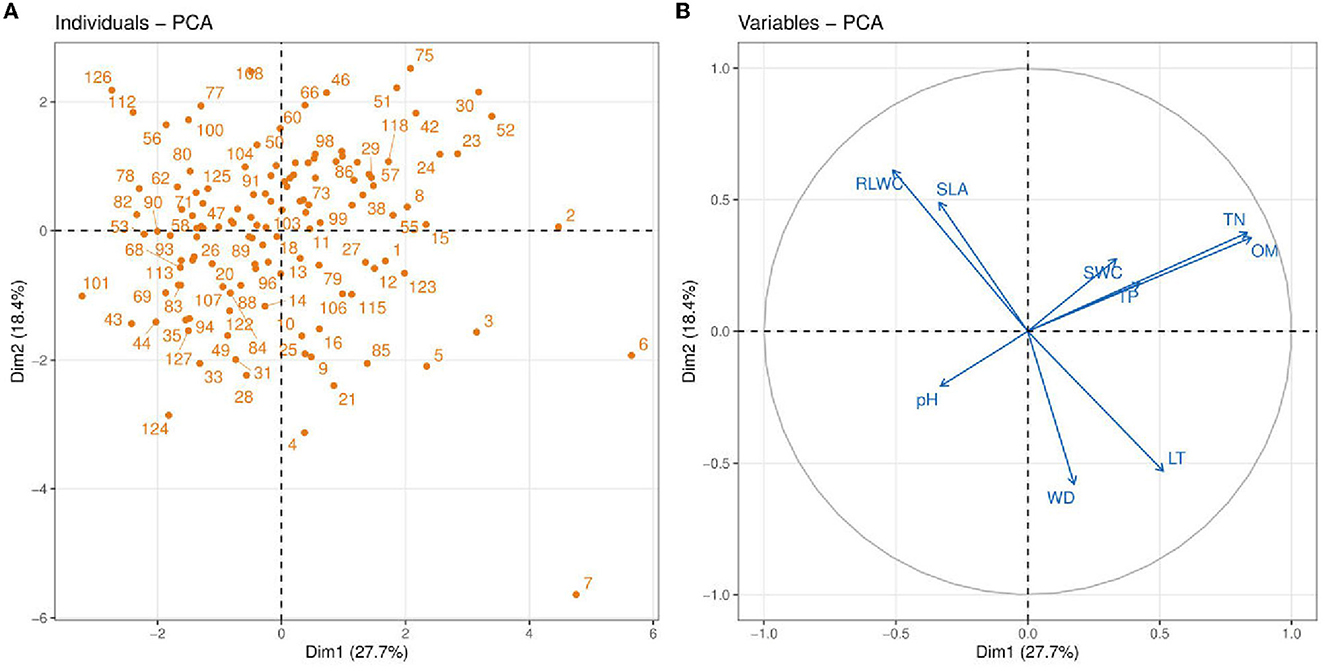
Figure 4. Principle component analysis (PCA) between soil abiotic properties such as soil pH; TN, total nitrogen; TP, total phosphorus; OM, organic matter; SWC, soil water content and plant functional traits e.g., LT, leaf thickness; WD, wood density; SLA, leaf-specific area; RLWC, relative leaf water content. Blue vectors show the soil abiotic properties and plant functional traits, and orange dots show the vegetation sites.
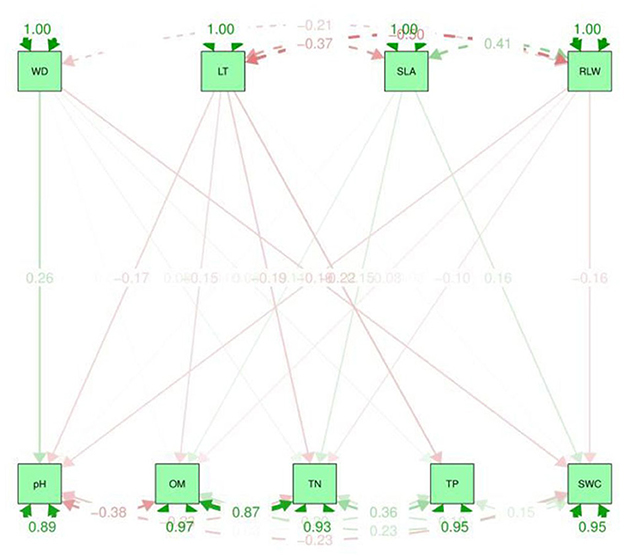
Figure 5. Path analysis graphical representation between soil properties and CWM traits. The upper dotted lines represent the indirect effect and the values in the graph are standard deviations. LT, leaf thickness; WD, wood density; SLA, specific leaf area; RLWC, relative leaf water content; TN, total nitrogen; TP, total phosphorus; OM, organic matter; SWC, soil water content.
Regression and path analysis
A path analysis or non-causal effect model was developed to further understand the relationship between the plant functional traits and environmental variables patterns (Figure 5). This model was also used in previous studies to measure the relationships among plant leaf traits (Scheiner et al., 2000). Path analysis is a relationship model that reveals complicated interactions such as non-existent realistic ties, gradual loops, and self-feedback. A straight path is shown by the arrow to the other component (Aamir et al., 2021). Path analysis differs from multiple regression in that the former assumes a specific causal structure among the variables, whereas the latter assumes that all attributes directly affect fitness. A path diagram includes estimates of the strength of relationships called path coefficients (p). In the context of the other independent variables, a path coefficient is the standardized slope of the regression of the dependent variable on the independent variable (Scheiner et al., 2000).
A path analysis (Figure 5) was used to observe the direct or indirect effect between soil variables and CWM traits while regression analysis (Supplementary Table S1) was used to detect the interspecific relationships. These two methods are important to discuss the impact of soil properties on plant functional traits. This aim was to analyze the changes in CWM traits due to environmental variables in TNNR in the year 2020. In contrast, it also provides a reference and ideas that how CWM traits differ due to soil properties in tropical monsoonal forest. As well as it suggests many ways to improve the tropical vegetation community and its control measures.
Multiple linear regression was applied to determine the association between the plant functional traits and environmental variables. Before regression analysis, the values of plant functional traits for each species were used to calculate the CWM. To do this, we calculated a mean value for each trait at each site by multiplying the trait value of each species by its total abundance at each site. For each PFTs, the CWM was determined separately. The calculation was as follows:
Where n represents the total number of species and the relative abundance (density) of each species is represented by Wi, while the value of PFT in the ith species is denoted by Xi. Before being used to calculate the CWM, the PFTs data were log-transformed and then normalized according to the formula, Zi = (Xi – Xmean)/SD, where Zi signifies the standardized value for a specific species I; Xi denotes the trait value of each individual of species attribute i; and the standard deviation of the value of each specie's feature is also referred to as SD. CWM trait values were calculated by using the package “dplyr” in R v.3.0.2.
Results
Bivariate relationships among functional traits
Using a standardized major axis (SMA) (Figure 1), there were found many changes in plant functional traits e.g., LT, WD, SLA, and RLWC during the year of 2020. In these, WD and LT (p = 0.312, slope = 0.183, Figure 1A) were positively correlated while SLA and RLWC (p < 0.001, slope = 0.491, Figure 1F) had a significantly positive association. On the other hand, LT with SLA and RLWC (p < 0.001, slope = −3.335, Figure 1D; p < 0.001, slope = −1.66, Figure 1E) were significantly negatively correlated. But, WD with SLA and RLWC (p = 0.037, slope = −0.61, Figure 1B; p = 0.413, slope = −0.299, Figure 1C) were negatively correlated.
Variations in community-weighted mean values of functional traits across dominant species
A bar graph was used to compare the different CWMs traits across dominant species in the tropical evergreen forest (Figure 2). The purpose of the bar graph is to quickly convey relational information between traits and dominant species visually. Based on the bar chart and the accompanying data, it appears that the species Olea dioica has the highest value for the variable SLA, which represents a specific leaf area. This means that Olea dioica has relatively thin leaves compared to the other species in the dataset. In contrast, Hydnocarpus hainanensis has the highest value for the variable RLWC, which represents relative water content, indicating that it has a relatively high water content compared to the other species. Moreover, the species Schefflera octophylla has the highest value for the WD which signifies the wood density and the species Litsea verticillata has the highest value for the variable LT which signifies leaf thickness, indicating high leaf thickness than other species in the dataset. Furthermore, the black bar in each facet represents the maximum value for that variable across all the species, while the dark gray bars represent the values for the individual species. Hence, the dominant species were Acronychia oligophlebia, Syzygium buxifolium, Elaeocarpus sylvestris, Acmena acuminatissima, Xantolis longispinosa, Olea dioica, Hydnocarpus hainanensis, Mallotus hookerianus, Schefflera octophylla, and Litsea verticillata (Supplementary Table S2).
Dominant species based on their basal area
We conducted our study at the community and plot level in a vegetation community with the same type of topography and climatic condition, i.e., the inclination of gradient, parental substances, and aspects. Hence, the dominant species were Acronychia oligophlebia, Syzygium buxifolium, Elaeocarpus sylvestris, Acmena acuminatissima, Xantolis longispinosa, Olea dioica, Hydnocarpus hainanensis, Mallotus hookerianus, Schefflera octophylla, and Litsea verticillata (Supplementary Table S2).
Relationships between functional traits and soil conditions
The Pearson correlation analysis showed the changes in the CWM-PFTs and the soil abiotic properties (Figure 3). The CWM-LT has a significant positive relationship with soil OM (R = 0.22, p = 0.014). On the other hand, CWM-RLWC had a negative significant association with OM and TN (R = −0.23, p = 0.008; R = −0.17, p = 0.055).
We performed PCA analysis of 4 plant functional traits and 5 soil properties to assess multivariate relationships and reveal the dimension of variation in traits and soil variables (Figure 4). In this figure, circular symbols were representing vegetation sites. The soil variables and functional traits of the plants are represented as vectors. The first PC accounts for a higher variance (27.7%) compared to the second PC (18.4%). The variables TN and OM have a strong positive association with PC2 while WD, SLA, and RLWC contributed more toward PC1. Among the soil variables, TN and OM showed a strong positive association indicating that with an increase in soil OM, there is an increase in soil TN. Soil OM and TN also have a strong positive association with CWM traits such as LT and WD. The increase in SWC is highly dependent on soil OM and SWC has a weak positive connection with TP. A similar association was also recorded between RLWC and SLA indicating an increase in plant SLA with an increase in RLWC. Another interesting aspect is that there is a strong negative association of soil pH with TP, TN, OM, and SWC while no or very slight influence on all of the plant functional traits.
Path analyses were used to find the direct and indirect relationship between CWM traits (dependent variables) and soil variables (independent variables). β is the correlation coefficient range from 0 to 1. The higher the value of beta, the stronger the association between the variables. It can be observed that the greater value of CWM plant functional traits e.g., SLA β coefficient, was 4.988 with the soil properties such as TN. Whereas, LT −0.00 and −0.013 with OM and TN have a lower value (Supplementary Table S1). The TN was positively correlated to CWM traits, i.e., SLA. On the other hand, based on the multiple R2 values, the soil pH was 0.120 and was positively significantly correlated to CWM traits such as WD and SLA while TP has a lower value and is negatively correlated to LT and SLA (Supplementary Table S1). Therefore, the results from the path analysis showed a strong positive relationship between soil variables such as OM and cwm traits, i.e., RLWC as well as TN and SLA. Hence, soil variables such as OM and TN have a major impact on plant CWM traits, e.g., SLA and RLWC (Figure 5).
According to regression analysis, five soil properties changed significantly in the year 2020. Soil organic matter (OM) and soil water content (SWC) showed the highest values than that of soil pH, soil TN, and TP in the tropical evergreen monsoonal forest (Table 1).
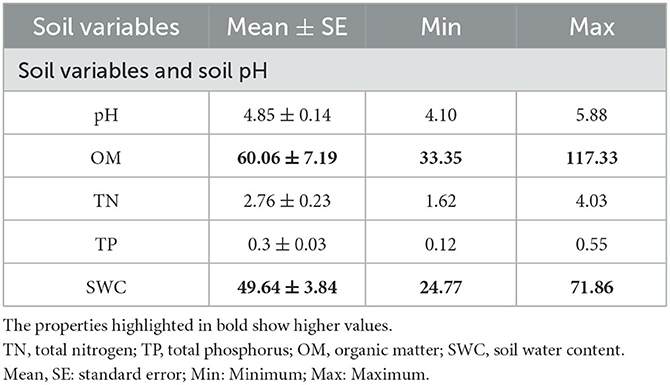
Table 1. Mean and standard error values of environmental variables, as well as the minimum and maximum.
The principal component analysis shows that soil OM (0.390) and TN (0.349) were strongly positively related to the first axis while negatively related to the second axis (−0.025 and −0.144). The SWC had a positive relationship on both axes (PC1 = 0.056, PC2 = 0.172). On the other hand, soil pH was negatively related on both axes (PC1 = −0.176, PC2 = −0.104). The soil TP was positively related to PC1 (0.045) and negatively related to PC2 (−0.438) (Table 2).
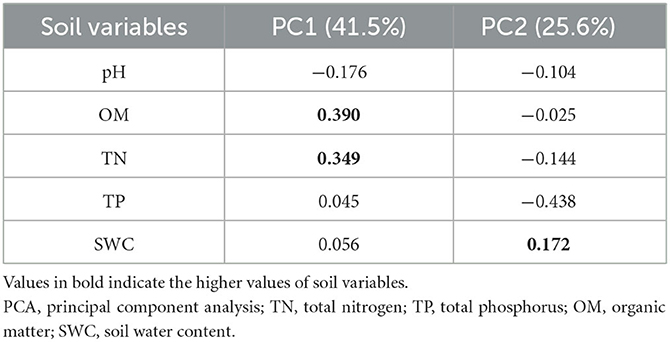
Table 2. Relationship between soil properties and the two axes resulting from PCA.
Table 2 shows the results of the eigenvectors of two components. These two components were selected to identify the most influencing variable. The variable which has a higher value contributes more to the variation.
Discussion
Our study quantifies to examine the dynamic patterns of soil variables and plant functional traits, as well as their relationship. According to assumptions, we observed the differences in soil nutrients and plant functional traits in tropical evergreen monsoonal forests.
Differences between plant functional traits in bivariate trait relationships
The relationships among CWM traits are useful for classifying functional tradeoffs and plant strategies, and they are often used in dynamic vegetation models to conclude one functional trait from another (Sakschewski et al., 2015). Rather than relying on average species or average PFT values, the next generation of dynamic vegetation models will use universal scaling relationships to reflect functional diversity within trait spectra (Fyllas et al., 2014). As a result, this common scaling relationship is relatively useful (Anderegg et al., 2018). Furthermore, Fyllas et al. (2020) showed the correlation between the PFTs in Mountainous Mediterranean Forests (MMF), LMA and LT, and LDMC and LMA, were significantly positively correlated while LT and LDMC were significantly negatively associated. A similar negative trend was found in LT and RLWC (Figure 1E) and a positive trend was found in RLWC and SLA (Figure 1F) in our study Moreover, SLA and LT had a significantly negative correlation (Figure 1D). The backbone of the leaf economics spectrum is leaf mass per unit area (LMA), which incorporates numerous features of leaf construction such as LDMC, tissue density, and LT (Garnier et al., 2001). Wood density is a well-researched stem feature (Zanne et al., 2010) because it is a simple way to quantify resource allocation to structural support. Moreover, it is proved that the correlation between functional traits such as LMA vs. WD was significantly positively related (Long et al., 2020). Nonetheless, we found contradictory results that SLA vs. WD had a significantly negative relationship (Figure 1B).
Some functional traits such as WD and SLA are globally considered to be fundamental functional traits that explain plant growth rates (Kunstler et al., 2016). A high WD is related to a slow potential growth rate, indicating a high level of competitive tolerance and a strong competitive effect. Whereas LT of plant species (Kunstler et al., 2016) is due to the limited resources of soil nutrients (Ordoñez et al., 2009). Generally, CWM traits to measure community dynamics and ecosystem attributes have been demonstrated (Garnier et al., 2007).
Variation in community-weighted mean values of plant functional traits across dominant species
Functional leaf traits like specific leaf area (SLA) and relative leaf water content (RLWC) have frequently been examined and they show directional changes during forest recovery. The occurrence of trait alterations in the process of succession has been well described. It was reported in recent studies that some traits are important in the dynamic of litter decomposability in the multiple regression analysis, such as LDMC, which did not change significantly during the forest recovery process (Eichenberg et al., 2015). Our observations demonstrated that SLA and RLWC were greater than WD and LT (Figure 2). Similarly, a previous study found that CWM for WD was not decreased on the windward side while it is slightly decreased on the leeward side (Marod et al., 2020). Most studies have used cover to estimate abundance and have focused on identifying CWM responses to environmental change, for instance, natural and anthropogenic disturbances (Lavorel et al., 2008). In contrast, of the four plant morphology traits, the CWMs were not significantly different (Figure 2).
According to recent studies, changes in dominant species composition are found in severely damaged and undamaged forests due to some environmental factors, for instance, light density, nutrient availability, and soil processes (Prach and Walker, 2011). Moreover, most of the studies proved that the most common or dominant species in forests in the primary successional stage have a higher SLA than species in forests in the climax successional stage (Chai et al., 2015). Xiao et al. (2018) found the highest value for the variable SLA for Ardisia quinquegona. Furthermore, high WD enhances the stiffness and strength of wood, thus protecting trees against biophysical hazards and enhancing plant survival (Van Gelder et al., 2006). Our results also clearly show the higher values of SLA for Olia dioca and WD for Schefflera octophylla (Figure 2). Leaf traits of the most dominant species should have the highest influence on ecosystem processes such as decomposition (Garnier et al., 2004).
The pattern of a few predominant species and many rarer species is a defining feature of communities on a large scale. These abundant species are commonly referred to as dominant species. At present, the phrase dominant species is poorly defined, and different authors use it to convey different information (Avolio et al., 2019).
In addition, the important value index (IVI) of the most common or dominant species was found (Supplementary Table S2) in recent studies, which proved that each species plays an important role in maintaining ecosystem equilibrium (Chala et al., 2016). During the year 2020, the important values (IV) were used to describe the most important species of vegetation sites. The decline in the dominant species altered and species with higher decline ratios were possibly removed for forest conservation in the following years. Furthermore, species with lower decline ratios have been suggested to conserve for longer periods (Lu et al., 2018). However, at the secondary stage of succession, these species may be creating enough space for the most prevalent species.
Association between community-weighted mean traits and soil conditions
It is demonstrated that in the tropical region, only two traits, for example, SLA and LT, describe soil properties strongly linked with the axis (Marod et al., 2020). Wood density (WD) and SLA are two functional traits that are thought to be important in understanding plant growth rates worldwide (Kunstler et al., 2016). According to Marod et al. (2020), the first PC (PC1) was strongly correlated with CWM-SLA, whereas the second axis of PCA contributed most to CWM-LDMC, CWM-WD, and CWM-LA. Moreover, they reported that only two CWM traits such as SLA and LT were significantly related to soil properties and the PC (Dim1) axis separated most of the CWM attributes and soil variables (Marod et al., 2020). Ordoñez et al. (2009) proved that it is a common strategy in linking community-level trait responses to the environment. A negative association was found in RDA (redundancy analysis) between CWM for SLA and LT (Marod et al., 2020; Figure 4). On the other hand, Chai et al. (2019) demonstrated that soil water content (SWC) was more contributed to the primary axis of CCA while soil pH contributed more to the second axis of CCA2. Zirbel et al. (2017) found that the first PC axis was positively related to soil organic matter (OM). Hence, our findings show that the first axes of PC most contributed to SWC and OM, whereas soil pH had little influence on both axes. However, Nielsen et al. (2019) described the soil's total phosphorus and total nitrogen as more contributed to secondary axes of PC. Our evidence also showed that TP and TN most contributed to the second axes (Figure 4). On the contrary, Chen et al. (2021) found that the primary axis of PCA was strongly positively related to soil nutrients, i.e., TN (Figure 4).
CWM attribute values are particularly useful for describing soil properties because CWMs of leaf attributes indicate nutrient cycling via decomposing plant material available for soil resources (Eichenberg et al., 2015). In general, CWM for SLA has historically been shown to be associated with nutrient cycling and dynamics (Garnier et al., 2004; Eichenberg et al., 2015). CWM for SLA is related to nutritional dynamics (Kleyer et al., 2012). The changes in LMA are controlled by various environmental factors and should be considered part of an integrated trait complex (Poorter et al., 2009, 2014). We found a negative association between soil TP and CWM for SLA (Figure 4). Furthermore, a significant positive connection was found between OM and LT (Figure 3A) and a significant negative relationship was found between RLWC and OM (Figure 3B). Hence, Marod et al. (2020) found a similar and dissimilar finding, a positive relationship between available phosphorus (AP) and CWM for SLA. Whereas, a negative relationship was found between leaf dry matter content (LDMC) and soil OM and found a positive relationship between available phosphorus (AP) and CWM for SLA.
Soil nutrients are one of the most important limiting variables for tropical forest structure and primary productivity, as well as for other biological processes such as plant root distribution, development, and litter formation (Zhang et al., 2015). Moreover, TMCF soil is characterized by low pH, which could lead to limited nutrient availability (Bruijnzeel and Veneklaas, 1998). Our results also show a low mean value of soil pH than that of OM and SWC (Table 1). The accumulation of soil OM, which stimulates the generation of organic acids, could be the reason for increasing soil acidity during forest community restoration (Roman et al., 2011). The SWC controls erosion, river discharge, and groundwater recharge by determining the separation of precipitation into surface runoff and infiltration. SWC is a major influence on plant development and crop quality at the field scale (McBratney et al., 2016) (Table 1). Furthermore, Libalah et al. (2017) found that the summary statistics of the soil and topography variables, such as soil TN, TP, OM, and moisture content, had positive values. Our findings also identified the almost same values of soil variables, e.g., TN, OM, and SWC (Table 1).
Two PCA axes were selected using Guttman's Kaiser criterion to summarize the most important gradients of the soil variables and to select the most important PCA axes that can be interpreted. Unlike other selection methods that rely on visual evaluation of PCA axes, this method calculates the mean of all eigenvalues and saves only those axes with eigenvalues greater than the mean, i.e., eigenvalues ≥1 for standardized PCA (Borcard et al., 2011). Zirbel et al. (2017) found that soil OM was positively correlated to the first axis of PCA. Our results support the above findings that soil OM was positively related to the primary axis of PCA; whereas, we also found controversial results that soil pH was negatively correlated to PC1 (Table 2). It is also described that soil P could be critical in defining plant community structure (Mason et al., 2012). Whereas, Hernández-Vargas et al. (2019) found the total P and total N contributed positively to the PC (Dim1) as compared to other minerals (Table 2). Conversely, Libalah et al. (2017) demonstrated that the same soil variables were positively correlated to the primary axis of PC while moisture content (MOC) was positively related to the second axes of PC. Our results also show that the soil TN, TP, and OM had a positive association with the primary axes while SWC was positively correlated to both axes (Table 2). Similarly, Trujillo et al. (2021) found a negative correlation between soil pH on the first axis of PCA. Meanwhile, our observations also showed a negative association of soil pH on primary axes (PC1) PCs (Table 2).
Conclusion
By using the data of the four most prevalent PFTs, five soil properties in TNNR were established for differences and relationships in important functional traits and environmental variables. We report a key set of morphological traits that are important for understanding the community assembly patterns in a tropical evergreen monsoonal forest. We found in interspecific correlation that soil OM and TN are strongly positively related to CWM-LT and CWM-WD. Furthermore, evidence showed that CWM-WD with CWM-LT and CWM-SLA with CWM-RLWC had a significant positive relationship. The overall inter- and intra-specific relationship in these forests suggests that they are mostly specialists in the local environment for limiting resources such as nutrients and moisture, and survival during wind disturbance may be more important than competition for resources at the regional scale. Moreover, this suggests that resource allocation patterns for these important functional traits, which describe important plant strategies, are driven by a combination of extreme conditions linked to solar radiation and soil nutrient content.
Suggestions and future prospects
Plant functional traits can be used to predict soil nutrients and ecosystem functioning in tropical secondary forests. The coexistence of species and community assembly can increase our knowledge of the tropical coastal secondary forests. This study will help to better understand the restoration of habitats and green infrastructure design, suggesting that selecting different species across multiple trait axes will ensure functionality at the maximum level. However, further studies are needed to explore the soil properties and their association with plant functional features and their role in ecosystem functioning.
Data availability statement
The original contributions presented in the study are included in the article/Supplementary material, further inquiries can be directed to the corresponding author.
Author contributions
MY, FK, and UA designed the methodology, contributed to conceptual development and critically to the drafts, abstract writing, introduction, research questions and hypothesis making, and analyzed the data. WRK, SB, FB, and MA helped in cross-checking the citations with references, and arranging the manuscript as per guidelines of the journal and gave final approval for publication. All authors contributed to the article and approved the submitted version.
Funding
This research was funded by the Universiti Putra Malaysia Kampus Bintulu Sarawak (63008).
Acknowledgments
We are obliged to our lab fellows for their generous cooperation and especially to Rana Ahmer Javaid (The Islamia University of Bahawalpur, Punjab, Pakistan) who supported us throughout this project.
Conflict of interest
The authors declare that the research was conducted in the absence of any commercial or financial relationships that could be construed as a potential conflict of interest.
Publisher's note
All claims expressed in this article are solely those of the authors and do not necessarily represent those of their affiliated organizations, or those of the publisher, the editors and the reviewers. Any product that may be evaluated in this article, or claim that may be made by its manufacturer, is not guaranteed or endorsed by the publisher.
Supplementary material
The Supplementary Material for this article can be found online at: https://www.frontiersin.org/articles/10.3389/ffgc.2023.1198626/full#supplementary-material
References
Aamir, M., Li, Z., Bazai, S., Wagan, R. A., Bhatti, U. A., Nizamani, M. M., et al. (2021). Spatiotemporal change of air-quality patterns in Hubei Province—a pre- to post-COVID-19 analysis using path analysis and regression. Atmosphere (Basel). 12, 1338. doi: 10.3390/atmos12101338
Adler, P. B., Salguero-Gomez, R., Compagnoni, A., Hsu, J., Ray-Mjkherjee, J., Mbeau-Ache, C., et al. (2014). “Functional traits explain variation in plant life history strategies,” in Proceedings of the National Academy of Sciences of the United States of America. doi: 10.1073/pnas.1315179111
Anderegg, L. D. L., Berner, L. T., Badgley, G., Sethi, M. L., Law, B. E., and HilleRisLambers, J. (2018). Within-species patterns challenge our understanding of the leaf economics spectrum. Ecol. Lett. 21, 734–744. doi: 10.1111/ele.12945
Anderson, J. M., and Ingram, J. S. I. (1989). Tropical Soil Biology and Fertility: A Handbook of Methods. Aberystwyth, UK: C.A.B. International 265. doi: 10.1097/00010694-199404000-00012
Atkin, O. K., Bloomfield, K. J., Reich, P. B., Tjoelker, M. G., Asner, G. P., Bonal, D., et al. (2015). Global variability in leaf respiration in relation to climate, plant functional types and leaf traits. New Phytol. 206, 614–636. doi: 10.1111/nph.13253
Auger, S., and Shipley, B. (2013). Inter-specific and intra-specific trait variation along short environmental gradients in an old-growth temperate forest. J. Veget. Sci. 24, 419–428. doi: 10.1111/j.1654-1103.2012.01473.x
Avolio, M. L., Forrestel, E. J., Chang, C. C., La Pierre, K. J., Burghardt, K. T., and Smith, M.D. (2019). Demystifying dominant species. New Phytol. 223, 1106–1126. doi: 10.1111/nph.15789
Borcard, D., Gillet, F., and Legendre, P. (2011). Numerical Ecology with R. New York: Springer. doi: 10.1007/978-1-4419-7976-6
Bruijnzeel, L. A., and Veneklaas, E. J. (1998). Climatic conditions and tropical montane forest productivity: The fog has not lifted yet. Ecology 79, 3–9. doi: 10.1890/0012-9658(1998)079[0003:CCATMF]2.0.CO;2
Bu, W., Zang, R., and Ding, Y. (2014). Field observed relationships between biodiversity and ecosystem functioning during secondary succession in a tropical lowland rainforest. Acta Oecol. 55, 1–7. doi: 10.1016/j.actao.2013.10.002
Chai, Y., Dang, H., Yue, M., Xu, J., Zhang, L., Quan, J., et al. (2019). The role of intraspecific trait variability and soil properties in community assembly during forest secondary succession. Ecosphere 10, e02940. doi: 10.1002/ecs2.2940
Chai, Y., Liu, X., Yue, M., Guo, J., Wang, M., Wan, P., et al. (2015). Leaf traits in dominant species from different secondary successional stages of deciduous forest on the Loess Plateau of northern China. Appl. Veg. Sci. 18, 50–63. doi: 10.1111/avsc.12123
Chala, D., Brochmann, C., Psomas, A., Ehrich, D., Gizaw, A., Masao, C. A., et al. (2016). Good-bye to tropical alpine plant giants under warmer climates? Loss of range and genetic diversity in Lobelia rhynchopetalum. Ecol. Evol. 6, 8931–8941. doi: 10.1002/ece3.2603
Chen, J., Qu, M., Zhang, J., Xie, E., Huang, B., and Zhao, Y. (2021). Soil fertility quality assessment based on geographically weighted principal component analysis (GWPCA) in large-scale areas. CATENA 201, 105197. doi: 10.1016/j.catena.2021.105197
Clark, C. M., and Tilman, D. (2008). Loss of plant species after chronic low-level nitrogen deposition to prairie grasslands. Nature 451, 712–715. doi: 10.1038/nature06503
Cornelissen, J. H. C., Lavorel, S., Garnier, E., Díaz, S., Buchmann, N., Gurvich, D. E., et al. (2003). A handbook of protocols for standardised and easy measurement of plant functional traits worldwide. Aust. J. Bot. 51, 335. doi: 10.1071/BT02124
Cornwell, W. K., Schwilk, D. W., and Ackerly, D. D. (2006). A trait-based test for habitat filtering: convex hull volume. Ecology 87, 1465–1471. doi: 10.1890/0012-9658(2006)87[1465:ATTFHF]2.0.CO;2
Costa, D. S., Gerschlauer, F., Kiese, R., Fischer, M., Kleyer, M., and Hemp, A. (2018). Plant niche breadths along environmental gradients and their relationship to plant functional traits. Divers. Distrib. 24, 1869–1882. doi: 10.1111/ddi.12815
Eichenberg, D., Trogisch, S., Huang, Y., He, J. S., and Bruelheide, H. (2015). Shifts in community leaf functional traits are related to litter decomposition along a secondary forest succession series in subtropical China. J. Plant Ecol. 8, 401–410. doi: 10.1093/jpe/rtu021
Funk, J. L., Larson, J. E., Ames, G. M., Butterfield, B. J., Cavender-Bares, J., Firn, J., et al. (2017). Revisiting the Holy Grail: Using plant functional traits to understand ecological processes. Biol. Rev. 92, 1156–1173. doi: 10.1111/brv.12275
Fyllas, N. M., Gloor, E., Mercado, L. M., Sitch, S., Quesada, C. A., Domingues, T. F., et al. (2014). Analysing Amazonian forest productivity using a new individual and trait-based model (TFS v.1). Geosci. Model Dev. 7, 1251–1269. doi: 10.5194/gmd-7-1251-2014
Fyllas, N. M., Michelaki, C., Galanidis, A., Evangelou, E., Zaragoza-Castells, J., Dimitrakopoulos, P. G., et al. (2020). Functional trait variation among and within species and plant functional types in mountainous mediterranean forests. Front. Plant Sci. 11, 212. doi: 10.3389/fpls.2020.00212
Garnier, E., Cortez, J., Billès, G., Navas, M. L., Roumet, C., Debussche, M., et al. (2004). Plant functional markers capture ecosystem properties during secondary succession. Ecology 85, 2630–2637. doi: 10.1890/03-0799
Garnier, E., Lavorel, S., Ansquer, P., Castro, H., Cruz, P., Dolezal, J., et al. (2007). Assessing the effects of land-use change on plant traits, communities and ecosystem functioning in grasslands: a standardized methodology and lessons from an application to 11 European Sites. Ann. Bot. 99, 967–985. doi: 10.1093/aob/mcl215
Garnier, E., Navas, M.-L., and Grigulis, K. (2016). Plant Functional Diversity: Organism Traits, Community Structure, and Ecosystem Properties. Oxford: Oxford University Press. doi: 10.1093/acprof:oso/9780198757368.001.0001
Garnier, E., Shipley, B., Roumet, C., and Laurent, G. (2001). A standardized protocol for the determination of specific leaf area and leaf dry matter content. Funct. Ecol. 15, 688–695. doi: 10.1046/j.0269-8463.2001.00563.x
Griffin-Nolan, R. J., Bushey, J. A., Carroll, C. J. W., Challis, A., Chieppa, J., Garbowski, M., et al. (2018). Trait selection and community weighting are key to understanding ecosystem responses to changing precipitation regimes. Funct. Ecol. 32, 1746–1756. doi: 10.1111/1365-2435.13135
Hernández-Vargas, G., Sánchez-Velásquez, L. R., López-Acosta, J. C., Noa-Carrazana, J. C., and Perroni, Y. (2019). Relationship between soil properties and leaf functional traits in early secondary succession of tropical montane cloud forest. Ecol. Res. 34, 213–224. doi: 10.1111/1440-1703.1267
Hodgson, J. G., Montserrat-Mart,i, G., Charles, M., Jones, G., Wilson, P., Shipley, B., et al. (2011). Is leaf dry matter content a better predictor of soil fertility than specific leaf area? Ann. Botany 108, 1337–1345. doi: 10.1093/aob/mcr225
Jin, X., Shi, C., Yu, C. Y., Yamada, T., and Sacks, E. J. (2017). Determination of leaf water content by visible and near-infrared spectrometry and multivariate calibration in miscanthus. Front. Plant Sci. 8, 721. doi: 10.3389/fpls.2017.00721
Jobbagy, E. G., and Jackson, R. B. (2001). The distribution of soil nutrients with depth: Global patterns and the imprint of plants. Biogeochemistry 53, 51–77. doi: 10.1023/A:1010760720215
Kattge, J., Diaz, S., Lavorel, S., Prentice, I. C., Leadley, P., Bonisch, G., et al. (2011). TRY - a global database of plant traits. Glob. Chang. Biol. 17, 2905–2935. doi: 10.1111/j.1365-2486.2011.02451.x
Kleyer, M., Dray, S., Bello, F., Lep,š, J., Pakeman, R. J., Strauss, B., et al. (2012). Assessing species and community functional responses to environmental gradients: which multivariate methods? J. Veg. Sci. 23, 805–821. doi: 10.1111/j.1654-1103.2012.01402.x
Kunstler, G., Falster, D., Coomes, D. A., Hui, F., Kooyman, R. M., Laughlin, D. C., et al. (2016). Plant functional traits have globally consistent effects on competition. Nature 529, 204–207. doi: 10.1038/nature16476
Laliberté, E., Grace, J. B., Huston, M. A., Lambers, H., Teste, F. P., Turner, B. L., et al. (2013). How does pedogenesis drive plant diversity? Trends Ecol. Evol. 28, 331–340. doi: 10.1016/j.tree.2013.02.008
Lambers, H., Ahmedi, I., Berkowitz, O., Dunne, C., Finnegan, P. M., et al. (2013). Phosphorus nutrition of phosphorus-sensitive Australian native plants: threats to plant communities in a global biodiversity hotspot. Conserv. Physiol. 1, cot010. doi: 10.1093/conphys/cot010
Lambers, H., Raven, J. A., Shaver, G. R, and Smith, S. E. (2008). Plant nutrient-acquisition strategies change with soil age. Trends Ecol. Evol. 23, 95–103. doi: 10.1016/j.tree.2007.10.008
Lambers, H., Shane, M. W., Cramer, M. D., Pearse, S. J., and Veneklaas, E. J. (2006). Root structure and functioning for efficient acquisition of phosphorus: matching morphological and physiological traits. Ann. Botany 98, 693–713. doi: 10.1093/aob/mcl114
Langan, L., Higgins, S. I., and Scheiter, S. (2017). Climate-biomes, pedo-biomes or pyro-biomes: which world view explains the tropical forest-savanna boundary in South America? J. Biogeogr. 44, 2319–2330. doi: 10.1111/jbi.13018
Lavorel, S., Grigulis, K., McIntyre, S., Williams, N. S. G., Garden, D., Dorrough, J., et al. (2008). Assessing functional diversity in the field – methodology matters! Funct. Ecol. 22, 134–137. doi: 10.1111/j.1365-2435.2007.01339.x
Libalah, M. B., Droissart, V., Sonké, B., Hardy, O. J., Drouet, T., Pescador, D. S., et al. (2017). Couteron, P. Shift in functional traits along soil fertility gradient reflects non-random community assembly in a tropical African rainforest. Plant Ecol. Evol. 150, 265–278. doi: 10.5091/plecevo.2017.1318
Lira-Martins, D., Humphreys-Williams, E., Strekopytov, S., Ishida, F. Y., Quesada, C. A., and Lloyd, J. (2019). Tropical tree branch-leaf nutrient scaling relationships vary with sampling location. Front. Plant Sci. 10, 877. doi: 10.3389/fpls.2019.00877
Liu, Y., Li, S., Sun, X., and Yu, X. (2016). Variations of forest soil organic carbon and its influencing factors in east China. Ann. For. Sci. 73, 501–511. doi: 10.1007/s13595-016-0543-8
Lohbeck, M., Lebrija-Trejos, E., Martínez-Ramos, M., Meave, J. A., Poorter, L., and Bongers, F. (2015). Functional trait strategies of trees in dry and wet tropical forests are similar but differ in their consequences for succession. PLoS ONE 10. e0123741. doi: 10.1371/journal.pone.0123741
Long, C., Yang, X., Long, W., Li, D., Zhou, W., and Zhang, H. (2018). Soil nutrients influence plant community assembly in two tropical coastal secondary forests. Trop. Conserv. Sci. 11, 194008291881795. doi: 10.1177/1940082918817956
Long, W., Yang, X., and Li, D. (2012). Patterns of species diversity and soil nutrients along a chrono sequence of vegetation recovery in Hainan Island, South China. Ecol. Res. 27, 561–568. doi: 10.1007/s11284-011-0923-3
Long, W., Zang, R., Wang, X., and Bahadur, S. (2022). Environmental characteristics in tropical cloud forests. In Tropical cloud forest ecology in Hainan Island (Singapore: Springer Nature Singapore), (pp. 3–12).
Long, W., Zhou, Y., Schamp, B. S., Zang, R., Yang, X., Poorter, L., et al. (2020). Scaling relationships among functional traits are similar across individuals, species, and communities. J. Veg. Sci. 31, 571–580. doi: 10.1111/jvs.12893
Lu, X., Zang, R., Ding, Y., and Huang, J. (2018). Partitioning the functional variation of tree seedlings during secondary succession in a tropical lowland rainforest. Ecosphere 9, e02305. doi: 10.1002/ecs2.2305
Marod, D., Sungkaew, S., Mizunaga, H., and Thongsawi, J. (2020). Association of community-level traits with soil properties in a tropical coastal sand dune. Environ. Nat. Resour. J. 18, 101–109. doi: 10.32526/ennrj.18.1.2020.10
Mason, N. W. H., Richardson, S. J., Peltzer, D. A., de Bello, F., Wardle, D. A., et al. (2012). Changes in coexistence mechanisms along a long-term soil chronosequence revealed by functional trait diversity. J. Ecol. 100, 678–689. doi: 10.1111/j.1365-2745.2012.01965.x
McBratney, A., Minasny, B., Padarian Campusano, J., and Amelung, W. (2016). Modeling soil processes: review, key challenges, and new perspectives. Soil Sci. Soc. Am. 15, 131. doi: 10.2136/vzj2015.09.0131
Messier, J., Lechowicz, M. J., McGill, B. J., Violle, C., and Enquist, B. J. (2017). Interspecific integration of trait dimensions at local scales: the plant phenotype as an integrated network. J. Ecol. 105, 1775–1790. doi: 10.1111/1365-2745.12755
Messier, J., McGill, B. J., and Lechowicz, M. J. (2010). How do traits vary across ecological scales? A case for trait-based ecology. Ecol. Lett. 13, 838–848. doi: 10.1111/j.1461-0248.2010.01476.x
Nielsen, R. L., James, J. J., and Drenovsky, R. E. (2019). Functional traits explain variation in chaparral shrub sensitivity to altered water and nutrient availability. Front. Plant Sci. 10, 505. doi: 10.3389/fpls.2019.00505
Olde Venterink, H. (2011). Does phosphorus limitation promote species-rich plant communities? Plant Soil 345, 1–9. doi: 10.1007/s11104-011-0796-9
Ordoñez, J. C., van Bodegom, P. M., Witte, J. P. M., Wright, I. J., Reich, P. B., and Aerts, R. (2009). A global study of relationships between leaf traits, climate and soil measures of nutrient fertility. Glob. Ecol. Biogeogr. 18, 137–149. doi: 10.1111/j.1466-8238.2008.00441.x
Pan, F., Liang, Y., Wang, K., and Zhang, W. (2018). Responses of fine root functional traits to soil nutrient limitations in a karst ecosystem of southwest China. Forests 9, 743. doi: 10.3390/f9120743
Pérez-Harguindeguy, N., Díaz, S., Garnier, E., Lavorel, S., Poorter, H., Jaureguiberry, P., et al. (2016). Corrigendum to: New handbook for standardized measurement of plant functional traits worldwide. Aust. J. Bot. 64, 715. doi: 10.1071/BT12225_CO
Poorter, H., Lambers, H., and Evans, J.R. (2014). Trait correlation networks: a whole-plant perspective on the recently criticized leaf economic spectrum. New Phytol. 201, 378–382. doi: 10.1111/nph.12547
Poorter, H., Niinemets, Ü., Poorter, L., Wright, I. J., and Villar, R. (2009). Causes and consequences of variation in leaf mass per area (LMA): a meta-analysis. New Phytol. 182, 565–588. doi: 10.1111/j.1469-8137.2009.02830.x
Prach, K., and Walker, L. R. (2011). Four opportunities for studies of ecological succession. Trends Ecol. Evol. 26, 119–123. doi: 10.1016/j.tree.2010.12.007
R Core Development Team (2016). A Language and Environment for Statistical Computing. Vienna, Austria: R Foundation for Statistical Computing. Available online at: www.R-project.org/ (accessed June 16, 2023).
Raevel, V., Violle, C., and Munoz, F. (2012). Mechanisms of ecological succession: insights from plant funcional strategies. Oikos 121, 1761–1770. doi: 10.1111/j.1600-0706.2012.20261.x
Reich, P. B. (2014). The world-wide ‘fast-slow' plant economics spectrum: a traits manifesto. J. Ecol. 102, 275–301. doi: 10.1111/1365-2745.12211
Reich, P. B., Wright, I. J., Cavender-Bares, J., Craine, J. M., Oleksyn, J., Westoby, M., et al. (2003). The evolution of plant functional variation: traits, spectra, and strategies. Int. J. Plant Sci. 164, S143–S164. doi: 10.1086/374368
Roman, L., Scatena, F. N., Bruijnzeel, L. A., Scatena, F. N., and Hamilton, L. S. (2011). “Global and local variations in tropical montane cloud forest soils,” in Tropical montane cloud forest, eds. L. S., Hamilton, J. O., Juvik, and F. N. Scatena (Cambridge: Cambridge University Press) 77–89. doi: 10.1017/CBO9780511778384.008
Sakschewski, B., von Bloh, W., Boit, A., Rammig, A., Kattge, J., Poorter, L., et al. (2015). Leaf and stem economics spectra drive diversity of functional plant traits in a dynamic global vegetation model. Glob. Chang. Biol. 21, 2711–2725. doi: 10.1111/gcb.12870
Scheiner, S. M., Mitchell, R. J., and Callahan, H. S. (2000). Using path analysis to measure natural selection. J. Evol. Biol. 13, 423–433. doi: 10.1046/j.1420-9101.2000.00191.x
Si tu, S. J. (1987). Study on the Historical Land Exploitation of Hainan Island. Haikou: Hainan Press.
Siefert, A. (2014). Intraspecific trait variation and community assembly in Oldfield grasslands. PhD Thesis, Syracuse University, Syracuse, NY.
Siefert, A., Violle, C., Chalmandrier, L., Albert, C. H., Taudiere, A., Fajardo, A., et al. (2015). A global meta-analysis of the relative extent of intraspecific trait variation in plant communities. Ecol. Lett. 18, 1406–1419. doi: 10.1111/ele.12508
Spence, J. R., Langor, D. W., Jacobs, J. M., Work, T. T., and Volney, W. J. A. (2008). Conservation of forest-dwelling arthropod species: simultaneous management of many small and heterogeneous risks. Can. Entomol. 140, 510–525. doi: 10.4039/n07-LS05
Trujillo, W., Rivera-Rondón, C. A., and Balslev, H. (2021). Palm functional traits, soil fertility and hydrology relationships in western amazonia. Front. For. Glob. Chang. 4, 723553. doi: 10.3389/ffgc.2021.723553
Turnbull, M. H., Griffin, K. L., Fyllas, N. M., Lloyd, J., Meir, P., and Atkin, O. K. (2016). Separating species and environmental determinants of leaf functional traits in temperate rainforest plants along a soil development chrono sequence. Funct. Plant Biol. 43, 751–765. doi: 10.1071/FP16035
Van Gelder, H. A., Poorter, L., and Sterck, F. J. (2006). Wood mechanics, allometry, and life-history variation in a tropical rain forest tree community. New Phytol. 171, 367–378. doi: 10.1111/j.1469-8137.2006.01757.x
van Ommen Kloeke, A. E. E., Douma, J. C., Ordonez, J. C., Reich, P. B., and Van Bodegom, P. M. (2012). Global quantification of contrasting leaf life span strategies for deciduous and evergreen species in response to environmental conditions. Global Ecol. Biogeogr. 21, 224–235. doi: 10.1111/j.1466-8238.2011.00667.x
Vendramini, F., Diaz, S., Gurvich, D. E., et al. (2002). Leaf traits as indicators of resource-use strategy in floras with succulent species. New Phytol. 154, 147–157. doi: 10.1046/j.1469-8137.2002.00357.x
Verheijen, L. M., Brovkin, V., Aerts, R., Bönisch, G., Cornelissen, J. H. C., Kattge, J., et al. (2013). Impacts of trait variation through observed trait–climate relationships on performance of an Earth system model: a conceptual analysis. Biogeosciences 10, 5497–5515. doi: 10.5194/bg-10-5497-2013
Vitousek, P., and Sanford, R. L. (1986). Nutrient cycling in moist tropical forest. Ann. Rev. Ecol. System. 17, 137–167. doi: 10.1146/annurev.es.17.110186.001033
Wardle, D. A. (2016). Do experiments exploring plant diversity-ecosystem functioning relationships inform how biodiversity loss impacts natural ecosystems? J. Veg. Sci. 27, 646–653. doi: 10.1111/jvs.12399
Weiher, E., Werf, A., Thompson, K., Roderick, M., Garnier, E., and Eriksson, O. (1999). Challenging Theophrastus: A common core list of plant traits for functional ecology. J. Veg. Sci. 10, 609–620. doi: 10.2307/3237076
Westoby, M., Falster, D. S., Moles, A. T., Vesk, P. A., and Wright, I. J. (2002). Plant ecological strategies: some leading dimensions of variation between species. Annu. Rev. Ecol. Syst. 33, 125–159. doi: 10.1146/annurev.ecolsys.33.010802.150452
Wright, I. J., Reich, P. B., Cornelissen, J. H. C., Falster, D. S., Groom, P. K., Hikosaka, K., et al. (2005). Modulation of leaf economic traits and trait relationships by climate. Glob. Ecol. Biogeogr. 14, 411–421. doi: 10.1111/j.1466-822x.2005.00172.x
Wright, I. J., Reich, P. B., Westoby, M., Ackerly, D. D., Baruch, Z., Bongers, F., et al. (2004). The worldwide leaf economics spectrum. Nature 428, 821–827. doi: 10.1038/nature02403
Xiao, Y., Liu, S., Tong, F., Chen, B., and Kuang, Y. (2018). Dominant species in subtropical forests could decrease photosynthetic n allocation to carboxylation and bioenergetics and enhance leaf construction costs during forest succession. Front. Plant Sci. 9, 117. doi: 10.3389/fpls.2018.00117
Yaseen, M., Long, W., Khalid, F., Bahadur, S., and Noushahi, H. A. (2022). Shifts in community vegetative organs and their dissimilar trade-off patterns in a tropical coastal secondary forest, Hainan Island, Southern China. Diversity, 14, 823.
Zanne, A. E., Westoby, M., Falster, D. S., Ackerly, D. D., Loarie, S. R., et al. (2010). Angiosperm wood structure: global patterns in vessel anatomy and their relation to wood density and potential conductivity. Am. J. Botany 97, 207–215. doi: 10.3732/ajb.0900178
Zhang, W., Zhao, J., Pan, F., Li, D., Chen, H., and Wang, K. (2015). Changes in nitrogen and phosphorus limitation during secondary succession in a karst region in southwest China. Plant Soil 391, 77–91. doi: 10.1007/s11104-015-2406-8
Keywords: regression analyses, principal component analysis, tropical coastal secondary forest, community-weighted mean, soil nutrients
Citation: Yaseen M, Khan WR, Bahadur S, Batool F, Khalid F, Ahmed U and Ashraf M (2023) Intra- and inter-specific responses of plant functional traits to environmental variables: implications for community ecology in the tropical monsoonal dwarf forest on Hainan Island. Front. For. Glob. Change 6:1198626. doi: 10.3389/ffgc.2023.1198626
Received: 01 April 2023; Accepted: 17 May 2023;
Published: 17 July 2023.
Edited by:
Uttam Kumar Sahoo, Mizoram University, IndiaReviewed by:
Rajiv Pandey, Indian Council of Forestry Research and Education (ICFRE), IndiaBhupendra Singh, VCSG Uttarakhand University, Ranichauri, India
Copyright © 2023 Yaseen, Khan, Bahadur, Batool, Khalid, Ahmed and Ashraf. This is an open-access article distributed under the terms of the Creative Commons Attribution License (CC BY). The use, distribution or reproduction in other forums is permitted, provided the original author(s) and the copyright owner(s) are credited and that the original publication in this journal is cited, in accordance with accepted academic practice. No use, distribution or reproduction is permitted which does not comply with these terms.
*Correspondence: Waseem Razzaq Khan, a2hhbndhc2VlbUB1cG0uZWR1Lm15