 Stephanie P. George-Chacon1
 T. Luke Smallman2
 Juan Manuel Dupuy1
 José Luis Hernández-Stefanoni1
 David T. Milodowski2
 Mathew Williams2*
- 1Centro de Investigación Científica de Yucatán, Mérida, Yucatán, Mexico
- 2School of GeoSciences and NCEO, University of Edinburgh, Edinburgh, United Kingdom
Tropical forests hold large stocks of carbon in biomass and face pressures from changing climate and anthropogenic disturbance. Forests' capacity to store biomass under future conditions and accumulate biomass during regrowth after clearance are major knowledge gaps. Here we use chronosequence data, satellite observations and a C-cycle model to diagnose woody C dynamics in two dry forest ecotypes (semi-deciduous and semi-evergreen) in Yucatán, Mexico. Woody biomass differences between mature semi-deciduous (90 MgC ha−1) and semi-evergreen (175 MgC ha−1) forest landscapes are mostly explained by differences in climate (c. 60%), particularly temperature, humidity and soil moisture effects on production. Functional variation in foliar phenology, woody allocation, and wood turnover rate explained c. 40% of biomass differences between ecotypes. Modeling experiments explored varied forest clearance and regrowth cycles, under a range of climate and CO2 change scenarios to 2100. Production and steady state biomass in both ecotypes were reduced by forecast warming and drying (mean biomass 2021–2100 reduced 16–19% compared to 2001–2020), but compensated by fertilisation from rising CO2. Functional analysis indicates that trait adjustments amplify biomass losses by 70%. Experiments with disturbance and recovery across historically reported levels indicate reductions to mean forest biomass stocks over 2021–2100 similar in magnitude to climate impacts (10–19% reductions for disturbance with recovery). Forest disturbance without regrowth amplifies biomass loss by three- or four-fold. We conclude that vegetation functional differences across the Yucatán climate gradient have developed to limit climate risks. Climate change will therefore lead to functional adjustments for all forest types. These adjustments are likely to magnify biomass reductions caused directly by climate change over the coming century. However, the range of impacts of land use and land use change are as, or more, substantive than the totality of direct and indirect climate impacts. Thus the carbon storage of Yucatan's forests is highly vulnerable both to climate and land use and land use change. Our results here should be used to test and enhance land surface models use for dry forest carbon cycle assessment regionally and globally. A single plant functional type approach for modeling Yucatán's forests is not justified.
1. Introduction
Tropical forests are major stores of carbon (C) in the biosphere (Mitchard, 2018) and their preservation is a key part of global efforts to avoid dangerous climate change. However, tropical forests may become significant net carbon sources in the future (Chazdon et al., 2016) driven by land use change and by climate change. Each year, large areas of tropical forests are cleared, and either left to regrow or converted to other land uses (Hansen et al., 2013). Increasing temperatures may limit the storage capacity of remaining or regrowing forests (Chazdon et al., 2016; Sullivan et al., 2020). In warmer temperatures carbon storage capacity is hypothesised to reduce with growth rates slowing under rising temperatures and increasing drought (Mitchard, 2018), countering the fertilization effect from increased concentrations of CO2 in the atmosphere (Chazdon et al., 2016).
Tropical forests are currently estimated to be approximately carbon neutral, due to the uptake of carbon by both intact and recovering or secondary forests being roughly equal to the emissions released to the atmosphere from deforestation and forest degradation (Mitchard, 2018). However there are large uncertainties in current estimates of carbon stored in tropical forests, due to a lack of consistent estimations through time, differing estimation methods and their associated uncertainties (Pan et al., 2011; Baccini et al., 2017; Mitchard, 2018). There is evidence that tree mortality is rising with greater atmospheric water stress linked to climate change (Choat et al., 2012; Bauman et al., 2022). The rate and magnitude of carbon recovery by secondary forests are also affected by climate change and anthropogenic disturbance and remain highly uncertain (Pan et al., 2011; Mitchard, 2018).
Understanding the future of tropical forest biomass depends on identifying the importance of direct environmental controls on processes versus functional characteristics of the community. Recovery rates of forest biomass after disturbance will depend on photosynthetic activity, and the allocation of photosynthate to wood. The steady-state storage of biomass in forests will further depend on the mean residence time of wood biomass. Environmental controls on photosynthesis (temperature, rainfall, length of the dry season) (Hofhansl et al., 2015) and mortality are known to vary among different tropical species and forest types (Malhi et al., 2011; Chen et al., 2013) but are poorly characterised. Species' intrinsic residence times and fractional allocation to wood are also variable, depending on life history strategies linked to plant traits such as root to shoot ratios, wood density and bark thickness (Baker et al., 2004). The diversity of tropical forests and the decadal timescales involved argues for regionally targeted studies linked to local long term data to investigate the determinants of biomass dynamics.
This study focuses on tropical dry forests, ecosystems that develop in tropical environments where potential evapotranspiration commonly exceeds precipitation (Murphy and Lugo, 1986) and production therefore has strong seasonal cycles. Woody plants in these ecosystems tend to have higher wood densities in response to a need for higher hydraulic safety, seasonal leaf loss during dry periods, and investment in deep roots for water access in water-limited environments. Tropical dry forests sit on the moisture gradient between tropical moist forests and tropical savannas, and within dry forests there is diversity of structure and function reflecting the moisture environment. Forests adapted to wetter environments are hypothesised to be more susceptible to changes in water availability linked to climate change (Markesteijn et al., 2011; Lohbeck et al., 2013; Poorter et al., 2016). Tropical dry forests are understudied compared to other forest types, severely threatened by deforestation and degradation (Houghton, 2005) and also at risk from climate change.
The Yucatán Peninsula (YP) hosts the second largest continuous extent of tropical forest in Latin America (Dupuy et al., 2015) following the Amazon rainforest. The YP contains a complex dry tropical forest landscape with a mosaic of land uses and forest cover types. There is a precipitation gradient from the drier north west (mean annual precipitation of 500 mm) and more humid south-east (MAP 1,400 mm). Spatial difference in water availability results in three main dry forest types distinguished by their phenology (deciduous, semi-deciduous, semi-evergreen) distributed along the dry to wet gradient. Deciduous and semi-deciduous forests are found in the drier northwest. Semi-evergreen forests extend through the south-east portion (Ellis et al., 2019). The YP has a long history of forest use, shaping the landscape into a mosaic of forests in different stages of secondary succession.
Yucatán's forests are under severe anthropogenic pressure (Ellis et al., 2017). Global Forest Watch reports that Yucatán state saw disturbance to 17% of its forest cover 2001–2021 (0.85% yr−1). In neighbouring Quintana Roo state 15% of its forest cover was disturbed during the same period (0.75% yr−1). Independent estimates of deforestation and degradation rates across the YP suggest similar values, with a mean value of 0.9%, varying among states from 0.5 to 1.3% (Ellis et al., 2020). Annual rates of deforestation across YP vary spatially depending on land cover, protected area status, and local management practices. The interaction of varying rates of disturbance with biomass recovery under potential climate change has not been investigated nor compared to the extreme case where land use change prevents forest recovery after disturbance. Under future land use pressures, the lower limit of biomass loss would be associated with forest clearance followed by immediate forest regrowth. The upper limit of loss would occur under clearance and immediate land use change to agriculture.
In this work we address the knowledge gaps identified above by answering the following research questions (RQs):
RQ1 What are the climate and vegetation functional characteristic controls on biomass accumulation rate and steady-state woody biomass for two dry forest ecosystem types in the Yucatán Peninsula?
RQ2 How are steady-state biomass stocks likely to change under future environmental conditions in the YP?
RQ3 What are the potential recovery rates and stocks of woody biomass under different frequencies of forest clearance and with immediate or no forest recovery.
RQ4 What is the relative importance of global factors (climate and atmospheric effects) versus local factors (clearance rate with and without recovery) on the mean biomass stocks of the YP forests over the period 2021–2100?
Flack-Prain et al. (2019) investigated the drivers of variation in GPP across a moisture gradient in the tropical forests of the Amazon basin and found that indirect effects of climate via ecosystem functional characteristics accounted for 54% of variation in GPP. Direct effects of climate accounted for only 16% of observed variance. Assuming that biomass has similar sensitivity, for RQ1 we hypothesise that biomass differences between sites will be controlled primarily by functional trait differences and secondarily by climate differences. Following Flack-Prain et al. (2019), we hypothesise that phenological differences between forest types will be the most important trait controls on biomass through GPP.
For RQ2, we expect that the CO2 fertilization effect will balance climate-driven reductions at low CO2 emissions scenarios leading to no change in biomass, but for high CO2 emissions scenarios we expect climate-driven reductions will be larger than CO2 fertilisation leading to net reductions in biomass. Following the analyses of Wright et al. (2013) and Flack-Prain et al. (2019) on GPP sensitivity, we hypothesise that biomass stocks will be more sensitive to changes in climate in the more productive (semi-evergreen) forests.
For RQ3 forest mean biomass will be strongly reduced in landscapes where forest regrowth is prevented after clearance compared to landscapes where regrowth is allowed. We hypothesise the lower limit (minimum) of biomass reduction caused by forest clearance and regrowth will be relatively greater in semi-evergreen forests than semi-deciduous, related to the higher biomass in undisturbed semi-evergreen forests.
For RQ4 we hypothesise that climate change will reduce wood C stocks by 5–10% consistent with estimates from inventory data shown for YP in Sullivan et al. (2020). We further hypothesise that reductions in wood C stocks from expected forest disturbance rates (c. 1% per annum) will be of similar magnitude given recovery of biomass, but much larger given no recovery (land-use change). We expect semi-evergreen forest biomass to be more sensitive to both climate and land use than semi-deciduous.
To answer our research questions we produce a probabilistic calibration of an intermediate complexity terrestrial carbon-cycle model, DALEC (Williams et al., 2005; Bloom and Williams, 2015) with multi-decadal chronosequence data on forest age and biomass, multi-annual remote sensing estimates of leaf area index (LAI), and environmental drivers for two YP dry forest ecosystem types. We evaluate calibrated traits and biomass climate sensitivity to understand and partition controls on steady state biomass from functional characteristics and climate. We use model experiments to determine climate and land use sensitivity of biomass. Our approach has similarities to research undertaken in other biomes, for instance in boreal European forests (Smallman et al., 2017; Mäkelä et al., 2020).
The rigour of this study arises from combining multiple independent data sets (forest plot biomass chronosequences, satellite LAI time series) to produce a probabilistic calibration of a process-model for system diagnostics. The analyses for two dominant forest types within YP allows exploration of the key characteristics driving current environmental controls on biomass, providing confidence for model forecasts under environmental change across the YP. The model experiments use well founded global change scenarios for climate and CO2. The future of land use and land use change (LULUC) in the YP could follow a variety of trajectories. To span these trajectories we explore a range of realistic forest clearance rates, and combine these with scenarios that either allow forest regrowth immediately afterwards, or prevent any regrowth (i.e. land use change). The actual impact of future LULUC will be between these two extremes.
2. Methods
The approach used to address the research questions involves using a process model of forest carbon dynamics with a record of application across many forest types, DALEC (Bloom and Williams, 2015; Smallman et al., 2021). The model is calibrated and validated with local data, and then used to (i) diagnose the C cycle of both forest types, and (ii) quantify biomass sensitivity to external forcing. The model provides a full mass balance for live and dead C pools, major biogenic fluxes and their climate and CO2 sensitivities. The model is intermediate in complexity, with 25 calibrated parameters and seven initial conditions for state variables. This level of complexity is optimal for robust forecasting (Famiglietti et al., 2021) given available data for calibration. Model calibration is achieved with a Bayesian approach that generates posterior estimates of parameters with uncertainties. Parameter uncertainties can be propagated through model experiments into forecast uncertainties. Explicit treatment of uncertainty supports interpretation of results and robust decision making.
2.1. Study landscapes
We selected two distinct forest landscapes in the YP with chronosequence observations and which span the major YP climate gradient. These forests typically support around 100 tree species per hectare (Hernández-Stefanoni et al., 2006; Gutiérrez-Granados et al., 2011) more than half of which have commercial timber value. The hotter and more arid landscape, at Kaxil Kiuic (KK, mean air temperature 27.3°C, mean annual precipitation 1,080 mm yr−1), is mostly a semi-deciduous forest ecotype, located in central YP. The KK landscape is situated between 19.61° and 20.16° North latitude and 89.27° and 89.84° West longitude. KK is situated in the transition zone between the drier north-west and the wetter south-east, and is dominated by mid-stature (8–12 m) semi-deciduous forest, but with some presence of low deciduous forest and low evergreen forest. There is some slash and burn agriculture in this landscape, but a portion is protected and fire incidence is low. The annual rate of forest cover loss during 1985–2010 was estimated at 0.85% yr−1 (Dai et al., 2014).
The other landscape, Felipe Carrillo Puerto (FCP), is a cooler, more humid semi-evergreen forest ecotype located in the south eastern region of the YP (MAT 26.4°C, MAP 1301 mm yr−1). The FCP landscape is situated between 19.98° and 19.53° North latitude and between 88.02° and 88.60° West longitude (Figure 1). FCP is dominated by mid-stature (15–30 m) semi-evergreen forest and some low evergreen forest. The landscape has some low impact selective logging and fire incidence is low.
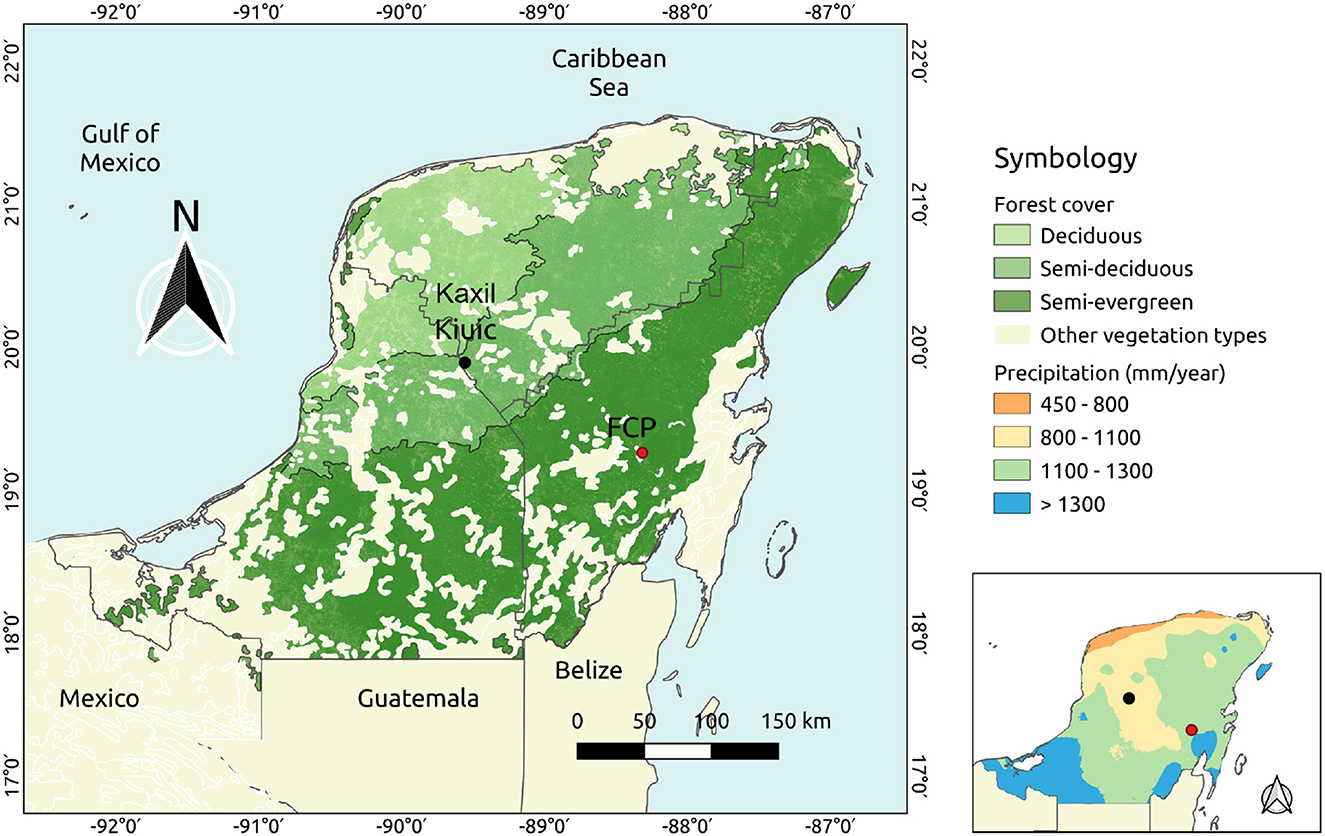
Figure 1. Location of study sites Kaxil Kiuic (KK) and Felipe Carrillo Puerto (FCP) land cover distiribution across the Yucatán Peninsula. The panel lower right shows total annual precipitation (mm) in the Yucatán peninsula.
2.2. Ecological data for calibrating the DALEC model
2.2.1. Woody biomass regrowth data
We obtained chronosequence (i.e. space for time substitution) data for 276 semi-deciduous forest plots within KK (Hernández-Stefanoni et al., 2011) and 86 semi-evergreen forest plots within FCP (Miranda-Plaza, 2014). Each plot covers 200 m2 within which DBH for trees and shrubs > 5 cm in DBH (measured at 1.30 m) were recorded. Total woody biomass was determined from allometric equations (Chave et al., 2005). Plot age was determined from local interviews conducted by Hernández-Stefanoni et al. (2011) and Miranda-Plaza (2014). To provide a temporally consistent time series of wood stock estimates and uncertainties we fitted these data to a logistic curve for each region.
2.3. Climate scenarios and forcing data
2.3.1. Contemporary meteorology
Contemporary meteorological drivers for the two study regions were drawn from the CRU-JRAv1.1 dataset, a 6-hourly 0.5 × 0.5° reanalysis (Harris, 2019). Atmospheric CO2 concentration is taken from the Mauna Loa global CO2 concentration (www.esrl.noaa.gov/gmd/ccgg/trends/, accessed: 22/08/2020). DALEC is driven by monthly average information on air temperature, short-wave radiation, atmospheric CO2 concentration, vapour pressure deficit, and precipitation (Supplementary Figure 1). To calibrate DALEC using the chronosequence information the contemporary meteorology (2001–2017) was looped to create a time series spanning 119 years. The growth of observed biomass stocks in the chronosequence has necessarily been affected more by recent climate as all plots were measured in 2009 and 2014.
A historical fire regime was imposed on the analyses, driven by MODIS derived burned area products (Giglio et al., 2010) which have monthly and 500 m resolution. Landscape data for KK and FCP for the observational period, 2001–2017, were extracted. Similar to the meteorological drivers these data were looped to create the 119 year time series for the chronosequence simulations.
2.3.2. Future meteorology
To project modeling to 2100, future climate drivers were extracted from the UK Earth System Model (UKESM; Sellar et al., 2019) (Supplementary Figure 1). This study focuses on scenarios spanning a mean global warming of 1.7–5°C (O'Neill et al., 2016) (Supplementary Table 1). A total of six SSPs are simulated to describe the range of ecosystem response to climate change and elevated CO2 concentrations. Future climate is imposed by applying the mean anomaly during the overlap period between the CRU-JRA v1.1 and the UKESM simulated climate. Historical burned area data was used as a driver into all forecasts, hence there were no changes in fire incidence.
2.3.3. Soil carbon
The SoilGrids database provided information on soil carbon stocks and texture (sand / clay fractions) (Hengl et al., 2017). The SoilGrids dataset is temporally undefined, and so is assumed to be nominally valid for the contemporary period. The soil carbon estimate provides an observational constraint on the initial soil carbon stock, i.e. January 2001. We estimated soil C stock uncertainty using the standard deviation of the spatial aggregation to 1 x 1 km (KK = 14%, FCP = 21%). We assumed no limit on rooting depth for any soils.
2.3.4. Leaf area index
Time series information on leaf area index (LAI) magnitude and uncertainty was extracted from the 1 × 1 km, 8-day Earth Observation (EO) product from the Copernicus Service Information (2020). We applied the maximum uncertainty value reported from the raw data used in the aggregation of each time step. The LAI observations constrained DALEC model dynamics during the observational period 2001–2017 only, to preserve coupled dynamics between LAI variations and meteorology. Based on plot location data, LAI was derived as the mean of observations across the spatial domains covered by mature rather than regrowing forests. We assessed the extracted LAI and determined there were no strong positive trends which could suggest an expanding rather than steady state canopy.
2.4. Calibration and validation of forest (re)growth
2.4.1. DALEC
We use one of the suite of related intermediate complexity terrestrial ecosystem models, DALEC (Data Assimilation Linked Ecosystem Carbon model) (Bloom and Williams, 2015; Smallman et al., 2021). The specific version has been described as M3 in Smallman et al. (2021) and C7 in Famiglietti et al. (2021). This version of DALEC represents the states and fluxes of carbon and water in the ecosystem and their exchanges with the atmosphere. Carbon uptake, via photosynthesis, is allocated to autotrophic respiration (Ra) and plant tissues based on calibrated fixed fractions. DALEC simulates four C pools in live biomass; labile (supports foliage flushing), foliage, wood, and fine roots. Turnover of biomass feeds into two dead organic matter pools (DOM). Each carbon stock and flux within the DALEC model is controlled by one or more parameters which are estimated probabilistically (Supplementary Table 2).
Foliar dynamics are controlled by a day-of-year model determining the timing for both the allocation of labile C to foliage and senescence of the foliar pool (Bloom and Williams, 2015). Plant photosynthesis and ecosystem water cycling in DALEC is simulated by the ACM-GPP-ET sub-model (Smallman and Williams, 2019). Photosynthesis is simulated as a function of leaf area index, meteorology, and soil available water supply. Soil available water supply is determined as a function of root surface area of water uptake (from fine root biomass), rooting depth (linked to woody biomass), and soil moisture content within the rooting zone. The soil water pool dynamics are a function of precipitation, interception and evaporation by the canopy, surface runoff, evaporation, drainage and transpiration by vegetation.
2.4.2. CARDAMOM calibration and validation
We use the CARbon DAta MOdel fraMework (CARDAMOM; Bloom et al., 2016) to retrieve ensembles of DALEC parameters independently for each ecotype. CARDAMOM uses a Bayesian approach within an Adaptive Proposal-Markov Chain Monte Carlo (AP-MCMC; Haario et al., 2001; Roberts and Rosenthal, 2009) to estimate the likelihood of proposed parameter sets by determining the model-observation error weighted by their uncertainties. The AP-MCMC retrieves ensembles of parameters separately for both forest types that are consistent with their observations, meteorology, and model structure. The approach used here is more fully described in Smallman et al. (2017). We use ecological and dynamical constraints (EDCs, Bloom and Williams, 2015) to prevent the acceptance of parameters that result in ecologically unrealistic C dynamics (exponential changes in the absence of disturbance) or trait combinations (e.g., root lifespans > wood lifespan). We adjusted EDCs to allow for rapid regrowth relative to the initial value by loosening the exponential change restrictions (Equation S4 in Bloom et al., 2016) with the following condition which must be met
where Sinput−yr1 is the C input to a given pool in the first year, Soutput−yrx is the C output from a given pool in year x. This test allows a sustained rapid growth but not a rapid growth in the first year followed by an immediate or rapid change to steady state in the second year. The final 17 years of the calibration period nominally correspond to 2001–2017 and include many LAI estimates to calibrate the LAI dynamics in mature forest (Supplementary Figure 2).
A validation process involved several tests including (i) the robustness of the calibrated model estimates of biomass accumulation and LAI dynamics for both forest types; (ii) consistency in identifying the correct leaf life spans; (iii) consistency of calibrations with independent data on leaf traits and litter stocks.
2.5. Analysis of historical forest states and processes (RQ1)
Calibration for the two forest types generated posterior distributions for model parameters. These parameters are linked to ecological traits and processes. The difference between the parameter priors and posteriors indicates the degree of constraint provided by the observational data on the process related to that parameter. We determine the ratio between the 95% confidence interval (CI) for the posterior distribution and the parameter prior range. Subtracting this ratio (fraction) from 1 determines the fractional reduction in the parameter prior generated by data assimilation.
A paired comparison between the two ecosystem types of each posterior parameter distribution was undertaken based on the degree of overlap, using R v3.6.3 and the “overlapping” library (Pastore, 2018). Of the trait overlaps examined, we pick out as a threshold those where overlaps < 0.5 and so are indicative of significant probabilistic differences between traits.
Model simulations, using calibrated parameters and historical climate, provide steady state C cycle estimates for both forest types. Flux and stock estimates are generated as distributions, and summarised by median estimates and 95% CI. A significant difference criteria for comparisons between forest ecotypes was based on whether the median flux and stock estimates for either type were within the 95% CI of the other. Full C cycle estimates are generated with uncertainties for both forest types.
Steady state C stocks determined using data for forest x and local climate drivers are noted as . To address RQ1, the parameter calibrations and ecosystem states for a forest type x were then forced using the meteorological data from the alternate type y to a new climate steady state C stock . Thus, the semi-deciduous forest calibration was forced with historical FCP climate to a new steady state wood C stock . The shift in steady state wood biomass under each climate swap experiment was then quantified. To aid the understanding and ranking of GPP sensitivity to key traits and their related processes, we determine the parameter specific correlation with GPP (ρGPP, Supplementary Table 2).
2.6. Climate and CO2 change experiments (RQ2)
The DALEC model with both ecotype calibrations was forced with varied climate and CO2 projections from UKESM SSPs (Supplementary Figure 1). These experiments investigate the climate sensitivity of future C dynamics and biomass stocks. To understand the independent effects of global change on the wood C stocks of both ecotypes (RQ2), experiments estimated the effect of climate change and the increase in atmospheric CO2 concentration separately and then combined.
2.7. Disturbance and recovery experiments (RQ3)
We undertook simulations to determine the accumulation rates of biomass during recovery after disturbance, and the effect of varied frequencies of clearance only, and clearance and forest recovery, on mean landscape wood biomass under contemporary climate (RQ3). We generated an ensemble of outputs relating mean biomass 2021–2100 to forest clearances with frequencies spanning 0.15–1.25% per annum, with or without recovery. Generating a large ensemble ensured that varied clearance dates during the 80 year period were included. A clearance resulted in 90% biomass removal imposed on a steady state simulation. An 80-member ensemble was produced by generating model outputs with a single clearance in each of 80 years between 2021 and 2100. The mean biomass of all 80 ensembles provided an estimated mean wood stock for a landscape with random 1.25% per annum cutting frequency. The more infrequent forest % clearance scenarios were then constructed by resampling the 80-member ensemble into a new set of forest landscapes with the appropriate fraction of members undergoing a single cut over the 2021–2100 period. For instance the 0.625% cutting frequency outcome was generated from combining the 80-member ensemble with an 80-member ensemble of the (same) steady state simulation. The process was repeated with and without forest regrowth to span the upper and lower limits of likely impacts.
2.8. Comparison of climate vs. disturbance factors (RQ4)
To address RQ4, we compare the results from climate and climate+CO2 experiments (RQ2, global factor assessment) against results from land use and land use change experiments (RQ3, local factor assessment). For a quantitative comparison, we directly evaluate woody biomass steady state values 2021–2100 simulated under a broad range of climate/CO2 scenarios against those simulated under a range of land use return intervals with and without regrowth. We use analyses across the SSPs to identify and separate the impact of temperature, precipitation and CO2 changes. We use analyses of forest clearances with frequencies spanning 0.15–1.25% per annum with and without regrowth to explore the upper and lower limits to biomass loss related to land use and land use change. The range of SSPs and land use scenarios ensures that uncertainty in these drivers is explicitly included in addressing this research question.
3. Results
3.1. Calibration and validation
The DALEC model calibrations for both forest types simulate C accumulation rates and magnitudes of total wood C which are consistent with estimates from the local chronosequence plot inventory data (Figure 2). The simulated accumulation remains within the age-biomass phase space defined by the chronosequence data. However, the simulated peak rate of biomass accumulation (i.e., slope of the age-biomass curve) is lower than that indicted by the mean of the semi-evergreen forest data. The apparent mean accumulation rate is too rapid for the model to explain based on process constraints. The CARDAMOM calibration process robustly reproduces the magnitudes and seasonal cycles of the LAI earth observation time series over more 17 years (Supplementary Figure 2). Over 2000–2017, at the semi-deciduous forest both satellite observations and the model simulation of LAI range between 1-6, while in semi-evergreen forest the range covered by both is from 3 to 6. The analysis is also consistent with local observations of LAI seasonal amplitudes and minimum values at the semi-deciduous forest (Nafarrate-Hecht et al., 2018).
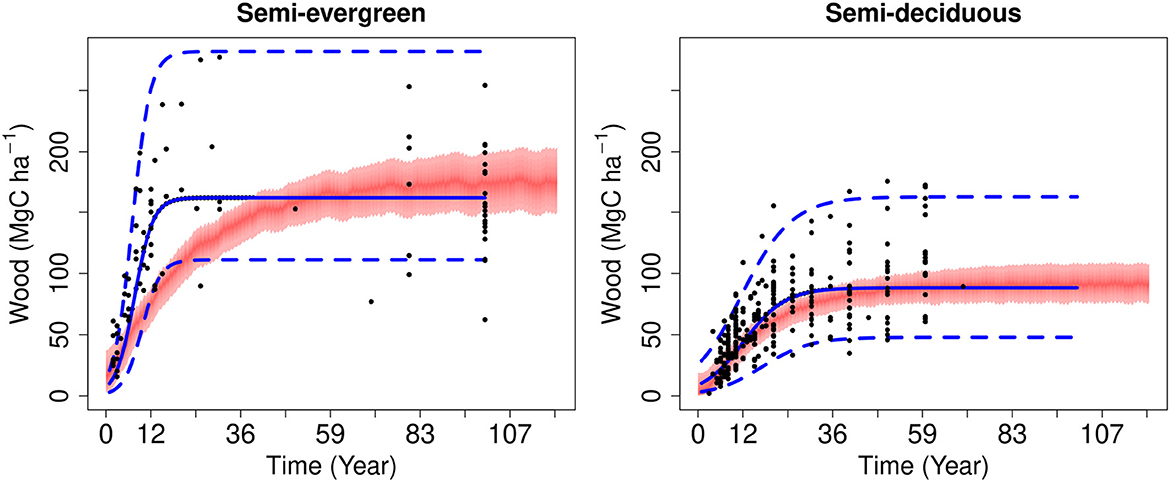
Figure 2. Evaluation of the model calibration of total wood C stocks over time for semi-evergreen (left) and semi-deciduous (right) forests against in situ data. Simulations were undertaken over 119 years, but with climate forcing from 2001 to 2017. The shaded red area indicates the 95% confidence interval on the model calibration. Solid point indicate the field data for each plot in the chronosequence. The solid blue line is the logistic function derived from the mean chronosequence data used to provide wood stock estimates to calibrate DALEC. The upper and lower estimates of the logistic curve are shown in dashed blue.
Leaf C mass per area (LCA), an important leaf trait, is retrieved within CARDAMOM. The retrieved distribution of LCA for semi-deciduous forests (Figure 3) is consistent with an independent estimate of specific leaf area (inversely proportional to LCA) (Sanaphre-Villanueva et al., 2017). The model estimate of median annual aboveground foliar litter fall of 2.82 Mg C ha−1 well matched the independently determined values for this forest type measured in trap data (2.46–3.09 Mg C ha−1) (Morffi-Mestre et al., 2020).
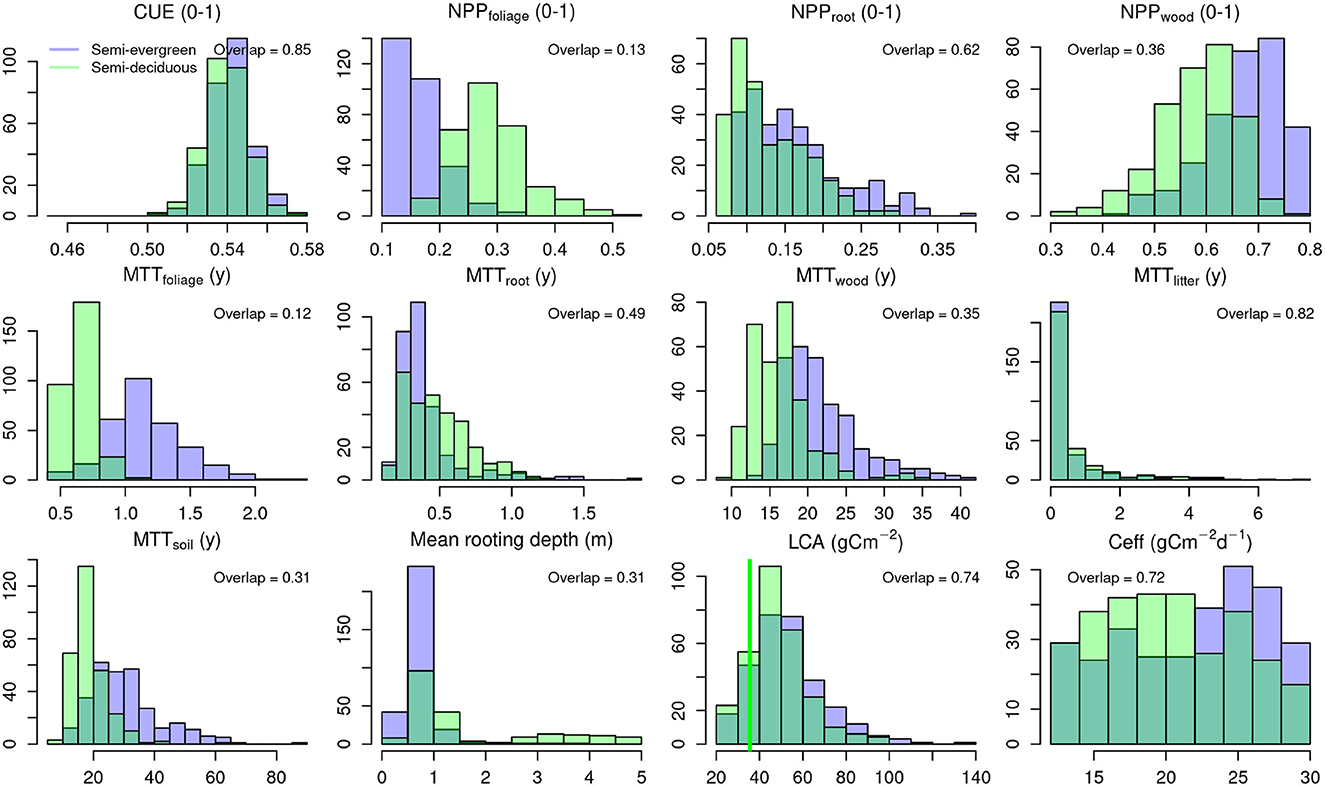
Figure 3. Histograms of posterior distributions of parameters and/or ecosystem traits for semi-deciduous (light green) and semi-evergreen forest ecotypes (blue). The dark green indicates overlap between ecotype distributions, quantified by the overlap statistic. Distributions includes carbon use efficiency (CUE = NPP:GPP); fraction of net primary productivity (NPP) allocated to foliage, fine roots and wood; Mean transit time (MTT) for foliage, fine roots, wood, litter and soil organic matter. The x-axis for the maximum rooting depth has been truncated for clarity by excluding 25 ensemble members (out of a sample of 300) from KK with a mean rooting depth > 5 m. The vertical green line for leaf carbon per unit leaf area (LCA) shows an independent field-based estimate of LCA for KK. Ceff is canopy efficiency of photosynthesis.
3.2. Analysis of historical forest states and processes (RQ1)
3.2.1. Carbon cycling in semi-deciduous and semi-evergreen forest
Both steady-state forest ecotypes have C balances near neutral, with varied levels of confidence at the 95% level (shown in parenthesis). The semi-evergreen forest is estimated to be a marginally stronger net sink (NEE = −56 (−171/−2) gC m−2 y−1), while the semi-deciduous forest is closer to neutral and with a 95% confidence interval which crosses the source sink boundary (NEE = −6 (−42/5) gC m−2 y−1) (see C cycle summaries in Supplementary Figures 3, 4).
The biosphere-atmosphere fluxes are substantively larger in the semi-evergreen forest in nearly all cases. Median gross primary productivity (GPP) is 26% higher (2360 gC m−2 y−1) than in semi-deciduous forest (1,880 gC m−2 y−1). Net primary production is 27% higher and significantly different in the semi-evergreen forest (NPP median estimates for both forests are not contained within the 95% CI of the other forest). Median heterotrophic respiration is 22% greater in the semi-evergreen forest, but not significantly different. Autotrophic respiration in semi-evergreen forest is 24% higher, but not significantly different. Fire has very small impacts on C exchanges in both forests under historical incidences due to low estimates of burned area recorded by MODIS across the study landscapes.
The stocks and dynamics of the wood pool show clear differences between the two forests. Absolute allocation of NPP to wood is significantly larger (47%) for the semi-evergreen forest. Allocation of NPP to foliage is 45% larger at the semi-deciduous forest but not significantly different. Allocation to the labile C pool is significantly larger (5-fold) the semi-deciduous forest. For median C stocks and mortality only in the wood pool are significant differences are found. The wood stock of the semi-evergreen forests is nearly double that of the semi-deciduous forest. Wood mortality, i.e. wood litter production, is 44% larger at the semi-evergreen forest. During the first five years of regrowth after disturbance, modeled biomass accumulation rates were 4.0 MgC ha−1 y−1 in the semi-evergreen forest compared to 2.5 MgC ha−1 y−1 in the semi-deciduous forest.
3.2.2. Trait estimates for semi-deciduous and semi-evergreen forest
Posterior ranges on parameters show a mean 49% reduction in magnitude from the priors for both forest types, but this varies for individual parameters from 4 to 96% reductions. NPP allocation and phenology traits are well constrained (Supplementary Table 2), consistent with these traits' close connections to assimilated data (LAI, biomass time series). Litter and soil organic matter dynamics are less well constrained due to lack of direct observations on these C pools. The model calibration identifies differences in traits between the two forest types relating to allocation of NPP and turnover of C stocks (Figure 3). The semi-evergreen forest has significantly lower proportional NPP allocation to foliage (overlap = 0.13) and higher to wood (overlap = 0.36) and higher foliar residence time (overlap = 0.12) consistent with the expected differences in phenology between forest types (Figure 3). Wood residence time are significantly longer (overlap = 0.35), by 20% for the semi-evergreen forest (medians of 20 years compared to 16 years for semi-deciduous).
Sensitivity tests show that GPP is related most strongly (and positively) to the photosynthetic canopy efficiency (Ceff), maximum root depth, leaf mass per area (LCA) and leaf lifespan in that order (Supplementary Table 2). However, overlap of posterior distributions is high between ecotype Ceff trait posteriors (0.72) suggesting that production differences are not linked to divergence in this trait between forest types. Further there is limited constraint identified on this parameter (Supplementary Table 2). The calibration suggests significantly deeper rooting depths at the drier semi-deciduous forest (overlap 0.31). Estimated rooting depth in the semi-evergreen forest is ≤ 1m, while rooting depth can exceed 5 m in the semi-deciduous forest. Deeper rooting depths might be expected where lower rainfall increases the chance of soil moisture stress. Deeper rooting provides access to a larger pool of soil available moisture and therefore can sustain production in the dry season. The LCA is not significantly different between forest types (overlap 0.74) but leaf lifespans are (overlap 0.12) and this trait controls phenological expression of LAI (Supplementary Figure 2). We conclude that of the rooting depth and leaf lifespan differences between forests are the key traits controlling variation in production.
3.2.3. Sensitivity of steady state wood biomass to climate differences between forest ecotypes
The experimental exchange of climate forcing between forest ecotypes resulted in a convergence in biomass at steady states (Table 1). With nominal climates, wood C stock in the semi-deciduous forest () is 48% of that in the semi-evergreen forest (). Using the model to combine the more humid and cooler FCP climate with the semi-deciduous forest parameters increased biomass () by 38%. Applying the hotter and drier climate of KK to the semi-evergreen forest traits reduced steady state biomass () by 34%. Swapping climate forcing between forests types reduces the difference in steady state biomass by 41% for KK and 72% for FCP. Thus both forest types are highly sensitive to climate change, but semi-evergreen steady biomass is more sensitive than semi-deciduous. On average, climate differences explain 57% of the wood C stock difference between forest types.
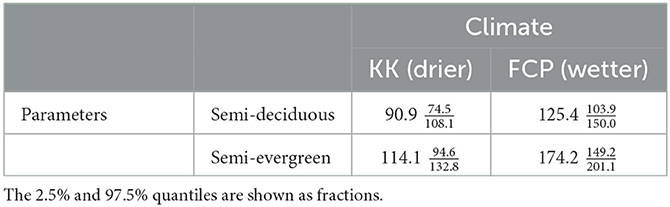
Table 1. Simulated steady state wood C stock estimates (MgC ha−1) generated with climate drivers from either KK (drier) or FCP (wetter), with parameters (functional characteristics) for either semi-deciduous or semi-evergreen forest ecotypes.
3.3. Effect of climate vs CO2 increase on wood stocks in undisturbed forests, RQ2
Climate change scenarios alone (i.e., without CO2 changes) reduced modeled steady-state C stocks 2021–2100 (Figure 4). Mean biomass reduction for both forest types 2021–2100 was greater under more intense climate change, increasing from 11 to 14% in SSP1-2.6 to 22-28% in SSP3-7.0 (Supplementary Figure 5). This simulated decline in wood stocks is due to reduced production. Across all six SSPs, the climate impact on mean biomass 2021–2100 was similar for both ecotypes, but slightly larger for semi-deciduous (19%) than semi-evergreen (16%).
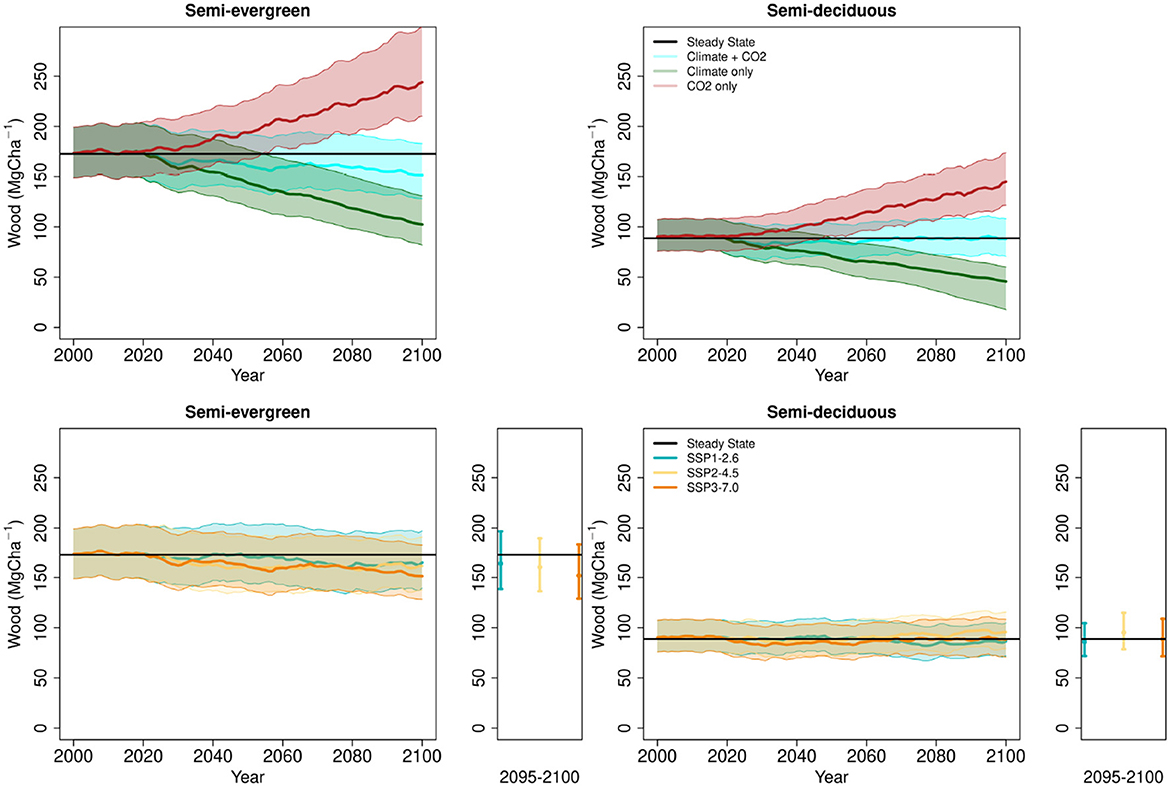
Figure 4. Top row, projection of wood stocks under SSP3-7.0 Wm−1 partitioning the separate effects of climate change and elevated atmospheric CO2 concentrations and the combined impact. Bottom row, projections of wood stocks under three SSPs. Solid lines indicate medians and shaded areas indicate the 2.5% and 97.5% quantiles defining the 95% confidence interval. The small sub-panels indicate the stock distributions for 2095–2100.
Across the climate-only scenarios, the sensitivity of mean biomass 2021–2100 to declines in precipitation and rises in temperature and VPD were linear and of similar magnitude (Figure 5). The future changes in solar radiation were small and had insignificant effects on biomass. Rising CO2 concentration alone increased modeled wood C stocks in both forest types (Figure 5, Supplementary Figure 5). The degree of increase was linked directly to the magnitude of CO2 increase, with a 12–14% increase by 2100 in SSP1-2.6 rising to 35–51% in SSP3-7.0.
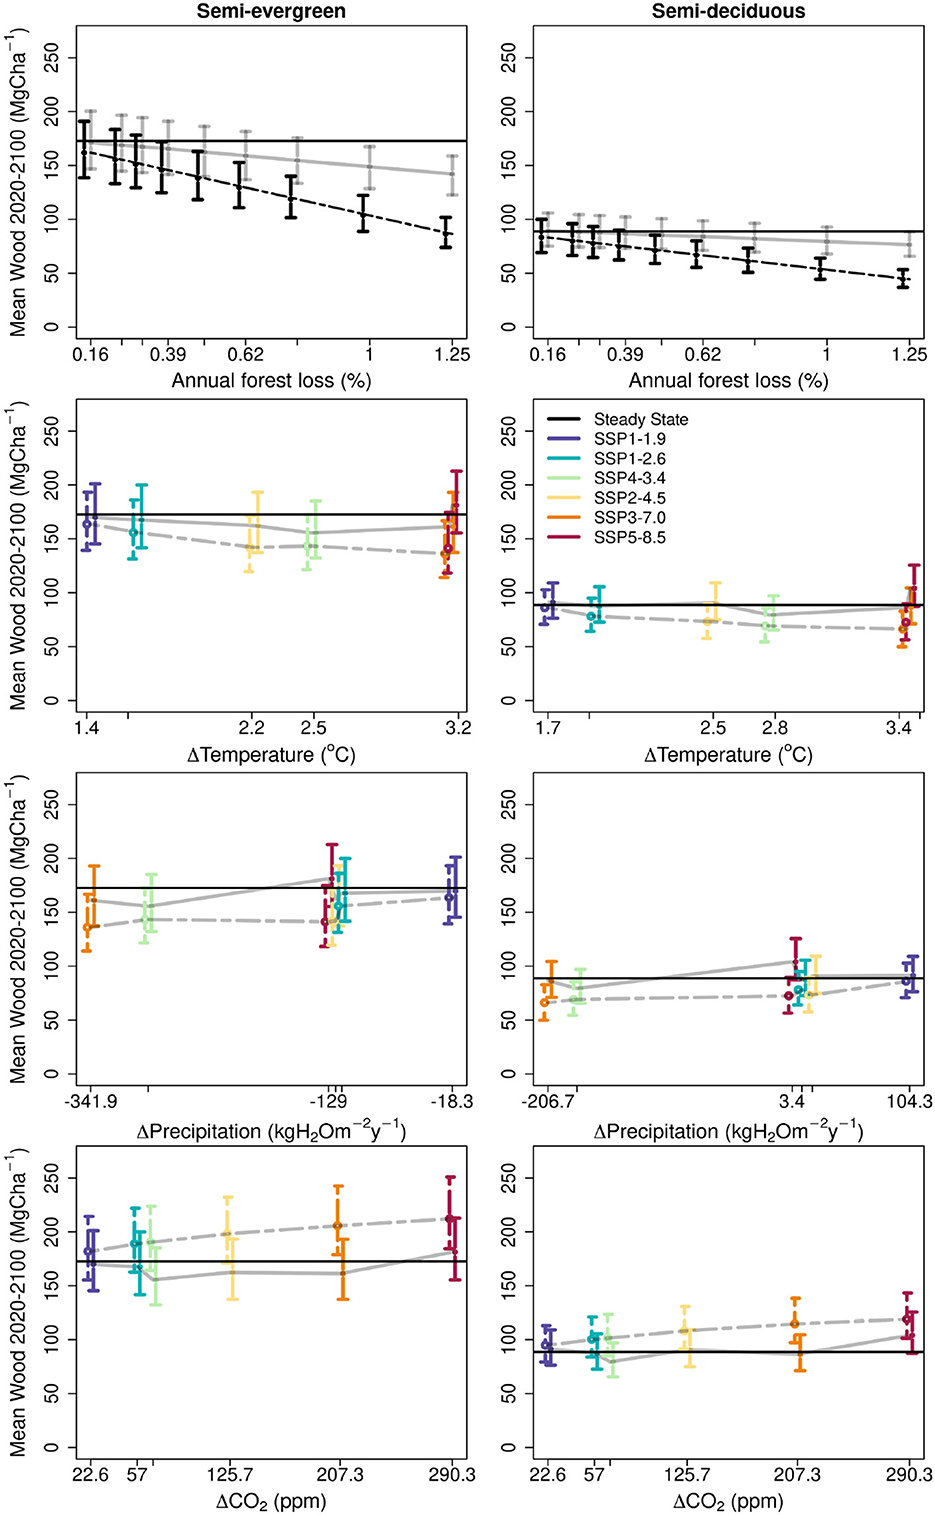
Figure 5. Projected impact by varied factors on mean wood C stocks (2021–2100) for two forest ecotypes assessed against current stocks (black lines). Top row: effect of forest clearance rate under contemporary climate, with regrowth (solid gray line) and without (dashed line). 95% CI indicated by error bars. Lower three rows: Environmental change impact assessed using each of 6 SSPs in the absence of disturbance. The impacts of temperature, precipitation and CO2 enhancement are partitioned across rows. The impact is shown in coloured points (median) and error bars (95% CI) where each colour represents a SSP outcome. A grey line has been added between points to aid identification of trends across intensity. In the temperature and precipitation plots, the isolated climate-only impact is shown using the same colour scheme but using dashed lines. In the CO2 plots the CO2-only impact is shown using the same colour scheme but using dashed lines. In all cases the error bars have been “jittered” to reduce overlap, for clarity.
In full environmental (climate+CO2) scenarios median steady-state C stocks were maintained to 2100 in the semi-deciduous forest and declined slightly (by 6–11%) in the semi-evergreen forest. There is no clear trend in net response across the gradient of change in the varied SSPs (Figure 4, Supplementary Figure 5). The fertilization of production by CO2 broadly compensated for the decreased production arising from changing climate, although for semi-evergreen forests the median effect of climate stress outweighed the CO2 fertilisation effect. However, for neither forest type are net impacts significant at the 95% CI.
3.4. Effect of disturbance, and disturbance and recovery, on median wood stocks, RQ3
Under contemporary climate, increasing frequencies of forest cutting result in a linear decline in mean forest biomass stocks over the period 2021–2100 for both dry forest types (Figure 5). Scenarios without forest recovery (i.e. including land use change) had markedly larger declines in mean wood biomass, three-fold greater in the semi-evergreen forest, and four-fold greater in semi-deciduous forests at clearance rates ≥ 0.5% per year. The relative declines without recovery were equivalent for both forest types (e.g., 50% reduction in biomass at the highest loss rate of 1.25%) as carbon stocks were driven entirely by exogeneous processes. But if regrowth was included, then biological processes resulted in a larger relative reduction in biomass for the semi-evergreen forest. The relative difference was non-linear, and varied from 28% greater loss at the highest annual clearance rates (1.25%) to 49% greater loss at clearance rates of 0.625%. More detailed analyses show that in response to a single deforestation event (90% removal) both forest types recover to a steady state consistent with their undisturbed simulations under the same environmental forcing (Supplementary Figure 6).
3.5. Effect of disturbance and climate change on median wood stocks, RQ4
The individual impacts of varied climate changes (temperature, precipitation), altered [CO2], and disturbance frequencies that span the recent record with and without regrowth, are calculated for both forest types to determine their relative importance for wood biomass stocks across the YP over the rest of this century (2021–2100) (Figure 5). All changes in conditions and land use and land use change result in biomass losses, apart from fertilisation linked to rising [CO2]. Changes in precipitation and temperature are challenging to evaluate individually, but analysis across the SSPs suggests the expected changes in both will have similar magnitudes of effect in reducing wood C stocks (Figure 5). Forest cutting and regrowth scenarios (up to 1.3% yr−1) lead to reductions in biomass from the steady state which are similar in magnitudes to the climate effects for both forest types. Land use change effects, without forest regrowth, result in the largest overall losses of biomass for the region. Annual clearance rates ≥ 0.625% will result in ≥ 25% loss in mean biomass 2021–2100, exceeding the mean impact of the climate change scenarios.
4. Discussion
4.1. Controls on tropical dry forest aboveground biomass at steady state (RQ1)
The undisturbed semi-deciduous and semi-evergreen forests of the Yucatán peninsula are approximately carbon neutral. However, there are major differences in vegetation C cycling and stocks between forest types (Supplementary Figures 3, 4). Semi-evergreen forest is more productive (26% greater GPP) and has larger biomass stocks (91% greater). The difference in steady state wood C stock between the two dry forest types was explained primarily by climate (40–70%) with the remainder (30–60%) associated with functional trait variation between the forests (Figure 2). The hypothesis (RQ1) that climate differences would be a small driver of biomass difference is rejected. Flack-Prain et al. (2019) found that climate difference explained only 16% of GPP differences across an Amazon moisture gradient, a much lower fraction than found here for steady state biomass. The difference probably arises because steady state biomass is the outcome of decades of cumulative GPP. This long-term outcome amplifies the importance of climate effects for biomass and will be linked to the much larger difference in biomass than GPP between forest types.
For functional characteristics, the analysis indicated that higher rates of woody biomass accumulation in semi-evergreen forests were related to (i) longer leaf lifespans, leading to greater mean LAI and higher annual GPP (as hypothesised), and (ii) greater relative allocation of NPP to wood (Figure 3). These results are consistent with theories that plant traits adjust to maximise canopy carbon export over lifespan of leaves (McMurtrie and Dewar, 2011). The higher biomass steady state was linked to both the higher accumulation rates and also to the 20% longer residence times of wood.
Differences in C stocks and cycling between the two ecotypes were strongly explained (57%) by direct climate effects, but the climate effect was strongest in the more productive semi-evergreen forests (Table 1). We infer that the greater climate sensitivity for semi-evergreen forests is linked to the sensitivity of GPP to maximum rooting depth in the model (Supplementary Table 2). There are significant difference in this parameter between ecotypes, with shallower rooting for semi-evergreen forests (Figure 3) making this forest less resilient to climate stress on water supply and demand. Functional variation is also important in explaining the large divergence in wood biomass between ecotypes (42%). This result suggests functional adjustment amplifies climate sensitivity; more productive (low-risk) climates lead to increased expression of high-reward behaviors (such as retention of leaves in the dry season, reduced investment in roots), and vice versa. This conclusion is dependent on analyses from the two research areas (KK, FCP), and needs broader testing, particularly into the deciduous forests of the YP.
4.2. Sensitivity of steady state aboveground biomass to environmental change (RQ2)
The responses of semi-deciduous and semi-evergreen forest to changes of climate and CO2 were similar. For both ecotypes there were no clear differences in net response between multiple environmental scenarios (SSPs), with similar biomass trajectories resulting (Supplementary Figure 5). Expected rises in atmospheric CO2 alone increased biomass (Figure 4). Scenarios of climate change alone reduced biomass stocks in forests, slightly more so proportionally in the semi-deciduous forest. There was no evidence that higher CO2 emissions combined with climate change led to different outcomes for biomass. Climate change effects arose through direct reductions in photosynthetic carboxylation through higher temperatures exceeding optimum values (i.e. >30oC) and higher VPD causing stomatal closure. There were also indirect effects of climate through reduced water availability, caused by reduced precipitation and high evapotranspiration, leading to stomatal closure and productivity reductions (Figure 5). Our results were consistent with climate sensitivity studies from secondary forests in latin America which indicated vulnerability to drought through growth rate reductions (de Meira Junior et al., 2020; Elias et al., 2020).
The greater future climate sensitivity for semi-deciduous forests did not match our hypothesis for RQ2, and diverged from the conclusions from RQ1 for current climate sensitivity. We conclude that future climate extremes, higher in the semi-deciduous forests (Supplementary Figure 1), were more damaging and exceeded modeled physiological thresholds more in this ecotype.
Forecasts are dependent on robust simulation of climate and CO2 responses. The sensitivity to CO2 is simulated based on responses incorporated in the theory of Farquhar (Farquhar and von Caemmerer, 1982). Down-regulating effects such as developing nutrient limitation (e.g., Thomas et al., 2013) are not simulated in DALEC. Enhancement in mortality in biomass C linked to climate change, particularly weather extremes and increased fire risk, is not modeled within DALEC. The forecast experiments did not specify any functional trait changes (Fisher et al., 2018). But our results suggest that the direct effects of climate change in reducing biomass stocks would be amplified by as much as 70% through indirect effects from trait adjustments (Table 1). Shifts to deciduousness and increased allocation to roots, to reduce risk from extreme climate to production, and declines in wood residence time, would lead to these further reductions in woody biomass. Our results here are consistent with broader analyses showing an acceleration of C turnover rates globally has been linked to land use change and climate change (Wu et al., 2020).
4.3. Response of forest biomass to varying disturbance frequencies (RQ3)
There was linear decline of mean biomass stocks 2021–2100 with increasing disturbance rates for both recovery and land use change scenarios (Figure 5). At typical disturbance frequencies, the effect on mean biomass stocks of land use change was three to four-fold greater than under regrowth scenarios. Supporting our hypothesis, the more productive, high biomass semi-evergreen forest had the larger relative decline in biomass compared to the semi-deciduous in the regrowth scenario. This difference is linked to the modeled rate of forest regrowth and maximum biomass of each ecotype. Our calibration of semi-evergreen forest regrowth was at the lower end of observations (Figure 2). This modeled difference between ecotypes may therefore be related to model bias for semi-evergreen forests. However, the growth rate indicated by the median fit to chronosequence data is difficult to reconcile with theoretical NPP limits in the model. Alternate versions of DALEC including density-dependent feedbacks on woody turnover were calibrated and evaluated for a better fit. However, there was no improvement and we therefore retained the simplest model version for this study, noting that recovery rate is expected to lie within the modeled 95% confidence intervals given in the calibration. While there is evidence that depletion of soil nutrients linked to land use may restrict regrowth rates in the YP (Eaton and Lawrence, 2009), such effects were not modeled here.
4.4. The relative importance of global and local change drivers on the stocks of biomass in Yucatán forests (RQ4)
Multiple independent experiments evaluated the importance to mean wood biomass across the YP of local factors, including forest clearance rates and forest functional characteristics, and global factors, including climate and CO2 effects (Figure 5). Climate has a significant role in determination of woody biomass, and in explaining the gradients in forest biomass stocks. Climate acts through direct effects of temperature and VPD on physiological C fixation and indirectly through affecting soil moisture constraints on production. Forecast increases in temperature and VPD, and declines in precipitation (Supplementary Figure 1), will degrade the capacity of Yucatán forests to store C over the coming century (Figure 5). Across the six scenarios explored, the reduction in mean wood biomass stocks 2021–2100 ranged from 6.4 to 22.3% for semi-evergreen forests (mean 16.0%) and 5.4-27.5% for semi-deciduous forests (mean 18.2%). These levels match or exceed the estimates of biomass reduction of 5–10% over YP estimated by Sullivan et al. (2020) for a range of land surface models with a 2oC rise in temperature.
Our analysis suggests that rising atmospheric CO2 will counteract climate effects, so that combined environmental change impacts on wood biomass are small across all SSPs (Figure 4). However, these results represent the high end of expectations. Firstly, we provide evidence that functional characteristics shift towards risk reduction under climate stress. Despite CO2 fertilisation, the rise in stress linked to temperature extremes and water supply reductions is likely to stimulate composition change and functional trait adjustment (e.g. more deciduous phenology) that will reduce mean production and thus biomass stocks (Muller-Landau et al., 2021). Monitoring of phenological changes in dry forests could provide data to test this hypothesis. Increases in fire, currently at a low level, are likely in warmer conditions and would increase wood mortality, and reduce biomass. Finally, CO2 fertilisation is modeled at its potential; other physiological factors are likely to be limiting, including rates of nitrogen and phosphorus cycling. CO2 fertilisation experiments in tropical forests will help to resolve this uncertainty. Our results here would support more robust assessment of land surface models used for regional and global assessment (Fernández-Martínez et al., 2019). Specifically, these results could evaluate for this region (i) the climate and CO2 sensitivity of these models, and (ii) their recovery from disturbance. Most land surface models use plant functional type concepts to simplify their regional parameterisation. Our results here emphasise important functional differences within a single region. Ultimately land surface models have to be adapted to reflect this diversity in ecology.
Forest clearance has direct effects on mean landscape biomass, even with fast biomass recovery rates. Ongoing forest clearance (with subsequent recovery) at historical rates of 0.9% yr−1 (Ellis et al., 2020) over the coming century generates substantive reductions in mean biomass over the period 2021–2100 (Figure 5). With annual cutting frequencies of 0.78–1.25%, comparable to contemporary observations, reductions in steady biomass over the period 2021–2100 are forecast to be 11.5–18.7% in the semi-evergreen and 9.8–16.0% for the semi-deciduous forests. Reductions in biomass will be three to four-fold larger without forest regrowth. Historical records indicate that both forestry, swidden agriculture and land use change is active in the YP, so the likely future impact of land use and land use change will be somewhere between the limits of the best-scenario rates of forest clearance modeled with and without regrowth. We conclude that declines in mean wood stocks over YP landscapes linked to likely rates of forest clearance with subsequent regrowth are of similar magnitude to declines independently associated with climate change. Both climate impacts and land use impacts will be larger than these lower bounds due to functional characteristic changes in forests (70% amplification) and land use change (300–400% amplification).
5. Conclusions
Future changes in climate and land use will put biomass C storage of Yucatán's forests at risk. We have identified substantial climate sensitivity of production in these ecosystems. Future climate will lead to temperature optima being exceeded, and higher VPD and reduced soil moisture causing stomatal closure. CO2 fertilisation may offset the negative effects of changing climate, but modeling here assumes the most optimistic theoretical effects. The detrimental effects of climate change on forest biomass in the Yucatán increase with levels of rising CO2, because higher CO2 is linked to extremes of temperature and VPD. Adjustment of forest traits to climate change, particularly shifts to deciduousness and increased allocation to roots, is a likely response to climate change. These shifts will reduce risks to production but also reduce overall production. The result is that climate-change-driven trait changes may magnify direct climate change reductions to production, and therefore generate further reductions in biomass stocks. These results should be used to test the sensitivity and inform the development and calibration of land surface models for dry tropical biomes. Broader testing of these conclusions across other dry tropical forests can further evaluate the role of biodiversity and vegetation composition in ecosystem climate sensitivity (Muller-Landau et al., 2021). Forest clearance and regrowth linked to patterns of historical land use generates reductions in mean biomass C storage over 2021-2100. These changes are similar in magnitude and within the ranges of expected effects of climate change. Hence both these local and global drivers of change must be taken into account in sustaining the biomass of the Yucatán. Land use change will magnify biomass losses three to four-fold if forests cannot recover post-clearance. Maintaining C storage in Yucatán's forests therefore depends both on limiting levels of land use change, and on meeting the objectives of the Paris Climate Agreement to protect biomass against climate change risks.
Data availability statement
Existing datasets are available in a publicly accessible repository: Datasets used in this study can be found here: [https://doi.org/10.7488/ds/3858]. Analysis source codes for CARDAMOM and DALEC source codes are available on request: Access is provided by Github repository (https://github.com/GCEL/CARDAMOM), access will be made available by the authors, without undue reservation.
Author contributions
SG-C: conceptualization, investigation, formal analysis, and writing original draft. TS: conceptualization, methodology, software, visualization, formal analysis, and reviewing and editing. JD and JH-S: investigation, resources, and reviewing and editing. DM: methodology and reviewing and editing. MW: conceptualization, funding acquisition, supervision, formal analysis, and writing original draft. All authors contributed to the article and approved the submitted version.
Funding
Funding was provided by UK Space Agency Forests 2020 and UK National Centre for Earth Observation.
Acknowledgments
We thank Jessie Au and Matus Seci for helpful comments on the manuscript and Tim Green for useful discussions. This work has made use of the resources provided by the Edinburgh Compute and Data Facility (ECDF) (http://www.ecdf.ed.ac.uk/).
Conflict of interest
The authors declare that the research was conducted in the absence of any commercial or financial relationships that could be construed as a potential conflict of interest.
Publisher's note
All claims expressed in this article are solely those of the authors and do not necessarily represent those of their affiliated organizations, or those of the publisher, the editors and the reviewers. Any product that may be evaluated in this article, or claim that may be made by its manufacturer, is not guaranteed or endorsed by the publisher.
Supplementary material
The Supplementary Material for this article can be found online at: https://www.frontiersin.org/articles/10.3389/ffgc.2023.1204596/full#supplementary-material
References
Baccini, A., Walker, W., Carvalho, L., Farina, M., Sulla-Menashe, D., and Houghton, R. (2017). Tropical forests are a net carbon source based on aboveground measurements of gain and loss. Science 358, 230–234. doi: 10.1126/science.aam5962
Baker, T. R., Phillips, O. L., Malhi, Y., Almeida, S., Arroyo, L., Di Fiore, A., et al. (2004). Increasing biomass in amazonian forest plots. Philos. Trans. R. Soc. Lond., B, Biol. Sci. 359:353–365. doi: 10.1098/rstb.2003.1422
Bauman, D., Fortunel, C., Delhaye, G., Malhi, Y., Cernusak, L. A., Bentley, L. P., et al. (2022). Tropical tree mortality has increased with rising atmospheric water stress. Nature 608, 528–533. doi: 10.1038/s41586-022-04737-7
Bloom, A., Exbrayat, J.-F., Velde, I. R., Feng, L., and Williams, M. (2016). The decadal state of the terrestrial carbon cycle: global retrievals of terrestrial carbon allocation, pools and residence times. Proc. Nat. Acad. Sci. 113, 1285–1290. doi: 10.1073/pnas.1515160113
Bloom, A. A., and Williams, M. (2015). Constraining ecosystem carbon dynamics in a data-limited world: integrating ecological "common sense" in a model-data-fusion framework. Biogeosciences 12, 1299–1315. doi: 10.5194/bg-12-1299-2015
Chave, J., Andalo, C., Brown, S., Cairns, M. A., Chambers, J. Q., Eamus, D., et al. (2005). Tree allometry and improved estimation of carbon stocks and balance in tropical forests. Oecologia 145, 87–99. doi: 10.1007/s00442-005-0100-x
Chazdon, R. L., Broadbent, E. N., Rozendaal, D. M. A., Bongers, F., Zambrano, A. M. A., Aide, T. M., et al. (2016). Carbon sequestration potential of second-growth forest regeneration in the latin american tropics. Sci. Adv. 2, e1501639. doi: 10.1126/sciadv.1501639
Chen, G., Yang, Y., and Robinson, D. (2013). Allocation of gross primary production in forest ecosystems: allometric constraints and environmental responses. New Phytol. 200, 1176–1186. doi: 10.1111/nph.12426
Choat, B., Jansen, S., Brodribb, T. J., Cochard, H., Delzon, S., Bhaskar, R., et al. (2012). Global convergence in the vulnerability of forests to drought. Nature 491, 752–755. doi: 10.1038/nature11688
Dai, Z., Birdsey, R. A., Johnson, K. D., Dupuy, J. M., Hernandez-Stefanoni, J. L., and Richardson, K. (2014). Modeling carbon stocks in a secondary tropical dry forest in the yucatan peninsula, mexico. Water, Air, Soil Pollut. 225, 1–15. doi: 10.1007/s11270-014-1925-x
de Meira Junior, M. S., Pinto, J. R. R., Ramos, N. O., Miguel, E. P., Gaspar, R. d. O., et al. (2020). The impact of long dry periods on the aboveground biomass in a tropical forest: 20 years of monitoring. Carbon Balance Manag. 15:1–14. doi: 10.1186/s13021-020-00147-2
Dupuy, J., Durn Garca, R., Garca Contreras, G., Arellano Morin, J., Acosta Lugo, E., Mndez Gonzlez, M., et al. (2015). Chapter 8: Conservation and Use. Cham: Springer.
Eaton, J. M., and Lawrence, D. (2009). Loss of carbon sequestration potential after several decades of shifting cultivation in the southern yucatn. For. Ecol. Manage. 258, 949–958. doi: 10.1016/j.foreco.2008.10.019
Elias, F., Ferreira, J., Lennox, G. D., Berenguer, E., Ferreira, S., Schwartz, G., et al. (2020). Assessing the growth and climate sensitivity of secondary forests in highly deforested amazonian landscapes. Ecology 101, e02954. doi: 10.1002/ecy.2954
Ellis, E. A., Montero, J., Gmez, I. U. H., Porter-Bolland, L., and Ellis, P. W. (2017). Private property and mennonites are major drivers of forest cover loss in central yucatan peninsula, mexico. Land Use Policy 69:474–484. doi: 10.1016/j.landusepol.2017.09.048
Ellis, E. A., Montero, S. A., Gmez, I. U. H., Montero, J. A. R., Ellis, P. W., Rodr-guez-Ward, D., et al. (2019). Reduced-impact logging practices reduce forest disturbance and carbon emissions in community managed forests on the yucatn peninsula, mexico. For. Ecol. Manage. 437, 396–410. doi: 10.1016/j.foreco.2019.01.040
Ellis, E. A., Navarro Mart-nez, A., Garc-a Ortega, M., Hernndez Gmez, I. U., and Chacn Castillo, D. (2020). Forest cover dynamics in the selva maya of central and southern quintana roo, mexico: deforestation or degradation? J. Land Use Sci. 15, 25–51. doi: 10.1080/1747423X.2020.1732489
Famiglietti, C. A., Smallman, T. L., Levine, P. A., Flack-Prain, S., Quetin, G. R., Meyer, V., et al. (2021). Optimal model complexity for terrestrial carbon cycle prediction. Biogeosciences 18, 2727–2754. doi: 10.5194/bg-18-2727-2021
Farquhar, G., and von Caemmerer, S. (1982). “Modeling of photosynthetic response to the environment,” in Encyclopedia of Plant Physiology. Berlin: Springer-Verlag, p. 549–587.
Fernández-Martínez, M., Sardans, J., Chevallier, F., Ciais, P., Obersteiner, M., Vicca, S., et al. (2019). Global trends in carbon sinks and their relationships with co2 and temperature. Nat. Clim. Chang. 9, 73–79. doi: 10.1038/s41558-018-0367-7
Fisher, R. A., Koven, C. D., Anderegg, W. R., Christoffersen, B. O., Dietze, M. C., Farrior, C. E., et al. (2018). Vegetation demographics in earth system models: a review of progress and priorities. Glob. Chang. Biol. 24, 35–54. doi: 10.1111/gcb.13910
Flack-Prain, S., Meir, P., Malhi, Y., Smallman, T. L., and Williams, M. (2019). The importance of physiological, structural and trait responses to drought stress in driving spatial and temporal variation in gpp across amazon forests. Biogeosciences 16, 4463–4484. doi: 10.5194/bg-16-4463-2019
Giglio, L., Randerson, J. T., van der Werf, G. R., Kasibhatla, P. S., Collatz, G. J., Morton, D. C., et al. (2010). Assessing variability and long-term trends in burned area by merging multiple satellite fire products. Biogeosciences 7, 1171–1186. doi: 10.5194/bg-7-1171-2010
Gutiérrez-Granados, G., Prez-Salicrup, D. R., and Dirzo, R. (2011). Differential diameter-size effects of forest management on tree species richness and community structure: implications for conservation. Biodivers. Conserv. 20, 1571–1585. doi: 10.1007/s10531-011-0046-8
Haario, H., Saksman, E., and Tamminen, J. (2001). An adaptive metropolis algorithm. Bernoulli 7, 223–242. doi: 10.2307/3318737
Hansen, M. C., Potapov, P. V., Moore, R., Hancher, M., Turubanova, S. A., Tyukavina, A., et al. (2013). High-resolution global maps of 21st-century forest cover change. Science 342, 850–853. doi: 10.1126/science.1244693
Harris, I. (2019). Cru jra v1.1: A Forcings Dataset of Gridded Land Surface Blend of Climatic Research Unit (CRU) and Japanese Reanalysis (JRA) Data; Jan.1901–Dec.2017. Centre for Environmental Data Analysis.
Hengl, T., Mendes de Jesus, J., Heuvelink, G. B., Ruiperez Gonzalez, M., Kilibarda, M., Blagoti, A., et al. (2017). Soilgrids250m: global gridded soil information based on machine learning. PLoS ONE 12, e0169748. doi: 10.1371/journal.pone.0169748
Hernández-Stefanoni, J. L., Dupuy, J. M., Tun-Dzul, F., and May-Pat, F. (2011). Influence of landscape structure and stand age on species density and biomass of a tropical dry forest across spatial scales. Landsc. Ecol. 26, 355–370. doi: 10.1007/s10980-010-9561-3
Hernández-Stefanoni, J. L., Pineda, J. B., and Valdes-Valadez, G. (2006). Comparing the use of indigenous knowledge with classification and ordination techniques for assessing the species composition and structure of vegetation in a tropical forest. Environ. Manage. 37, 686–702. doi: 10.1007/s00267-004-0371-8
Hofhansl, F., Schnecker, J., Singer, G., and Wanek, W. (2015). New insights into mechanisms driving carbon allocation in tropical forests. New Phytol. 205, 137–146. doi: 10.1111/nph.13007
Houghton, R. (2005). Aboveground forest biomass and the global carbon cycle. Glob. Chang. Biol. 11, 945–958. doi: 10.1111/j.1365-2486.2005.00955.x
Lohbeck, M., Poorter, L., Lebrija-Trejos, E., Mart-nez-Ramos, M., Meave, J. A., Paz, H., et al. (2013). Successional changes in functional composition contrast for dry and wet tropical forest. Ecology 94, 1211–1216. doi: 10.1890/12-1850.1
Mäkelä, J., Minunno, F., Aalto, T., Mäkelä, A., Markkanen, T., and Peltoniemi, M. (2020). Sensitivity of 21st century simulated ecosystem indicators to model parameters, prescribed climate drivers, rcp scenarios and forest management actions for two finnish boreal forest sites. Biogeosciences 17, 2681–2700. doi: 10.5194/bg-17-2681-2020
Malhi, Y., Doughty, C., and Galbraith, D. (2011). The allocation of ecosystem net primary productivity in tropical forests. Philos. Trans. R. Soc. Lond., B, Biol. Sci. 366, 3225–3245. doi: 10.1098/rstb.2011.0062
Markesteijn, L., Poorter, L., Bongers, F., Paz, H., and Sack, L. (2011). Hydraulics and life history of tropical dry forest tree species: coordination of species” drought and shade tolerance. New Phytol. 191, 480–495. doi: 10.1111/j.1469-8137.2011.03708.x
McMurtrie, R. E., and Dewar, R. C. (2011). Leaf-trait variation explained by the hypothesis that plants maximize their canopy carbon export over the lifespan of leaves. Tree Physiol. 31, 1007–1023. doi: 10.1093/treephys/tpr037
Miranda-Plaza, E. A. (2014). Factores que afectan la estructura de la vegetacin en dos paisajes del bosque tropical seco de la Pen-nsula de Yucatn (2014–04) (Master's thesis). Centro de Investigacion Cientifica de Yucatan, Mérida, Mexico. Available online at: https://cicy.repositorioinstitucional.mx/jspui/handle/1003/1027
Mitchard, E. T. (2018). The tropical forest carbon cycle and climate change. Nature 559, 527. doi: 10.1038/s41586-018-0300-2
Morffi-Mestre, H., ngeles Prez, G., Powers, J. S., Andrade, J. L., Huechacona Ruiz, A. H., May-Pat, F., et al. (2020). Multiple factors influence seasonal and interannual litterfall production in a tropical dry forest in mexico. Forests 11, 12. doi: 10.3390/f11121241
Muller-Landau, H. C., Cushman, K., Arroyo, E. E., Martinez Cano, I., Anderson Teixeira, K. J., and Backiel, B. (2021). Patterns and mechanisms of spatial variation in tropical forest productivity, woody residence time, and biomass. New Phytol. 229, 3065–3087. doi: 10.1111/nph.17084
Murphy, P. G., and Lugo, A. E. (1986). Ecology of tropical dry forest. Annu. Rev. Ecol. Evol. Syst. 17, 67–88. doi: 10.1146/annurev.es.17.110186.000435
Nafarrate-Hecht, A. C., Dupuy-Rada, J. M., George-Chacon, S. P., and Hernndez-Stefanoni, J. L. (2018). Modeling of seasonal leaf area index values in a tropical dry forest using high resolution satellite imagery. Madera y bosques 24, 3. doi: 10.21829/myb.2018.2431666
O'Neill, B. C., Tebaldi, C., Van Vuuren, D. P., Eyring, V., Friedlingstein, P., Hurtt, G., et al. (2016). The scenario model intercomparison project (scenariomip) for cmip6. Geosci. Model Dev. 9, 3461–3482. doi: 10.5194/gmd-9-3461-2016
Pan, Y., Birdsey, R. A., Fang, J., Houghton, R., Kauppi, P. E., Kurz, W. A., et al. (2011). A large and persistent carbon sink in the world's forests. Science 333, 988–993. doi: 10.1126/science.1201609
Pastore, M. (2018). Overlapping: a r package for estimating overlapping in empirical distributions. J. Open Source Softw. 3, 1023. doi: 10.21105/joss.01023
Poorter, L., Bongers, F., Aide, T. M., Almeyda Zambrano, A. M., Balvanera, P., Becknell, J. M., et al. (2016). Biomass resilience of neotropical secondary forests. Nature 530, 211–214. doi: 10.1038/nature16512
Roberts, G. O., and Rosenthal, J. S. (2009). Examples of adaptive mcmc. J. Comput. Graph. Stat. 18, 349–367. doi: 10.1198/jcgs.2009.06134
Sanaphre-Villanueva, L., Dupuy, J. M., Andrade, J. L., Reyes-Garc-a, C., Jackson, P. C., and Paz, H. (2017). Patterns of plant functional variation and specialization along secondary succession and topography in a tropical dry forest. Environm. Res. Lett. 12, 055004. doi: 10.1088/1748-9326/aa6baa
Sellar, A. A., Jones, C. G., Mulcahy, J. P., Tang, Y., Yool, A., Wiltshire, A., et al. (2019). Ukesm1: Description and evaluation of the uk earth system model. J.Adv. Model. Earth Syst. 11, 4513–4558.
Smallman, T., Exbrayat, J., Mencuccini, M., Bloom, A., and Williams, M. (2017). Assimilation of repeated woody biomass observations constrains decadal ecosystem carbon cycle uncertainty in aggrading forests. J. Geophys. Res.: Biogeosci. 122, 528–545. doi: 10.1002/2016JG003520
Smallman, T. L., Milodowski, D. T., Neto, E. S., Koren, G., Ometto, J., and Williams, M. (2021). Parameter uncertainty dominates c cycle forecast errors over most of brazil for the 21st century. Earth Syst. Dynam. Discuss. 2021, 1–52. doi: 10.5194/esd-2021-17
Smallman, T. L., and Williams, M. (2019). Description and validation of an intermediate complexity model for ecosystem photosynthesis and evapotranspiration: Acm-gpp-etv1. Geosci. Model Dev. 12, 2227–2253. doi: 10.5194/gmd-12-2227-2019
Sullivan, M. J. P., Lewis, S. L., Affum-Baffoe, K., Castilho, C., Costa, F., Sanchez, A. C., et al. (2020). Long-term thermal sensitivity of earth's tropical forests. Science 368, 869–874. doi: 10.1126/science.aaw7578
Thomas, R. Q., Zaehle, S., Templer, P. H., and Goodale, C. L. (2013). Global patterns of nitrogen limitation: confronting two global biogeochemical models with observations. Glob. Chang. Biol. 19, 2986–2998. doi: 10.1111/gcb.12281
Williams, M., Schwarz, P., Law, B. E., Irvine, J., and Kurpius, M. R. (2005). An improved analysis of forest carbon dynamics using data assimilation. Glob. Chang. Biol. 11, 89–105. doi: 10.1111/j.1365-2486.2004.00891.x
Wright, J., Williams, M., Starr, G., McGee, J., and Mitchell, R. (2013). Measured and modeled leaf and stand”?scale productivity across a soil moisture gradient and a severe drought. Plant Cell Environ. 36, 467–483. doi: 10.1111/j.1365-3040.2012.02590.x
Keywords: forest biomass, plant traits, carbon cycle, land surface model, chronosequence, leaf area index
Citation: George-Chacon SP, Smallman TL, Dupuy JM, Hernández-Stefanoni JL, Milodowski DT and Williams M (2023) Isolating the effects of land use and functional variation on Yucatán's forest biomass under global change. Front. For. Glob. Change 6:1204596. doi: 10.3389/ffgc.2023.1204596
Received: 12 April 2023; Accepted: 22 August 2023;
Published: 28 September 2023.
Edited by:
Donald Mlambo, National University of Science and Technology, ZimbabweReviewed by:
Bhupendra Singh, VCSG Uttarakhand University, IndiaKaushal Singh, Banda University of Agriculture and Technology, India
Copyright © 2023 George-Chacon, Smallman, Dupuy, Hernández-Stefanoni, Milodowski and Williams. This is an open-access article distributed under the terms of the Creative Commons Attribution License (CC BY). The use, distribution or reproduction in other forums is permitted, provided the original author(s) and the copyright owner(s) are credited and that the original publication in this journal is cited, in accordance with accepted academic practice. No use, distribution or reproduction is permitted which does not comply with these terms.
*Correspondence: Mathew Williams, bWF0LndpbGxpYW1zQGVkLmFjLnVr