 Kangning Xiong
 Lingwei Kong
 Yanghua Yu
- Engineering Laboratory for Karst Desertification Control and Eco-Industry of Guizhou Province, School of Karst Science, Guizhou Normal University, Guiyang, China
In the fragile karst desertification ecosystem, forests are the providers of eco-multifunctionality. And the ecosystem service (ES) supply capacity of forests is directly or indirectly affected by various driving factors. The aim of this study is to explore the driving role of forest spatial structure, species diversity, and functional diversity on ecosystem services. In this study, four forest types, namely, broad-leaved monoculture forest (planted economic forest) (F1), broad-leaved mixed forest (F2), coniferous and broad-leaved mixed forest (F3), and coniferous mixed forest (F4), were investigated in karst plateau mountain (KPM), karst plateau canyon (KPC), and karst mountain canyon (KMC) landforms. Variance analysis, correlation analysis and redundancy analysis were used to compare the differences of spatial structure, species diversity, functional diversity, and ES of different forest types and to clarify the driving role of spatial structure, species diversity, and functional diversity on ES. The results showed that the wood supply service of F3 was at least 4.27% higher than that of other forest types; carbon sequestration and oxygen release are at least 4.57 and 3.89% higher; the water holding capacity of litter and soil is higher by 6.24 and 2.26%, respectively; the soil OC, TN, TP, and TK were higher than 6.01, 1.22, 25.55, and 13.34%, respectively. The coniferous mixed forest and broadleaved mixed forest with a more complete spatial structure has a higher level of diversity, which can generate more wood and provide more soil nutrient sources, as well as stronger regulation capacity. Spatial structure affects plant productivity through interspecific relationships; soil fertility is restricted by the level of diversity; gas and water regulation are influenced by both spatial structure and diversity levels. There is a progressive driving relationship among spatial structure, diversity, and ES. In forest management, it is helpful to improve the forest ecosystem’s functioning by adjusting the forest structure using close-to-natural management measures.
1. Introduction
As the principal part of the terrestrial ecosystem, healthy forest ecosystems provide a wide range of services, including reliable clean water, climate regulation, and productive soils; they also underpin many of society’s basic needs, such as economic processes, and cultural or spiritual values (Jenkins and Schaap, 2018; Olschewski et al., 2018). However, a great number of forests are undergoing severe degradation because of many direct or indirect driving factors such as climate and land-use change, human activities, etc. (Kong et al., 2023). Extensive biodiversity loss, including losses of genetic, species, and habitat diversity, has been one result of the shrinking of the world’s forests; it has also had a negative impact on the provision of ecosystem services (ES), such as the regulation of hydrological cycles (Millennium Ecosystem Assessment [MEA], 2005). The factors such as air pollution, diseases and pests, fire can also cause serious damage to forest ES. These driving factors are not isolated, but multiple drivers occurring simultaneously or interacting, and changing with time and organizational level (Millennium Ecosystem Assessment [MEA], 2005; Helseth et al., 2022). Furthermore, in most important terrestrial biological communities, the average abundance of species has decreased by at least 20%, and 14 of the 18 services assessed have declined; climate change and human activities will alter the ecosystem’s structure and functioning, ultimately affecting ES (IPBESs, 2009). Climate change had a stronger effect on the water yield and carbon sequestration than the land use/cover changes but sand fixation and soil conservation were more likely to be affected by LUCCs (Referowska-Chodak, 2019). Urban development result in fragmentation and isolation of forests and biodiversity losses (Cui et al., 2021). However, the direct driving mechanisms of ecosystem structure and biodiversity on ES change are unclear. Especially in the fragile karst desertification areas, there is still a lack of research on how forest spatial structure, diversity, and their interaction affect ES.
The spatial structure exerts strong control over many scale-dependent ES and plays an important role in regulating water and air circulation (Hardiman et al., 2019). The canopy coverage, leaf traits (area, biomass, morphology), and branch characteristics (density, quantity, length) are considered as the key factors affecting the water storage capacity of the canopy (Li et al., 2016; Atkins et al., 2017). The more reasonable and stable the structure of the stand is, the more function it provides (Xiang et al., 2019). In the meantime, diversity plays a positive role in promoting crop production, fishery production, timber production, carbon sequestration, water purification, soil fertility, biological control of diseases and pests, pollination, wild food, recreation, healthcare, and aesthetic appreciation (Peng et al., 2020). The loss of plant diversity reduces soil microbial diversity (Zhang et al., 2017). Higher plant diversity can increase the carbon input into the microbial community in the rhizosphere, thereby increasing microbial activity and carbon storage (Lange et al., 2015). Increasing plant diversity can increase the accumulation, retention and use efficiency of nitrogen in soil (van Ruijven and Berendse, 2005; Fornara and Tilman, 2008). It is widely accepted that forest structure and diversity drive changes in ecosystem services and functions (Hanif et al., 2019; Sun et al., 2023; Wang et al., 2023), but the interrelationships between forest structure, diversity, and services in karst areas are still unknown.
The karst desertification is a process that leads to a vegetation degradation and rock exposure landscape (Xiong et al., 2002). It is results from the irrational socioeconomic activity of human beings in a fragile karst ecological environment. The main manifestations are prominent conflicts between humans and the land, degradation of vegetation, loss of water and soil, exposure of bed rocks, and loss of land productivity. The occurrence of desertification changes the growth conditions of the surrounding vegetation. The plants that live in this area are usually drought-tolerant, calcium-loving, and lithophytic, which makes for a simple community structure and smaller variety of species than in non-desertification areas (Xiong and Chi, 2015; Yuan et al., 2021). Karst desertification has adversely affected the regional biodiversity protection. Vegetation degradation and biodiversity loss has made the already fragile ecosystem structure affected by desertification even more unstable. The ecological function is manifested as a reduction in physical productivity; a decline in forest vitality, organization and resilience; the change in the relationship between organisms and the disturbance of ecological processes; etc. (Yu et al., 2017). Karst desertification not only leads to the degradation of ecosystem functions, but also further endangers ES supply. For example, soil erosion caused by vegetation destruction leads to land productivity degradation and food production reduction (Wang et al., 2021); the shrinking of forest coverage retards the ecological processes of nutrient, water, and atmospheric cycle, etc. (Zhang et al., 2020; Wu et al., 2022). The difference in vegetation cover and soil physical properties led to the difference in soil water dynamics between the shallow EFS and surface soil (Li et al., 2020). Since the beginning of the 21st century, a series of ecological restoration projects in desertification areas have been implemented in China. Forest and grass projects have played a leading role in the control of desertification. However, compared with forests in non- desertification areas, the forest communities in desertification areas are in the primary stage of succession, and the ecosystem still has problems such as unreasonable structure, low biodiversity, and incomplete functions. For example, the species composition of a plantation is single, and its resistance to diseases and pests is insufficient. The hierarchy is incomplete, which impeded the material cycle; having trees that are all the same age is not conducive to sustainable forest management (Liu et al., 2010; Chen et al., 2014). Compared with non-karst areas, there is greater water stress during the dry season in a karst forest (Chen et al., 2015), and the trees have lower xylem hydraulic conductance, but higher xylem cavitation resistance (Zhu et al., 2017). How to improve the forest community structure using karst desertification control and enhance the system’s biodiversity and ecosystem’s function are urgent problems that need to be solved in this area.
Guizhou Plateau is in the hinterland of the South China karst, which is one of the world’s three major karst concentration areas. Its geomorphic diversity is representative of a typical karst environment (Xiong et al., 2002). In this study, three typical landforms [karst plateau mountain (KPM), karst plateau canyon (KPC), and karst mountain canyon (KMC)] were selected in Guizhou plateau. Based on the tree species, the forest is divided into four types: broad-leaved monoculture forest (F1), broad-leaved mixed forest (F2), coniferous and broad-leaved mixed forest (F3), and coniferous mixed forest (F4). Using ANOVA, redundancy analysis, and correlation analysis, the relationship was clarified by comparing the spatial structure, species diversity, functional diversity, and ES characteristics of four forest types, and the driving effect of structure and diversity on ES was discussed. Specifically, this study clarified the impact of three forest attributes, namely spatial structure, species diversity and functional diversity, on ecosystem services. Analyzed which drivers contribute more on ES change. It has important reference value for sustainable forest management and can also provide theoretical support for the improvement of forest ecosystem functions.
2. Materials and methods
2.1. Study area
The Guizhou Plateau is located in the hinterland of the South China Karst, where the Karst landforms are most connected in the world. The terrain is undulating and altitude gradually decreases from west to east in a ladder shape. The three landform types selected in this study, namely Karst plateau mountain (KPM), Karst plateau canyon (KPC), and Karst mountain canyon (KMC), in the first, second, and third steps of Guizhou Plateau. The Karst area accounts for 73% of the total area of the province. The rocks are mainly limestone and dolomite, with irregular spatial distribution. Guizhou is the province with the most serious desertification in China. In Guizhou, Natural vegetation mainly includes coniferous forests, broad-leaved forests, bamboo forests, shrubs, alpine meadows, and swamp vegetation. The top community on the Karst landform in the humid area of the mid-subtropical areas is the evergreen and deciduous broad-leaved mixed forest. It is a non-zonality vegetation formed under the background of zonal bioclimatic conditions and under the influence of special habitats such as Karst landform and lime soil. It is different from tropical and subtropical moist broadleaf forests in terms of community composition, structure, growth, regeneration and succession, and also different from the deciduous evergreen broad-leaved mixed forest in the northern subtropics and the evergreen deciduous broad-leaved mixed forest in the subtropical middle mountains.
KPM (105°01′11″–105°08′38″E, 27°11′09″–27°17′28″N) is located in the northwest of Guizhou (Figure 1), belonging to the Liuchong River basin, basic information is shown in Table 1. There are many peaks, clusters, and depressions in the area, and the terrain is broken, which is a typical karst plateau mountain ecological environment. The soil is mainly yellow soil, and a small part is yellow-brown soil. The zonal vegetation is mainly broad-leaved (Betula luminifera H. Winkl., Populus alba L.), coniferous (Pinus armandii Franch.), and shrub [Pyracantha fortuneana (Maxim.) Li], (Viburnum erubescens Wall.).
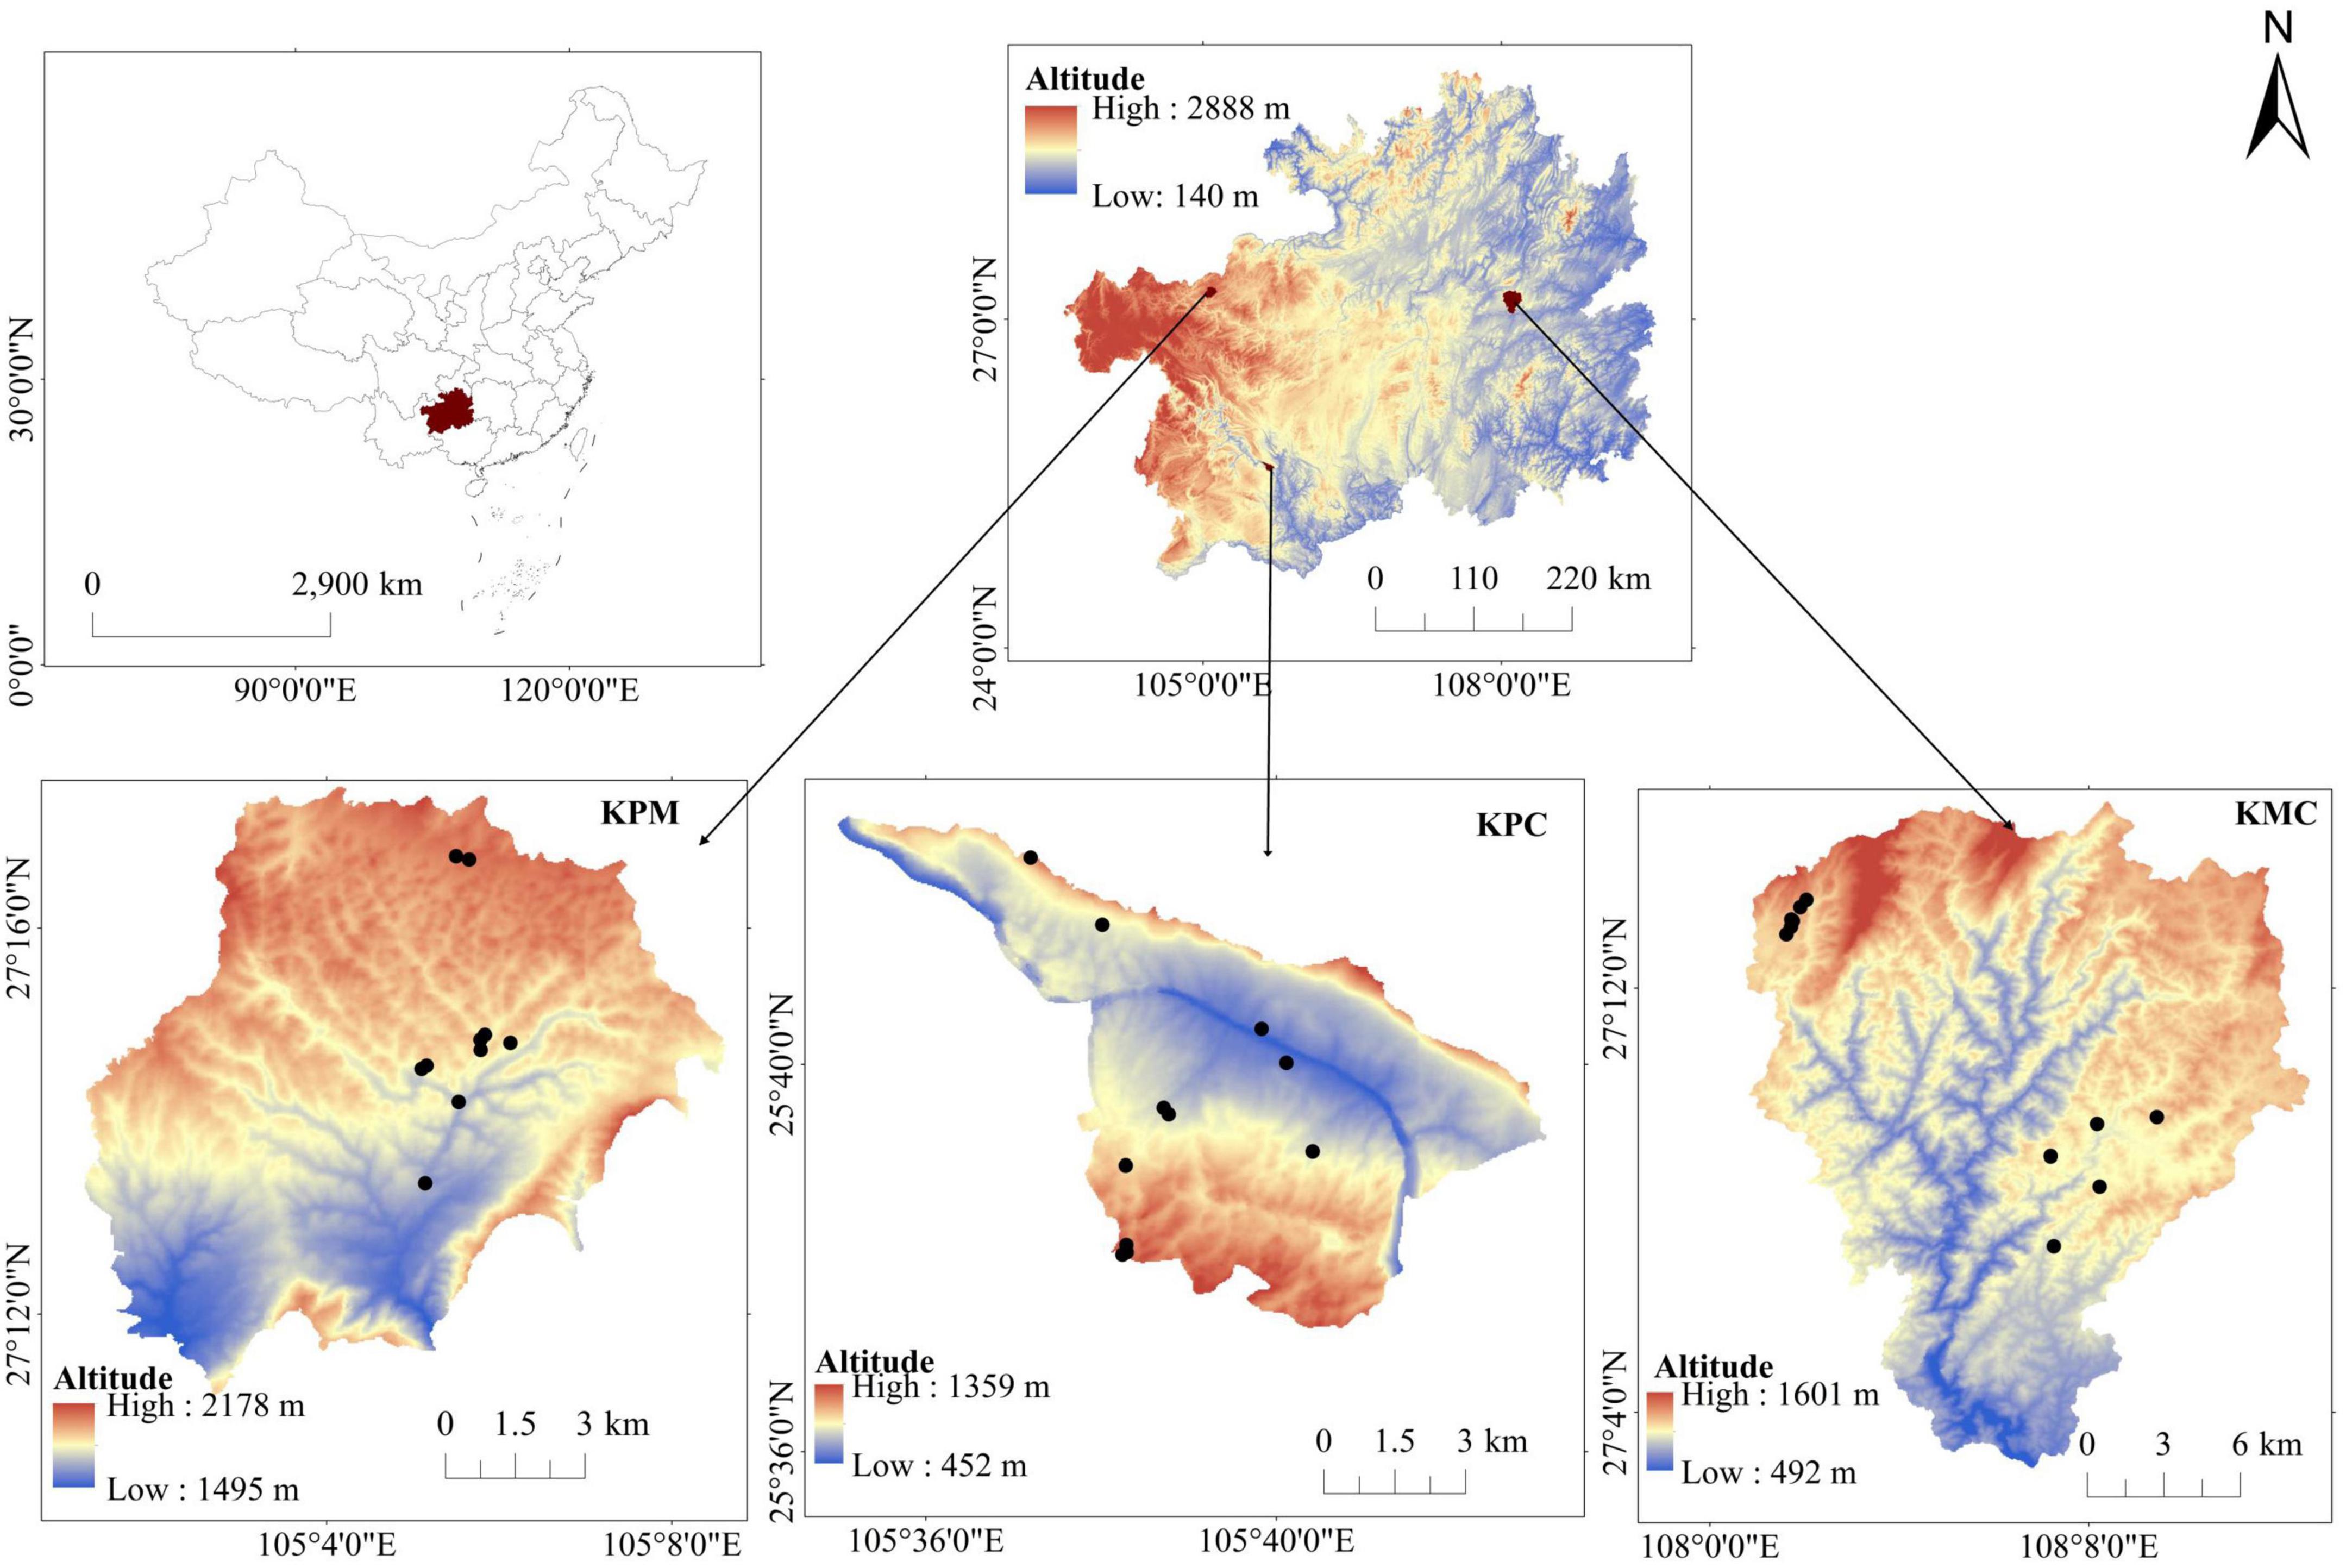
Figure 1. Elevations of study area and location of sample plots.
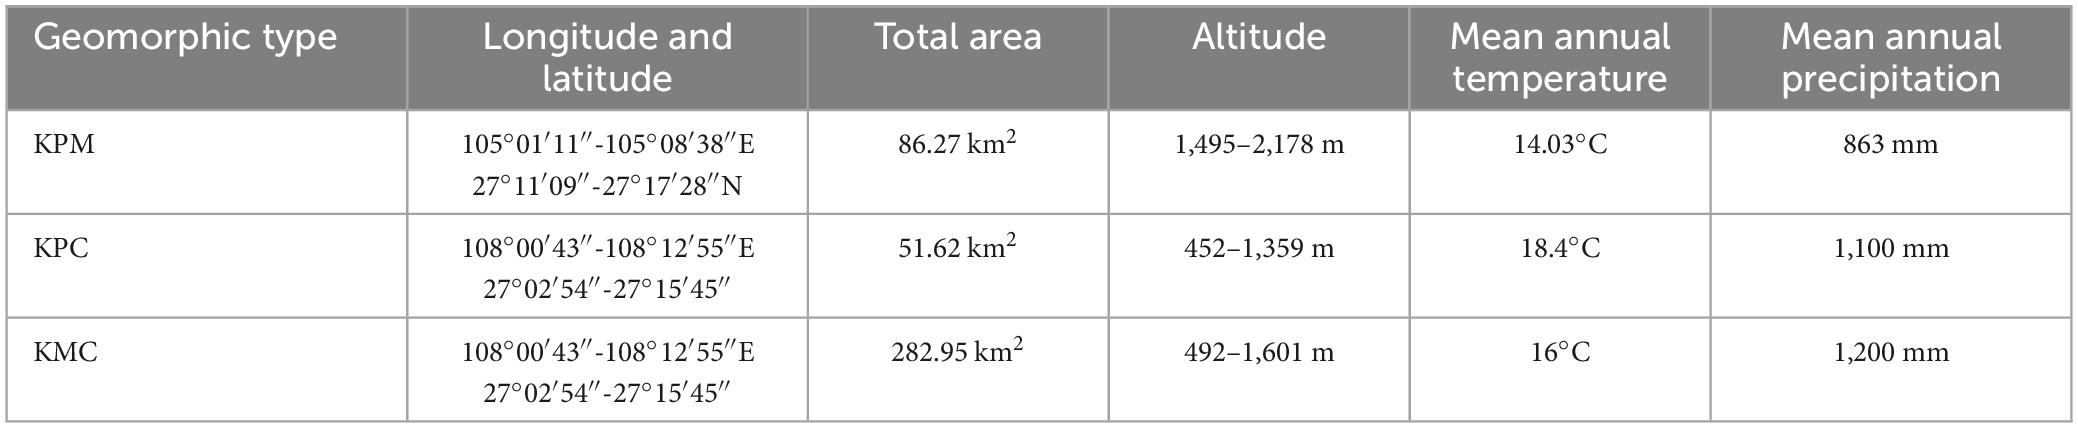
Table 1. Basic information of study area.
Karst plateau canyon (105°34′59″–105°43′06″E, 25°37′18″–25°42′37″N) is located in the southwest of Guizhou (Figure 1), on both wings of the Huajiang Canyon, basic information is shown in Table 1. The valley in the area is deep and the terrain undulates and falls greatly, which is a typical karst plateau canyon ecological environment. The soil is mainly yellow soil and yellow lime soil. And the spatial distribution of soil is broken. Due to strong human disturbance, the primary vegetation is seriously damaged. Now it is mainly secondary vegetation with low forest coverage. At present, the management measures of secondary forests are mainly close mountains to cultivate forests, lack of artificial optimization management measures. Representative species include Cladrastis platycarpa (Maxim.) Makino, Zanthoxylum bungeanum Maxim., and [Alcornea trewioides (Benth.) Muell Arg.], etc.
Karst mountain canyon (108°00′43″–108°12′55″E, 27°02′54″–27°15′45″N) is in Shibing County, eastern of Guizhou Province (Figure 1), basic information is shown in Table 1. The terrain in the area has a large fluctuation and fall. It is a typical karst dolomite mountain canyon landform. The soil is mostly rendzina, followed by yellow soil. The local plants are well protected and managed, plant coverage rate 93.95%. There is much existing native forest vegetations in the area, with rich species diversity, mainly including Platycarya strobilacea Sieb. et Zucc., Lindera glauca (Sieb. et Zucc.) Bl, Pinus massoniana Lamb., Quercus fabri Hance, etc.
2.2. Sample plots selection
Based on the dominant species of the community, the forest is divided into four types: broad-leaved monoculture forest (F1), broad-leaved mixed forest (F2), coniferous and broad-leaved mixed forest (F3), and coniferous mixed forest (F4). The spatial structure, biodiversity, and ES characteristics of the four forest types are explained, respectively. Due to the accumulated temperature effect, the distribution of coniferous forest is limited in the karst plateau canyon area. The existing coniferous trees are mainly planted Cupressus funebris Endl. and mixed with Eucalyptus robusta Smith., so there are only three forest types in KPC. A total of 33 20 m × 20 m rectangular tree plots were selected in this study (3 in each forest type per landform), and topographic factors such as longitude, latitude, and altitude were recorded. Then, four 5 m × 5 m shrub quadrats and four 1 m × 1 m herb quadrats were, respectively, set at the four corners of each plot. A total of 144 shrubs and 144 herb quadrats were set. There is only one tree species in the broad-leaved monoculture forest; the target tree and the nearest trees are the same species, so the Uniform angle indexes are all zero. The broad-leaved monoculture forests are all artificial economic forests of different species, of which Juglans regia L. is present in KPM; Zanthoxylum bungeanum Maxim. is in KPC; and Pyrus pyrifolia “Whangkeumbae” is in KMC.
2.3. Forest spatial structure
A vegetation investigation was conducted in the study areas from July to August 2022 to record the species, quantity, plant height, DBH, and other species information of trees, shrubs, and grasses. At the same time, we selected 5 sample trees for each sample plot according to the five-point formula, and measures and recorded the angle and distance between the 4 nearest trees and the target tree (Figure 2). Based on the results of vegetation survey, three forest spatial structure indexes, namely uniform angle index (Wi), mingling (Mi), and competition index (ICI), were calculated according to Hui et al. (2016). The Wi can reflect the horizontal spatial distribution pattern of trees in the stand; the Mi is defined as the proportion of individuals not belonging to the same species as the target tree in the nearest trees of target tree i, which is used to describe the degree of spatial isolation of tree species; and the ICI can reflect the size of the competition pressure from other trees on the target tree in its structural unit. It can not only reflect the mutual concealment of the trees, but also reflect the oppression of the target tree in the horizontal direction (Hui et al., 2013).
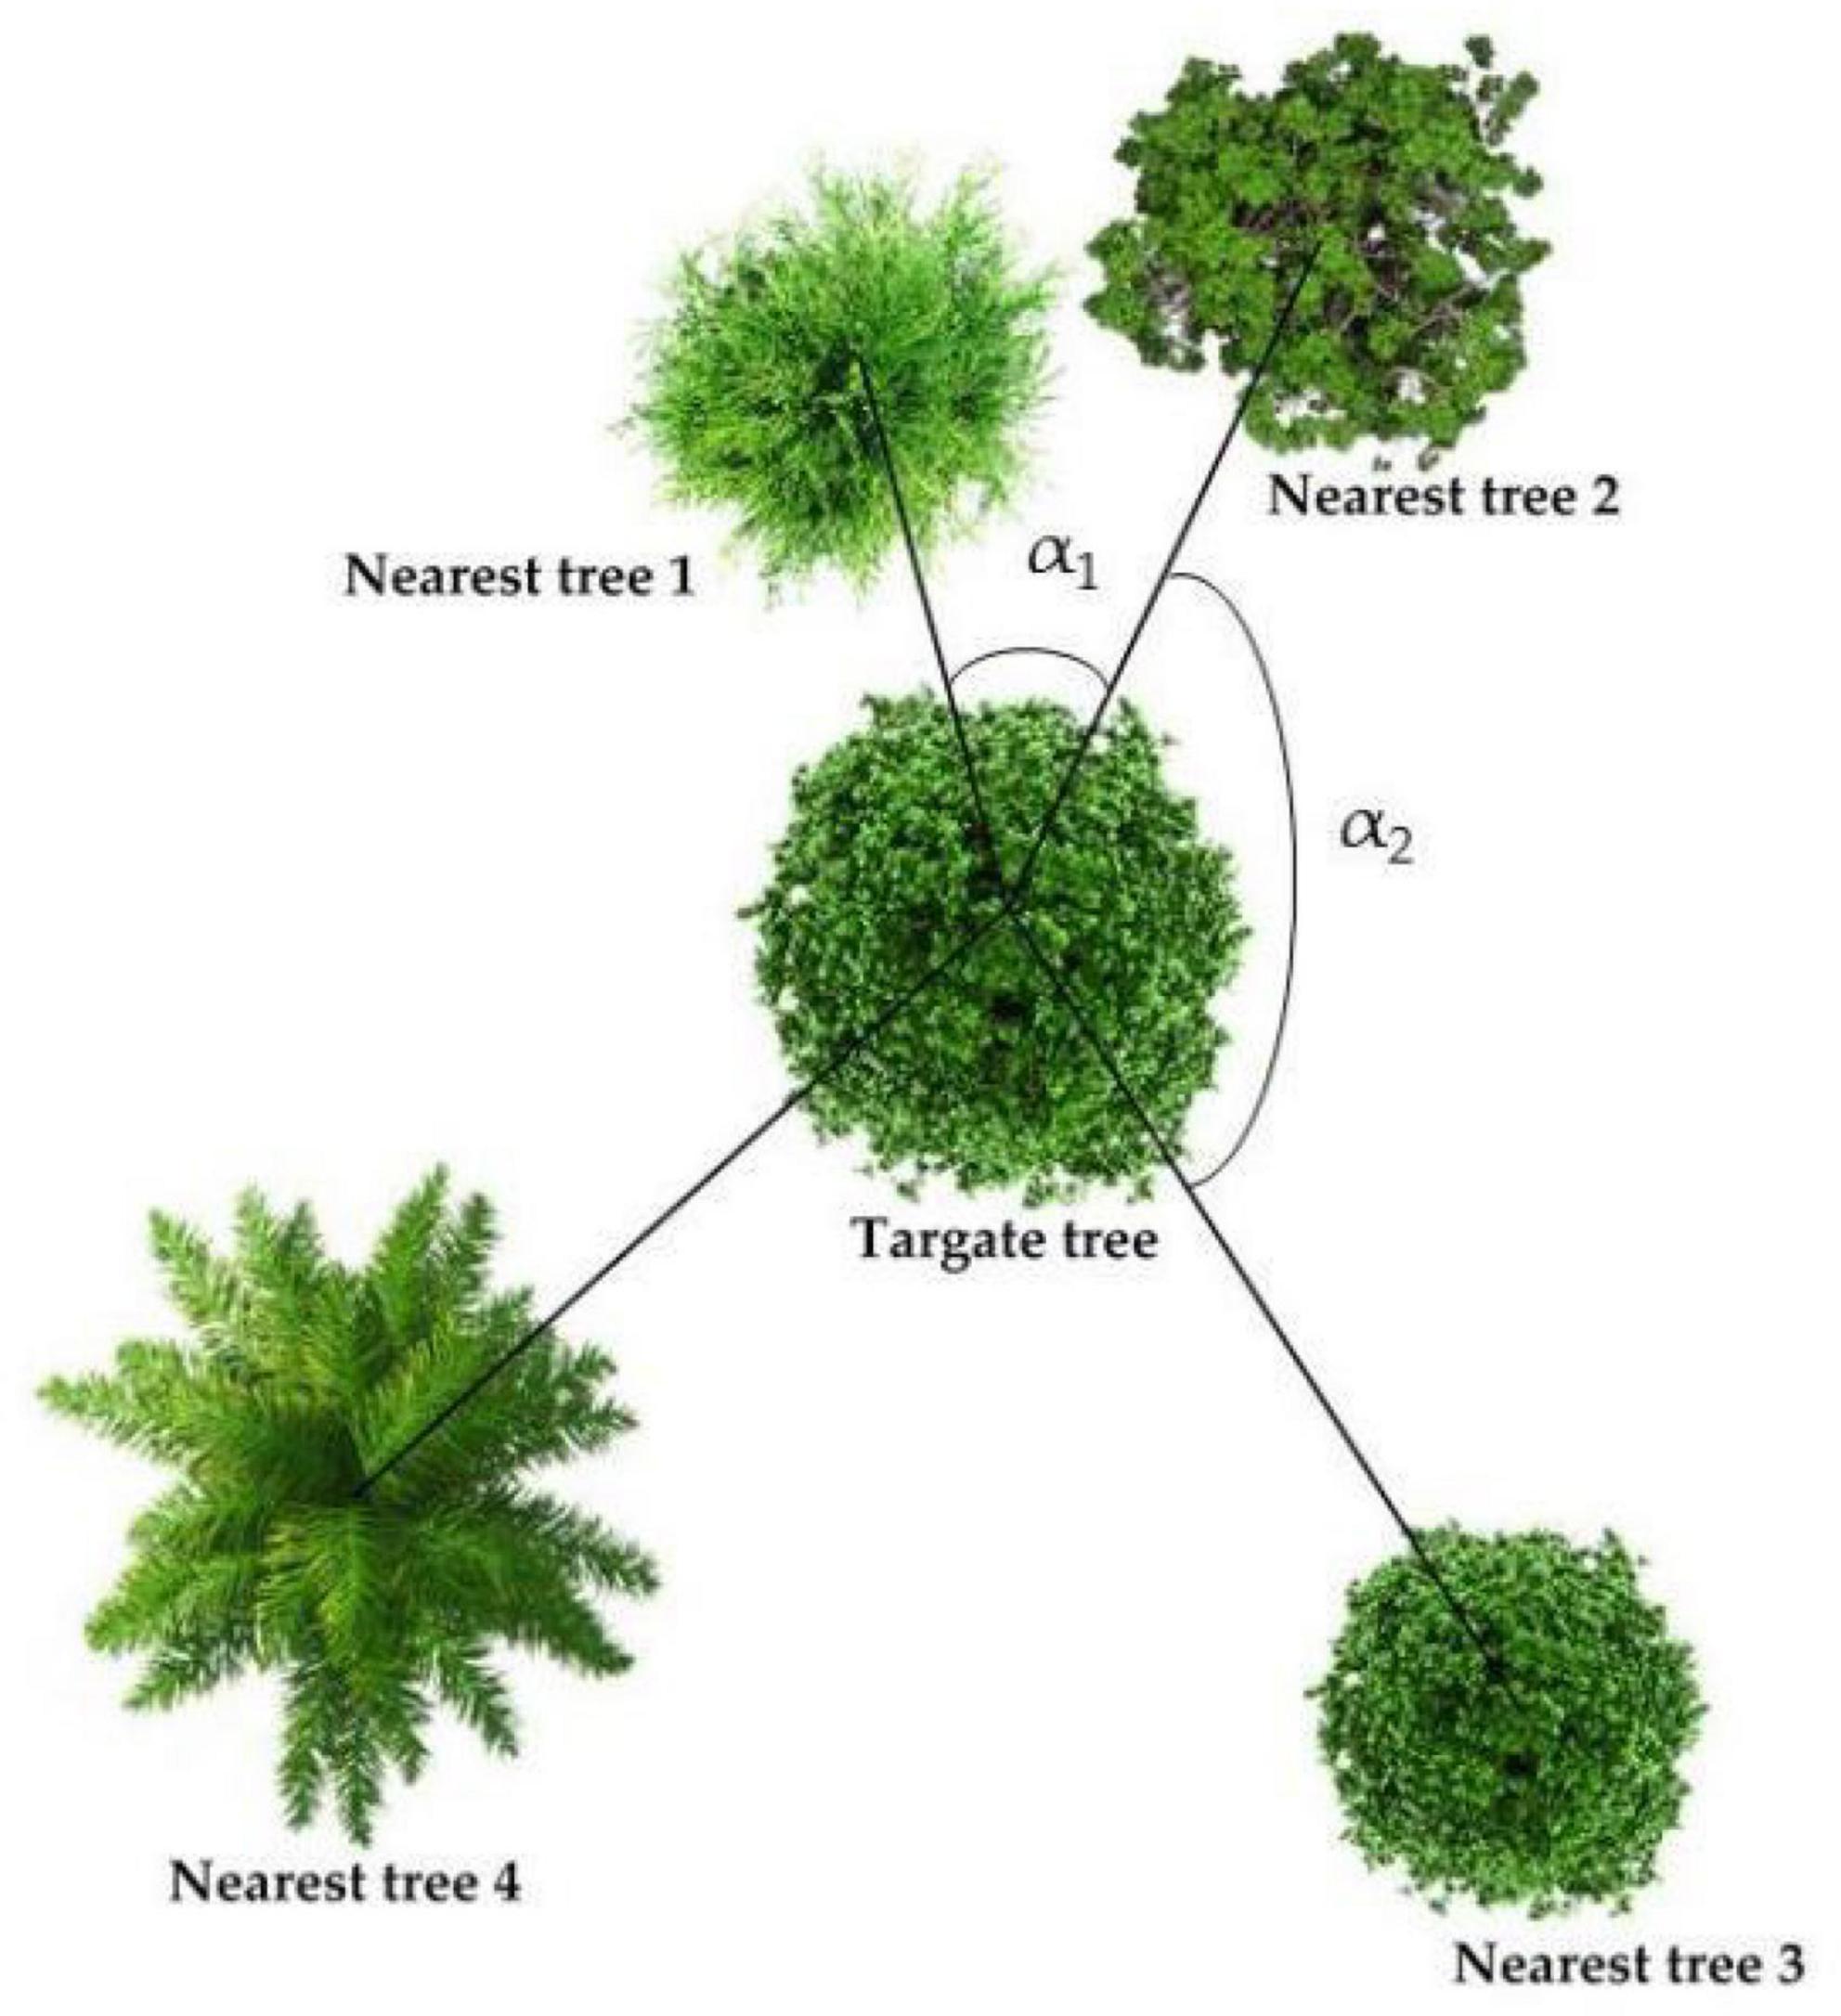
Figure 2. Spatial structure diagram. The more angles greater than 72°, the smaller Wi; the more nearest-trees that are the same species as the target tree, the smaller the Mi; the closer the nearest trees are to the target tree and the larger the DBH, the greater the ICI.
2.4. Biodiversity indexes and functional diversity indexes
The functional Diversity index is calculated by using plant functional traits (Table 2). Leaf samples were collected according to the manual for measuring plant functional traits prepared by Cornelissen et al. (2003). We then excavates a complete fine root for each tree, shrub, and herb species for the measurement of fine root functional traits. Two of non-current year twigs with diameter greater than 5 mm were cut for the measurement of twig functional traits. In order to maintain the water saturation of the sample, the measurement of functional traits was completed within 8 h of the sample being collected.
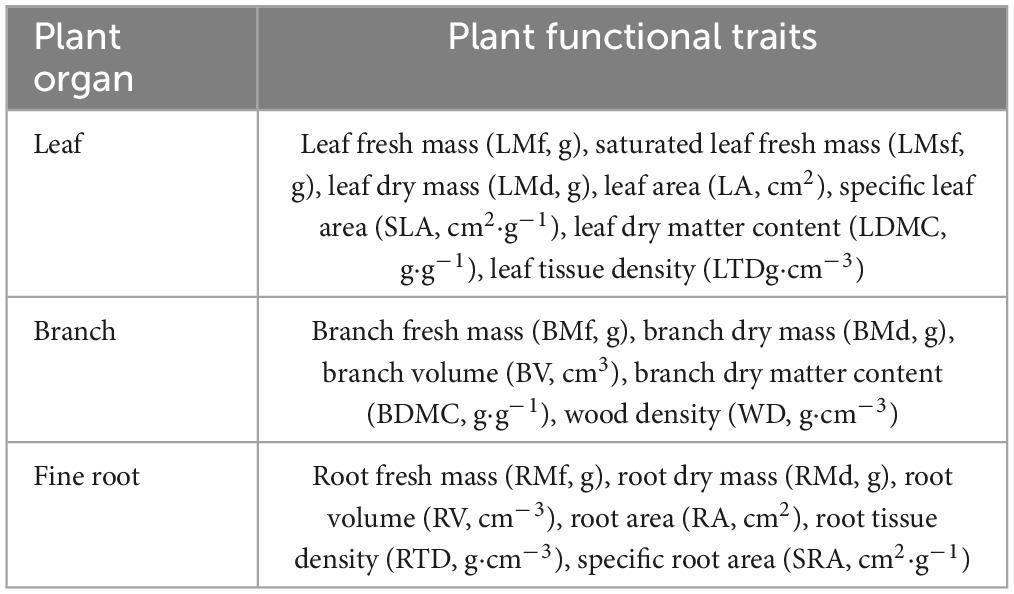
Table 2. Plant functional traits.
The mass of the samples was weighed using a balance with an accuracy of 0.0001, and the volume of the twigs was obtained by the drainage method using a measuring cylinder. We used a CanoScanLiDE400 scanner to scan the leaf and fine root images, and then used Image J software to calculate the leaf area. The root volume and root surface area were obtained by analyzing the fine root morphological characteristics of the scanned root using the root image analysis software WinRHIZO (Pro2009b). Then we soaked the sample in clean water for 24 h and weighed the saturated fresh mass of the leaves. We then took all samples back to the laboratory, put them in a 75°C oven to dry to constant weight, and weighed the dry mass of roots, branches, and leaves.
According to the vegetation investigation data, Shannon–Wiener index, Margalef richness index, and Pielou evenness index were selected to calculate the species diversity of the community. We selected SLA, LDMC, LTD, BDMC, WD, RTD, and SRA to calculate the functional richness (FRic), functional evenness (FEve), and functional dispersion (FDis). The biodiversity index was calculated using the R software FD package.
2.5. Ecosystem services
We selected water conservation, carbon fixation and oxygen release, soil fertilizer conservation, and wood supply to represent regulation, support, and provision services, respectively. Due to the distance between the plots and the place of residence, there is no leisure or entertainment function in forest, so this study did not contain cultural services. The cutting rings method was used to collect 0–10 cm soil in the sample plot, with every 5 cm as one layer. The fresh soil weight was measured on site. We then took it back to the laboratory, soaked it for 12 h, weighed the saturated water holding weight of the soil, put the soil into a 105°C oven for constant temperature drying for 48 h, and then weighed the dry weight of the soil. We used a soil shovel to take 0–20 cm topsoil in the sample plots according to the five-point sampling method and put it into an aluminum box to evenly mix the soil of five sample points. We then took it back to the laboratory to remove stones and plant roots and leaves, and pass a 0.15 mm sieve to measure the total amount of nutrients. Four litter and herb quadrat of 1 m × 1 m was delimited in each plot, and all litter and herb plants in the quadrat were harvested. After weighing the fresh weight of the litter, soaking it in clean water for 24 h, we weighed the water holding weight and calculated the herbaceous biomass by weighing the fresh weight of the biomass. The test method of soil total nutrients was referred to by Bao (2000).
2.5.1. Wood supply
Based on the tree species, tree height, and DBH, we found the binary standing tree volume table (Table 3) of each tree species in the Guizhou Standardized Public Service Platform (2013) to calculate the tree volume of the forest. The volume of the sample plot can be obtained by adding the single wood accumulation.
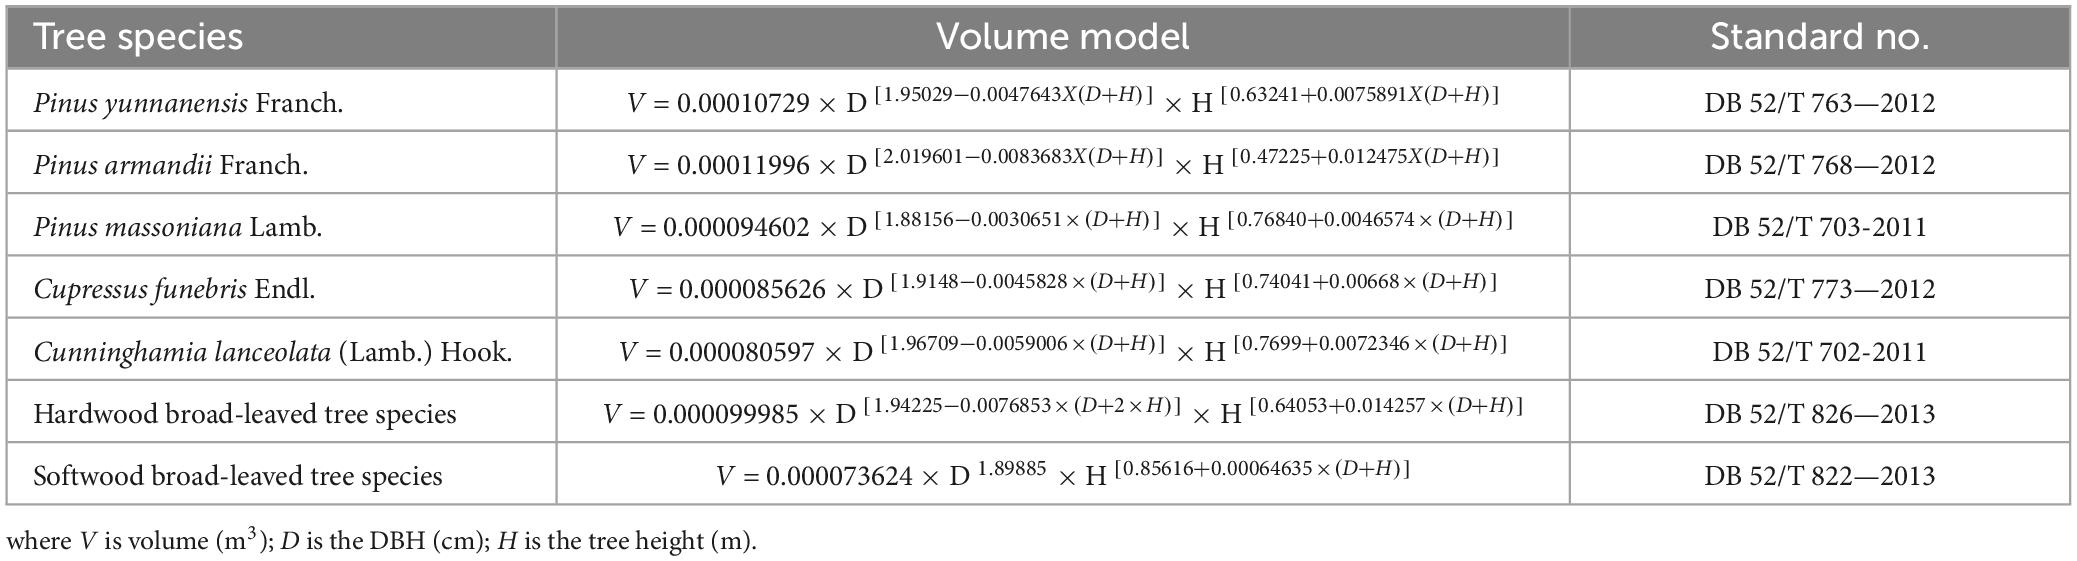
Table 3. The binary standing tree volume table of main tree species in Guizhou Province.
2.5.2. Soil nutrient content
Soil nutrient support services including the soil organic carbon contents (OC, g⋅kg–1), total nitrogen (TN, g⋅kg–1), total phosphorus (TP, g⋅kg–1), and total potassium (TK, g⋅kg–1). The average value of the sample plots represents the soil nutrient maintenance capacity of different forest types.
2.5.3. Carbon storage and oxygen release
According to the formula of the national standard of the People’s Republic of China GB/T 38582-2020 (National Forestry and Grassland Administration, 2020), the plant and soil carbon storage and oxygen release were calculated, respectively. Plant carbon storage plus soil carbon storage are total carbon storage.
2.5.4. Water conservation
Water conservation services including water retention by litter (Lw, t⋅hm–2) and soil (Sw, g⋅cm–3). Water conservation services were calculated according to Wang et al. (2003). Weigh the collected litter samples at sample plot (Lf, g), then put it in an oven at 80°C to dry to constant weight (Ld, g⋅m–2). Then put the dried litter into a nylon mesh bag and soaked it in water for 24 h, took out and dried it (based on the standard of no water dripping), then weighed water holding capacity. The cutting rings method is used to measure the maximum water holding capacity of soil (He et al., 2021).
2.6. Data statistics and analysis
MS office Excel 2016 was used to preliminary data statistics and calculations. One-way ANOVA and Pearson correlation analysis of IBM SPSS Statistics 22 were used to test the differences and correlations of mean values of structure, diversity, and ES among different forest types, and conduct significance tests at the 0.05 level. RDA of Canoco5 software was used to analyze the contribution rate and correlation of structure and diversity to ES variation. Origin 2023 software was used to draw a multi factor box plot.
3. Results
3.1. Differences in forest spatial structure
As shown in Figure 3, there are significant differences in the spatial structure mean value of different forest types. A higher spatial structure index value indicates greater forest density, more tree species, and greater the competition intensity. However, the intensity of competition is not directly proportional to the tree density and the number of species. F3 has more tree species per unit area than that of other forest types, so the distance between trees is relatively close, whereas due to the age difference between the target tree and the nearest trees, the competition index changes with the DBH of the nearest trees. If the DBH of the target tree is smaller than the nearest trees, the ICI will become larger. Although the Wi of F1 is the smallest, but the same tree age and distance between the target tree and nearest leads to the competition intensity of F1 close to or even greater than F3. The species number of F2 and F4 is between F1 and F3, the spatial distribution of trees is relatively uniform, and the species competition intensity is also in the middle level among the four forest types. Compared with other forests, F3 has more tree species, but the competition intensity is in common level. It can be concluded that the spatial structure of F3 is optimal among forest types.
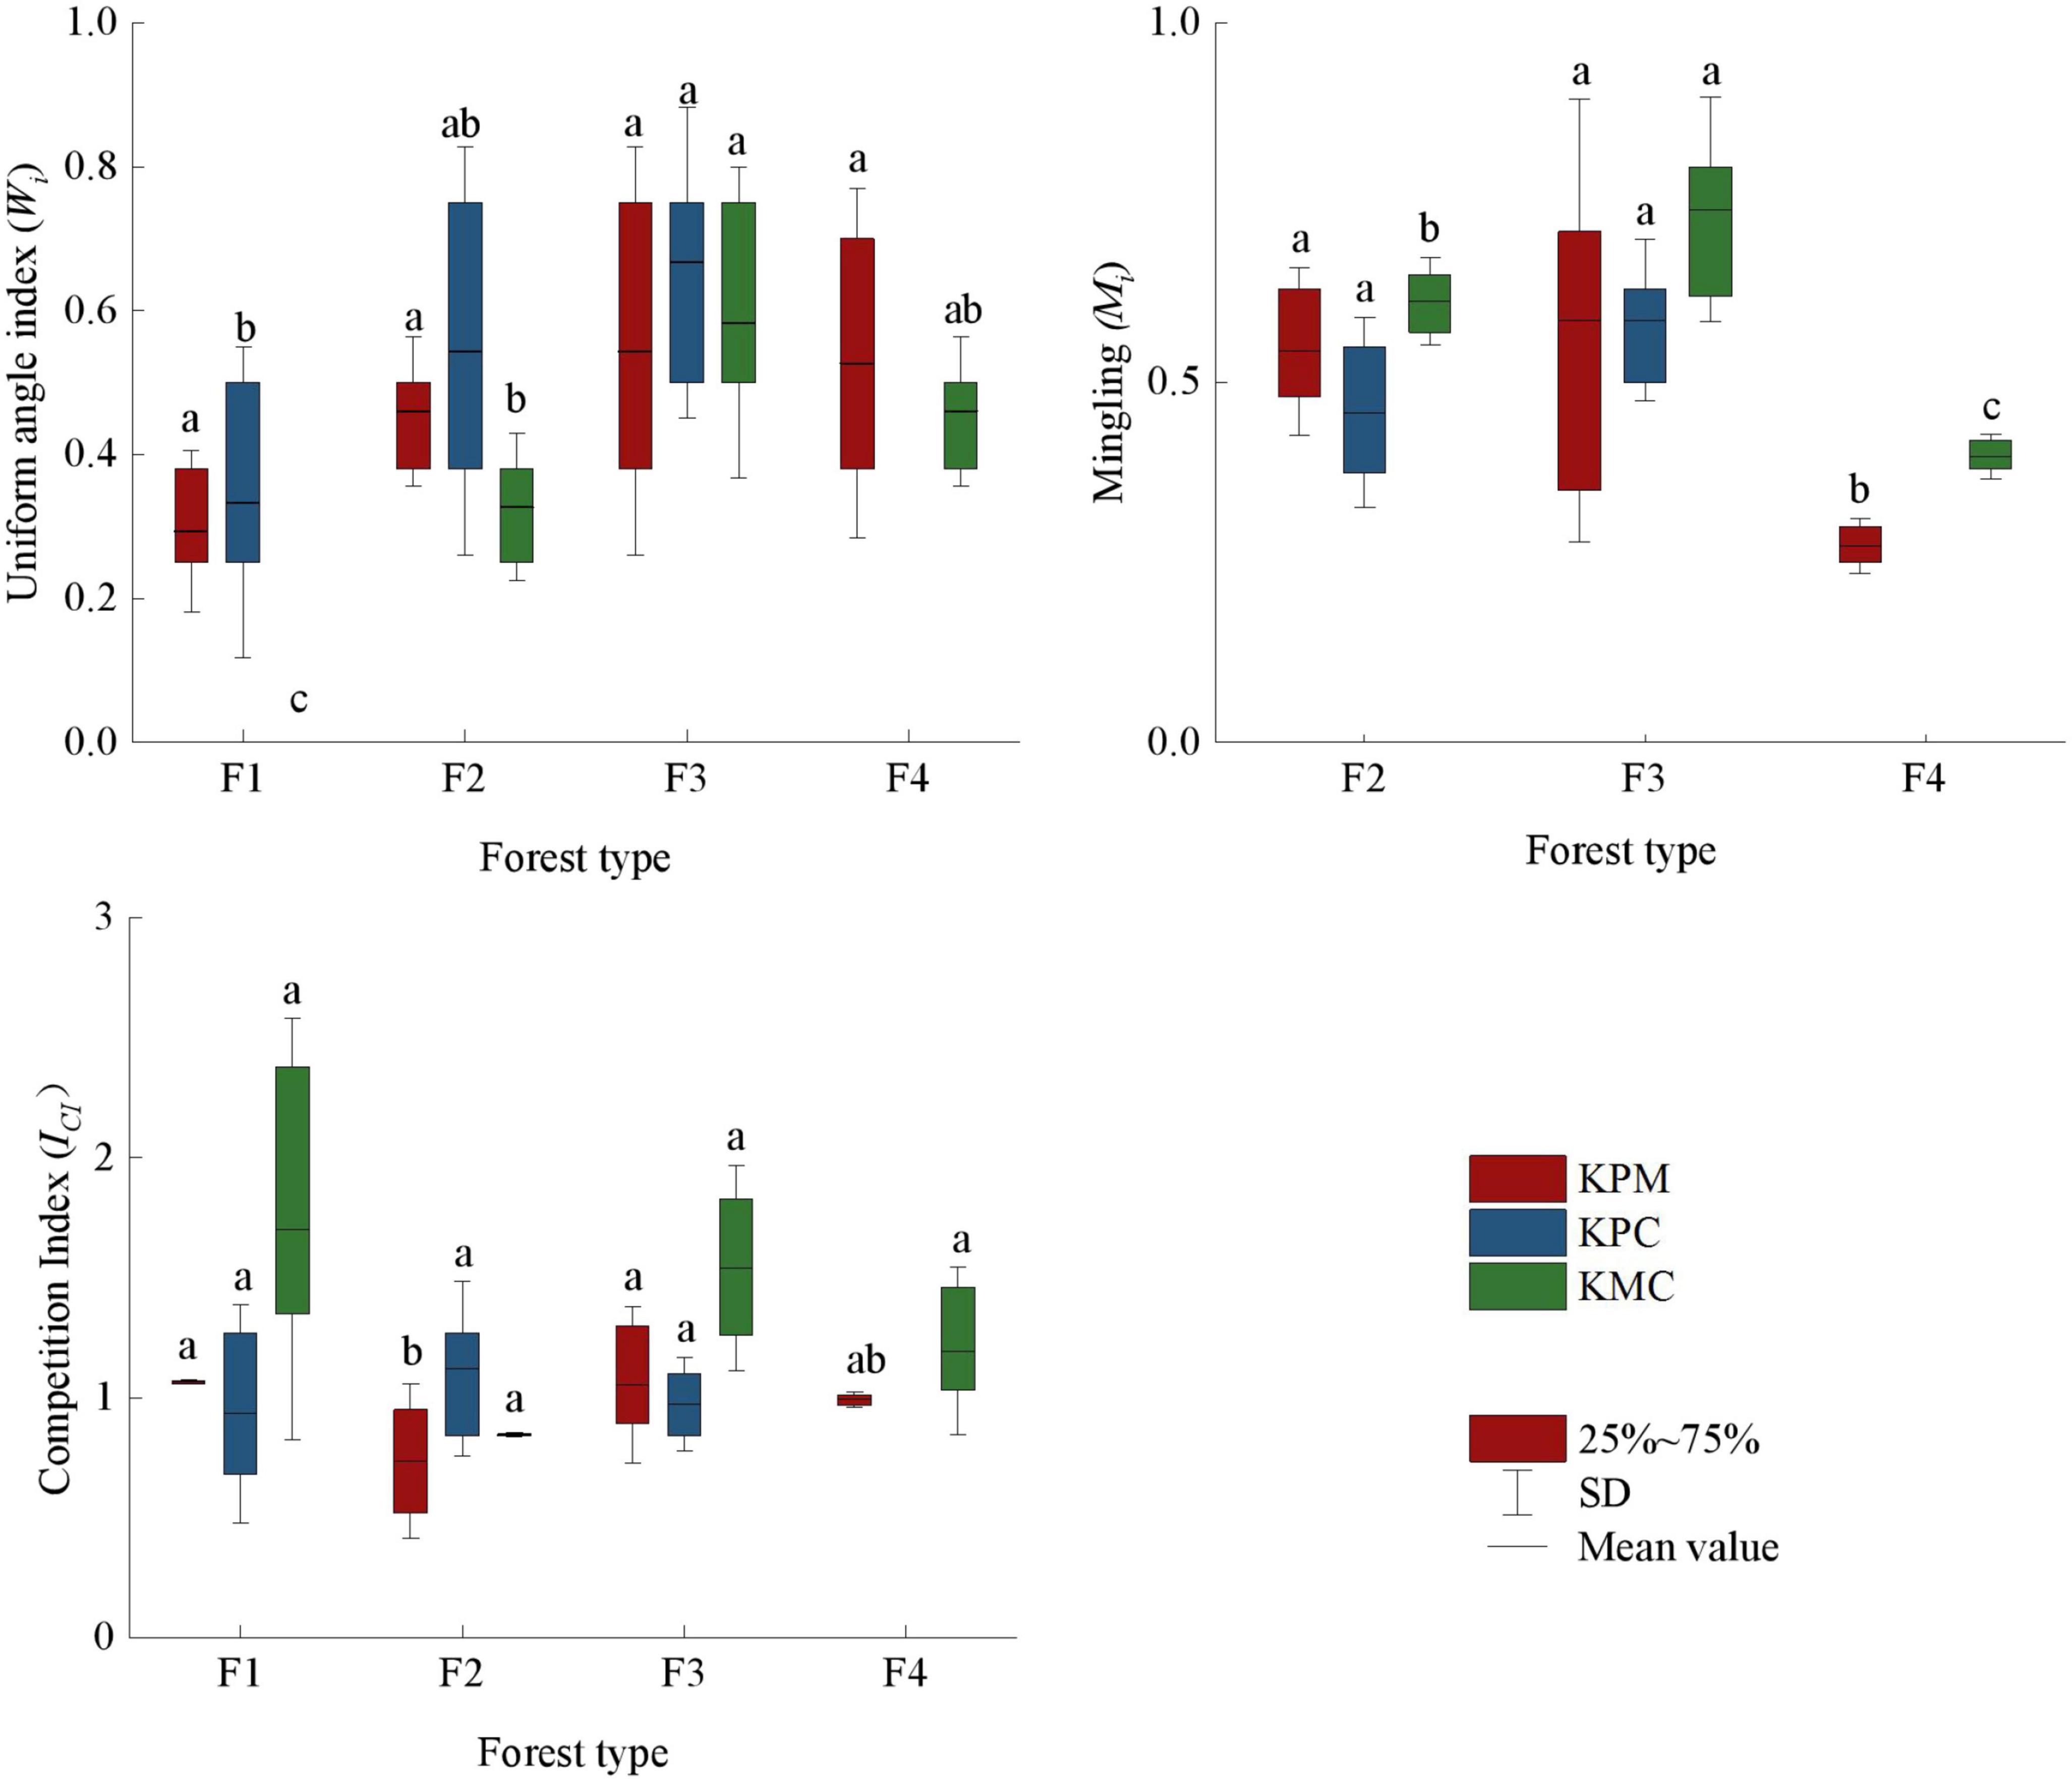
Figure 3. Spatial structure index. Different letters represent significant differences of different forest types (p < 0.05) (compare within the same color). KPM, karst plateau mountain; KPC, karst plateau canyon; KMC, karst mountain canyon. F1: broad-leaved monoculture forest; F2: broad-leaved mixed forest; F3: coniferous and broad-leaved mixed forest; F4: coniferous forest.
3.2. Differences in biodiversity indexes and functional diversity indexes
According to the vegetation survey data, KPM recorded a total of 106 species, belonging to 43 families and 77 genera, including 18 species of trees, 37 species of shrubs and 51 species of herbs. KPC recorded a total of 108 species, belonging to 53 families and 98 genera, including 19 species of trees, 48 species of shrubs and 41 species of herbs. KMC recorded a total of 165 species, belonging to 68 families and 132 genera, including 22 species of trees, 65 species of shrubs and 78 species of herbs. Since there were only two species in F1, the species diversity could not be calculated, so only F2, F3 and F4 were calculated in three landforms.
The diversity index mean value of different forest types was significantly different (p < 0.05). F3 has the plant individuals and species among forest types in three study areas, followed by F2 in KPM and KPC, but F4 is the second in KMC (Figure 4). It indicates that plant diversity not only changes with forest type but is also affected by environmental conditions. There is a disparity in the species diversity index between F4 and other forest types in KPM. Because 85% of the coniferous forests species in the region are Pinus armandii Franch., only a few Pinus massoniana Hort. ex Mast. and broad-leaved species exist. In addition, F4 has a higher canopy density and fewer herbaceous plants under the forest, resulting in lower species diversity than F2 and F3. The functional richness index (FRic) and functional evenness index (FEve) of F3 were the highest among forest types (p < 0.05). It shows that with the increase in species, the difference in functional traits of species gradually increases, and the distribution of functional traits becomes more uniform. The functional dispersion index (FDis) is the highest in F1, followed by F3, which also confirms the change trend of tree competition index in forest types, that is, F1 has the most resource competition followed by F3.
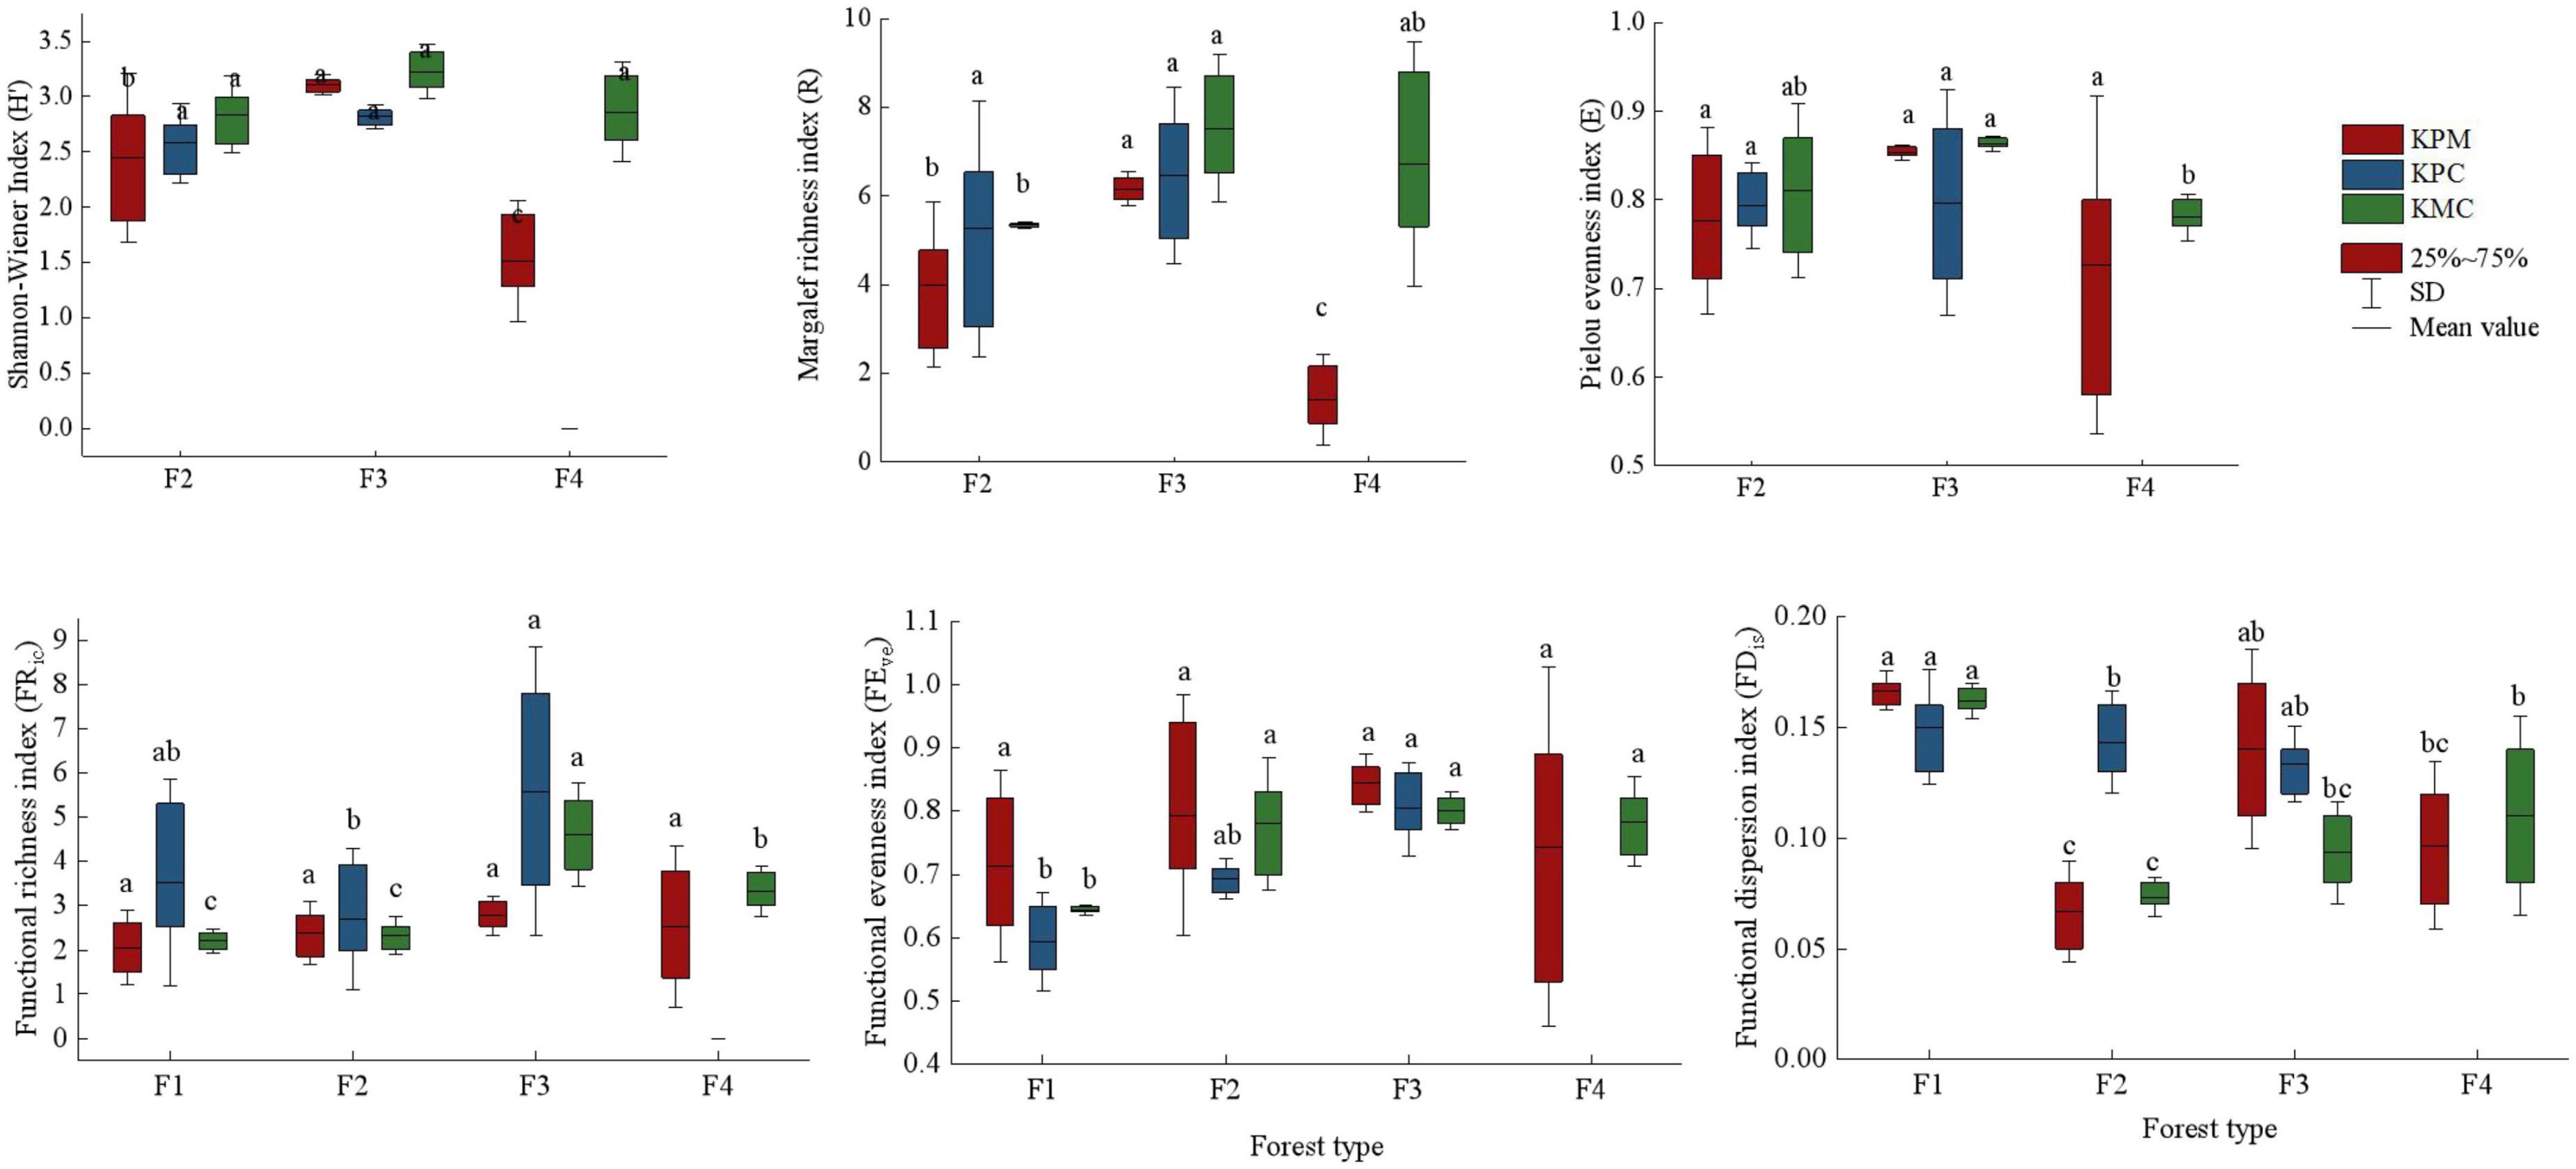
Figure 4. Biodiversity index. Different letters represent significant differences of different forest types (P < 0.05). KPM: karst plateau mountain; KPC, karst plateau canyon; KMC, karst mountain canyon. F1: broad-leaved monoculture forest; F2: broad-leaved mixed forest; F3: coniferous and broad-leaved mixed forest; F4: coniferous forest.
3.3. Differences in ecosystem services
The wood provision service capacity of F3 is the strongest among forest types, followed by F4, and F1 is the weakest (Figure 5). F1 is a planted economic forest, whose main purpose is to provide fruit and improve the local economic level. When the trees are too old to bear fruit, farmers cut them down and replant new seedlings. It is under strong disturbance by human activities, so the trees in F1 are generally short. Other forest types are natural forests in the state of closed mountains for afforestation, which are less disturbed by human activities and have good community succession. However, different successional stages lead to significant differences in community structure and productivity. F3 is close to the top succession, and the average tree height, DBH, and the number of trees per unit area are the highest, which makes its unit wood volume higher than other forest types.
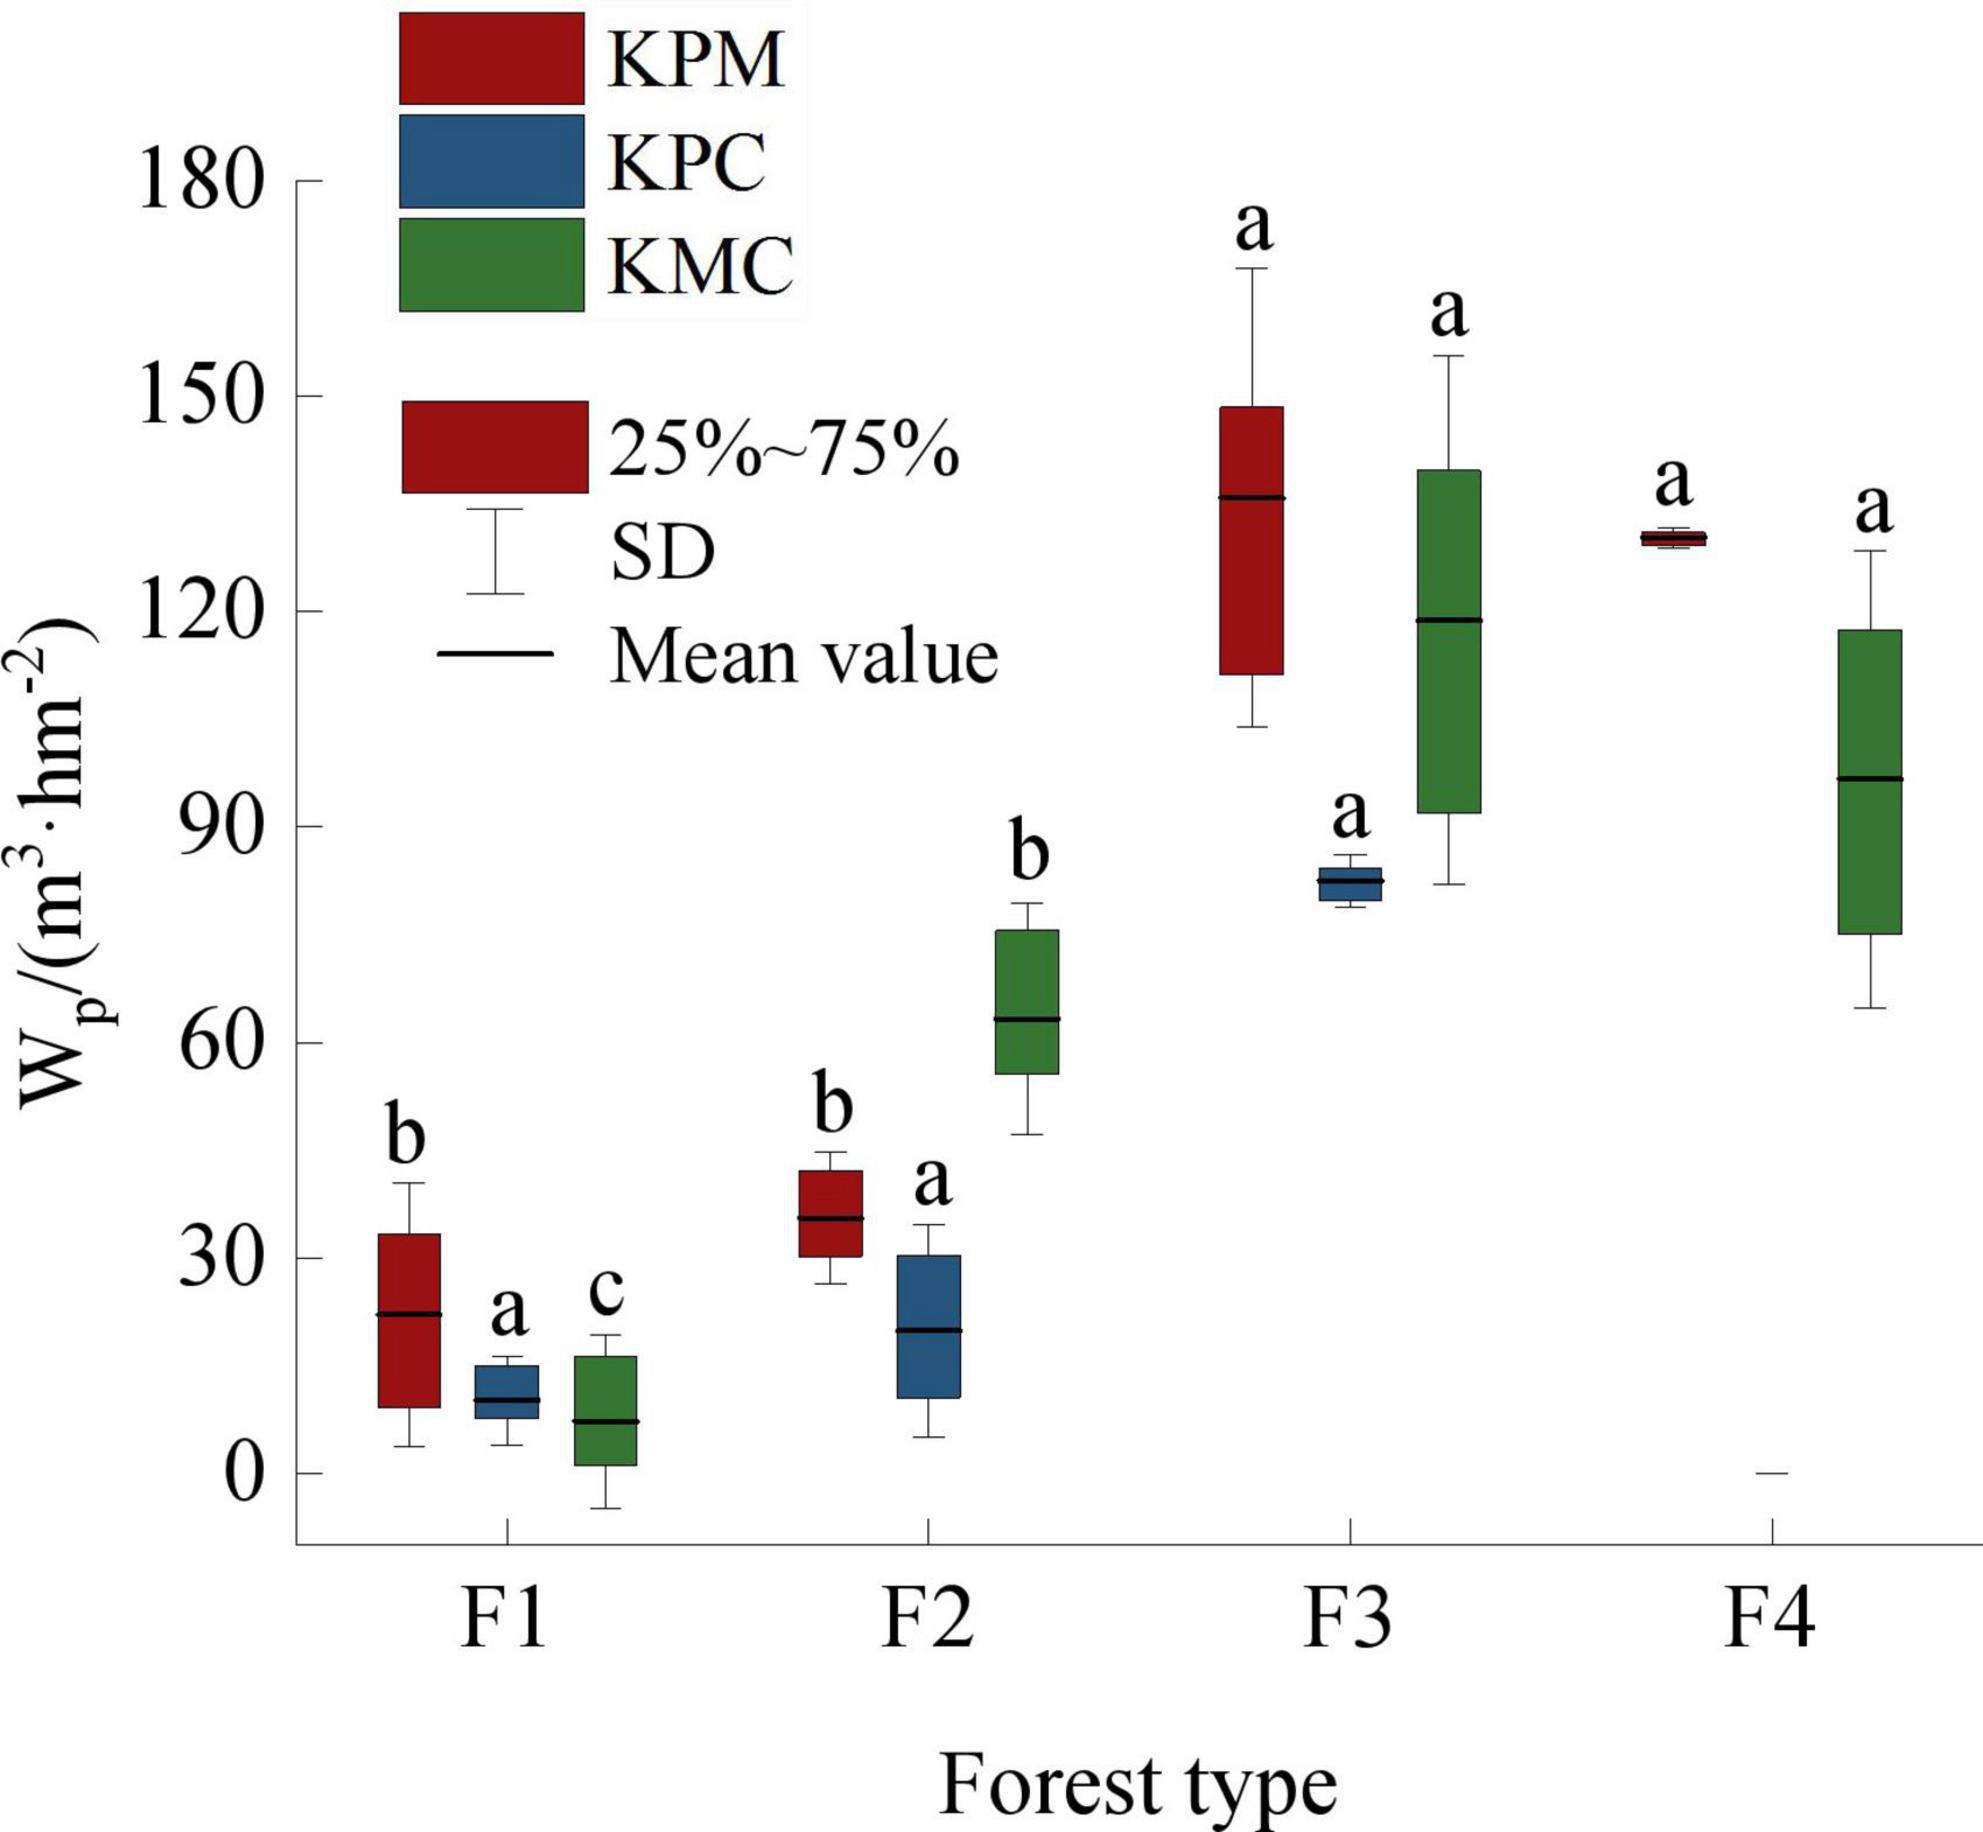
Figure 5. Wood product provision service. Different letters represent significant differences of different forest types (p < 0.05). KPM, karst plateau mountain; KPC, karst plateau canyon; KMC, karst mountain canyon. F1: broad-leaved monoculture forest; F2: broad-leaved mixed forest; F3: coniferous and broad-leaved mixed forest; F4: coniferous forest; Wp: wood producing.
There are significant differences in soil nutrients mean value under different forest types (p < 0.05) (Figure 6). OC and TN contents increased with the increase in species diversity, but TP and TK were inversely proportional to species diversity. Element C is the basic element that constitutes the plant skeleton. The decomposed plant litter provides the source of organic matter for the soil. F3 has the most species and quantity of plants, and the most litter as a source of soil nutrients. In addition, there are nitrogen-fixing plants such as Robinia hartwigii Koehne and Trifolium repens Linnaeus in some sample plots, so the OC and TN content in soil of F3 is the highest. Plant diversity in F4, F2, and F1 decreased gradually, and soil nutrient sources also showed a downward trend. Although fertilization was stopped 12 months before sampling, but due to F1 being an artificial economic forest, there may have been fertilizer that had not been fully absorbed by the soil. In addition, the less plants absorb, the less TP and TK is made available, so F1 has the highest content of TP and TK.
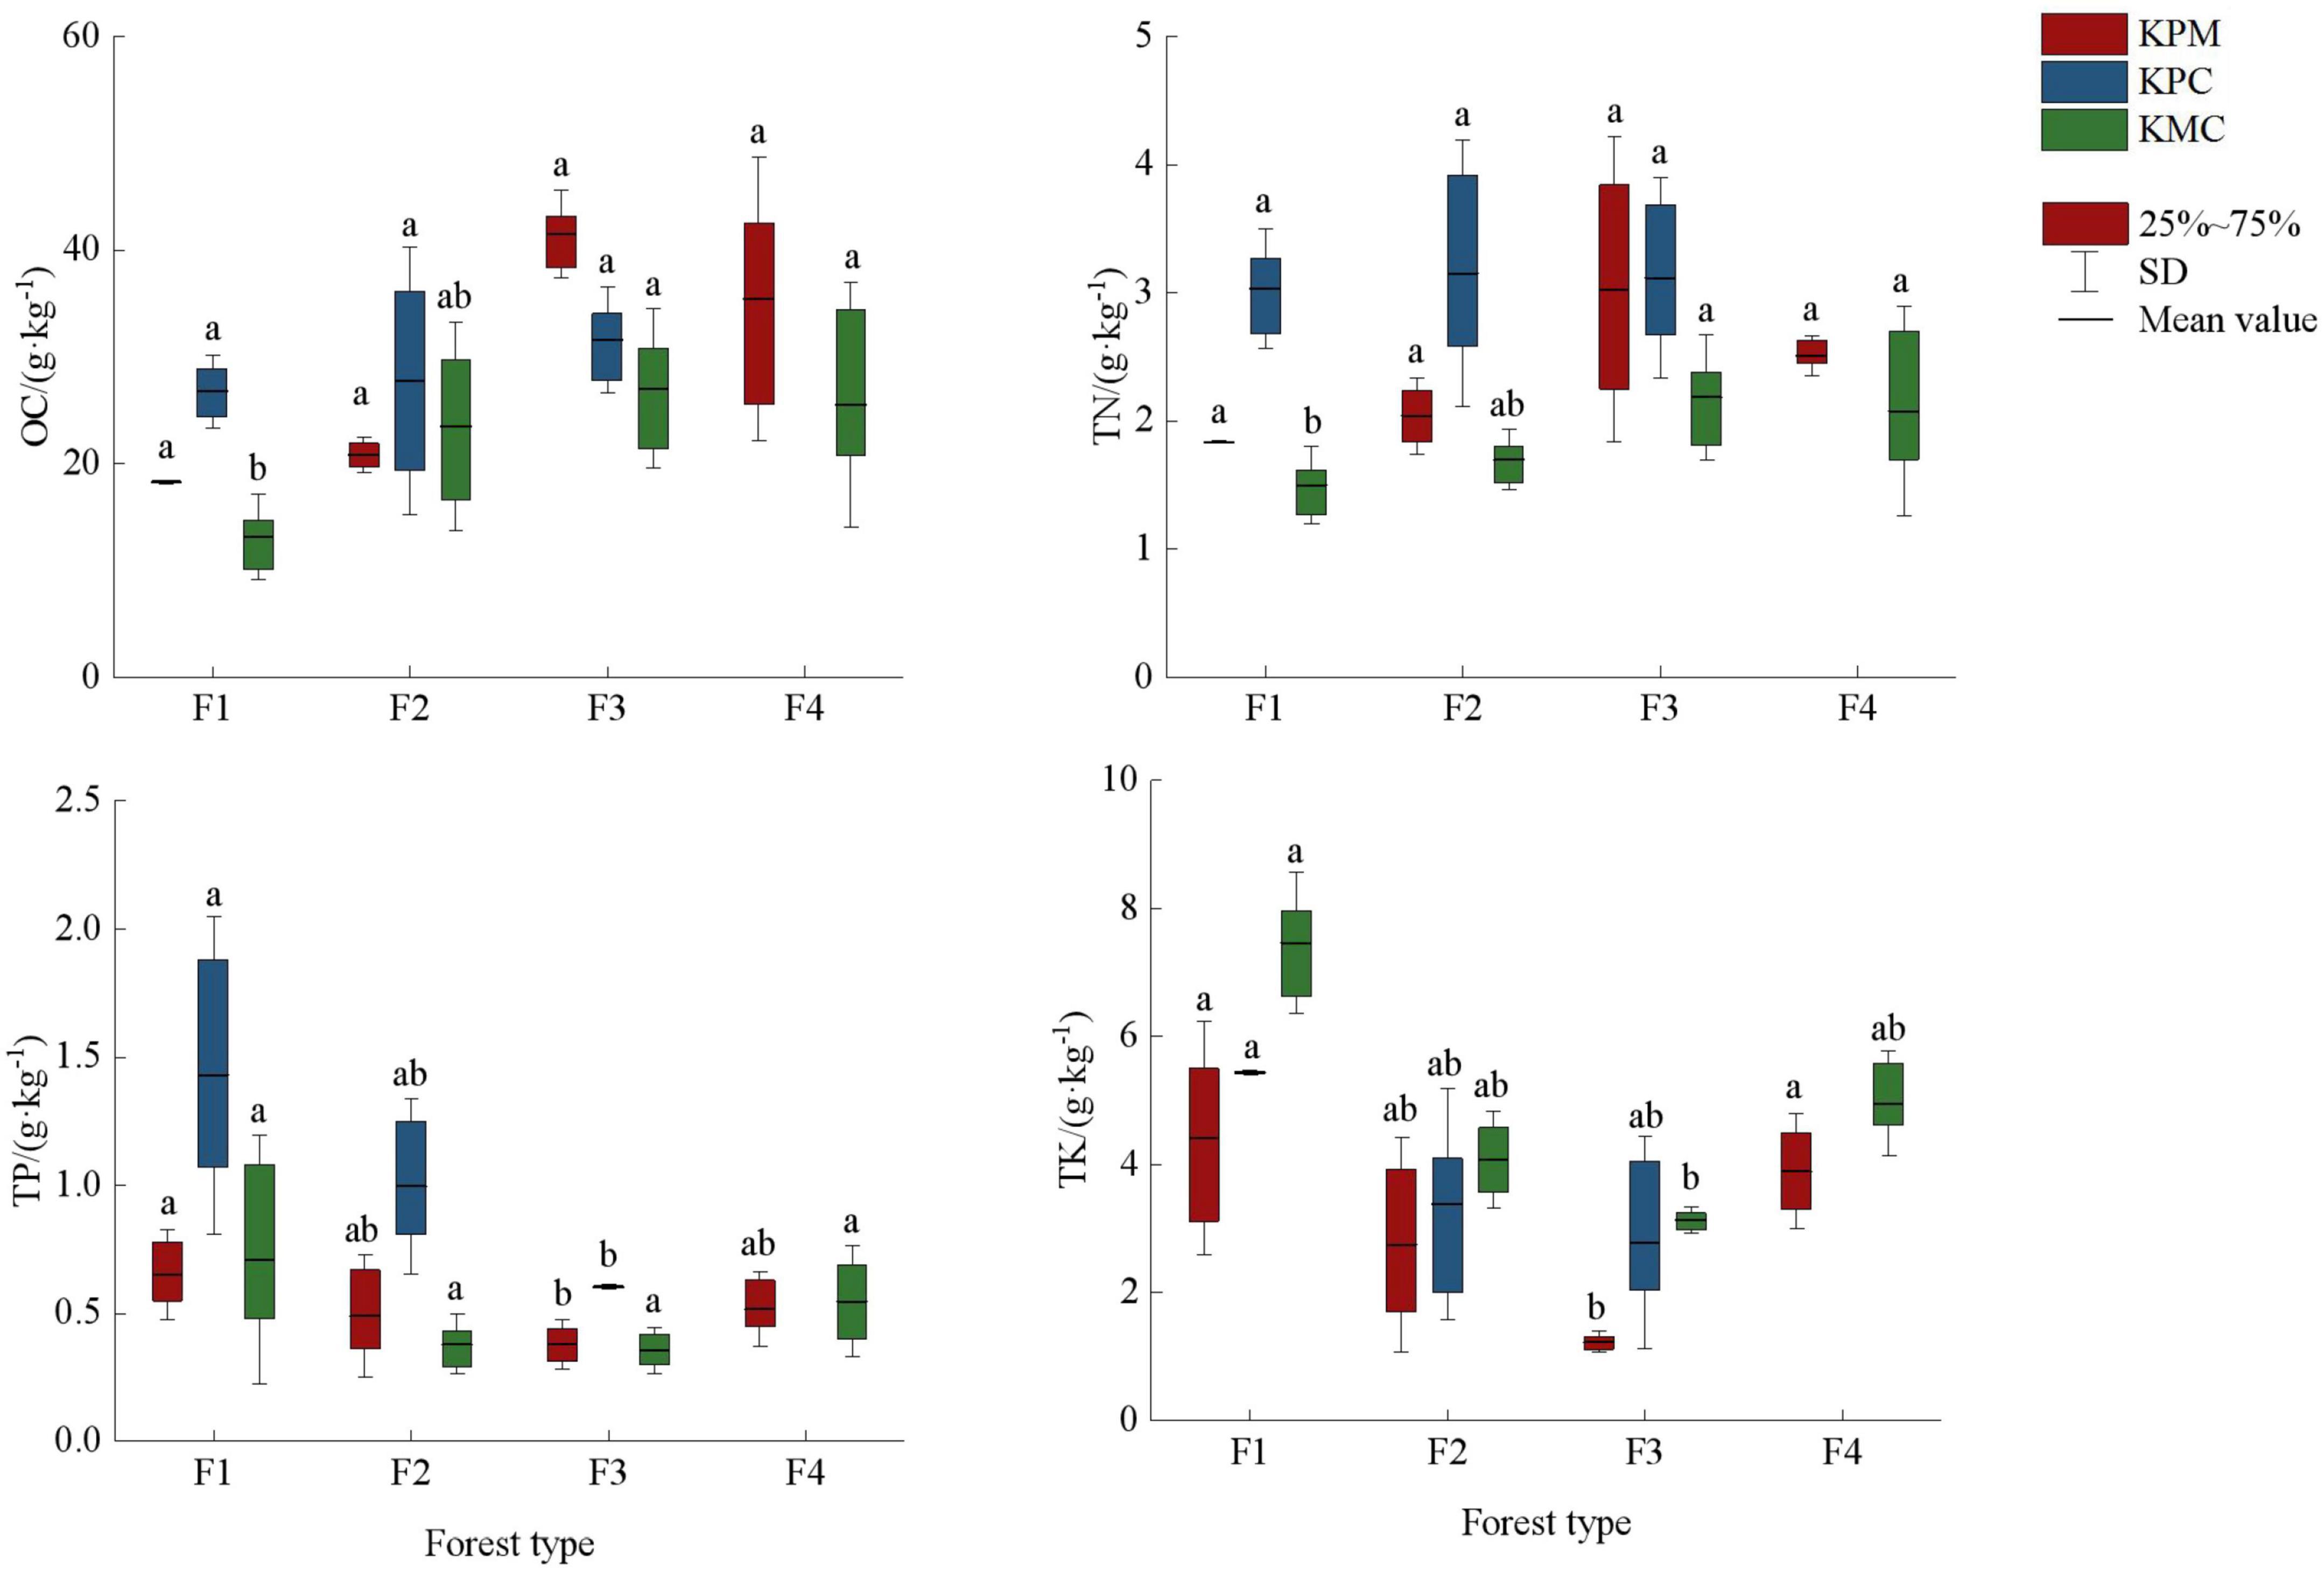
Figure 6. Soil nutrient fixation service. Different letters represent significant differences of different forest types (p < 0.05). KPM, karst plateau mountain; KPC, karst plateau canyon; KMC, karst mountain canyon. F1: broad-leaved monoculture forest; F2: broad-leaved mixed forest; F3: coniferous and broad-leaved mixed forest; F4: coniferous forest; OC, organic carbon; TN, total nitrogen; TP, total phosphorus; TK, total kalium.
There are significant differences in mean air regulation and water regulation among the forest types (p < 0.05). The air regulation showed F3 > F4 > F2 > F1, and the change trend of water regulation in the three landforms differently (Figure 7). The forest density and plant productivity of F1, F2, F4, and F3 showed a gradual increasing trend, which promoted the same change trend of carbon storage and oxygen release among forest types. Similarly, high plant productivity and rapid metabolic processes lead to more litter and provide a large amount of organic matter for the soil. The higher vegetation coverage, the accumulation of litter, and the increase of soil porosity improve the water conservation capacity in F3. In addition to being affected by litter and soil properties, water holding capacity is also closely related to climate. The precipitation in KMC is greater than that in KPM and KPC, but the temperature is lower, resulting in no significant difference in water conservation capacity among different forest types.
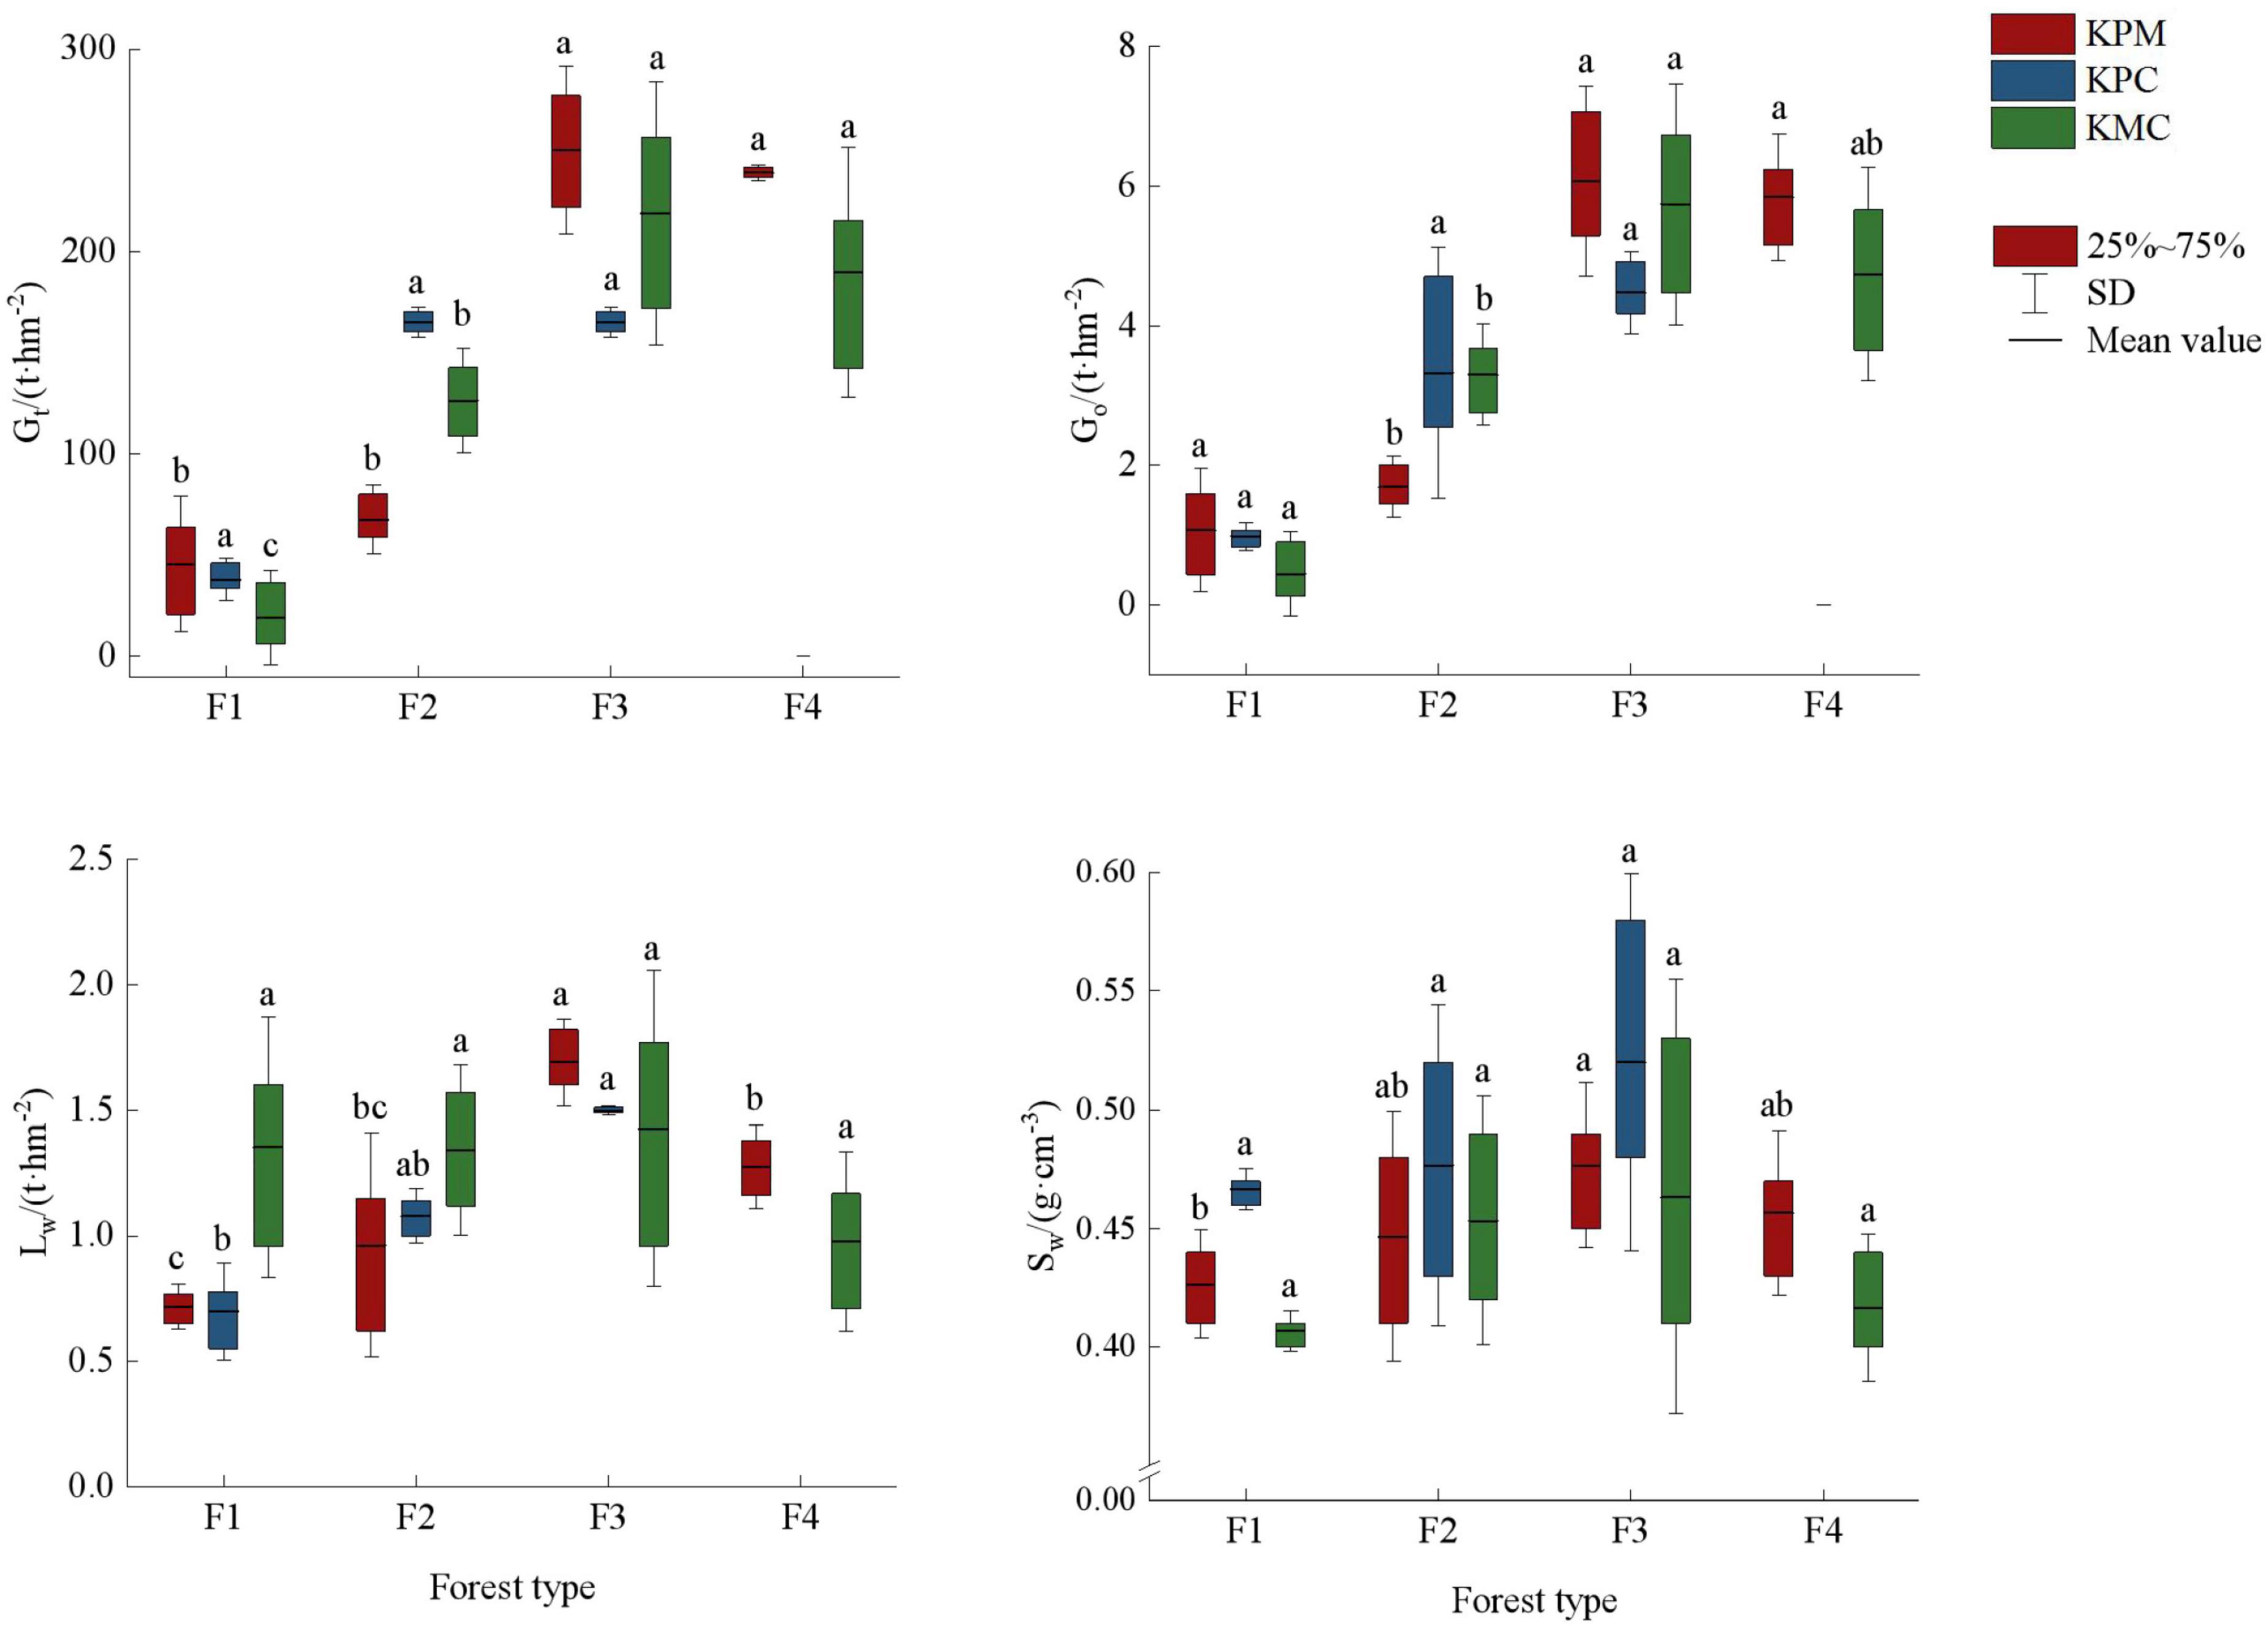
Figure 7. Regulating service. Different letters represent significant differences of different forest types (p < 0.05). KPM, karst plateau mountain; KPC, karst plateau canyon; KMC, karst mountain canyon. F1: broad-leaved monoculture forest; F2: broad-leaved mixed forest; F3: coniferous and broad-leaved mixed forest; F4: coniferous forest; Gt: total carbon storage; Go: oxygen release; Lw: water holding capacity of litter; Sw: water holding capacity of soil.
3.4. The relationship between driving factors and ecosystem services
Spatial structure, species diversity, and functional diversity were taken as explanatory variables, and taken ecosystem services as response variables. According to Figure 8, the sum explanation rate of the first two axis is 46.15%, with a total of 34.52% explained in the axis 1 and 11.63% in the axis 2. Mi, Wi, ICI, FEve, FDis, FRic, E, H’, and R explained 25.8, 2.1, 3.8, 5.1, 3.9, 0.8, 6.5, 5.3, and 1.9% of variance variation, respectively. Pearson correlation test showed a significant correlation (p < 0.05) between driving factors and ecosystem services (Table 4). Among them, Wi is significantly or extremely positively correlated with Wp, TN, Gt, Go, Sw, and negatively correlated with TK. It indicating that the uniform angle index is closely related to wood production and regulation services, but has a reverse effect on soil TK. Mi has a significant or extremely significant positive correlation with Wp, Gt, Go, Lw, Sw, and OC, while it has a very significant negative correlation with TP and TK. This reflects that the Mingling index has a promoting effect on wood production, soil OC, and regulation services, while it has a counterproductive effect on soil TP and TK. ICI only reached a significant level with TK, indicating that the impact of competition index on ecosystem services is relatively small. The species diversity index was significantly or extremely significantly positively correlated with Wp, Gt, Go, Lw, Sw, and negatively correlated with TP and TK, indicating that species diversity can promote wood production, the regulation of water and air, but it has a trade-off relationship with soil TP and TK. FRic has significant positive correlation with TN and Sw, reflecting a close relationship between functional richness and soil. The correlation between FEve and Wp, Gt, Go, Lw, TP, TK reached a significant level, reflecting that functional evenness has a certain impact on wood provision, regulation, and support services. FDis is significantly or extremely positively correlated with TP and TK, and negatively correlated with Wp, Gt, and Go, indicating that functional dispersion has a reverse impact on wood supply and regulation services. In general, spatial structure and species diversity have greater impact on ecosystem services than functional diversity.
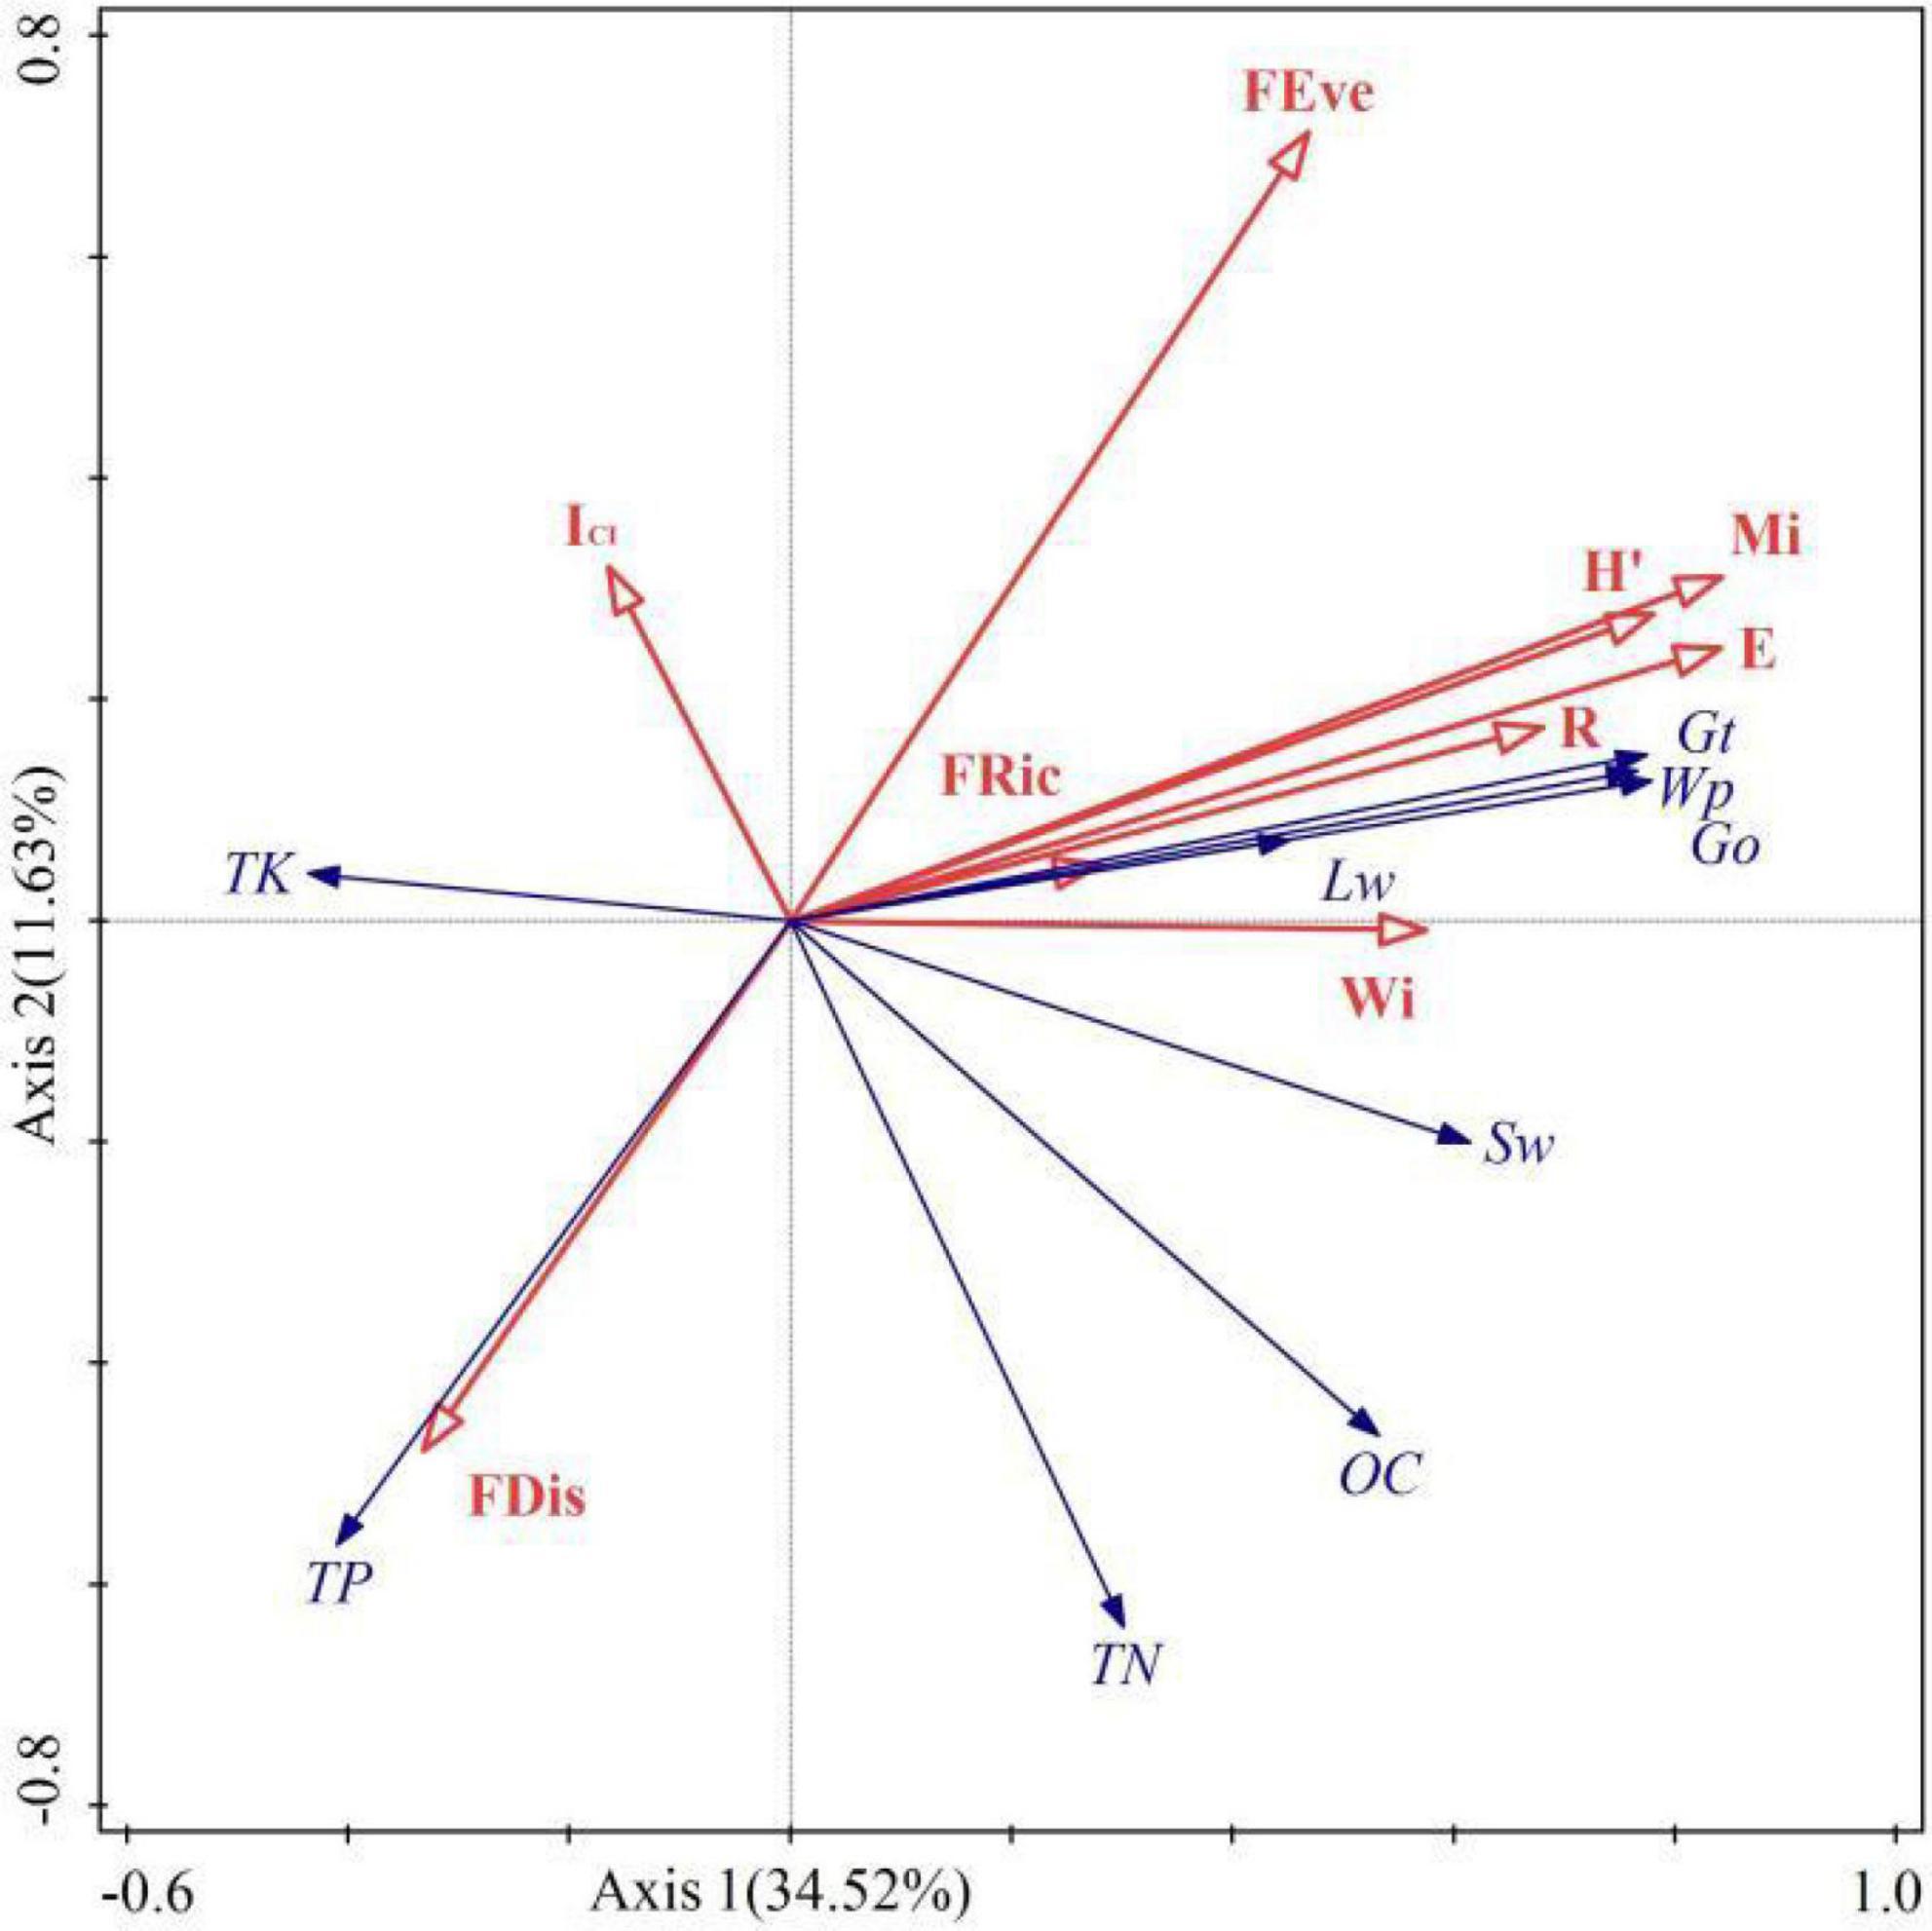
Figure 8. Redundancy analysis of driving factors and ES. The red arrows represent the driving factors (independent variable), and the blue arrows represent ES (dependent variable).
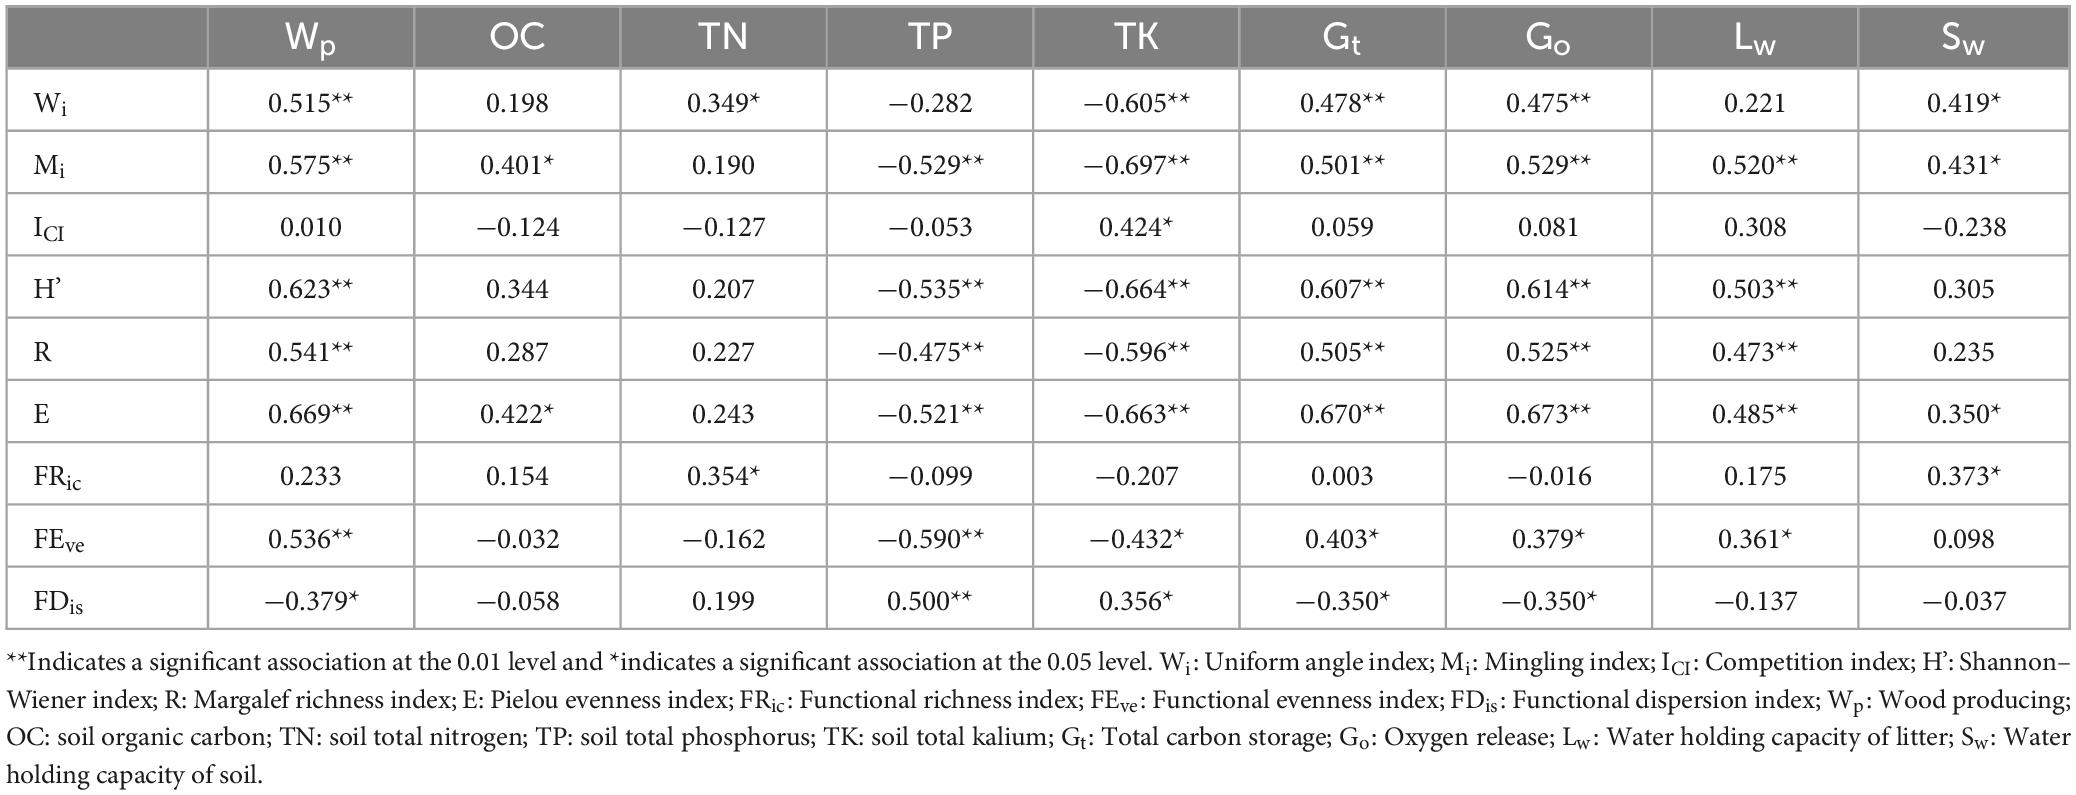
Table 4. Pearson correlation analysis between driving factors and ES.
4. Conclusion and discussion
The spatial structure, diversity and ES supply capacity of the coniferous and broadleaved mixed forest are generally superior to other forest types. A better spatial structure with a higher level of diversity can generate more wood and provide more sources of soil nutrients, as well as stronger regulation capacity. Spatial structure affects plant productivity through interspecific relationships; soil fertility is restricted more by diversity; gas and water regulation are influenced by both spatial structure and diversity levels. Under the influence of various driving factors, there is a synergistic effect between ecosystem services. There is a progressive driving role between spatial structure, biodiversity, and ecosystem services. In the process of forest management, the optimization of forest spatial structure is helpful to biodiversity conservation and ecosystem function improvement.
The forest spatial structure plays a greater role in wood provision services. The tree height, DBH, and the number of trees determine the wood productivity and reflect the spatial structure characteristics of the forest. The wood provision capacity of different forest types in the three study areas changed in the same trend with the increase or decrease in uniform angle index and mingling, but it was inversely proportional to competition index. Planted economic forest is a single-layer, same-age monoculture forest type planted for ecological conservation and economic development, it provided many material goods and services as important multifunctional agricultural production subjects (Xiao and Xiong, 2022). The trees’ distribution is in a regular state (Wi < 0.475), and the intraspecific competition is fierce, the quantity of trees per plot are also less than the multilayer mixed forest of different ages. In addition, the desertification area in this area accounts for 30% of the total area, and the serious soil erosion lead to shallow soil layer and low nutrient content, which make difficulties for plants to growth (Zhang et al., 2021). Meanwhile, farmers’ pruning and disafforestation in order to improve the fruit yield and facilitate management limits the growth height of trees to a certain extent. The above factors comprehensively lead to the lower wood yield of monoculture forest than other forest types. The other three forest types are multilayered mixed forests with different ages growing under natural conditions, which are in random distribution (0.475 < Wi < 0.517) or aggregate distribution (Wi > 0.517) (Hui et al., 2016). The dual spatial structure of karst promotes the lack of surface water, and the material circulation is slower than that in non-karst areas. Therefore, the vegetation in sample plots of broad-leaved mixed forest are dominated by shrubs. The quantity of trees is less and their DBHs are not more than 15 cm. Therefore, wood production ranks third. In coniferous mixed forest, coniferous trees account for more than 85%, and the stand density is second only to coniferous and broad-leaved mixed forest. Coniferous and broad-leaved mixed forest has the highest tree height, DBH, and number of trees among the four forest types, which leads to the highest wood production capacity, followed by coniferous mixed forest. Generally, the spatial structure of coniferous and broad-leaved mixed forest is the best among the four forest types, and other forest types should implement artificial management measures to optimize the stand structure.
Soil nutrient-supporting services are mainly affected by biodiversity. Vegetation can change soil structure through root growth, and root exudates, plant residues and dead leaves can input more organic substances into the soil system and improve soil quality (Hu and Guo, 2012). Higher plant diversity spatially extended the nutrient cycling through the microbial communities to deeper soil layers from which nutrients were transferred to the topsoil by deep-rooting plants (Lange et al., 2019). In this study, soil OC and TN increased with the increase in species diversity. Because the Guizhou Plateau is mainly mountainous, with high altitude and steep terrain, nutrients loss easily with water. Single species composition and community structure in monoculture forest limited the source of litter, the type and quantity of litter are lower than other forest types, which limited the source of soil C and N. The amount of nutrient returned is small, which made the “supply” of soil nutrients greater than the “return,” resulting in lower soil fertility (Li et al., 2014). The greater species composition in other forests produced a greater variety and quantity of litter, which provided more humus and nutrients for the soil under the forest. Soil nutrients and soil microbial diversity are generally in direct proportion to litter diversity (Faceli and Pickett, 1991), and soil microbial quantity plays an important role in soil quality and plant productivity (van der Heijden et al., 2008). Therefore, a virtuous cycle of “plant–litter–microbial–soil nutrient” has been formed in the community with higher species composition. TP and TK showed negative correlation with species diversity among the four forest types. Because the P element mainly comes from rock weathering, and plants and microbial can only use 0.1–2% of the K element in soil (Li, 2015). The desertification area in this area accounts for 87.92% of the total area. The soil layer is shallow and broken, and the bedrock is exposed in a large area, and the P element is enriched in the soil after weathering; moreover, the lower the variety in plant species and quantity, the lower the nutrient absorption and utilization rate. So, it showed a trend of higher species diversity and lower soil TP and TK.
Regulation services are driven by both spatial structure and biodiversity. Many studies have proven that species diversity and functional diversity have positive effects on ecosystem functions (such as productivity, carbon storage, etc.) (Lanta and Lepš, 2006; Cavanaugh et al., 2014). The mixed forest has large density, and the plants use more resources to maintain the growth height to obtain more sunlight (Poorter et al., 2003), which promotes a positive correlation between carbon fixation, oxygen release, and plant productivity. The research results of Zheng et al. (2007) showed that the carbon content of terrestrial higher plants ranged from 24.95 to 55.44%. In this study, the average biomass of coniferous and broad-leaved mixed forest plots were 4–515% higher than the other three forest types. The high species number, tree height, and DBH increased the community productivity, and promoted the carbon fixation and oxygen release significantly more than other forest types. Monoculture forest has the least biomass, so it has less carbon storage and oxygen release. In addition, the difference of plant functional traits is also an important reason for the change in regulatory services. In order to maintain their own survival and reproduction, plants usually improve their environmental adaptability by regulating functional traits (McIntyre et al., 1999). In the desertification environment, plants are under serious drought stress, and more resources are used to maintain plant survival rather than sustainable growth. The higher the degree of desertification, the less the number of species and amount of functional diversity. More species diversity produces higher functional diversity and improves the overall resource utilization efficiency and productivity of the community.
Due to the phenology process, plants wither and form dead branches and leaves, and uncorrupted litter accumulates under the forest. When precipitation occurs, the litter reabsorbs water and becomes an important storage source for forest water conservation. Coniferous and broad-leaved mixed forest has the largest number and different species of plants and produces the largest amount of litter, which has a stronger water conservation capacity than other forest types. In terms of soil water retention, litter layer and plant underground functional traits are also closely related to soil moisture except for soil properties (Burrows and Appold, 2015; Fu et al., 2021). For example, the planting of Zanthoxylum bungeanum improved the shallow soil hydraulic properties in karst areas and can play a positive role in water conservation (Liu et al., 2021). In the process of precipitation, after the litter layer is saturated, the water seeps into the surface soil through the litter layer and is finally stored in the soil. When the precipitation stops, the litter layer hinders the evaporation of soil water and adopts a protective function. The humus layer formed by thick litter of coniferous and broad-leaved mixed forest absorbs a lot of water and covers the surface soil, resulting in a significantly higher soil water capacity of this forest type than other types, which is also the reason for the significant positive correlation between litter water capacity and soil water capacity. The litter of coniferous mixed forest is mainly coniferous, with developed leaf fiber, high lignin content, and oil content in the leaves, which makes it more difficult to decompose (Huang et al., 2007). Therefore, the water holding capacity of the litter is weaker than that of the broad-leaved forest. However, the accumulation of the litter layer is thicker, which slows down the evaporation of soil water, resulting in higher soil water holding capacity of coniferous mixed forest sample plots than monoculture forest and broad-leaved mixed forest. In addition, the space formed after the decay of plant roots is also important for storing water. Among the four forest types, coniferous and broad-leaved mixed forest has the largest stand density, the densest plant roots and the highest soil porosity. Although the density of coniferous forest is close to coniferous and broad-leaved mixed forest, the root system of pine trees is not as developed as broad-leaved trees, and the number of fine roots is also small, which resulted in the soil water capacity of some sample plots in the coniferous forest being lower than that of the broad-leaved mixed forest. The monoculture forest is significantly lower than other forest types in both litter layer and root function, so its water conservation capacity is the weakest among the four forest types. As a typical Karst landform area, water in Guizhou Plateau leak into underground space, which also have an important impact on forest water conservation.
The optimization of forestry ecosystem structures and the improvement in stability play a vital role in the long-term maintenance of forestry ecosystem service supply capacity (Jiang et al., 2022). Both forest spatial structure and biodiversity play an important role in driving ES, but they do not have an independent impact. The spatial structure changes the function of the species ecosystem by changing the interspecific relationship, and finally impacts ES. Given the severe soil erosion, weak stability of vegetation communities, and deteriorating ecosystems in karst desertification areas, a combination of forest sealing and artificial planting could enhance the vegetation cover, strengthen the ability to fix soil and retain water, and eventually, improve the system’s stability (Deng et al., 2023). Taking forest management measures such as mixed planting of different economic tree species, intercropping of forest and grain/grass, cultivation of uneven-aged forest, and development of understory industry (Gu et al., 2008) to transform the community into a multiple-layer mixed forest of different ages (Kaya et al., 2016), which is conducive to the stability of the community structure and the maintenance of the system’s versatility. At the same time, in places with poor soil, it is helpful to improve soil quality by returning straw to the field and replacing fertilizer with farmyard manure. The above measures can not only improve the utilization rate of resources, but also help to increase the aboveground and underground biodiversity, improve the community structure, and enhance the stability of the ecosystem (Tilman et al., 1997; Gao and He, 2010). In natural forests, it is difficult to grow for under forest plants due to high canopy density in some plots (Figure 9). In order to improve the stand structure and stand quality, it is necessary to take the technical forest management measure of thinning to reasonably adjust the stand density, so as to change the light, temperature, soil nutrients, water, and other micro-environments in the forest, which has an important role in promoting the growth of the stand, the development and distribution of the understory vegetation, and soil improvement (Wang et al., 2022). In coniferous forests, coniferous species occupy an absolute advantage, while other species account for no more than 15% of the community, and most of them are shrubs, which are at a disadvantage in the competition. Therefore, thinning and replanting should be carried out in coniferous mixed forests with high stand density. Unhealthy and over-dense trees should be removed and broad-leaved trees should be replanted to reduce the proportion of coniferous trees to increase aboveground and underground biodiversity and improve soil quality. The broad-leaved mixed forests have high species diversity, but due to the shallow soil layer and strong negative human interference, the vegetation is dominated by shrubs or low trees, the community hierarchical structure is incomplete, and the productivity is low. This forest type should be pruned and replanted large tree species. Firstly, the low trees must be pruned to increase the height under the tree branches and promote the community succession to the next stage. Secondly, redundant shrub species need to be cut down and tall broad-leaved tree species such as Robinia pseudoacacia L., Quercus fabri Hance, and Populus L. can be replant, completing the community hierarchy and improving the ecosystem stability. Finally, artificial fertilization should be carried out in places with poor soil to improve soil quality and provide enough nutrients for plant growth (Hu et al., 2022).
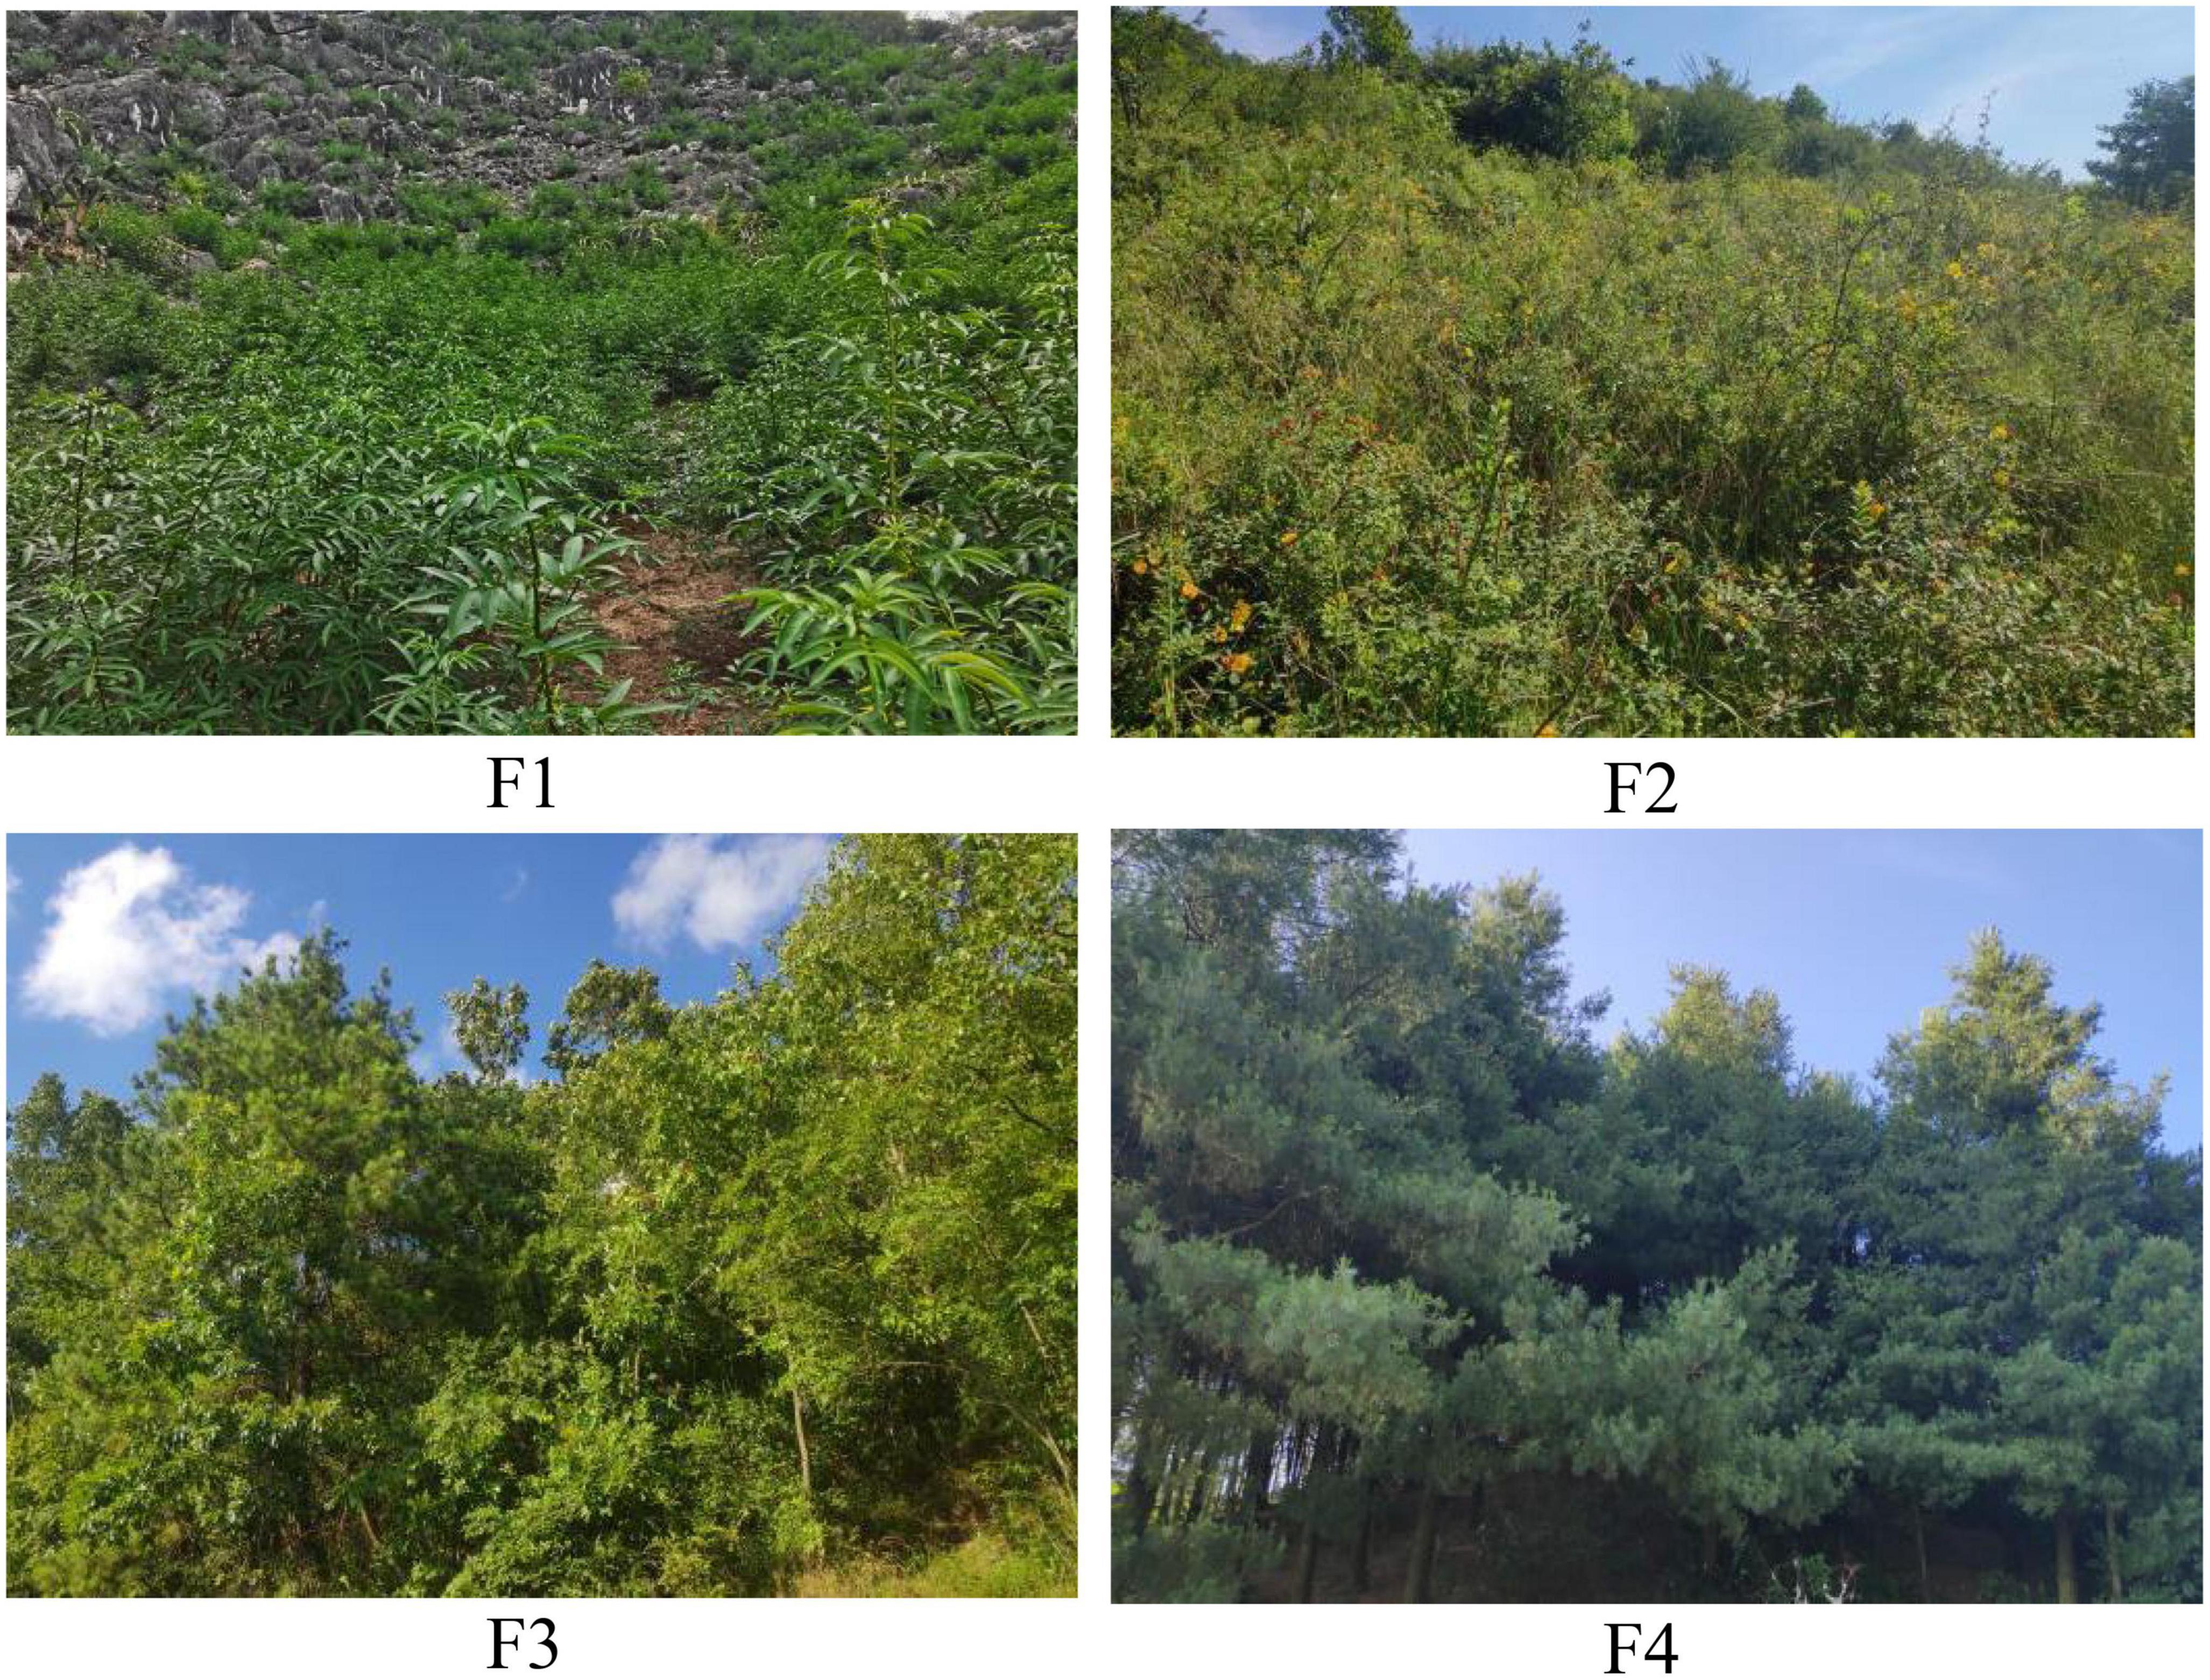
Figure 9. Comparison of different forest types.
In this study, Juglans regia L., Zanthoxylum bungeanum Maxim., and Pyrus pyrifolia “Whangkeumbae” plantations were selected in the KPM, KPC, and KMC. The plantations might have differences in the distribution pattern of trees due to landform, which affects the spatial structure of the forest. For example, KPM is mainly mountainous and hilly. In the horizontal direction, the trees are parallel to the contour line, but in the vertical direction, they are randomly distributed. Due to the serious desertification and broken soil mass in KPC, some trees are scattered with the soil mass. KMC is also dominated by mountains and hills, but the terrain is flat, and the soil layer is thicker than KPM and KPC. When planting, they are usually distributed in regular rows and columns. Compared with natural forest, plantation has larger plant spacing, smaller stand density, and more regular distribution. The spatial structure of different plantations is quite different, which may lead to some fluctuations in the calculation of results.
The plantations in three landforms are all economic trees planted to increase the income of rural residents. Farmers usually apply chemical fertilizer in the plantation to improve the fruit yield. In order to eliminate the interference of artificial fertilization, the sample plots stopped fertilization 12 months before sampling. Therefore, there is no effect of artificial fertilization on soil nutrients in this study. However, due to the limitations of the sample plots conditions, the forest age was not investigated in detail in this study, which may have an impact on wood provision services. The forest’s age should be considered as one of the driving factors in the follow-up study.
Human activities, climate change, and geographical environment are indirect factors that affect ES. This study discussed the direct impact of forest spatial structure and biodiversity on ES; the indirect factors were not mentioned. In the future study, the driving effect of multiple influencing factors combined with indirect and direct driving factors on ES should be an important research direction. Furthermore, the role of animals and microorganisms in the multiple functionality of forest ecosystems also needs to be further explored.
Data availability statement
The original contributions presented in this study are included in the article/supplementary material, further inquiries can be directed to the corresponding author.
Author contributions
KX and LK: conceptualization and validation. LK and YY: methodology, formal analysis, and writing—review and editing. LK: software, data curation, writing—original draft preparation, and visualization. LK, SZ, and XD: investigation. LK, SZ, YY, and XD: resources. KX: supervision, project administration, and funding acquisition. All authors have read and agreed to the published version of the manuscript.
Funding
This research was supported by the Key Science and Technology Program of Guizhou Provence: Poverty Alleviation Model and Technology Demonstration for Eco-industries Derivated from the Karst Desertification Control (No. 5411 2017 Qiankehe Pingtai Rencai), the Oversea Expertise Introduction Program for Discipline Innovation of China: Overseas Expertise Introduction Center for South China Karst Eco-environment Discipline Innovation (No. D17016), and the National Major Research and Development Program of China: Ecological Industry Model and Integrated Technology Demonstration of the Karst Plateau-Gorge Rocky Desertification Control (2016YFC0502607).
Acknowledgments
We would like to thank all the editors for their contributions to this manuscript and the reviewers for their thoughtful comments, which enriched the manuscript.
Conflict of interest
The authors declare that the research was conducted in the absence of any commercial or financial relationships that could be construed as a potential conflict of interest.
Publisher’s note
All claims expressed in this article are solely those of the authors and do not necessarily represent those of their affiliated organizations, or those of the publisher, the editors and the reviewers. Any product that may be evaluated in this article, or claim that may be made by its manufacturer, is not guaranteed or endorsed by the publisher.
References
Atkins, J. W., Fahey, R. T., Hardiman, B. H., and Gough, C. M. (2017). Forest canopy structural complexity and light absorption relationships at the subcontinental Scale. J. Geophys. Res. Biogeosci. 123, 1387–1405. doi: 10.1002/2017JG004256
Burrows, C. R., and Appold, M. S. (2015). Hydrology of the forest city basin, mid-continent, USA: Implications for CO2 sequestration in the St. Peter Sandstone. Environ. Earth Sci. 73, 1409–1425. doi: 10.1007/s12665-014-3494-0
Cavanaugh, K. C., Gosnell, J. S., Davis, S. L., Ahumada, J. A., Boundja, P., Clark, D. B., et al. (2014). Carbon storage in tropical forests correlates with taxonomic diversity and functional dominance on a global scale. Glob. Ecol. Biogeogr. 23, 563–573. doi: 10.1111/geb.12143
Chen, X. L., Ju, Q., and Lin, K. L. (2014). Development status, issues and countermeasures of China’s plantation. World For. Res. 27, 54–59.
Chen, Y. J., Cao, K. F., Schnitzer, S. A., Fan, Z. X., Zhang, J. L., and Bongers, F. (2015). Water-use advantage for lianas over trees in tropical seasonal forests. New Phytol. 205, 128–136. doi: 10.1111/nph.13036
Cornelissen, J. H. C., Lavorel, S., Garnier, E., Diaz, S., Buchmann, N., Gurvich, D. E., et al. (2003). A handbook of protocols for standardized and easy measurement of plant functional traits worldwide. Aust. J. Bot. 51, 335–380. doi: 10.1071/BT02124
Cui, F. Q., Wang, B. J., Zhang, Q., Tang, H. P., De Maeyer, P., Hamdi, R., et al. (2021). Climate change versus land-use change-What affects the ecosystem services more in the forest-steppe ecotone? Sci. Total Environ. 759:143525. doi: 10.1016/j.scitotenv.2020.143525
Deng, X. H., Xiong, K. N., Yu, Y. H., Zhang, S. H., Kong, L. W., and Zhang, Y. (2023). A review of ecosystem service trade-offs/synergies: Enlightenment for the optimization of forest ecosystem functions in karst desertification control. Forests 14:88. doi: 10.3390/f14010088
Faceli, J. M., and Pickett, S. T. A. (1991). Plant litter: Its dynamics and effects on plant community structure. Bot. Rev. 57, 1–32. doi: 10.1007/BF02858763
Fornara, D. A., and Tilman, D. (2008). Plant functional composition influences rates of soil carbon and nitrogen accumulation. J. Ecol. 96, 314–322. doi: 10.1111/j.1365-2745.2007.01345.x
Fu, P. C., Hu, G. L., Gong, W., Li, H. R., and Zhou, C. (2021). Soil physical properties and water retention characteristics of the sand-fixing plant root zone in the desert-oasis transition area of Gansu Corridor, Chine. J. Soil Sci. 52, 811–820.
Gao, D., and He, X. H. (2010). Research advances on biodiversity and ecosystem stability. Chin. J. Ecol. 29, 2507–2513.
Gu, X. J., Cao, L. M., Ye, Z. W., Huang, Q. Z., Zhu, J. J., and He, D. Q. (2008). Studies on the mode of under-forest economy and the development countermeasure of under-forest industry. Acta Agric. Shanghai 3, 21–24.
Guizhou Standardized Public Service Platform (2013). Available online at: http://db52.amr.guizhou.gov.cn/portal/localStandardsSearch?searchName= (accessed December 1, 2022).
Hanif, M. A., Guo, Z., Moniruzzaman, M., He, D., Yu, Q., Rao, X., et al. (2019). Plant taxonomic diversity better explains soil fungal and bacterial diversity than functional diversity in restored forest ecosystems. Plants 8:479. doi: 10.3390/plants8110479
Hardiman, B. S., Larue, E. A., Atkins, J. W., Fahey, R., Wagner, F., and Gough, C. (2019). Spatial variation in canopy structure across forest landscapes. Forests 9:474. doi: 10.3390/f9080474
He, L. L., Qiang, W., Zhang, Y., Liu, Y., Liu, B., and Pang, X. Y. (2021). Effect of secondary succession on the soil water holding capacity of subalpine coniferous forest in western Sichuan, China. Chin. J. Appl. Environ. Biol. 27, 639–647.
Helseth, E. V., Vedeld, P., Framstad, E., and Gomez-Baggethun, E. (2022). Forest ecosystem services in Norway: Trends, condition, and drivers of change (1950–2020). Ecosyst. Serv. 58:101491. doi: 10.1016/j.ecoser.2022.101491
Hu, C. J., and Guo, L. (2012). Advances in the research of ecological effects of vegetation restoration. Ecol. Environ. 21, 1640–1646.
Hu, T. H., Li, K. P., Xiong, K. N., Wang, J., Yang, S., Wang, Z. F., et al. (2022). Research progress on water–fertilizer coupling and crop quality improvement and its implication for the karst rock desertification control. Agronomy 12:903. doi: 10.3390/agronomy12040903
Huang, J. J., Wang, X. H., and Yan, E. R. (2007). Leaf nutrient concentration, nutrient resorption and litter decomposition in an evergreen broad-leaved forest in eastern China. For. Ecol. Manag. 239, 150–158. doi: 10.1016/j.foreco.2006.11.019
Hui, G. Y., Hu, Y. B., Zhao, Z. Z., Yuan, S. Y., and Liu, W. Z. (2013). A forest competition index based on intersection angle. Sci. Silvae Sin. 49, 68–73.
Hui, G. Y., Klaus, V. G., Zhao, Z. H., Hu, Y. B., Xu, H., Li, Y. F., et al. (2016). Principles of structured forest management. Beijing: China Forestry Publishing House, 23–76.
IPBESs (2009). Summary for policymakers of the global assessment report on biodiversity and ecosystem services of the intergovernmental science-policy platform on biodiversity and ecosystem services. Bonn: IPBESs Secretariat, 56.
Jenkins, M., and Schaap, B. (2018). Background analytical study 1: Forest ecosystem services. Global forests goals; United Nations forum on forests. Available online at: https://www.un.org/esa/forests/wp-content/uploads/2018/05/UNFF13_BkgdStudy_ForestsEcoServices.pdf (accessed December 1, 2022).
Jiang, S. L., Xiong, K. N., and Xiao, J. (2022). Structure and stability of agroforestry ecosystems: Insights into the improvement of service supply capacity of agroforestry ecosystems under the karst rocky desertification control. Forests 13:878. doi: 10.3390/f13060878
Kaya, A., Bettinger, P., Boston, K., Akbulut, R., Ucar, Z., Siry, J., et al. (2016). Optimisation in forest management. Curr. For. Rep. 2, 1–17. doi: 10.1007/s40725-016-0027-y
Kong, L. W., Xiong, K. N., Zhang, S. H., Zhang, Y., and Deng, X. H. (2023). Review on driving factors of ecosystem services: Its enlightenment for the improvement of forest ecosystem functions in karst desertification control. Forests 14:582. doi: 10.3390/f14030582
Lange, M., Eisenhauer, N., Sierra, C. A., Bessler, H., Engels, C., Griffiths, R. I., et al. (2015). Plant diversity increases soil microbial activity and soil carbon storage. Nat. Commun. 6:6707. doi: 10.1038/ncomms7707
Lange, M., Koller-France, E., Hildebrandt, A., Oelmann, Y., Wilcke, W., and Gleixner, G. (2019). How plant diversity impacts the coupled water, nutrient and carbon cycles. Adv. Ecol. Res. 61, 185–219. doi: 10.1016/bs.aecr.2019.06.005
Lanta, V., and Lepš, J. (2006). Effect of functional group richness and species richness in manipulated productivity–diversity studies: A glasshouse pot experiment. Acta Oecol. 29, 85–96. doi: 10.1016/j.actao.2005.08.003
Li, J. P., Xu, M. F., Su, Z. Y., Sun, Y. D., and Hu, Y. Q. (2014). Soil fertility quality assessment under different vegetation restoration patterns. Acta Ecol. Sin. 34, 2297–2307. doi: 10.5846/stxb201306111672
Li, X., Niu, J., Zhang, L., Xiao, Q., McPherson, G. E., Van Doorn, N., et al. (2016). A study on crown interception with four dominant tree species: A direct measurement. Hydrol. Res. 47, 857–868. doi: 10.2166/nh.2015.066
Li, Y., Liu, Z. Q., Liu, G. H., Xiong, K. N., and Cai, L. L. (2020). Dynamic variations in soil moisture in an epikarst fissure in the karst rocky desertification area. J. Hydrol. 591:125587. doi: 10.1016/j.jhydrol.2020.125587
Liu, Q., Yin, H. J., Cheng, X. Y., Lin, B., Hu, R., Zhao, C. Z., et al. (2010). Problems and strategies of sustainable regeneration of plantation ecosystem in China. World For. Res. 23, 71–75.
Liu, Z. Q., Li, K. P., Xiong, K. N., Li, Y., Wang, J., Sun, J., et al. (2021). Effects of Zanthoxylum bungeanum planting on soil hydraulic properties and soil moisture in a karst area. Agric. Water Manage. 257:107125. doi: 10.1016/j.agwat.2021.107125
McIntyre, S., Lavorel, S., Landsberg, J., and Forbes, T. D. A. (1999). Disturbance response in vegetation—towards a global perspective on functional traits. J. Veg. Sci. 10, 621–630. doi: 10.2307/3237077
Millennium Ecosystem Assessment [MEA] (2005). Ecosystems and human well being: Current state and trends. Washington, DC: Island Press.
National Forestry and Grassland Administration (2020). Specifications for assessment of forest ecosystem services. GB/T 38582-2020. Beijing: Standards Press of China.
Olschewski, R., Sandström, C., Kasymov, U., Johansson, J., Fürst, C., and Ring, I. (2018). Policy forum: Challenges and opportunities in developing new forest governance systems: Insights from the IPBES assessment for Europe and Central Asia. For. Policy Econ. 97, 175–179. doi: 10.1016/j.forpol.2018.10.007
Peng, C. L., Qi, C. J., Yan, L. H., Liao, J. Y., Feng, G. X., and Lai, X. L. (2020). A comprehensive review on the relationship between biodiversity and ecosystem services. World For. Res. 33, 1–8.
Poorter, L., Bongers, F., Sterck, F. J., and Wöll, H. (2003). Architecture of 53 rain forest tree species differing in adult stature and shade tolerance. Ecology 84, 602–608. doi: 10.1890/0012-9658(2003)084[0602:AORFTS]2.0.CO;2
Referowska-Chodak, E. (2019). Pressures and threats to nature related to human activities in European Urban and Suburban Forests. Forests 10:765. doi: 10.3390/f10090765
Sun, Z., Sonsuthi, A., Jucker, T., Ali, A., Cao, M., Liu, F., et al. (2023). Top canopy height and stem size variation enhance aboveground biomass across spatial scales in seasonal tropical forests. Plants 12:1343. doi: 10.3390/plants12061343
Tilman, D., Wedin, D., and Knops, J. (1997). Productivity and sustainability influenced by biodiversity in grasland ecosys-tems. Nature 379, 718–720. doi: 10.1038/379718a0
van der Heijden, M., Bardgett, R. D., and Straalen, N. (2008). The unseen majority: Soil microbes as drivers of plant diversity and productivity in terrestrial ecosystems. Ecol. Lett. 11, 296–310. doi: 10.1111/j.1461-0248.2007.01139.x
van Ruijven, J., and Berendse, F. (2005). Diversity-productivity relationships: Initial effects, long-term patterns, and underlying mechanisms. Proc. Natl. Acad. Sci. U.S.A. 102, 695–700. doi: 10.1073/pnas.0407524102
Wang, J. J., He, T., Zhang, Y., Xu, H. L., and Li, B. W. (2022). Effects of thinning intensity on understory plant of natural forest in Altai Mountains, Xinjiang, China. Acta Ecol. Sin. 42, 9761–9768. doi: 10.5846/stxb202111153201
Wang, L. Y., Chen, Q., Zhou, Z. F., Zhao, X., Luo, J. C., Wu, T. J., et al. (2021). Crops planting structure and karst rocky desertification analysis by Sentinel-1 data. Open Geosci. 13, 867–879. doi: 10.1515/geo-2020-0272
Wang, Q., Zhang, Z. Y., and Xu, X. N. (2003). Soil properties and water conservation function of different forest types in Dabieshan District, Anhui. J. Soil Water Conserv. 3, 59–62.
Wang, Y., Liu, Z., Tang, T., and Li, J. (2023). Analysis of the relative importance of stand structure and site conditions for the productivity, species diversity, and carbon sequestration of Cunninghamia lanceolata and Phoebe bournei mixed forest. Plants 12:1633. doi: 10.3390/plants12081633
Wu, J., Yang, G. B., and Mao, C. Y. (2022). Study on ecosystem quality evaluation of typical karst rocky desertification fragile ecological area. J. Nat. Sci. Hunan Norm. Univ. 45, 41–49.
Xiang, B. W., Zeng, S. Q., Gan, S. S., Long, S. S., and Liu, X. (2019). Spatial stucture optimization of Quercus in Hunan. J. Cent. South Univ. For. Technol. 39, 33–40.
Xiao, J., and Xiong, K. N. (2022). A review of agroforestry ecosystem services and its enlightenment on the ecosystem improvement of rocky desertification control. Sci. Total Environ. 852:158538. doi: 10.1016/j.scitotenv.2022.158538
Xiong, K. N., and Chi, Y. K. (2015). The problems in Southern China Karst ecosystem in Southern of China and its countermeasures. Ecol. Econ. 31, 23–30.
Xiong, K. N., Li, P., Zhou, Z. F., An, Y. L., Lü, T., and Lan, A. J. (2002). Remote sensing and GIS typical study of karst rocky desertification: Taking Guizhou Province as an example. Beijing: Geology Press.
Yu, Y. H., Yu, Y., Yang, S. M., and Du, M. F. (2017). Degradation situation and restoration countermeasures of frost resistant and drought tolerant vegetation in Karst Plateau Mountain Area, China. World For. Res. 30, 72–75.
Yuan, C. J., Xiong, K. N., Rong, L., and Weng, Y. F. (2021). Research progress on the biodiversity during the ecological restoration of Karst rocky desertification. Earth Environ. 49, 336–345.
Zhang, S. H., Xiong, K. N., Qin, Y., Min, X. Y., and Xiao, J. (2021). Evolution and determinants of ecosystem services: Insights from South China karst. Ecol. Indic. 133:108437. doi: 10.1016/j.ecolind.2021.108437
Zhang, X., Johnston, E. R., Barberán, A., Ren, Y., Lü, X., and Han, X. (2017). Decreased plant productivity resulting from plant group removal experiment constrains soil microbial functional diversity. Glob. Change Biol. 23, 4318–4332. doi: 10.1111/gcb.13783
Zhang, Y., Xiong, K. N., Yu, Y. H., Yang, S., and Liu, H. Y. (2020). Stoichiometric characteristics and driving mechanisms of plants in Karst areas of rocky desertification of Southern China. Appl. Ecol. Environ. Res. 18, 1961–1979. doi: 10.15666/aeer/1801_19611979
Zheng, W. J., Bao, W. K., Gu, B., He, X., and Leng, L. (2007). Carbon concentration and its characteristics in terrestrial higher plants. Chin. J. Ecol. 3, 307–313.
Keywords: forest, driving factor, ecosystem services, karst desertification, function improving
Citation: Xiong K, Kong L, Yu Y, Zhang S and Deng X (2023) The impact of multiple driving factors on forest ecosystem services in karst desertification control. Front. For. Glob. Change 6:1220436. doi: 10.3389/ffgc.2023.1220436
Received: 10 May 2023; Accepted: 10 July 2023;
Published: 27 July 2023.
Edited by:
Yashwant Singh Rawat, Federal Technical and Vocational Education and Training Institute (FTVETI), EthiopiaReviewed by:
Cao Yang, Northwest A&F University, ChinaDapao Yu, Chinese Academy of Sciences (CAS), China
Copyright © 2023 Xiong, Kong, Yu, Zhang and Deng. This is an open-access article distributed under the terms of the Creative Commons Attribution License (CC BY). The use, distribution or reproduction in other forums is permitted, provided the original author(s) and the copyright owner(s) are credited and that the original publication in this journal is cited, in accordance with accepted academic practice. No use, distribution or reproduction is permitted which does not comply with these terms.
*Correspondence: Kangning Xiong, eGlvbmdrbkBnem51LmVkdS5jbg==