 Indira Paudel1
 Kyle M. E. Rose
 Simon M. Landhäusser
 Douglass F. Jacobs
- 1Department of Forestry and Natural Resources, Purdue University, West Lafayette, IN, United States
- 2Department of Renewable Resources, University of Alberta, Edmonton, AB, Canada
Introduction: Plant species often exhibit significant variation in functional traits in populations along elevational gradients to cope with varying stress conditions. While plant development has been assumed to be most limited by a single resource, growing evidence suggests the potential for interactions of co-limiting resources to impact plant performance. Here, we aimed to determine how light, nitrogen, and water availability influence the growth and physiology of different populations of koa (Acacia koa), a tree species of concern that occurs across a large elevational gradient in tropical Hawaii, United States.
Methods: Populations from three seed sources [low (L), mid (M), and high (H) elevation] were grown in a controlled greenhouse experiment and exposed to co-limiting light, water, and nutrient (nitrogen) conditions. Light response, gas exchange, water status, resource use efficiency, nutrients and shoot non-structural carbohydrate concentrations, and growth and biomass allocation responses were quantified.
Results: We found that resource co-limitation sometimes interacted to determine responses of the measured parameters. In general, the low elevation (L) koa population was more sensitive to conditions where both moisture and nutrients were limiting, while the high elevation (H) koa population was more sensitive to conditions where either light and moisture or light and nitrogen were co-limiting. The M population performed well overall regardless of resource limitation.
Discussion: Our findings lend support to the theory that multiple resources limit growth and physiology of populations rather than the traditional view of a single resource limiting performance. Therefore, the possibility that multiple resource limitations drive population differences should be considered when developing population-based guidelines for forest and tree species restoration.
Introduction
Plant species often exhibit significant variation in functional traits in populations along elevational gradients. This variance might increase further in response to greater environmental heterogeneity anticipated under future climatic conditions (Begon et al., 1996; Araújo and Rahbek, 2006; Bigelow and Canham, 2007). Changes in elevation are accompanied by substantial spatial and temporal variability in resource availability such as light (quality and quantity) and edaphic conditions (nutrient and water availability), which are mostly modulated by temperature (Battaglia et al., 2000). At lower elevations in some systems, plants can take advantage of high nitrogen and water resources (Raich and Schlesinger, 1992) but have to deal with increased competition for light. Conversely, at higher elevations where soil nutrients and moisture are often limited, light is readily available (Körner et al., 1989; Körner, 2012). Plants growing in each environment will require different adaptations and acclimation strategies to cope with the various stress conditions (Somero, 2010).
Species adaptations in response to local environments can create substantial phenotypic differentiation among populations (Ghalambor et al., 2007). Intraspecific phenotypic variation can reflect micro-geographic adaptation and divergent selection (Richardson et al., 2014). Phenotypic plasticity can change trait expression rapidly within generations and may differ drastically across populations in dissimilar resource environments (West-Eberhard, 1989). One such example can be found in populations established across gradients of water availability, where the selection may favor a phenotype that has enhanced drought tolerance in the driest sites (e.g., transpiration, growth, etc.; Crispo, 2008; Paudel et al., 2021). Recent studies in various systems have established the ecological implications of intraspecific phenotypic variation, like selecting populations for species restoration based on their response to resource limitation (Matesanz et al., 2020) and adaptability to future climates (Cocozza et al., 2016). The tendency and ability of individuals or populations to acclimate is dictated by their phenotypic plasticity and specific response to various resource limitations.
The adaptive phenotypes of populations of a species influence their response to resource limitations. Traditionally according to Liebig’s Law, plant performance was assumed to be limited by the single resource in the scarcest supply relative to demand; and this limitation was thought to largely determine plant responses in a specific environment. However, there is growing evidence suggesting that, most likely, more than one resource may act simultaneously and synergistically to impact plant growth (Gleeson and Tilman, 1992; Eskelinen and Harrison, 2015; Zandalinas and Mittler, 2022) indicating resource co-limitation (Zandalinas et al., 2021; Pascual et al., 2023). Plants undergo a series of structural, anatomical, and physiological adaptations to adjust for co-limiting resources (Holmgren, 2000; Quero et al., 2008), which may become increasingly important under future climatic conditions (Eskelinen and Harrison, 2015).
Site conditions for plant establishment and growth are often resource-limited by more than one factor and plants may perform poorly when additional stress is superimposed. Identifying populations within species that can better cope with co-limiting resource conditions is little studied and complex as it requires a documentation of the amount of phenotypic plasticity within and among populations (Ernesto and Ferendo, 2012). Investigations into resource co-limitation may reveal some of the mechanisms of how different populations within a species interact and adapt their phenotypes to changing environments (Craine and Dybzinski, 2013).
When exposed to resource limitation, populations adapted to resource-poor environments may exhibit more conservative phenotypic responses that further limit their growth, while the opposite response may occur in populations that are adapted to grow under sufficient resource conditions (Kobe, 1996; Fownes and Harrington, 2004). For example, in some species, high light conditions only produce smaller leaves to reduce transpiration rate in response to drought when N is not limiting (Hirose and Bazzaz, 1998), which might be the case in high elevation populations. In contrast, low light conditions in combination with sufficient N can also negatively impact a seedling’s ability to cope with drought as plants under these conditions increased leaf area under drought in some studies (Körner and Diemer, 1987; Harrison and LaForgia, 2019). The positive, interactive effect of sufficient light and N should intensify in any population, mainly when soil moisture is not limiting because these resources increase photosynthesis, which accelerates plant growth (Kubiske et al., 1996; Valladares and Pearcy, 2002). Additionally, because plant growth depends on carbon availability and the balance between photosynthesis and respiration, the amount of stored non-structural carbohydrates (NSCs) in plants is posited to be an important plant trait to quantify resistance and resilience during resource limitations (Myers and Kitajima, 2007; O’Brien et al., 2017), but is rarely tested within populations and may be an important life-history strategy.
Koa (Acacia koa A. Gray; Fabaceae) is a forest tree species endemic to the Hawaiian Islands and grows along a considerable elevational gradient ranging from 300 to 2,100 masl. In the past, koa forests covered significant portions of the islands, but deforestation for agricultural land and urbanization caused a severe decline in the koa forest area (Wilkinson and Elevitch, 2003). Koa restoration efforts have been challenged by disease, excess soil nitrogen and water, and low light (competition) on low elevation sites and by frost, low nutrient availability, and drought on higher elevation sites (Scowcroft et al., 2004; Pejchar et al., 2005; Scowcroft et al., 2010), particularly when located on the windward side of the mountainous Hawaii Island. With climate change, these challenges may be amplified with an anticipated increase in hotter and drier conditions (Giambelluca et al., 2008; Elison Timm, 2017). This emphasizes the importance of testing the role of intraspecific variation among koa populations and its role in the co-limitation of resources (Elevitch et al., 2006), which may ultimately aid in development of seed transfer guidelines for restoration (Rose et al., 2019b).
The overall goals of this study were to test the physiological, biochemical, and morphological responses of different populations of Acacia koa to co-limiting conditions of light, nitrogen, and soil moisture. The koa populations were collected along a wide elevational gradient, under the assumption that these populations have undergone genetic selection to the prevailing site conditions (Gugger et al., 2018). The specific objectives were: (i) to determine if there are elevational adaptations of functional traits among populations and (ii) to characterize whether these population-level adaptations result in distinct and advantageous response strategies when exposed to co-limiting resource conditions.
Materials and methods
Seed collection, germination, and seedling establishment
We collected three open-pollinated populations of koa from natural stands along an elevation gradient on the windward side of Hawaii Island in Hawaii, United States: AKO Mix (310 masl, 19°41′14”N, 155°8′7”W), BK-Saddle5 (1,250 masl, 19°42′3.39”N, 155°14′7.22”W), and PHH (2050 masl, 19°41′12”N, 155°27′56”W). The low elevation sourced AKO Mix (L), included 20 half-sib families and was collected in 2007 near Hilo, Hawaii. The mid (M) and high (H) elevation seed sources each included 24 half-sib families that were collected in 2007 at 1250 masl and 2050 masl, respectively, on windward Mauna Kea.
Regular cloud cover, precipitation patterns, the slope of the mountains, and sharp changes in temperature play an essential role in creating differences in light, nutrient holding capacity, and moisture status, particularly on the windward side of mountainous Hawaii Island. As a result, the annual average solar radiation is 130–150 Wm−2, 200–220 Wm−2, and 260–280 Wm−2, the average annual rainfall is 5,400–6,000 mm, 3,000–3,500 mm, and 2,000–2,500 mm, and the soil nutrient holding capacity is considered high, medium, and low for the L, M, and H sites, respectively (Giambelluca et al., 2013).1 Average air and soil temperatures generally decline with elevation, and winter frosts occur at the H sites (Rose et al., 2020).
Seeds were transported to the lab at the Department of Forestry and Natural Resources, Purdue University (West Lafayette, IN, United States). In summer 2018, seeds were scarified using a nail clipper by making a shallow cut at the edge of each seed (just deep enough to allow water to penetrate the seed coat) and soaked overnight in warm water before sowing the next day in single-cell trays for germination under mist in the lab at 25°C. Germinants were selected for uniformity (size and developmental stage) and transplanted into pots of 6.4 cm diameter and 25.4 cm depth (D40L/D40H; Stuewe & Sons TP818, Tangent, OR, United States) filled with growing medium consisting of coarse sphagnum peat moss (60–70%), bark, and perlite (BM7; Berger, Saint-Modeste, Quebec, Canada) in a greenhouse in the Horticulture and Landscape Architecture Plant Growth Facility at Purdue University.
For the first 2 weeks after germination, seedlings from each population were irrigated every 2–3 days to saturation, and every second watering was fertigated with a 50% dilution of Petunia Special with Black Iron (20-3-19 N-P-K including micronutrients; ICL Specialty Fertilizers, Dublin, OH). Fifteen days post-germination, seedlings were transplanted to bigger pots of 6.9 cm diameter and 35.6 cm length (60 L/60H; Stuewe & Sons TP818, Tangent, OR, United States) and grown for another 2 weeks to allow seedlings to recover from potential transplant stress. During this time the watering and fertilization regimes were continued as described above. Following the transplant recovery period when at least 50% of the seedlings were > 10 ± 3.5 cm tall, seedlings were randomly assigned to different light, nitrogen (N; in the form of ammonia), and moisture treatment combinations.
Treatments and experimental design
A split-plot design was used where a light treatment was applied at the whole-plot level with two levels of light (LIGHT and SHADE; see below), while the koa populations (three populations), nitrogen (N+ and N−), and soil moisture treatments (WET and DRY) were applied randomly at the sub-plot level. To account for potential spatial differences in greenhouse conditions, two adjacent benches were set up with the above design, each with three replicate seedlings for each treatment combination. In a preliminary analysis of the response variables no significant bench effects or interactions with the treatments were found, therefore we removed this factor from further analyses and used the six seedlings as independent replicates with a total of 144 seedlings. Treatment conditions were maintained over a period of 3 months with air temperatures at ~26 ̊C/22 ̊C (day/night).
The high light treatment (LIGHT) provided ambient light conditions and a R:FR of 1.48, while the low light treatment (SHADE) provided about 23.5% of ambient light and a R:FR of 0.68. The SHADE treatment was achieved by using a neutral density filter (25% of FL; Model 210 0.6 ND; LEE Filters, Andover, Hampshire, United Kingdom). Based on outside weather conditions, a supplemental light source was used whenever needed to maintain photosynthetically active radiation (PAR) above 500 μmol m−2 s−1 using sodium vapor lamps for a period of 13.5 h. Over the experimental period, photosynthetically active radiation (PAR) in the two light levels differed significantly from one another (p < 0.05, Supplementary Figure S1A), with the PAR in the SHADE ranging between 20 and 55% of ambient conditions.
For the nitrogen treatment, half the seedlings were watered with a solution of 150 ± 10 mg/L in the N+ treatment level while seedlings in the N− treatment were watered with only 50 ± 7 mg/L. The type and concentration of nitrogen in the solution were based on optimum N concentration for Acacia koa seedlings in nursery settings (Dumroese et al., 2011). The nitrogen treatment was applied biweekly in the first month of the experiment, and after that, it was applied at every second irrigation event. In DRY treatments, the concentration of N was increased so that nitrogen was equal per volume of applied water. Additional nitrogen was applied to all seedlings prior to the experiment since the growing substrate alone did not provide enough nutrients for establishment. Nitrogen (N+) addition significantly increased N concentration by 67% in the irrigation water of the N+ treatments (Supplementary Figure S1B). Although koa is leguminous, we noticed only two or three cases of nodule development in our seedlings in this study.
Substrate water content
Substrate wetness was determined using a 3-Way Soil Meter that measures soil wetness conditions from dry to moist to wet on a scale of 0 to 10 (GroundWorx, United States). Measurements were taken in pots every 2 weeks. Wet and dry treatments were based on a wetness measurement of 8 and 4, respectively. Irrigation was adjusted twice based on the size of the plants using the weighting method (initial and mid-period). Our overall goal of the water treatment was to apply irrigation to maintain relative differences between the two treatments. Although we aimed to maintain the above levels, there were some differences in substrate wetness in different light treatments. For example, low light reduces evapotranspiration under drought conditions, as should be the case under field conditions. Thus, substrate wetness varied with light treatments (Supplementary Figure S1C).
Gas exchange and light response curves
Koa exhibits heteroblasty in which leaves transition from bipinnately compound, horizontally oriented true leaves to vertically oriented phyllodes. In our study, we measured only true leaves as phyllodes did not emerge until the end of our experiment. Leaf CO2 and H2O exchange measurements were conducted on leaflets of young fully expanded true leaves (4th leaf from apical meristem) in five seedlings in each treatment combination under light-saturation using an infrared gas analyzer (Li-COR 6400XT, Lincoln, NE, United States) equipped with a standard broad-leaf cuvette (6 cm2). Because the leaflets did not fully cover the 6 cm2 LI-6400XT leaf chamber, leaf areas needed to be adjusted for the photosynthetic measurements. Leaflet size was quantified from a photograph taken of the leaf in the chamber using ImageJ (National Institutes of Health, Bethesda, Maryland) using methods of Thyroff et al. (2019).
Cuvette conditions were a leaf temperature of 25°C, 50% relative humidity, PPFD at 1200 μmol m−2 s−1, with 10% blue light (using LED light source), a constant airflow of 400 mmol air s−1, and 400 μmolCO2 mol−1. Photosynthetic parameter measurements including maximum photosynthetic rate (Pmax), stomatal conductance (gmax) and transpiration rate (Emax) were performed twice during the experimental period at end of the second and third months between 10:00 and 14:00 h across all the treatments.
In addition to spot gas-exchange measurements, photosynthesis/photosynthetic photon flux density (Pn/PPFD) response curves were developed using the same cuvette setting. Light response curves in each treatment were measured after 60 days into the treatments on four seedlings each. Light intensities were applied in a decreasing order starting at 1600, 1200, 900, 600, 400, 200, 50, and 0 μmol m−2 s−1 for the full light exposed treatments and in increasing order for the shade seedlings as suggested in Dang (2013). During 0 μmol m−2 s−1 measurements, we covered the cuvette and seedling with a black cloth, while the other parts of the seedling were in their respective light treatments (Dang, 2013). Light response curves were formed by plotting net photosynthesis assimilation (Pn, μmol CO2 m−2 s−1) against PPFD and fitted to non-rectangular hyperbola (Thornley, 2002). Dark respiration rate (Rd) was based on light response curves. Water use efficiency (WUEi) was calculated as the ratio of Pmax/gmax, and leaf-level carbon use efficiency (CUEl) was calculated as the ratio of [1 − (Rd/Pmax)/(1 + Rd/Pmax)] (Limousin et al., 2015).
Leaf water potential
At the same time as the photosynthesis measurements, leaf water potential (LWP) was measured on a leaflet of each of five seedlings using a Scholander-type pressure chamber (PMS Instrument Company, Albany, OR, United States) and was collected from the same leaf that had been used for gas exchange. After determining LWP, the leaflet was used for measuring leaf nitrogen concentration.
Nitrogen and non-structural carbohydrate analyses
The area of leaves sampled for gas exchange and LWP was measured as described above and dried at 65°C for at least 48 h and weighed to calculate the leaf mass per unit area (LMA) or specific leaf area. After this, leaves were ground to analyze for total nitrogen content using a LECO CNS-2000 Analyzer (LECO Corporation, St. Joseph, MI, United States). Nitrogen concentrations (Nl) was calculated for each leaf by multiplying the total N content with leaflet biomass (g g−1). Photosynthetic nitrogen-use efficiency (PNUEl) was calculated as the Pn:Nl ratio.
To compare stress-tolerance mechanisms among the populations, in response to the treatments, the concentration of soluble sugars (glucose, fructose, and sucrose combined) and starch was quantified in the stems of the koa seedlings at the end of the experiment. Immediately after sampling, all samples were subject to heat shock on-site using a microwave temperature 150°C for 30 s. In the laboratory, samples were dried at 60°C until a constant weight was achieved in a drying oven. Next, the tissues were milled into a fine powder using a ball mill (Retsch, Hann, Germany) at a frequency of 25 tilts s−1 (∼5 min). NSC analyses followed the methods of Wong (1990), modified as described in Hoch et al. (2002). Dried wood powder (12–18 mg) was extracted with 2 mL deionized water at 90°C for 10 min. An aliquot of each sample extract was taken to determine the low molecular weight carbohydrates using invertase (from baker’s yeast; Sigma-Aldrich, Buchs, Switzerland) to break the sucrose into glucose and fructose. Glucose and fructose were converted into gluconate-6-phosphate using glucose hexokinase (Sigma Diagnostics, St. Louis, MO, United States) and phosphogluconate isomerase (from baker’s yeast; Sigma-Aldrich). The total amount of gluconate-6-phosphate was determined as the increase in NADH+ H+ using a photometer (HR 700; Hamilton, Reno, NE, United States). To determine the starch content, the remaining extract was incubated at 40°C for 15 h with amyloglucosidase (from Aspergillus niger; Sigma-Aldrich) to break starch into glucose.
Non-structural carbohydrate (NSC) concentration was calculated as the total amount of glucose per sample dry mass as described above. The starch concentrations were calculated as the total NSC concentration minus the soluble sugar concentration.
Growth and biomass measurements
Height and root-collar diameter were measured on all seedlings after transplanting (initial), once a month during the experimental period, and at the end of the experiment (final). After transplanting, the seedling root collar was marked so that the diameter was measured at the same location each time. The root-collar diameter was determined by calculating the average of two digital caliper measurements perpendicular to each other. The shoot height was measured from a set point 5 mm above the cotyledon to the tip of the shoot. Height and root collar diameter growth over the experimental period were calculated as the difference between final and initial measurements for each seedling. After leaf removal, each seedling was separated into stems and roots. Root systems were carefully washed and samples were dried at 60°C until a constant mass was achieved. The total biomass (TB) was determined by summing the leaf, stem, and root mass. Leaf mass ratios (LMR), stem mass ratios (SMR), and root mass ratios (RMR) were calculated by dividing the TB. Root-to-shoot ratio (R:S) was calculated by dividing the root mass by the shoot mass (combined stem and leaf mass).
Statistical analysis
Prior to analysis, all data were checked for normality and homoscedasticity, and as a result, height growth data were transformed to satisfy the model assumptions. Data were analyzed using analysis of variance (ANOVA) with linear mixed models (lmer) in the ‘lme4’ package (Bates et al., 2015) for R (RStudio Team, Boston, MA, United States). Fixed effects were populations, light, nitrogen, and water. When significant treatment or interaction effects were detected, the ‘emmeans’ package in R (Lenth and Lenth, 2018) was used to perform post-hoc pairwise comparison of ‘estimated marginal means’. Tukey’s HSD tests were used for post-hoc comparisons within significant fixed-effect factors and interactions (α = 0.05).
Results
Growth and morphology
Under conditions where light and water were not limiting, height growth was greatest in the L population, followed by the M and then the H population (L > M > H). When either only light or water was limiting, height growth was similar among the three populations; however, when both light and water were co-limiting, height growth was greatest in the M and L populations followed by the H population (M ≥ L > H; P × L × W, p < 0.001, Table 1).
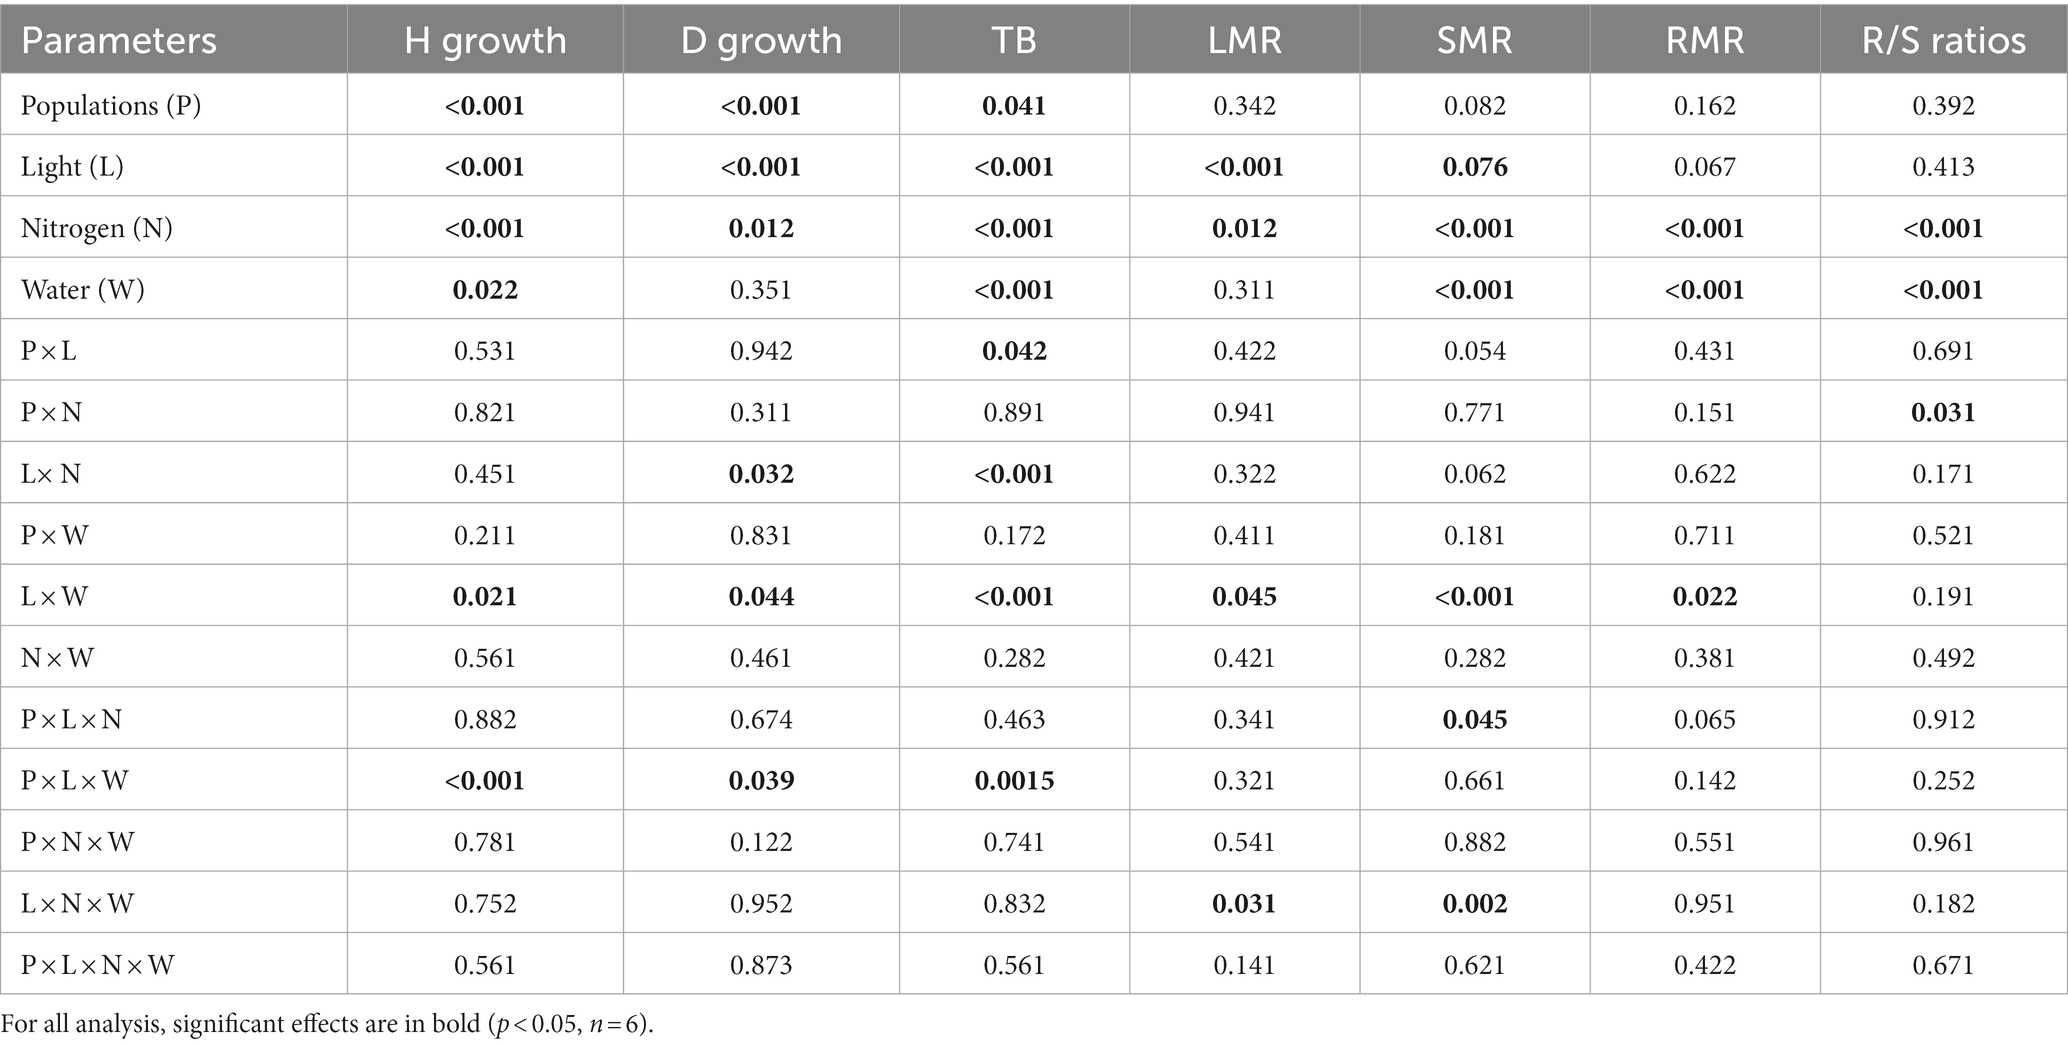
Table 1. P-values for the analysis of variance (ANOVA) results testing the effects of population (df = 2), light (df = 1), nitrogen (df = 1), and water (df = 1) availability and their interactions on stem diameter growth (D growth), height growth (H growth), leaf mass ratio (LMR), shoot mass ratio (SMR), and root mass ratio (RMR), total biomass (TB), and root to shoot ratio (R/S ratio) in Acacia koa seedlings.
Root collar diameter growth was greatest in the mid-elevation (M) population followed by the L and then the H population (M > L > H) when no resources were limiting. When only light was limiting, the order among populations in root collar diameter growth was similar in H and M and lowest in L, while when water was limiting root collar diameter growth was greatest in the H and M populations and lowest in the L population (H ≥ M > L). When both water and light were co-limiting, root diameter growth was lower among all populations, but populations retained the same order as under non-limiting conditions (M = L > H; P × L × W, p = 0.039, Table 1).
Under non-limiting conditions of light and water, total biomass was similar between M and L and lowest in the H population (M = L > H). When only light and only moisture were limiting total biomass was similar in H and M while lower in the L population (H = M > L). But, when both light and water were co-limiting, total biomass did not differ among populations, but total biomass improved by 15% in the L population (Figure 1; Table 1, P × L × W, p < 0.001).
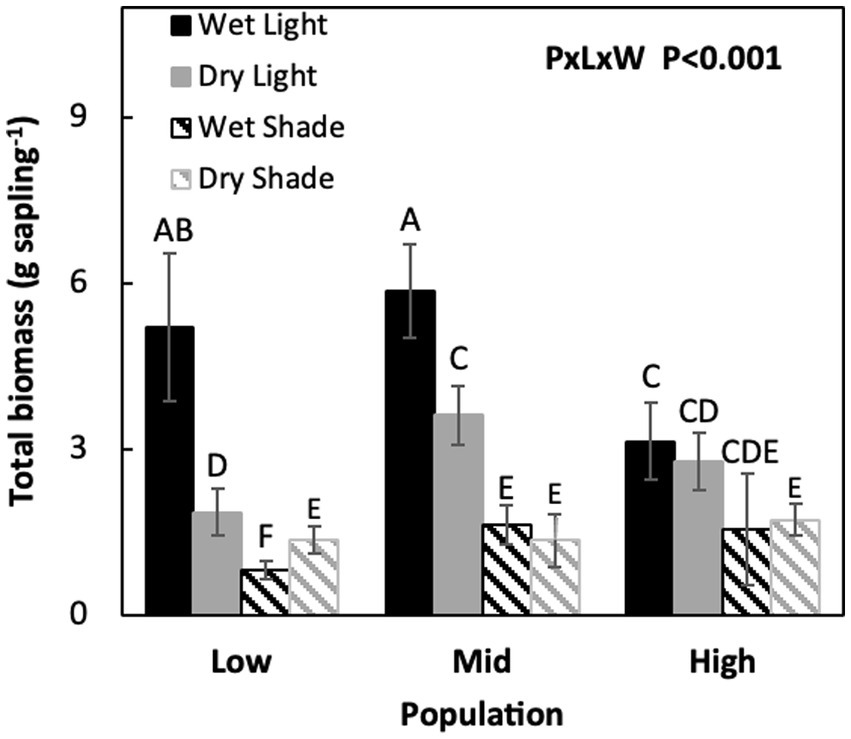
Figure 1. Mean (±SE) values for Acacia koa seedling total plant biomass for two light and water treatments of three seed sources. Different letters indicate significant differences between treatments (α = 0.05, n = 12).
Across all three populations, shoot mass ratio (SMR) was highest in M and lowest in the L population under non-limiting condition (M > H > L). When only nitrogen or light was limiting, the response patterns were similar among the populations; however, when light and nitrogen were co-limiting the H population had the lowest SMR (M > L > H) among the populations (Table 1; P × L × N, p = 0.05).
Photosynthesis and water relations
Depending on light and nitrogen availability, Pmax varied among the three populations (P × L × N, p = 0.047, Table 2). When both were not limiting, Pmax was higher in the high-elevation population than the low-elevation population (Figure 2, i.e., ranking H > M > L). Under light limitation, the H population experienced a much greater Pmax reduction (>50%) in response to shade than the other populations. However, under conditions where only nitrogen was limiting, or when both light and nitrogen were co-limiting, there were no differences among populations in Pmax compared to non-limiting conditions.
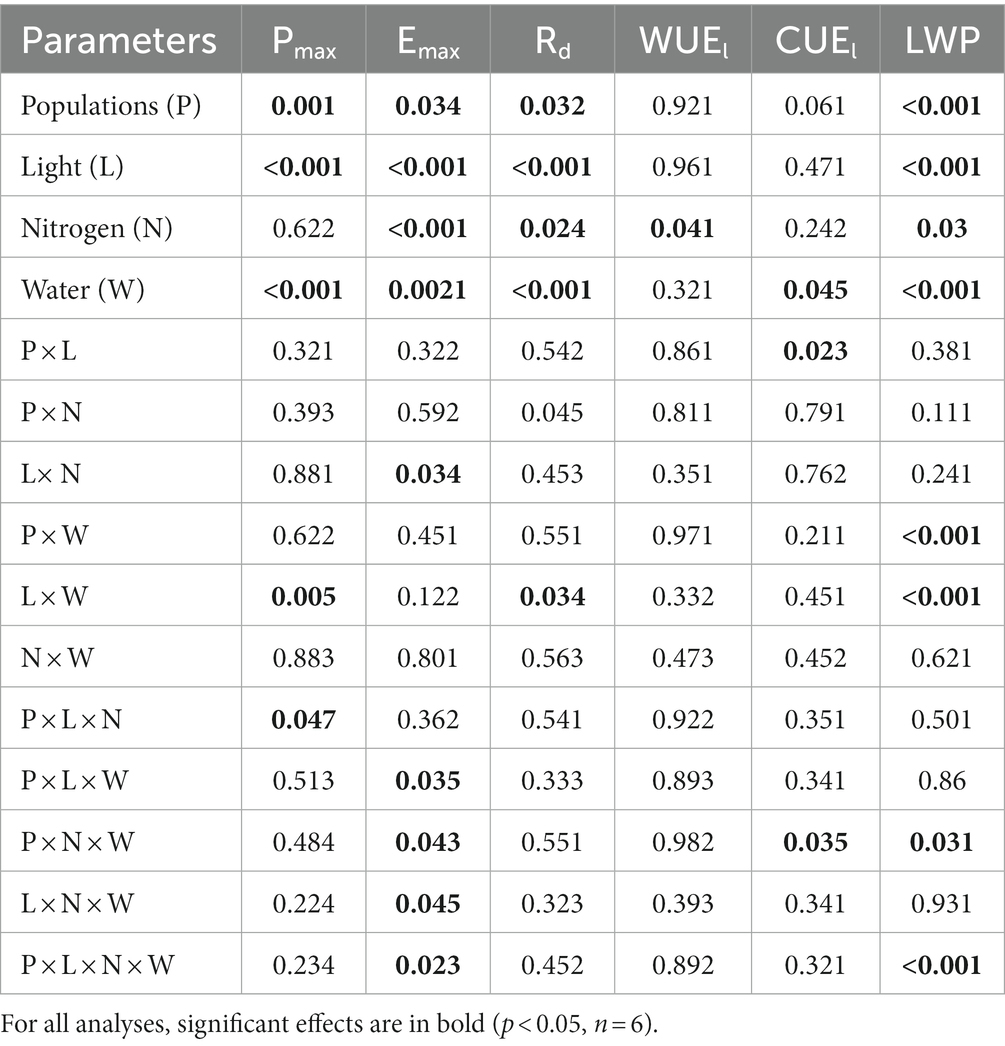
Table 2. P-values for the analysis of variance testing (ANOVA) effects of populations (df = 2), light (df = 1), nitrogen (df = 1), and water (df = 1) and their interactions on Acacia koa seedling photosynthesis (Pmax), transpiration rate (Ermax), dark respiration rates (Rd), total leaf nitrogen (TN), photosynthetic water use efficiency (WUEi), photosynthetic carbon use efficiency (CUEl), and leaf water potentials (LWP) at the end of the experiment.
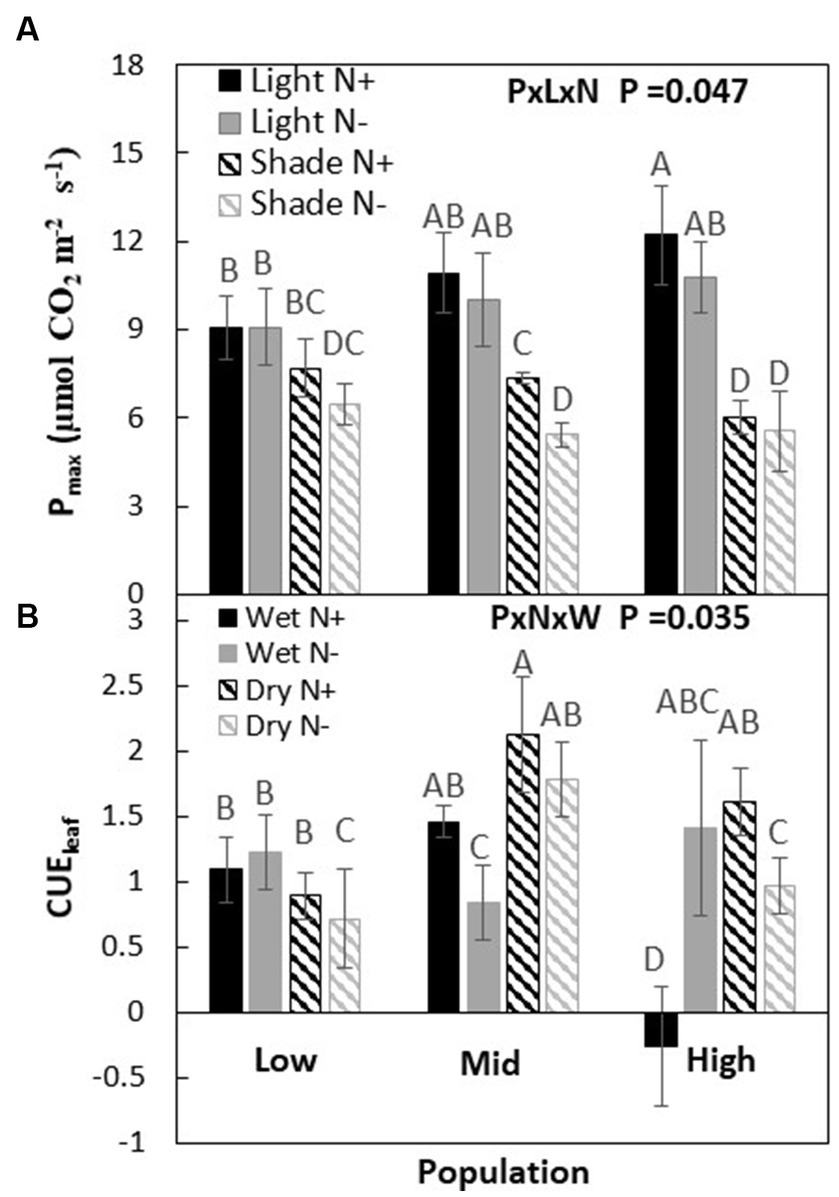
Figure 2. Maximum photosynthesis (Pmax) at saturated light at two light and nitrogen (A) and leaf-level carbon use efficiency (CUEl) at water and nitrogen (B) treatments of Acacia koa seedlings from the low, mid, and high elevations populations. Each data point represents the mean ± SE at α = 0.05, n = 12.
When no resources were limiting, the transpiration rate (Emax) among populations was highest in the H population while no difference was found between M and L (H > M = L). When only water or all three resources were limiting, there were no differences in Emax among the three populations; similarly, there were no differences among populations when only nitrogen was limiting or when light and water were co-limiting. However, when light and nitrogen were co-limiting, Emax was highest in the L and lowest in the M population (L > H > M; P × L × N × W, p = 0.023, Table 2).
When nitrogen and water were not limiting the carbon use efficiency (CUEl) was greatest in the M population and lowest in the H population (M > L > H). When only nitrogen was limited, the order changed to H > L > M, while when only light was limiting the order among populations changed to M > H > L. But, when light and nitrogen were co-limiting, population responses in CUEl remained the same as under non-limiting conditions (P × N × W; p = 0.035, Figure 2; Table 2).
Leaf water potential (LWP) was the highest (less negative) in the low elevation population and more negative in the M and H populations (L > M = H) when resources were not limiting. Under drought, the H population had a higher LWP compared to the H and L population (H > M = L). When only nitrogen was limited, populations ranked as L = M > H. On the other hand, under light only or light and water co-limitation, the H population had a higher LWP compared to the M and L populations (H > M = L). But, when light and water or all three resources were co-limited, the order of populations was like that found under conditions where no resources were limiting (P × L × N × W, p < 0.001, Figure 3; Table 2).
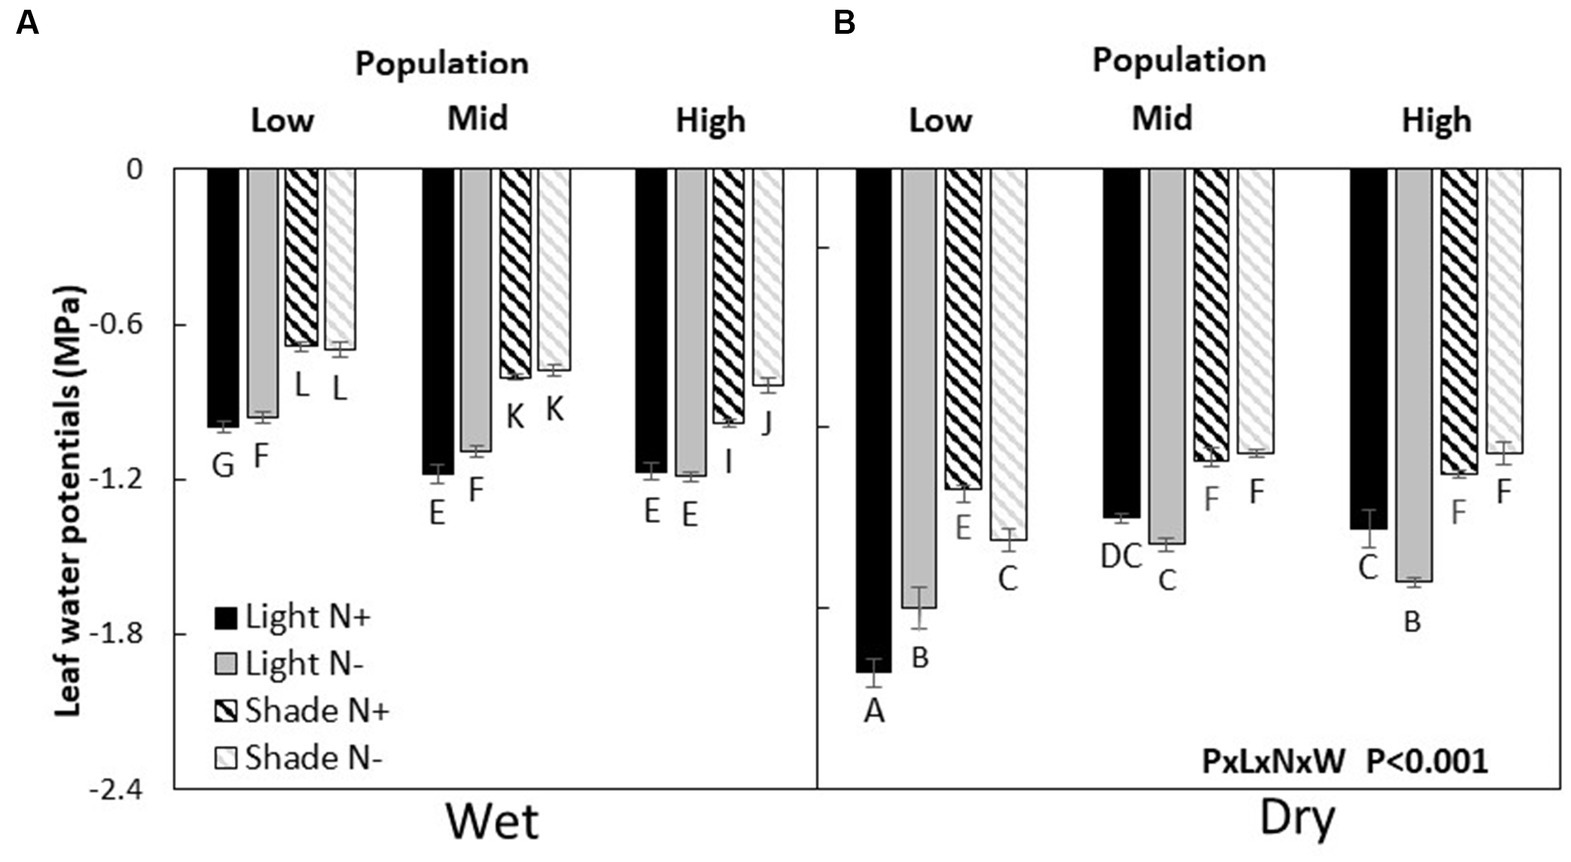
Figure 3. Leaf water potentials (mean ± SE) of wet (A) and dry (B) Acacia koa seedlings from the low, mid, and high elevations populations at two light and nitrogen treatments. Different letters indicate significant differences between treatments (α = 0.05, n = 6).
Nitrogen and NSC Reserves
Although main effects were significant, we did not observe a strong interaction effect between populations and co-limiting resources on Nl (P × L × W, p = 0.111, Figures 4A,B; Table 3). Photosynthetic NUE (PNUEl) was lowest in M and similar in H and L when resources were non-limiting. When only nitrogen was limiting, the M population had the highest PNUEl and the L population the lowest (M > H > L), with a 20, 60, and 35% increase over plants grown in non-limiting condition in M, H, and L populations, respectively. When only light was limiting or when both light and nitrogen were co-limiting, PNUEl was highest in the H population and lowest in the L population (H > M > L), which was similar to the order found under non-limiting conditions.
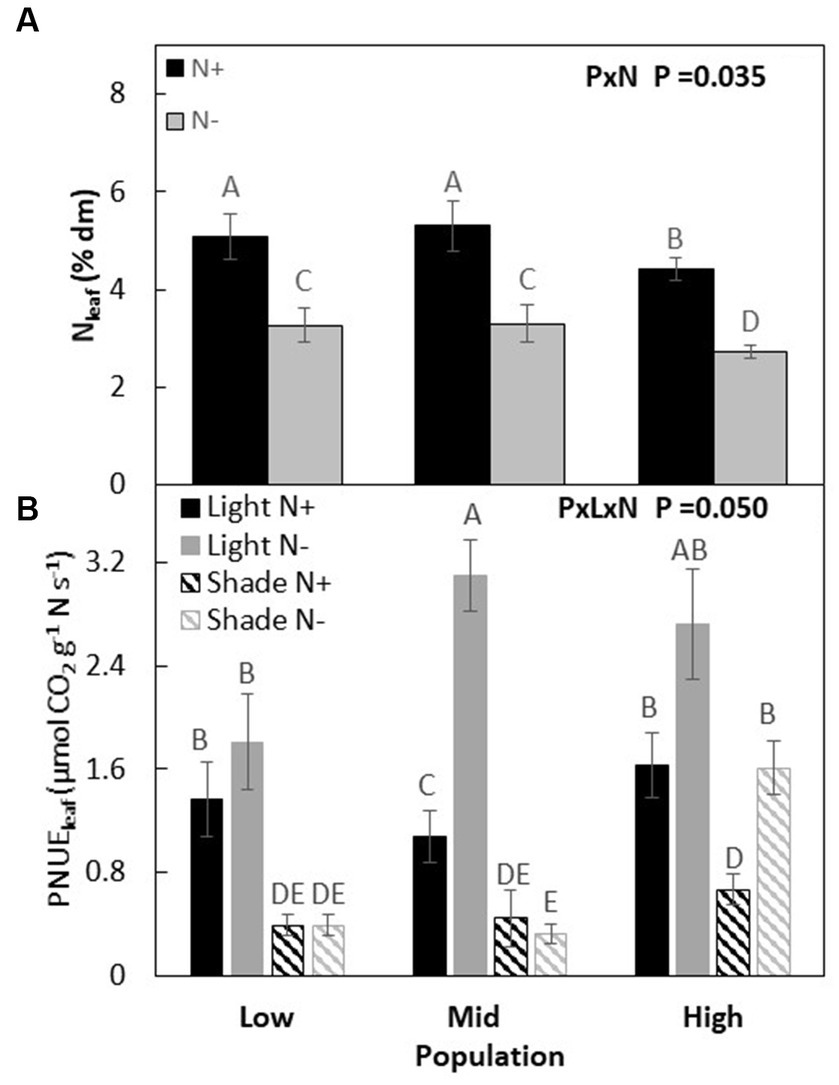
Figure 4. Leaf nitrogen % of dry matter of Acacia koa seedlings from the low, mid, and high elevations populations at two nitrogen treatments (A) and leaf photosynthetic nitrogen use efficiency (PNUEl) at light and nitrogen treatments (B) (mean ± SE) at the end of the experiment. Different letters indicate significant differences between treatments [α = 0.05, n = 24 for (A) and n = 12 for (B)].
When light and water were not limiting, sugar concentrations were highest in the H population and lowest in the L population (H > M > L), but when only light was limiting sugar concentrations were highest in the M population and lowest in the H population (M > L > H). Under drought, L and M populations had similar sugar concentrations while the H population had the lowest concentration among the populations. Differences were observed between populations when both water and light were co-limiting (P × L × W, p < 0.001, Figure 5A; Table 3). When water was not limiting, starch concentrations were similar for all three populations, while under drought M had the highest starch concentrations and the L population the lowest (M > H > L), increasing by 19% in M and decreasing by 25% in the L population compared to the non-limiting conditions (P × W, p = 0.035, Figure 5D; Table 3).
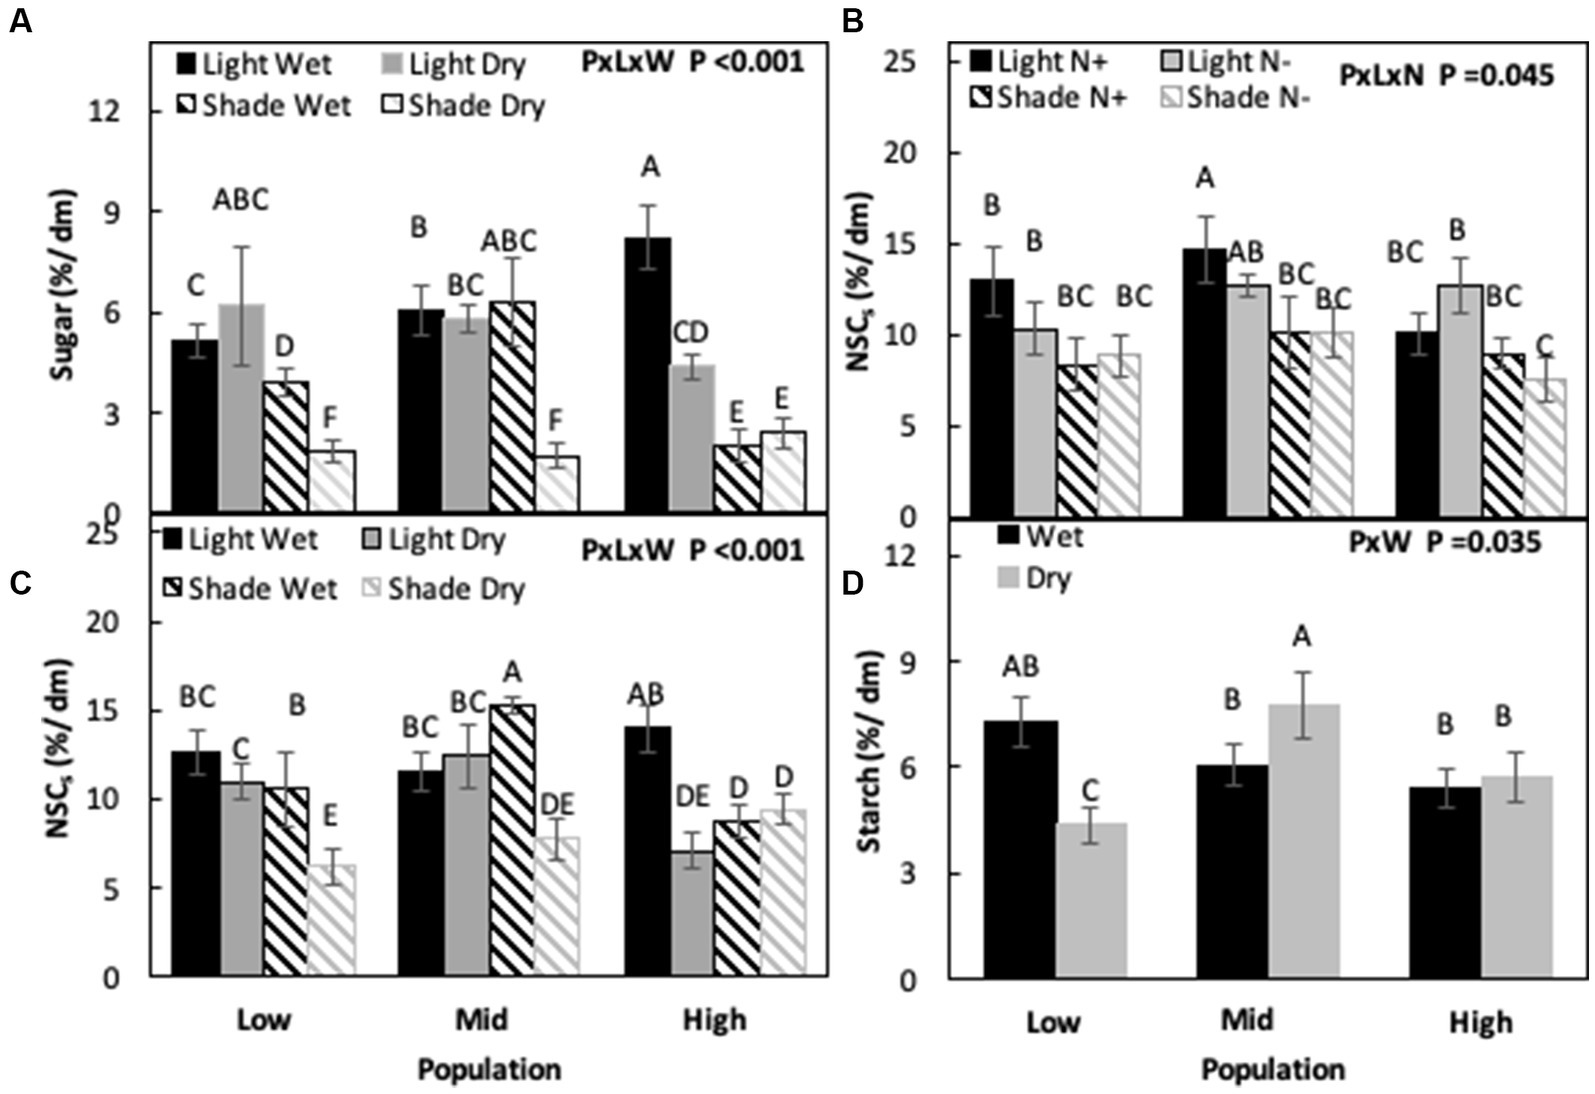
Figure 5. Sugar (A), total non-structural carbohydrates (NSCs) concentration (B,C), and starch (D) in Acacia koa stems at the end of the experiment across various combination of treatments. Different letters indicate significant differences between treatments [α = 0.05, n = 12 for (A–C) and n = 24 for (D)].
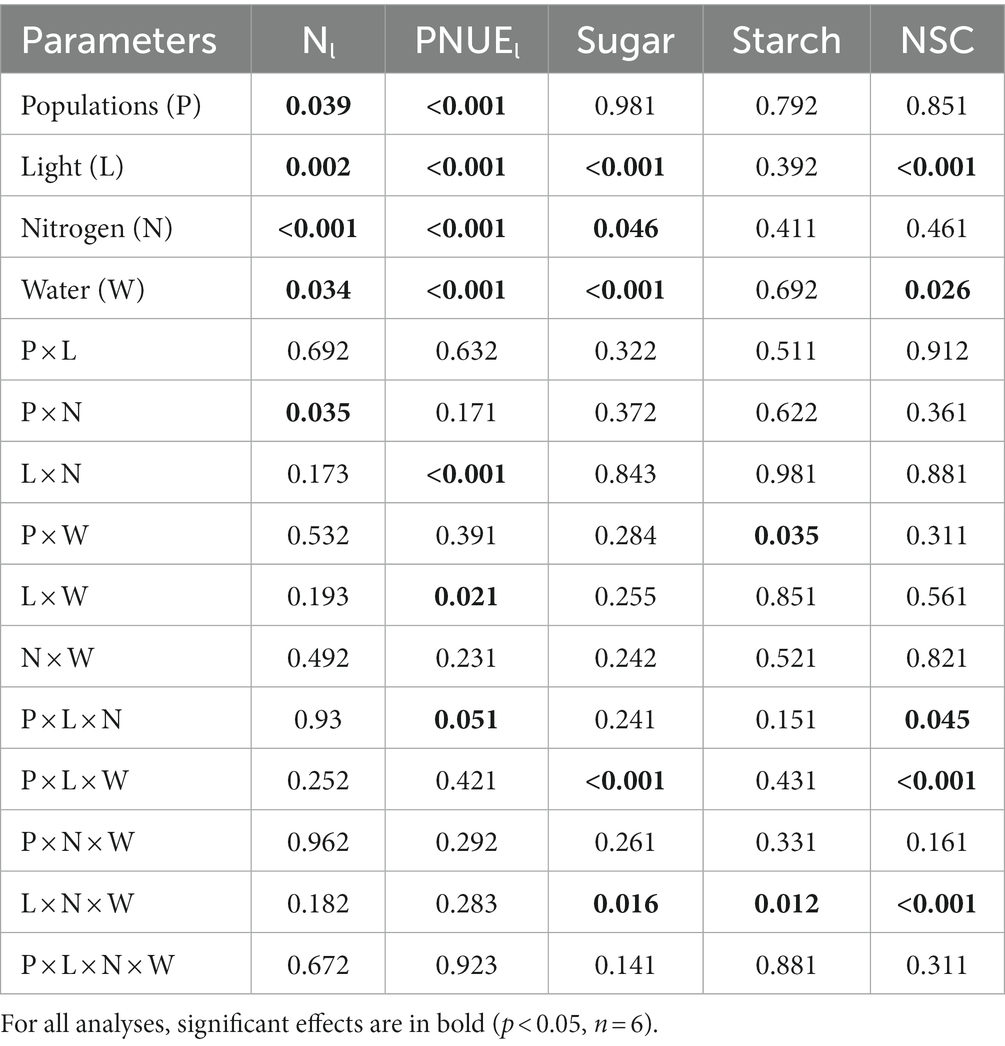
Table 3. P-values for the analysis of variance testing (ANOVA) effects of populations (df = 2), light (df = 1), nitrogen (df = 1), and water (df = 1) and their interactions on Acacia koa leaf nitrogen %, photosynthetic nitrogen use efficiency (PNUEl), stem sugar, stem starch, and total non-structural carbohydrate concentrations (NSC) at the end of the experiment.
Under non-limiting conditions of light and nitrogen, NSC concentrations were similar for M and L population but low for the H population (M = L < H). When only nitrogen was limiting or when only light was limiting, there were no differences between the populations. When both light and nitrogen were co-limiting, the H population had the lowest NSC concentrations (P × L × N, p = 0.045, Figure 5B; Table 3). Similarly, no differences between populations were found under non-limiting conditions of light and water, but when only light was limiting NSC was similar in M and L populations and lowest in the H population. Under drought, NSC concentrations were highest in mid and lowest in the high elevation population (M > L > H), but when both light and water were co-limiting, NSC were highest in the L population and lowest in the M and H populations (L > M = H; P × L × W, p < 0.001, Figure 5C; Table 3).
Discussion
This study provides some of the first evidence that populations of koa distributed along a steep elevational cline can differ in their physiological responses to co-limitation of two or more resources. This suggests that adaptation rather than acclimatization (Skelton et al., 2021) has occurred over relatively small spatial and temporal scales. In general, the koa population from low elevation (L) was more sensitive to conditions where both moisture and nutrients were limiting, while the koa population from high elevation (H) was more sensitive to conditions where either light and moisture or light and nitrogen were co-limiting. In contrast, the mid-elevation population (M) was less responsive to either set of co-limiting conditions. While gradients of resources have been tied to the response and physiological capacity of species and communities (Clark et al., 1992; Poorter and Bongers, 2006; Wright and Sutton-Grier, 2012), our findings indicate that the responses to complex interactions among resources can also apply at the population level, thereby providing support to the notion that limitation of multiple resources (Gleeson and Tilman, 1992; Eskelinen and Harrison, 2015) can separate populations, rather than limitation by single resources.
Population differences in response to single resources limitation have been shown for physiological responses for a range of species (Körner and Diemer, 1987; Abrams, 1990; Paudel et al., 2021; Skelton et al., 2021), but their effects when two or more resources are co-limiting have not been explored in detail. Some of the physiological variables in our study provide further support that response to colimitation of resources may vary at the population level. For instance, while the high elevation population showed a much greater reduction for Pmax (>50%) in response to shade than the other populations, Pmax of the low and mid populations was more sensitive to co-limitation of light and nitrogen (Figure 3; Table 2). Similarly, leaf carbon and nitrogen use efficiency (CUEl and PNUEl) responses to co-limitation of nitrogen and water varied between the populations (Figures 2, 4; Table 2). The contrast in the response of gas exchange to drought and shade may have occurred because the interaction between light and drought on leaves differed depending on whether plants were adapted to high-light or low-light environments (Niinemets et al., 2004).
Leaf water potential (LWP) showed similar population-level interactions in response to co-occurring resource limitations. Under wet conditions, the L population maintained the highest LWPs, even when N was co-limiting. Under drought, however, the L population had the lowest resistance to drought when light was co-limiting. This response might reflect koa’s adaptation for gap regeneration in the denser forest canopies found at low elevations (Engelbrecht et al., 2007; Rose et al., 2019a). The low elevation population occurs naturally under conditions of high water and nutrient resource availability, and plants growing under such conditions tend to have large leaf area (Markesteijn and Poorter, 2009), which is accompanied by the increases in vulnerability to water deficit under high light. At the species level, the colimitation of light and moisture has been shown to directly reduce photosynthesis and transpiration rates, reducing potential carbon gain, and negatively affecting osmotic regulation and water use efficiency (WUEl; Aranda et al., 2007).
Although not as noticeable as the physiological variables, the colimitation of resources had differing effects on the allocation of carbon to growth and reserves among the koa populations. When light and water were colimiting, it appears that the H population allocated more to growth and reserves than the L and M populations, while these differences in reserve allocation among populations were not noticeable when only water or light was limiting. When light and moisture were co-limiting, NSC concentrations were higher in the stems of the H population (by 25%) compared to the L and M populations (Figure 5). This might relate to the need for the high elevation population to adapt to environmental conditions in a colder climate including tolerance to frost, which requires specific responses such as osmotic adjustments and cavitation repair (Plavcová and Jansen, 2015; Hartmann and Trumbore, 2016), while lower elevation populations may lack potential plasticity in this response. Although this could be the driver for the response, differences in stem NSCs concentration could also be a result of source vs. sink limitation. The L population had low photosynthetic rates in combination with a relatively high allocation to growth (source limitation) when under water and light stress (Figure 5D), while the H population had relatively high photosynthesis combined with reduced growth under the same conditions (sink limitation).
Separating sink and source limitation has been a longstanding focus for the investigation of NSC dynamics in plants in response to stress, exploring whether the environmental stress conditions constrain growth directly (sink limitation) or indirectly by restricting photosynthesis, subsequently limiting growth (source limitation; Körner, 2003, Muller et al., 2011). This has led to a continuing debate on whether stresses cause either a carbon (C) surplus indirectly since growth is more sensitive to a stress than photosynthesis (Boyer, 1970; Muller et al., 2011; Woodruff and Meinzer, 2011; Hoch, 2015) or whether the allocation to reserves may be a direct adaptation to tolerating stresses (Sala et al., 2012; Wiley and Helliker, 2012; Dietze et al., 2014). While stress-induced increases of NSC have been observed across tree species and biomes (Galvez et al., 2011; Fajardo and Piper, 2021; Signori-Müller et al., 2021), we did not observe increases in NSC concentration in this study. This was possibly because of the indeterminate growth strategies of this tropical species combined with the fact that the applied stress treatments were not intended to be severe, allowing seedlings to continue to grow in all treatments, therefore reducing the potential impact of sink limitations. Interestingly, the reduction in growth allocation in the H population was less relative to the change observed in the L and M populations, which, when combined with a smaller decrease in reserves, might indicate that the H population preferentially allocated more C to reserve storage compared to the other two populations. Investigating the differences in NSC dynamics among the koa populations was not a major aim of this study; however, studies exploring NSC responses to stress within different populations of a single species are rare (Blumstein et al., 2020, 2022). Although our data are too limited to explore these dynamics in detail, the observed responses appear to support an allocation dynamic based on sink limitations when seedlings and populations were exposed to a single stressor that mainly affected growth allocation among populations. On the other hand, when exposed to two or more colimiting stressors, differences between the koa populations in growth and reserve allocation patterns were revealed. Observations such as these should provide interesting and novel insights into this debate and may create a new avenue to explore the relationships between growth and reserve allocation using different populations within a species when exposed to stressors.
Overall, growth and biomass allocation patterns were much less sensitive to stress than the physiological responses, most likely a response to the limited severity of our experimental conditions. However, the lower responsiveness of growth and biomass traits to colimiting resources could also have been the result of a relatively short experimental period, indicating that more time may be needed for such morphological responses to become expressed compared to physiological responses that can adjust much more rapidly (Craine and Dybzinski, 2013). Thus, we suggest that future studies evaluate responses over a longer-time frame, as well as conduct experiments in the field within the natural range of koa. Field studies would allow for investigation of other important aspects of koa ecology, such as the potential effects of N fixing rhizobium, differences in air and soil temperatures among elevation gradients and associated interactions with native soils, as well as koa performance beyond the juvenile stage.
Conclusion
For successful establishment in marginal and heterogenous environments, plants must often overcome multiple limitations of resources. Our findings with koa, a tropical species that occurs across wide elevation gradients in highly heterogeneous environments, have provided new insight toward understanding the complex, interacting effects of co-limiting resources at the population level. Overall, the mid-elevation population showed the greatest plasticity of growth and physiology in the face of multiple limiting resources. This evidence suggests that while populations can adapt to resource colimitation by increasing resource use efficiency to maintain plant growth, there are also differences between populations that point to specific adaptations of populations to the growing conditions. This finding is especially interesting given that koa colonized and evolved relatively recently on Hawaii Island compared to the long-term evolution of many other forest tree species (Gugger et al., 2018). Our results also lend support to population-based management strategies (e.g., climate change adaptability, seed transfer for reforestation). Finally, our findings provide important insights that can be used to help guide future opportunities for testing co-limitation of resources across a wide range of populations. The responses we found were mainly physiological in nature, likely due to the short-term nature of the study, suggesting that future research should verify that such responses can lead to corresponding effects on growth over longer time frames.
Data availability statement
The raw data supporting the conclusions of this article will be made available by the authors, without undue reservation.
Author contributions
IP developed the original ideas, implemented the study, conducted data analysis, interpreted and visualized the results, and wrote the manuscript. KR contributed to the methods, interpretation of the results, and edited and revised the manuscript. SL interpreted and visualized the results and edited and revised the manuscript. DJ supervised the study and edited and revised the manuscript. All authors contributed to the article and approved the submitted version.
Funding
This work was supported by the Hardwood Tree Improvement and Regeneration Center, the Department of Forestry and Natural Resources at Purdue University, and USDA National Institute of Food and Agriculture McIntire-Stennis Cooperative Forestry Program (IND011535).
Acknowledgments
Thank you to Caleb Redick, Lillian Jacobo, and Nathanial Hilliard for valuable assistance with this project. Two reviewers and the Associate Editor provided helpful comments that improved the manuscript.
Conflict of interest
The authors declare that the research was conducted in the absence of any commercial or financial relationships that could be construed as a potential conflict of interest.
Publisher’s note
All claims expressed in this article are solely those of the authors and do not necessarily represent those of their affiliated organizations, or those of the publisher, the editors and the reviewers. Any product that may be evaluated in this article, or claim that may be made by its manufacturer, is not guaranteed or endorsed by the publisher.
Supplementary material
The Supplementary material for this article can be found online at: https://www.frontiersin.org/articles/10.3389/ffgc.2023.1225778/full#supplementary-material
Footnotes
References
Abrams, M. D. (1990). Adaptations and responses to drought in Quercus species of North America. Tree Physiol. 7, 227–238. doi: 10.1093/treephys/7.1-2-3-4.227
Aranda, I., Pardos, M., Puértolas, J., Jiménez, M. D., and Pardos, J. A. (2007). Water-use efficiency in cork oak (Quercus suber) is modified by the interaction of water and light availabilities. Tree Physiol. 27, 671–677. doi: 10.1093/treephys/27.5.671
Araújo, M. B., and Rahbek, C. (2006). How does climate change affect biodiversity? Science 313, 1396–1397. doi: 10.1126/science.1131758
Bates, D., Mächler, M., Bolker, B., and Walker, S. (2015). Fitting linear mixed-effects models using lme4. J. Stat. Softw. 67, 1–48. doi: 10.18637/jss.v067.i01
Battaglia, L., Fore, S., and Sharitz, R. (2000). Seedling emergence, survival and size in relation to light and water availability in two bottomland hardwood species. J. Ecol. 88, 1041–1050. doi: 10.1046/j.1365-2745.2000.00518.x
Bigelow, S. W., and Canham, C. D. (2007). Nutrient limitation of juvenile trees in a northern hardwood forest: calcium and nitrate are preeminent. For. Ecol. Manag. 243, 310–319. doi: 10.1016/j.foreco.2007.03.027
Blumstein, M., Richardson, A., Weston, D., Zhang, J., Muchero, W., and Hopkins, R. (2020). A new perspective on ecological prediction reveals limits to climate adaptation in a temperate tree species. Curr. Biol. 30, 1447–1453.e4. doi: 10.1016/j.cub.2020.02.001
Blumstein, M., Sala, A., Weston, D. J., Holbrook, N. M., and Hopkins, R. (2022). Plant carbohydrate storage: intra- and inter-specific trade-offs reveal a major life history trait. New Phytol. 235, 2211–2222. doi: 10.1111/nph.18213
Boyer, J. S. (1970). Leaf enlargement and metabolic rates in corn, soybean and sunflower at various leaf water potentials. Plant Physiol. 46, 233–235. doi: 10.1104/pp.46.2.233
Clark, D. B., Clark, D. A., and Grayum, M. H. (1992). Leaf demography of a neotropical rain forest cycad, Zamia skinneri (Zamiaceae). Am. J. Bot. 79, 28–33. doi: 10.1002/j.1537-2197.1992.tb12619.x
Cocozza, C., Palombo, C., Tognetti, R., La Porta, N., Anichini, M., Giovannelli, A., et al. (2016). Monitoring intra-annual dynamics of wood formation with microcores and dendrometers in Picea abies at two different altitudes. Tree Physiol. 36, 832–846. doi: 10.1093/treephys/tpw009
Craine, J. M., and Dybzinski, R. (2013). Mechanisms of plant competition for nutrients, water and light. Funct. Ecol. 27, 833–840. doi: 10.1111/1365-2435.12081
Crispo, E. (2008). Modifying effects of phenotypic plasticity on interactions among natural selection, adaptation and gene flow. J. Evol. Biol. 21, 1460–1469. doi: 10.1111/j.1420-9101.2008.01592.x
Dang, Q. L. (2013). Improving the quality and reliability of gas exchange measurements. J Plant Physiol Pathol. 1:2. doi: 10.4172/jppp.1000e101
Dietze, M. C., Sala, A., Carbone, M. S., Czimczik, C. I., Mantooth, J. A., Richardson, A. D., et al. (2014). Nonstructural carbon in woody plants. Ann. Rev. Plant Biol. 65, 667–687. doi: 10.1146/annurev-arplant-050213-040054
Dumroese, R. K., Davis, A. S., and Jacobs, D. F. (2011). Nursery response of Acacia koa seedlings to container size, irrigation method, and fertilization rate. J. Plant Nutr. 34, 877–887. doi: 10.1080/01904167.2011.544356
Elevitch, CR, Wilkinson, KM, and Friday, J (2006) Acacia koa (koa) Traditional Trees of Pacific Islands: Their Culture, Environment, and Use. Permanent Agriculture Resources, Holualoa: 1–28.
Elison Timm, O. (2017). Future warming rates over the Hawaiian islands based on elevation-dependent scaling factors. Int. J. Climatol. 37, 1093–1104. doi: 10.1002/joc.5065
Engelbrecht, B. M., Comita, L. S., Condit, R., Kursar, T. A., Tyree, M. T., Turner, B. L., et al. (2007). Drought sensitivity shapes species distribution patterns in tropical forests. Nature 447, 80–82. doi: 10.1038/nature05747
Ernesto, G., and Ferendo, V. (2012). Studying phenotypic plasticity: the advantages of a broad approach. Biol. J. Linnean Soc. 105, 1–7. doi: 10.1111/j.1095-8312.2011.01793.x
Eskelinen, A., and Harrison, S. P. (2015). Resource colimitation governs plant community responses to altered precipitation. Proc. Nat. Acad. Sci. 112, 13009–13014. doi: 10.1073/pnas.1508170112
Fajardo, A., and Piper, F. I. (2021). How to cope with drought and not die trying: drought acclimation across tree species with contrasting niche breadth. Funct. Ecol. 35, 1903–1913. doi: 10.1111/1365-2435.13861
Fownes, J. H., and Harrington, R. A. (2004). Seedling response to gaps: separating effects of light and nitrogen. For. Ecol. Manag. 203, 297–310. doi: 10.1016/j.foreco.2004.07.044
Galvez, D. A., Landhäusser, S. M., and Tyree, M. T. (2011). Root carbon reserve dynamics in aspen seedlings: does simulated drought induce reserve limitation? Tree Physiol. 31, 250–257. doi: 10.1093/treephys/tpr012
Ghalambor, C. K., McKay, J. K., Carroll, S. P., and Reznick, D. N. (2007). Adaptive versus non-adaptive phenotypic plasticity and the potential for contemporary adaptation in new environments. Fun. Ecol. 21, 394–407. doi: 10.1111/j.1365-2435.2007.01283.x
Giambelluca, T. W., Diaz, H. F., and Luke, M. S. A. (2008). Secular temperature changes in Hawai‘i. Geophys. Res. Lett. 35:L12702. doi: 10.1029/2008GL034377
Gleeson, S. K., and Tilman, D. (1992). Plant allocation and the multiple limitation hypothesis. Am. Nat. 139, 1322–1343. doi: 10.1086/285389
Gugger, P. F., Liang, C. T., Sork, V. L., Hodgskiss, P., and Wright, J. W. (2018). Applying landscape genomic tools to forest management and restoration of Hawaiian koa (Acacia koa) in a changing environment. Evol. Appl. 11, 231–242. doi: 10.1111/eva.12534
Giambelluca, T. W., Chen, Q., Frazier, A. G., Price, J. P., Chen, Y., Chu, P., et al. (2013). Online Rainfall Atlas of Hawai‘i. Bull. Amer. Meteor. Soc. 94, 313–316. doi: 10.1175/BAMS-D-11-00228.1
Harrison, S., and LaForgia, M. (2019). Seedling traits predict drought-induced mortality linked to diversity loss. Proc. Nat. Acad. Sci. 116, 5576–5581. doi: 10.1073/pnas.1818543116
Hartmann, H., and Trumbore, S. (2016). Understanding the roles of nonstructural carbohydrates in forest trees – from what we can measure to what we want to know. New Phytol. 211, 386–403. doi: 10.1111/nph.13955
Hirose, T., and Bazzaz, F. A. (1998). Trade-off between light-and nitrogen-use efficiency in canopy photosynthesis. Annals Bot. 82, 195–202. doi: 10.1006/anbo.1998.0668
Hoch, G. (2015). Carbon reserves as indicators for carbon limitation in trees. Prog. Bot. 76, 321–346. doi: 10.1007/978-3-319-08807-5_13
Hoch, G., Popp, M., and Körner, C. (2002). Altitudinal increase of mobile carbon pools in Pinus cembra suggests sink limitation of growth at the Swiss treeline. Oikos 98, 361–374. doi: 10.1034/j.1600-0706.2002.980301.x
Holmgren, M. (2000). Combined effects of shade and drought on tulip poplar seedlings: trade-off in tolerance or facilitation? Oikos 90, 67–78. doi: 10.1034/j.1600-0706.2000.900107.x
Kobe, R. K. (1996). Intraspecific variation in sapling mortality and growth predicts geographic variation in forest composition. Ecol. Monogr. 66, 181–201. doi: 10.2307/2963474
Körner, C. (2003). Carbon limitation in trees. J. Ecol. 91, 4–17. doi: 10.1046/j.1365-2745.2003.00742.x
Körner, C. (2012). Treelines will be understood once the functional difference between a tree and a shrub is. Ambio 41, 197–206. doi: 10.1007/s13280-012-0313-2
Körner, C., and Diemer, M. (1987). In situ photosynthetic responses to light, temperature and carbon dioxide in herbaceous plants from low and high altitude. Fun. Ecol. 1, 179–194. doi: 10.2307/2389420
Körner, C., Neumayer, M., Menendez-Riedl, S. P., and Smeets-Scheel, A. (1989). Functional morphology of mountain plants. Flora 182, 353–383. doi: 10.1016/S0367-2530(17)30426-7
Kubiske, M. E., Abrams, M. D., and Mosstoller, S. A. (1996). Stomatal and nonstomatal limitations of photosynthesis in relation to the drought and shade tolerance of tree species in open and understory environments. Trees 11, 76–82. doi: 10.1007/s004680050062
Lenth, R., and Lenth, M. R. (2018). Package ‘lsmeans’. Am. Stat. 34, 216–221. doi: 10.1080/00031305.1980.10483031
Limousin, J. M., Yepez, E. A., McDowell, N. G., and Pockman, W. T. (2015). Convergence in resource use efficiency across trees with differing hydraulic strategies in response to ecosystem precipitation manipulation. Fun. Ecol. 29, 1125–1136. doi: 10.1111/1365-2435.12426
Markesteijn, L., and Poorter, L. (2009). Seedling root morphology and biomass allocation of 62 tropical tree species in relation to drought- and shade-tolerance. J. Ecol. 97, 311–325. doi: 10.1111/j.1365-2745.2008.01466.x
Matesanz, S., Ramos-Muñoz, M., Blanco-Sánchez, M., and Escudero, A. (2020). High differentiation in functional traits but similar phenotypic plasticity in populations of a soil specialist along a climatic gradient. Annals Bot. 125, 969–980. doi: 10.1093/aob/mcaa020
Muller, B., Pantin, F., Génard, M., Turc, O., Freixes, S., Piques, M., et al. (2011). Water deficits uncouple growth from photosynthesis, increase C content, and modify the relationships between C and growth in sink organs. J. Exp. Bot. 62, 1715–1729. doi: 10.1093/jxb/erq438
Myers, J. A., and Kitajima, K. (2007). Carbohydrate storage enhances seedling shade and stress tolerance in a neotropical forest. J. Ecol. 95, 383–395. doi: 10.1111/j.1365-2745.2006.01207.x
Niinemets, Ü., Sonninen, E., and Tobias, M. (2004). Canopy gradients in leaf intercellular CO2 mole fractions revisited: interactions between leaf irradiance and water stress need consideration. Plant Cell Environ. 27, 569–583. doi: 10.1111/j.1365-3040.2003.01168.x
O’Brien, M. J., Engelbrecht, B. M. J., Joswig, J., Pereyra, G., Schuldt, B., Jansen, K. J., et al. (2017). A synthesis of tree functional traits related to drought-induced mortality in forests across climatic zones. J. Appl. Ecol. 54, 1669–1686. doi: 10.1111/1365-2664.12874
Pascual, L. S., Mittler, R., Sinha, R., Peláez-Vico, M. Á., López-Climent, M. F., Vives-Peris, V., et al. (2023). Jasmonic acid is required for tomato acclimation to multifactorial stress combination. Env. Expt. Bot. 213:105425. doi: 10.1016/j.envexpbot.2023.105425
Paudel, I., Gerbi, H., Zisovich, A., Sapir, G., and Klein, T. (2021). Intraspecific plasticity in hydraulic and stomatal regulation under drought is linked to aridity at the seed source in a wild pear species. Tree Physiol. 41, 960–973. doi: 10.1093/treephys/tpaa159
Pejchar, L., Holl, K. D., and Lockwood, J. L. (2005). Hawaiian honeycreeper home range size varies with habitat: implications for native Acacia koa forestry. Ecol. Appl. 15, 1053–1061. doi: 10.1890/04-0577
Plavcová, L., and Jansen, S. (2015). “The role of xylem parenchyma in the storage and utilization of nonstructural carbohydrates” in Functional and Ecological Xylem Anatomy. ed. U. Hacke (Cham, Switzerland: Springer International Publishing), 209–234.
Poorter, L., and Bongers, F. (2006). Leaf traits are good predictors of plant performance across 53 rain forest species. Ecol. 87, 1733–1743. doi: 10.1890/0012-9658(2006)87[1733:LTAGPO]2.0.CO;2
Quero, J. L., Villar, R., Marañón, T., Zamora, R., Vega, D., and Sack, L. (2008). Relating leaf photosynthetic rate to whole-plant growth: drought and shade effects on seedlings of four Quercus species. Fun. Plant Biol. 35, 725–737. doi: 10.1071/FP08149
Raich, J. W., and Schlesinger, W. H. (1992). The global carbon dioxide flux in soil respiration and its relationship to vegetation and climate. Tellus B. 44, 81–99. doi: 10.3402/tellusb.v44i2.15428
Richardson, J. L., Urban, M. C., Bolnick, D. I., and Skelly, D. K. (2014). Microgeographic adaptation and the spatial scale of evolution. Trends Ecol. Evol. 29, 165–176. doi: 10.1016/j.tree.2014.01.002
Rose, K. M. E., Friday, J. B., and Jacobs, D. F. (2019a). Establishment and heteroblasty of Acacia koa in canopy gaps. For. Ecol. Manag. 453:117592. doi: 10.1016/j.foreco.2019.117592
Rose, K. M. E., Friday, J. B., Oliet, J. A., and Jacobs, D. F. (2020). Canopy openness affects microclimate and performance of underplanted trees in restoration of high-elevation tropical pasturelands. Agric. For. Meterol. 292:108105. doi: 10.1016/j.agrformet.2020.108105
Rose, K. M. E., Mickelbart, M. V., and Jacobs, D. F. (2019b). Plasticity of phenotype and heteroblasty in contrasting populations of Acacia koa. Ann. Bot. 124, 399–409. doi: 10.1093/aob/mcz083
Sala, A., Woodruff, D. R., and Meinzer, F. C. (2012). Carbon dynamics in trees: feast or famine? Tree Physiol. 32, 764–775. doi: 10.1093/treephys/tpr143
Scowcroft, P. G., Friday, J. B., Haraguchi, J., Idol, T., and Dudley, N. S. (2010). Poor stem form as a potential limitation to private investment in koa plantation forestry in Hawaii. Small Scale For. 9, 243–262. doi: 10.1007/s11842-009-9107-1
Scowcroft, P. G., Haraguchi, J. E., and Hue, N. V. (2004). Reforestation and topography affect montane soil properties, nitrogen pools, and nitrogen transformations in Hawaii. Soil Sci. Soc. Am. J. 68, 959–968. doi: 10.2136/sssaj2004.9590
Signori-Müller, C., Oliveira, R. S., Barros, F. D. V., Barros, F. V., Tavares, J. V., Gilpin, M., et al. (2021). Non-structural carbohydrates mediate seasonal water stress across Amazon forests. Nat. Commun. 12:2310. doi: 10.1038/s41467-021-22378-8
Skelton, R. P., Anderegg, L. D. L., Diaz, J., Kling, M. M., Papper, P., Lamarque, L. J., et al. (2021). Evolutionary relationships between drought-related traits and climate shape large hydraulic safety margins in western north American oaks. Proc. Natl. Acad. Sci. 118:e2008987118. doi: 10.1073/pnas.2008987118
Somero, G. N. (2010). The physiology of climate change: how potentials for acclimatization and genetic adaptation will determine ‘winners’ and ‘losers’. J. Exp. Biol. 213, 912–920. doi: 10.1242/jeb.037473
Thornley, J. H. M. (2002). Instantaneous canopy photosynthesis: analytical expressions for sun and shade leaves based on exponential light decay down the canopy and an acclimated non-rectangular hyperbola for leaf photosynthesis. Ann. Bot. 89, 451–458. doi: 10.1093/aob/mcf071
Thyroff, E. C., Burney, O. T., Mickelbart, M. V., and Jacobs, D. F. (2019). Unraveling shade tolerance and plasticity of semi-evergreen oaks: insights from maritime forest live oak restoration. Front. Plant Sci. 10:1526. doi: 10.3389/fpls.2019.01526
Valladares, F., and Pearcy, R. W. (2002). Drought can be more critical in the shade than in the sun: a field study of carbon gain and photo-inhibition in a Californian shrub during a dry el niño year. Plant Cell Environ. 25, 749–759. doi: 10.1046/j.1365-3040.2002.00856.x
West-Eberhard, M. J. (1989). Phenotypic plasticity and the origins of diversity. Annu. Rev. Ecol. Evol. Syst. 20, 249–278. doi: 10.1146/annurev.es.20.110189.001341
Wiley, E., and Helliker, B. (2012). A re-evaluation of carbon storage in trees lends greater support for carbon limitation to growth. New Phytol. 195, 285–289. doi: 10.1111/j.1469-8137.2012.04180.x
Wilkinson, KM, and Elevitch, CR (2003) Growing Koa: A Hawaiian Legacy Tree. Permanent Agriculture Resources: Holualoa, Hawaii. 112 p.
Wong, S. C. (1990). Elevated atmospheric partial pressure of CO2 and plant growth. Photosynth. Res. 23, 171–180. doi: 10.1007/BF00035008
Woodruff, D. R., and Meinzer, F. C. (2011). Water stress, shoot growth and storage of non-structural carbohydrates along a tree height gradient in a tall conifer. Plant Cell Environ. 34, 1920–1930. doi: 10.1111/j.1365-3040.2011.02388.x
Wright, J. P., and Sutton-Grier, A. (2012). Does the leaf economic spectrum hold within local species pools across varying environmental conditions? Funct. Ecol. 26, 1390–1398. doi: 10.1111/1365-2435.12001
Zandalinas, S. I., and Mittler, R. (2022). Plant responses to multifactorial stress combination. New Phytol. 234, 1161–1167. doi: 10.1111/nph.18087
Keywords: populations, resource co-limitation, resource use efficiency, acclimation, adaptation, Acacia koa
Citation: Paudel I, Rose KME, Landhäusser SM and Jacobs DF (2023) Co-limitation of resources reveals adaptations of a tropical tree to heterogeneous environments along an elevational cline. Front. For. Glob. Change. 6:1225778. doi: 10.3389/ffgc.2023.1225778
Edited by:
Ned Fetcher, Wilkes University, United StatesReviewed by:
Mark Bloomberg, University of Canterbury, New ZealandJ. D. Lewis, Fordham University, United States
Copyright © 2023 Paudel, Rose, Landhäusser and Jacobs. This is an open-access article distributed under the terms of the Creative Commons Attribution License (CC BY). The use, distribution or reproduction in other forums is permitted, provided the original author(s) and the copyright owner(s) are credited and that the original publication in this journal is cited, in accordance with accepted academic practice. No use, distribution or reproduction is permitted which does not comply with these terms.
*Correspondence: Douglass F. Jacobs, ZGphY29ic0BwdXJkdWUuZWR1