 Fang Yu
 Qiang Liu
 Chunnan Fan
 Shuang Li
- College of Forestry, Beihua University, Jilin, China
Temperate forests are of pivotal importance in global carbon cycle, as they currently act as a carbon sink. Moreover, the continued expansion of the forest provides significant benefits in terms of mitigating climate change. Soil organic carbon (SOC) constitutes a vital component of the carbon inventory harbored within forest soils. Thus, understanding the dynamics and distribution of SOC in temperate forest soils can be essential to better predict the forest SOC inventories, and can help to provide theoretical basis for further studies in soil carbon management technologies. Spatial variability of SOC has been studied extensively, but the mechanism that regulates the vertical pattern of SOC is still not clear. In the present study, we hypothesized that the vertical pattern of SOC in temperate forest soils is dominated by the vertical transport of solute in soil, and a theoretical vertical scaling of SOC was proposed based on percolation theory. Theoretical range of SOC in the national forests in northeastern China and the United States were also predicted. The agreement between the observed SOC profiles and the theoretical scaling supported the hypothesis and suggested that percolation theory can be applied to depict the vertical distribution of SOC, while the application could be limited if vegetation cover and soil texture alter the dominant controlling factor of SOC distribution. The concordance between empirical data and the predicted range also showed significant potential of integrating percolation theory into comprehensive models for carbon stock estimation.
1. Introduction
Forest soils plays an important and irreplaceable role in global carbon cycle, as soil is the largest reservoir of terrestrial organic carbon, and more than 40% of soil organic carbon (SOC) in the terrestrial ecosystem is stored in forest soils (IPCC, 2007). 25% of the world’s forest area is covered by temperate forest (FAO, 2016), which currently act as a carbon sink of 0.8 Pg year−1, accounting for 34% of total carbon sink in world’s established forests (Pan et al., 2011). According to the Food and Agriculture Organization, the forest area in temperate forest in north hemisphere has been expanding (FAO, 2016), providing significant benefits to mitigate global warming by increasing the uptake of CO2. Thus, understanding the quantity and dynamics of carbon storage and carbon sequestration in temperate forest is of great importance for climate change mitigation investigation. The amount of SOC in forest soils depends on the budget between the organic matter input from plant remains and the output through carbon decomposition by soil microbes (Jenny, 1941; Schlesinger, 1977). Due to the high heterogeneity of soil, there are uncertainties in SOC stock estimation in forest soils, making it difficult for quantifying the global carbon storage as well as making policies to regulate green gas emission for countries. Recent studies have revealed that the spatial variability of SOC in forest soils can be affected by climate, vegetation cover, soil properties, and land use (Jobbágy and Jackson, 2000; Rasmussen et al., 2005; Hao et al., 2015; Wang et al., 2015), but the vertical distribution of SOC and its controlling dynamics are still unclear (Jobbágy and Jackson, 2000; Rumpel and Kögel-Knabner, 2011; Ota et al., 2013). Given the large amount of SOC stored below the top layer of soil, understanding the vertical distribution of SOC can be essential for predicting terrestrial carbon cycling both in short and long-time scales, and for improving the accuracy of estimating forest SOC inventories.
The vertical pattern of SOC usually demonstrates a strong gradient. In general, most SOC is retained in topsoil (~20 cm) and declines with soil depth (Kramer et al., 2010; Tate et al., 2011; Hao et al., 2015). Several mathematical functions that relate to SOC content (usually in mass percentage) or SOC density have been proposed to describe the SOC depth profile, including cumulative and non-cumulative log–log model (e.g., Jobbágy and Jackson, 2000; Hiederer, 2009), polynomial and exponential-based functions (e.g., Hobley et al., 2015; Ottoy et al., 2016) and power-law model (e.g., Li and Zhao, 2001; Robinson and Benke, 2023), which has been applied to describe many ecological systems and fractal-like behaviors. The vertical distribution of SOC is a result of long-term accumulation of carbon in soil. The primary contributors to SOC are derived from both above and below-ground biomass, encompassing leaf and root litter, plant debris, as well as SOC delivered by solute from the upper soil layers (Neff and Asner, 2001; Fröberg et al., 2007; Rumpel and Kögel-Knabner, 2011). Carbon originating from above-ground biomass tends to accumulate mainly in the topsoil layer (Fröberg et al., 2007, 2009). SOC in this layer is heavily influenced by climate, vegetation, and soil texture, resulting in regional disparities of the overall amount of SOC (Jobbágy and Jackson, 2000). Conversely, in the subsurface layer of soil, root-derived carbon, and the downward movement of SOC from the overlying soil above can be significant carbon sources (Leifeld and KoÈgel-Knabner, 2001; Neff and Asner, 2001; Baisden and Parfitt, 2007), which play crucial roles in shaping the vertical patterns of SOC. In temperate forests, the vertical transport of solute may have a greater impact on the vertical distribution of SOC than the influence of root distribution. Firstly, a significant proportion of root (62% in deciduous and 55% in evergreen forests) is concentrated in the upper 20 cm of soil (Jobbágy and Jackson, 2000), and the fine root litter production decreases dramatically with soil depth (Trumbore et al., 2006). Additionally, it is suggested that root system in forest is typically constrained within a two-dimensional network. Prior research has demonstrated that a two-dimensional mass fractal dimensionality derived from percolation theory was suitable to describe the relationship between root biomass and the root radical extent (Hunt, 2017), and two-dimensional models has proven to be more precise in simulating the pattern of water uptake by roots compared with one-dimensional and three-dimensional models (Vrugt et al., 2001). These interconnected studies indicate that a significant portion of root-derived carbon is retained in the topsoil. Furthermore, in temperate forests, the above-ground allocation of biomass is relatively high, with a global average root-to-shoot ratio of 0.386 (Qi et al., 2019). As a result, the carbon input from root litter below the topsoil layer is likely to contribute only a small fraction to the SOC compared to the carbon input by solute from above (Gill and Jackson, 2000; Joslin et al., 2006). The discovery of deeper SOC profiles compared to the distribution of living roots also emphasizes the utmost importance of solute transport in the redistribution of SOC within the soil profile (Jobbágy and Jackson, 2000; Neff and Asner, 2001; Baisden and Parfitt, 2007; Ota et al., 2013).
Compared with other types of forests, temperate forests are characterized by a moderate climatic regime that results in less disturbance from soil frost and the significant soil leaching to the vertical transport of SOC in soil. Moreover, in the context of the vertical pattern of SOC, the influence of roots is less significant when compared to the impact of solute transport (Gill and Jackson, 2000; Joslin et al., 2006). Therefore, the percolating water as an active agent, could be a dominant factor that transport and redistributes SOC in temperate forest soils. Based on such assumption, the vertical pattern of SOC in temperate forest soils could be described by the vertical transport of solute. Here, we propose to apply percolation theory, a recognized approach for the characterization of non-Gaussian transport phenomena prevalent in natural porous media (e.g., Cushman and O’Malley, 2015), to explain and predict the vertical distribution of SOC within temperate forest soils.
We hypothesized that in temperate forest soils, water percolating downward in soil is the key factor that redistributes SOC, such that the vertical distribution of SOC is controlled by the vertical transport of solute, which can be described by a simple power-law derived from percolation theory. The proposed theoretical scaling from percolation theory was examined by published datasets of SOC depth profiles in temperate forest soils across the world at different spatial scales, and theoretical predictions of SOC in natural forest lands within the cool temperate zone in China and the United States were compared with empirical data to evaluate the application of percolation theory in describing the vertical distribution of SOC in temperate forest soils.
2. Materials and methods
2.1. Theoretical framework of percolation theory
The application of percolation theory for the depiction of solute transport mechanism in soil is founded on the solute transport theory derived from the conceptual model advanced by Hunt and Skinner (2008), which generated a function of solute arrival time distribution with transport distance in porous media. From the theory, the transport of solute slows down as it travels, such that the solute transport time, t, does not increase linearly with transport distance, x. Instead, t increases with x to the power of Db (Lee et al., 1999), with Db as the fractal dimensionality of percolation backbone that is described by percolation theory. This power-law formulation has been observed and confirmed in relevant fields such as the time dependence of chemical weathering rates and soil production rates in several studies (Gunnell, 2003; White and Brantley, 2003; Egli et al., 2014) where solute transport controls the rate of chemical weathering. Models derived from the theory have also been successfully applied and developed to predict soil formation (Yu et al., 2017; Yu and Hunt, 2017, 2018) and the depth of calcic horizon (Hunt and Ghanbarian, 2016).
The relevance of percolation theory to the vertical distribution of SOC is that the downward movement of SOC from the surface layer of soil in temperate forest can be a key factor that redistributes and controls the vertical pattern of SOC, and that the infiltration of SOC along the soil profile ultimately traces back to the vertical transport of solute in soil. As described in percolation theory, the solute transport time t scales with transport distance, x, in the form of t ∝ x Db, and the value of Db is a given value in percolation theory that only depends on the moisture condition and the dimension of flow in the medium, regardless of other properties of the medium. Table 1 summarized the values of Db in different scenarios. For the application here, since the percolation of SOC in soil is a wetting process, we considered the transport of SOC by solute in temperate forest soils as 3D saturated conditions, where Db = 1.87 (Sheppard et al., 1999). There also could be possibilities of 2D condition, for example, if the vertical transport of SOC is along a fracture plane, which might be less common in forest soils.
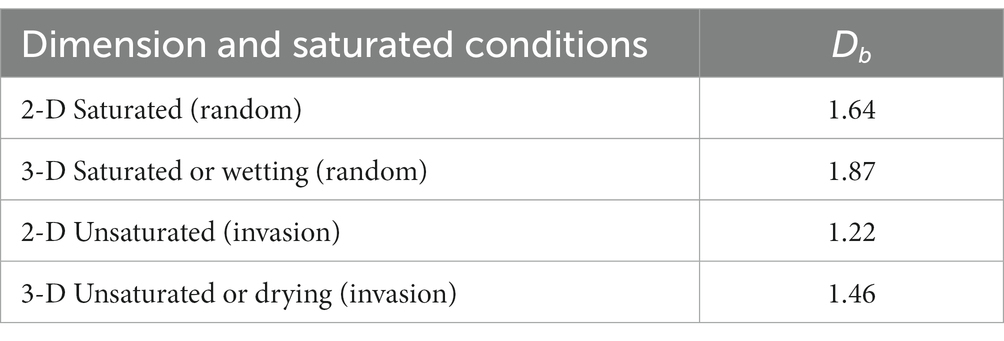
Table 1. Values of fractal dimensionality of percolation backbone (Db) (from Hunt, 2015).
Thus, in the context of the transport of SOC in temperate forest, there is,
By taking the time derivative of h, one can obtain the vertical scaling of delivery rate of SOC, Rsoc, with soil depth,
To assess the effectiveness of percolation theory in describing and explaining the vertical pattern of SOC in temperate forest soils, theoretical scaling relationship between SOC concentration and soil depth described by Equation (3) were compared with empirical data sampling in temperate forests obtained from various sources, including published literature and publicly available datasets. Predictions of SOC depth profiles with Equation (4) were also compared with field data to evaluate the model.
2.2. Data sources and analysis
The analysis presented here is based on several published datasets to examine the viability of percolation theory for modeling the vertical distribution of SOC in temperate forests across multiple scales, including plot-scale, national-scale and global-scale analysis. Data sources (Table 2) include the summarized results of 3 global soil datasets from Jobbágy and Jackson (2000), national soil dataset from The Second National Soil Survey (SNSS) of China (National Soil Survey Office, 1998), soil characterization dataset from National Cooperative Soil Survey (NCSS) of the United States (National Cooperative Soil Survey, 2023), summarized results of national forest soils of France from Soucémarianadin et al. (2018), dataset of forest soils in northeastern China from Liu et al. (2016), and published soil profiles from 9 individual studies. SOC depth profiles obtained from these multiple datasets at varying scales were fitted with power-law function, and the degree of concordance between the scaling exponents resulting from the analysis and the theoretical exponent posited by percolation theory were examined to evaluate Equation (3). Due to the potential influence of root distribution on the vertical distribution of SOC in the surface layer of soil, the presence of carbon disturbances derived from roots within this layer can potentially disrupt the vertical pattern predicted by percolation theory, particularly for datasets containing multiple data points in the topsoil. To mitigate the impact of roots in the analysis of such datasets, a single data point representing the average value of all points within the 0-20 cm soil layer is selected and retained in the topsoil for these datasets. Although there may be some uncertainty introduced by simply taking the average of all points in the topsoil, as the change in SOC is not linear, using the averaging method is consistent with the conventional approach used for measuring field data.
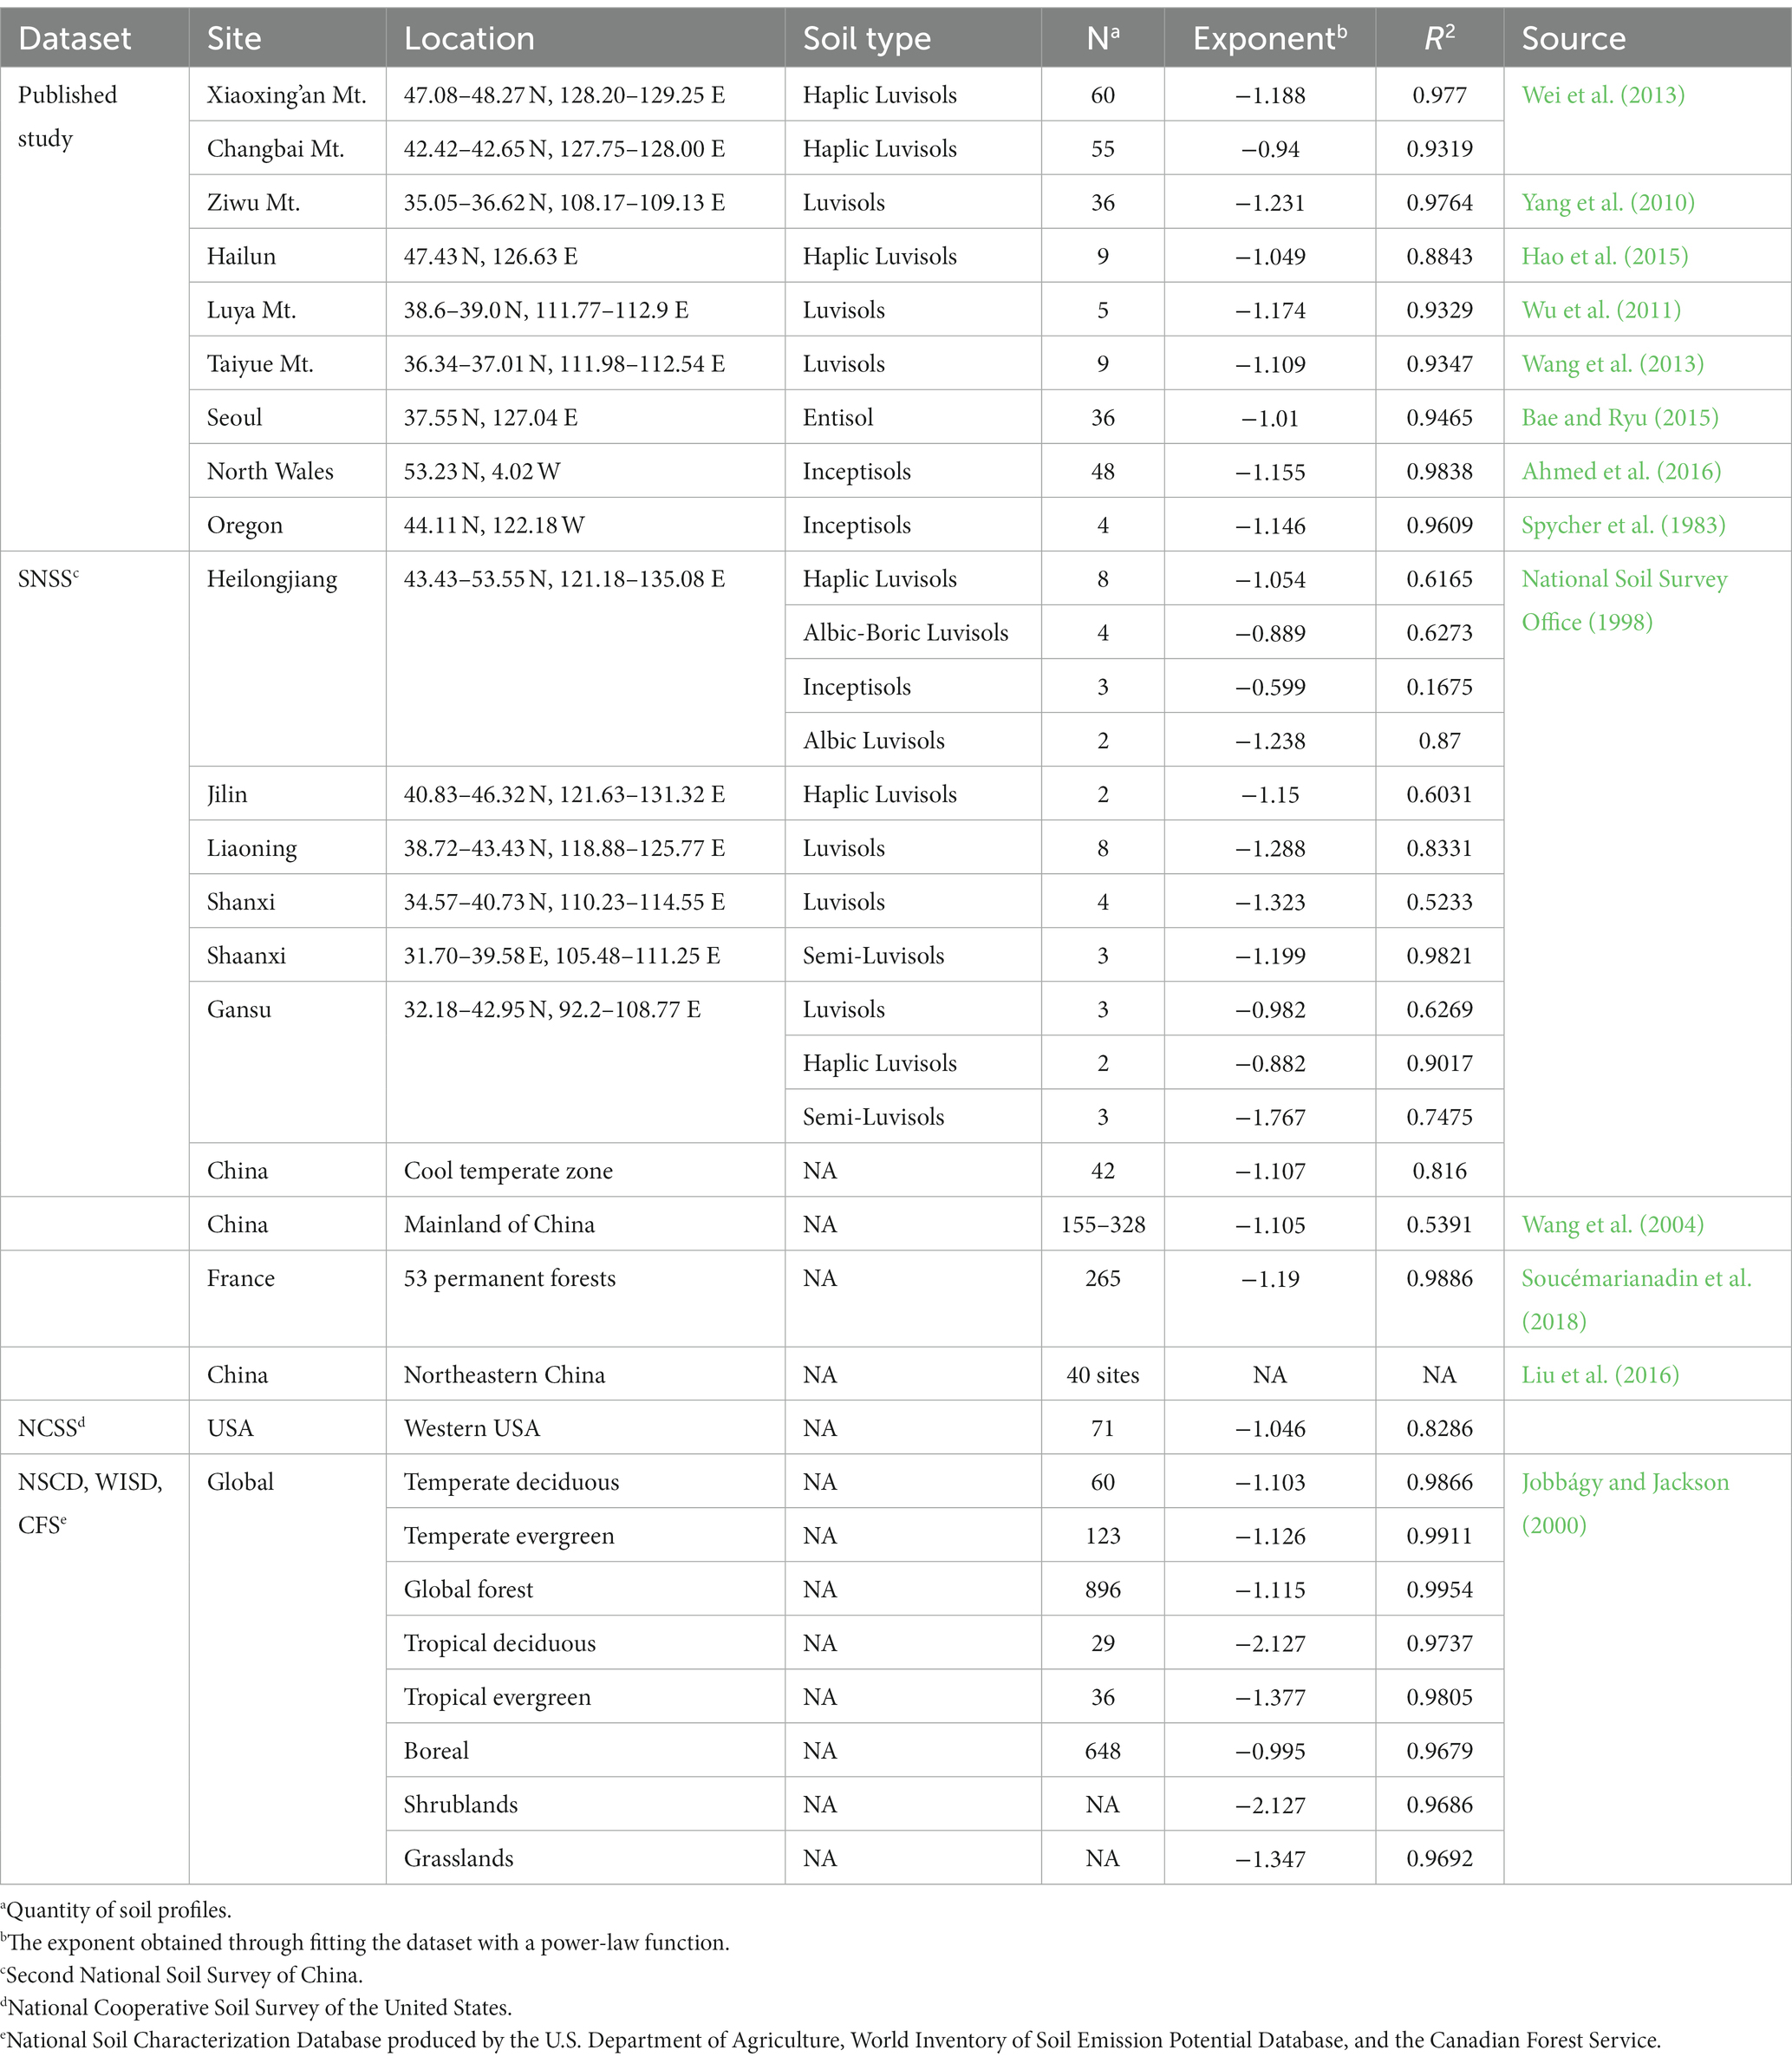
Table 2. Details of data sources and extracted exponents of power-law functions.
For examination in scales larger than plot-scale, data from NCSS and SNSS were used and grouped by nation or province to assess the applicability of percolation theory. It is worth noting that aggregating data from multiple sites within the same region may result in scatter in the SOC concentration at a given soil depth. This occurrence can be attributed to the high spatial variability of SOC levels across different sites, and such variation has the potential to impact the outcomes of fitting the dataset using a single power-law regression. Therefore, we adopted two steps to enable the comparative analysis between the theoretical scaling and the power-law resulting from the field data. First, the sampling region were limited within the cool temperate region to minimize any potential influence from climate. Specifically, only data from SNSS and NCSS that were obtained within this climatic zone in China and the United States were included in the analysis. Next, the data aggregated within each region were subjected to a normalization procedure based on soil depth. This step was deemed necessary since soils were sampled according to pedogenetic horizons, rather than sampling at regular depth increments in both datasets. The method of data normalization involves grouping soil profiles from the same region according to soil depth increments (0–20, 20–25, 25–30, 30–40, 40–50, 50–60, 60–70, 70–80, 80–100, 100–120, 120–140, 140–160,160–180, 180–220, unit in centimeter). The wider soil interval in the initial increment is intentionally chosen to ensure that only a single data point representing the top 20 cm soil layer is retained. The mean value of SOC was then calculated for each group, and the midpoint of each soil depth increment is used as the corresponding depth for that group. The normalized datasets of SOC depth profile were then fitted with power-law and compared with the theoretical scaling.
2.2.1. Plot-scale examination
The analysis was conducted on published data from various locations, including Xiaoxing’an Mountains and Changbai Mountains (Wei et al., 2013), Hailun (Hao et al., 2015), Ziwu Mountain (Yang et al., 2010), Taiyue Mountain (Wang et al., 2013), and Luya Mountain (Wu et al., 2011) in north China. Additionally, data from Seoul, South Korea (Bae and Ryu, 2015), North Wales, UK (Ahmed et al., 2016), and Willamette National Forest in Oregon, USA (Spycher et al., 1983) were also analyzed. For all studies referenced here, soil samples were collected by depth increments. The mean values of SOC across multiple plots within each study were graphed against soil depth, and subsequently modeled using a power-law regression function. The resulting power-law exponents were then compared with Equation (3).
2.2.2. National-scale examination
Data analysis was conducted at the provincial scale in China, and subsequently extended to the national level in China and the United States. 42 out of 2,473 soil profiles from SNSS of China were selected based on location (provinces located within the cool temperate zone) and land use. Data from 7 provinces including Heilongjiang, Jilin, Liaoning, Inner Mongolia, Gansu, Shanxi, and Shaanxi with tree cover were selected and grouped by province. To reduce the influence of soil texture, soils within distinct soil pedons from the same province were partitioned into subgroups. In order to minimize potential effects from roots, when multiple data points were present within the top 20 cm of each soil profile, averaged SOC values and their corresponding depths were assigned. Data were then fitted with power-law in each group to examine the application of the proposed method at province level. For evaluation in national scale, data from the same source, i.e., SNSS, were combined into a single dataset. In addition, data obtained from the NCSS in the United States were used for analysis. NCSS provides soil profiles of national forests system lands in the United States, and soils located in the cool temperate zone with tree cover as the primary earth cover were selected for data analysis. The normalization method was applied to both datasets in order to compare with the theoretical scaling. Result from Wang et al. (2004) that summarized the vertical distribution of SOC across all types of forest in mainland China based on SNSS and the summarized result of 53 national permanent forests in France (Soucémarianadin et al., 2018) was also presented here for comparison.
2.2.3. Global-scale examination
Jobbágy and Jackson (2000) analyzed 3 global datasets (National Soil Characterization Database produced by the U.S. Department of Agriculture, World Inventory of Soil Emission Potential Database, and the Canadian Forest Service) of SOC profiles across the world. For global-scale examination, the summarized results of vertical distribution of SOC in temperate deciduous forest, temperate evergreen forest, and in global forest across all types of forest were referenced here for analysis.
2.2.4. Predictions of the vertical distribution of SOC
The vertical distribution of SOC in temperate forest soils can be predicted using Equation (4), with the given values of Cs and hs for a particular site under consideration. To assess the efficacy of the model, we set Cs and hs values based on published results of SOC (Liu et al., 2016; Domke et al., 2017) and compare the predictive outcomes with SOC in two cool temperate regions: forest soils in northeastern China [digitized from Liu et al., 2016] and the NCSS data of USA. Domke et al. (2017) analyzed the top layer of soil (0 to 20.32 cm) of 3,636 soil profiles in the USA from National Forest Inventory (NFI), resulting minimum SOCmin = 1.00 Mg/ha, maximum SOCmax = 524 Mg/ha, and mean SOCave = 54.00 Mg/ha. The values were converted to mass percentage for Equation (4) using a bulk density of 1.2 g/cm3 (Liu et al., 2013) and a soil thickness of 0.2032 m to calculate the lowest (Cs(low) = 0.043%), highest (Cs(high) = 24.18%) and the mean concentration of SOC (Cs(ave) = 2.30%) at hs = 0.1016 m (half of 0.2032 m). For prediction in northeastern China, we set SOCmin = 1.60 Mg/ha, maximum SOCmax = 339 Mg/ha, and mean SOCave = 54.7 Mg/ha with a corresponding depth hs = 0.125 m based on the analysis of 348 soil profiles in forest soils of east China from Liu et al. (2016). Similar calculations were performed using a soil thickness of 0.25 m and a bulk density of 0.88 g/cm3, also based on the findings of Liu et al. (2016), to determine the SOC content in mass percentage, resulting in Cs(low) = 0.073%, Cs(high) = 15.41%, and Cs(ave) = 2.49%. The calculated values of SOC in mass percentage were used to predict the upper and lower limits as well as the most likely vertical distribution of SOC in forest soils in the cool temperate region of China and the USA.
3. Results
Plot-scale analysis in the 9 study sites (Figure 1) fitted well with power-law function, with variation of SOC across the same soil depth among sites. The discrepancies between the extracted exponents (Figure 1 and Table 2) and the predicted power (−1.149) range between 3 and 18%. Such agreement along with the high values of regression coefficient indicated that vertical distribution of SOC in temperate forest soil in plot-scale can be described using power-law, and the extracted exponents were close to the theoretical value predicted from percolation theory. The scatter in Hailun could be caused by the limited quantity of soil profiles compared with the other 3 sites.
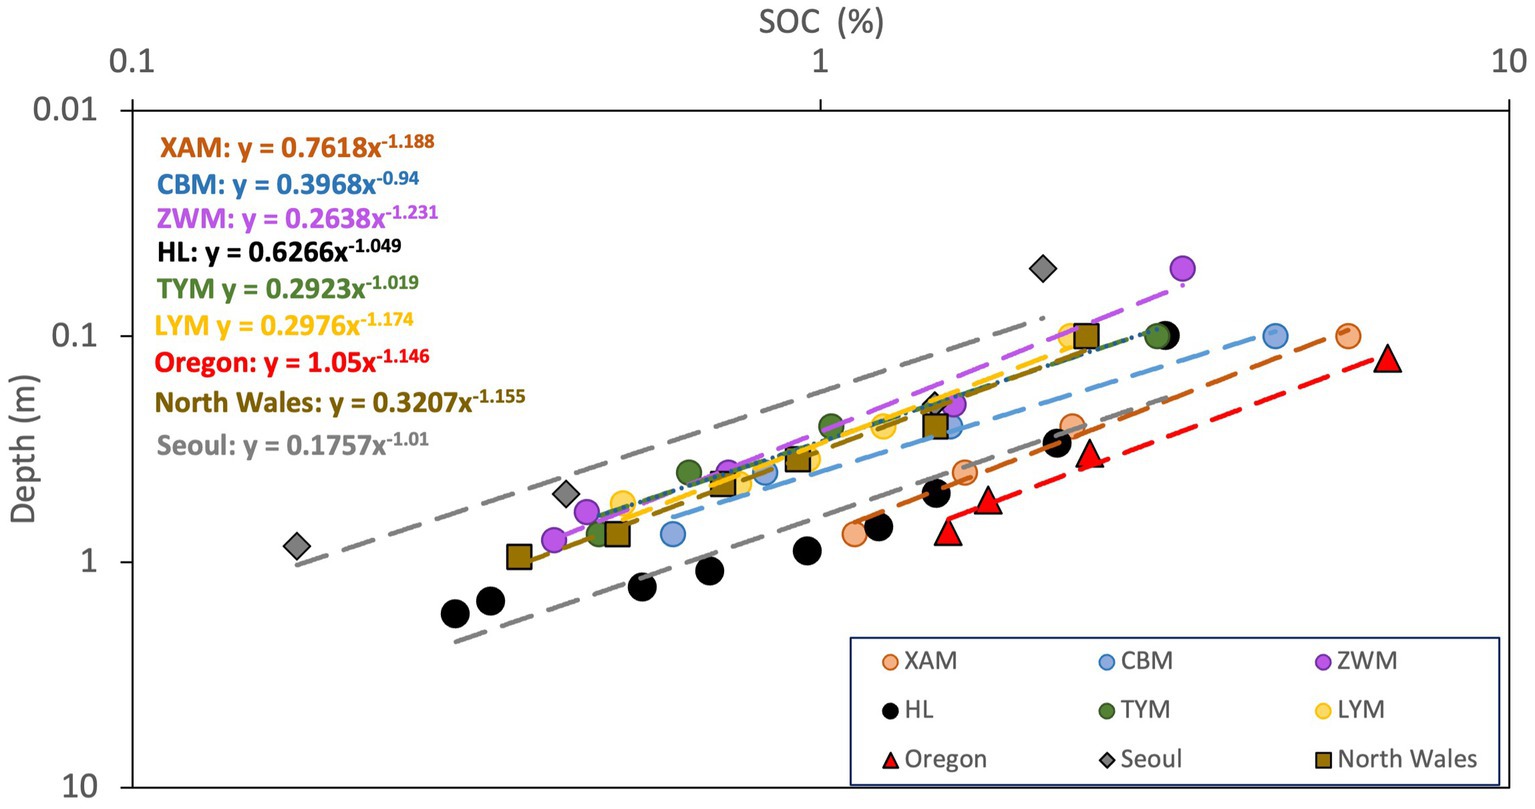
Figure 1. Plot-scale analysis on the vertical distribution of SOC in Xiaoxing’an Mountain (XAM, Wei et al., 2013), Changbai Mountain (CBM, Wei et al., 2013), Ziwu Mountain (ZWM, Yang et al., 2010), Hailun (HL, Hao et al., 2015), Luya Mountain (LYM, Wu et al., 2011), Taiyue Mountain (Wang et al., 2013) in north China, Seoul, South Korea (Bae and Ryu, 2015), North Wales, UK (Ahmed et al., 2016) and Oregon, USA (Spycher et al., 1983) on log–log scale. Dash lines and equations represent the fitted power-law.
For evaluation at province level, only SOC depth profiles in typical soil pedons of each province were depicted in Figure 2, while the remaining findings were presented in Table 2. Most of the fitted exponents were close to −1.149, with inceptisols (−0.599) in Heilongjiang Province, and the semi-luvisols (−1.767) in Gansu Province showed large discrepancies compared with the theoretical scaling, which might be caused by the impact from vegetation cover. By examining the vegetation cover, we found that all 3 profiles of the inceptisols in Heilongjiang and 2 out of 3 profiles of the semi-luvisols in Gansu were dominated by grass and trees. Due to the higher relative below-ground biomass of grass compared to trees and the faster decomposition rate of grass roots, the below-ground carbon input from grass roots may be as influential as the carbon derived from the overlying soil layer. Consequently, both the downward movement of SOC from above and the carbon input derived from grass roots can affect the vertical distribution of SOC. Most of the R2 were not as good as results from the plot-scale examination. Due to grouping of data from diverse sites using location and soil pedon as basis, some degree of variability attributed to site-related factors such as climate and vegetation cover could cause scatter at a given soil depth across sites, despite the location was confined within a single province. The analysis in national-scale by fitting the power-law function to the normalized data (all 42 data in China) yielded a power exponent of −1.107 (dash line in Figure 2) compared with −1.149. Although the degree of discrepancy observed at province level is not insignificant, it is important to note that the limited count of soil profiles sampled may not be adequate to effectively mitigate the influence of scatter resulting from site variance.
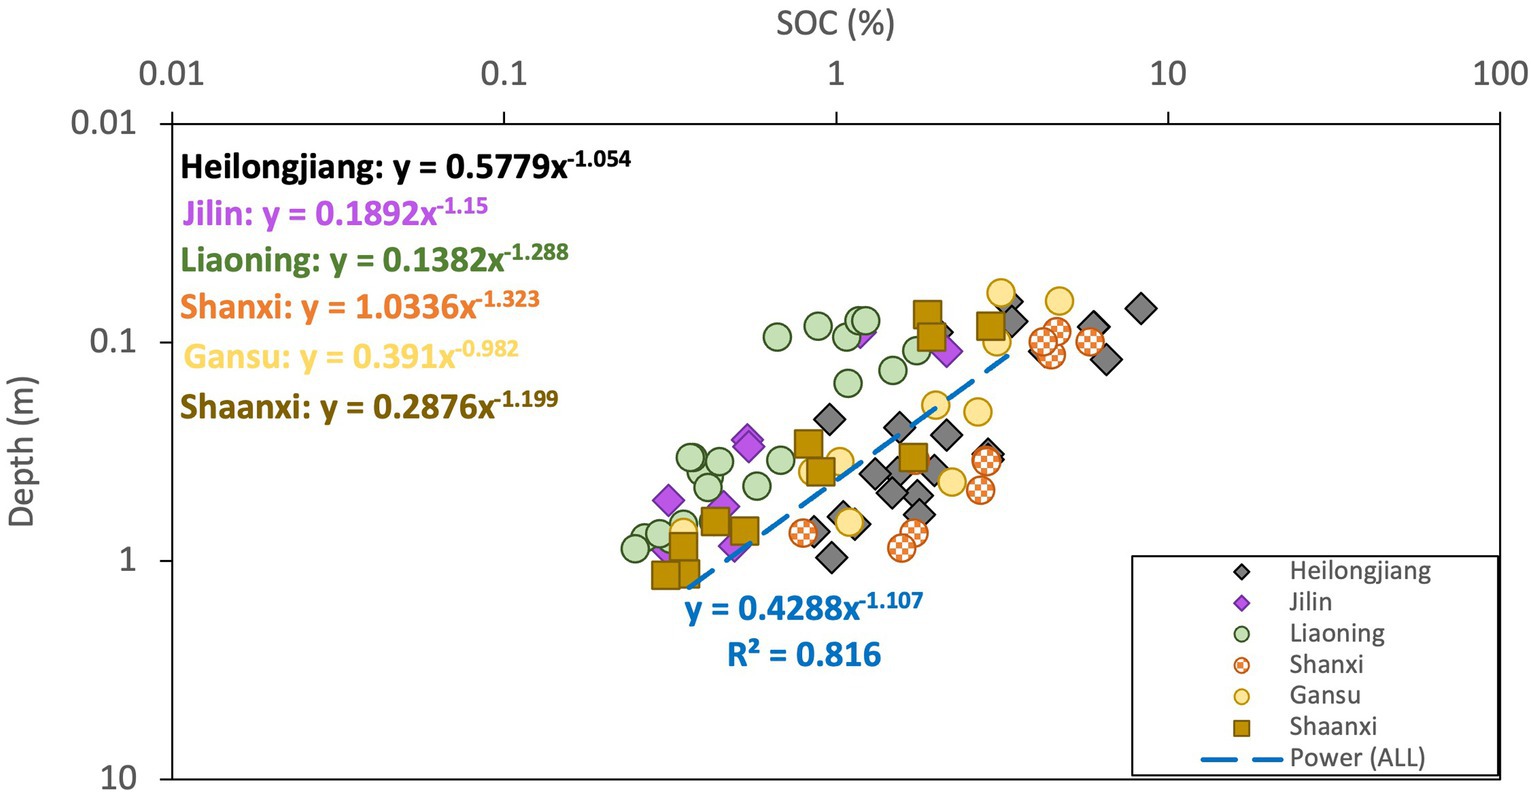
Figure 2. Vertical distribution of SOC on province level in cool temperate zone in China. Dash line “Power (ALL)” represents the fitted power-law to all data aggregated as a whole dataset (data normalization was applied before fitting the data with power-law).
Figure 3 presents the examination in national and global scales. The national level analysis was conducted on the results of 265 soil profiles from 53 national forests in France, the normalized data of 71 soil profiles from NCSS of the United States, and 42 soil profiles from SNSS, China. The summarized result of SOC profiles covering all types of forests from SNSS of China published by Wang et al. (2004) were also depicted in the figure for comparison. At the global scale, the summarized results of SOC in temperate deciduous forest, temperate evergreen forest and global forest based on the 3 global datasets from Jobbágy and Jackson (2000) were adopted for evaluation. The discrepancies were less than 6.4% between the resulted exponents (Table 2) and the theoretical value of −1.149. Here, the slight difference between the extracted exponents from our data analysis (−1.107) and from Wang et al. (2004) (−1.105) based on data from the same source of SNSS could be caused by the difference in the coverage of data for analysis and the normalization methods when converting SOC data from pedogenetic horizons to depth increments. Wang et al. (2004) covered all types of forests in China including boreal forests, temperate forests, subtropical and tropical forests, while SOC data was confined within the cool temperate zone in this study.
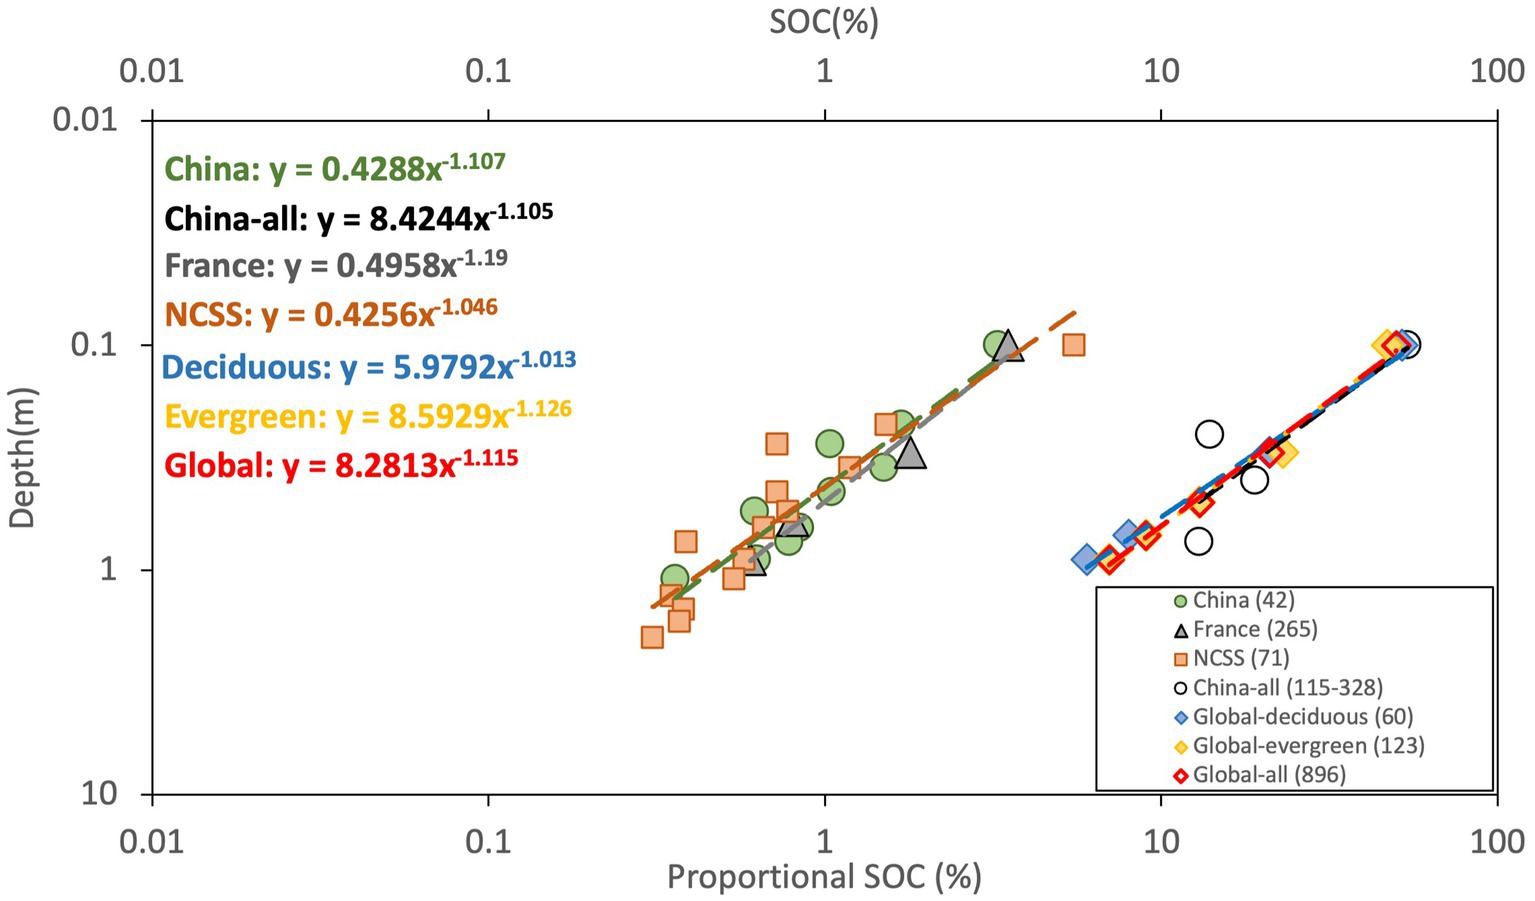
Figure 3. Vertical distribution of SOC in national and global scales. “China” and “NCSS” are the normalized data within cool temperate zone in China and the USA, “China-all” is the summarized results from Wang et al. (2004) of all types of forest in China, “global-deciduous,” “global evergreen” and “global-all” are global results from Jobbágy and Jackson (2000) of temperate deciduous, temperate evergreen forests and all types of forest. The last four datasets were graphed on the second axis because the unit of SOC were in proportional percentage that was calculated as the ratio of SOC in each depth increment to the total SOC in the first meter. Number in the parentheses indicates the quantity of soil profiles covered in each dataset.
Prediction of the vertical distribution of SOC in the cool temperate region in China and the United States using Equation (4) from percolation theory is presented in Figures 4A,B. With the exception of 7 data points, the majority of field data from northeastern China fell within the predicted range of SOC, as depicted by the upper (dashed line in Figure 4A) and lower (dotted line in Figure 4A) bound estimates. It is important to note that the 7 data points exhibited higher SOC levels in comparison to other soils at the same depth. Consequently, this resulted in significant disparities between the normalized outcome and the optimal prediction (solid line in Figure 4A) based on the mean value of SOCmean = 54.7 Mg/ha. The NCSS data were well-bounded by the predicted SOC range, with the exception of one data point that slightly deviates from prediction. The best prediction was close to but lower than the normalized result of NCSS. Overall, the predicted range of SOC confined the field data well, with some discrepancies between the best prediction and normalized data, while both the estimations of Cs and hs in Equation (4), and the normalization method can affect the precision of the prediction. Thus, the outcomes demonstrated in Figure 4 exhibit promising potential for utilizing the proposed method to predict the vertical distribution of SOC if more information of soil properties in a particular site is available.
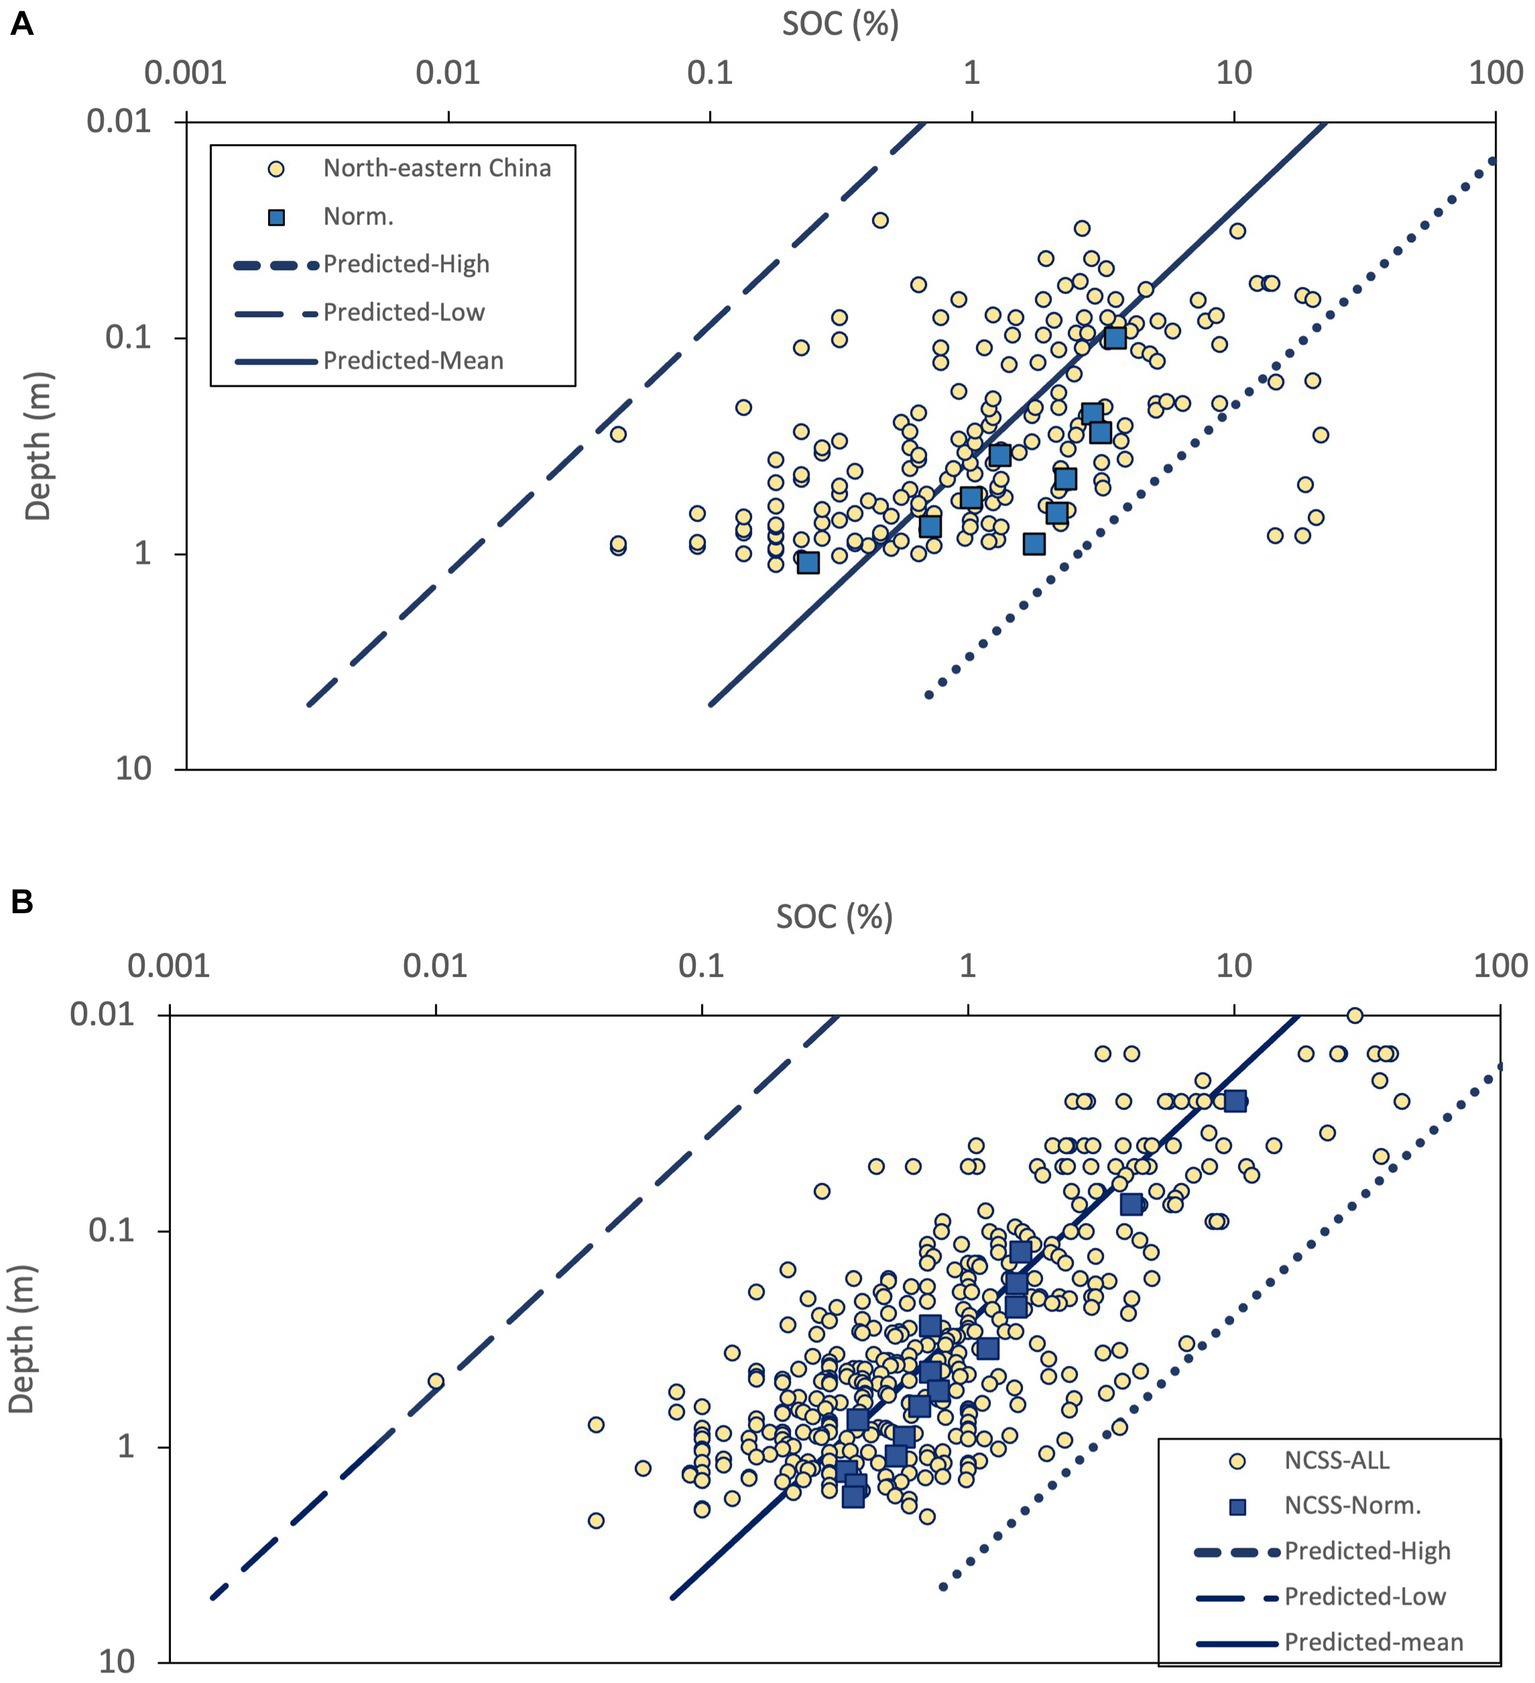
Figure 4. Comparison between prediction and observed data in panel (A) northeastern China, (B) NCSS, USA. Norm. represent the data after normalization.
4. Discussion
Examination on fitting the SOC depth profile using power-law function at different spatial scales resulted high values of regression coefficients, suggesting that a simple power-law model is adequate to represent the depth profile of SOC in temperate forest soils, which are consistent with previous studies by others (e.g., Yang et al., 2010; Robinson and Benke, 2023). The extracted exponents were close to the theoretical scaling power of −1.149 predicted from percolation theory in most cases. There was apparent variation of SOC at equivalent soil depth across sites caused by the spatial variability of SOC, but the vertical scaling remained unaffected. Moreover, the analysis conducted at different scales suggested that the greater the number of soil profiles and the larger the spatial scale considered in the study, the greater the agreement between the results obtained and the predicted scaling. Therefore, percolation theory can be applied to describe the vertical distribution of SOC in temperate forest soils at different scales. However, it is essential to note that we only utilized a single data point in the top 20 cm of soil to reduce the potential influence of roots distribution on the vertical distribution of SOC. Therefore, further research is required to investigate the impact of roots on the applicability of percolation theory in topsoil. Additionally, the favorable results obtained from the application of percolation theory further reinforce the hypothesis that the vertical pattern of SOC in the subsurface layer of forest soils is primarily controlled by the vertical transport of solute in soil.
The quantity and distribution of SOC can be influenced by other factors such as climate, vegetation, and soil texture. On global scale, the total amount of SOC in the first meter of soil exhibits significant correlation with climate and clay content, indicating that these factors have a significant impact on SOC levels. However, their impact on the vertical distribution of SOC is limited and may be eclipsed by the influence from plant allocation (Jobbágy and Jackson, 2000). The vertical pattern of SOC showed a strong correlation with different vegetation types, as the allocation of above and below-ground biomass and the vertical extent of root profile can create distinct imprints on the SOC distribution (Jobbágy and Jackson, 2000). In situations where there is a high below-ground biomass or deep root profiles, the additional carbon contributed by the roots becomes an important source of SOC in the subsurface layer. This has a significant impact on the distribution and redistribution of SOC. Although a slight correlation was observed between climate and the relative distribution of SOC with depth, it was suggested that it might be the vegetation type that directly determines the relative distribution of SOC along precipitation gradient (Jobbágy and Jackson, 2000). Therefore, among climate, vegetation and soil texture, vegetation type appears to be the most influential factor to the vertical distribution of SOC. This is because vegetation type can alter the primary controlling factors of SOC distribution and redistribution and limit the application of percolation theory within temperate forests. For example, carbon input from the decomposition of root might reshape the vertical scaling of SOC in grasslands and shrublands where the relative below-ground biomass are higher than that in the forests. Such effect can be more pronounced in shrublands having deeper root system than grasslands. Although forests have deeper roots than grasses, the higher allocation above ground in temperate forests leads to shallower carbon profiles than temperate grasslands do (Jobbágy and Jackson, 2000), indicating a less imprint on SOC distribution from roots in temperate forests. Such impact can be reflected on the scaling of SOC depth profile. When utilizing power-law fitting to analyze SOC depth profiles, the degree of deviation of the extracted exponent from the theoretical scaling will correspond with the strength of the root system’s influence. Figure 2 in Jobbágy and Jackson (2000) summarized the global averaged vertical pattern of SOC in grasslands, shrublands and forests, and the extracted exponents were −1.347 in grasslands, −2.127 in shrublands, and −1.105 in forests (Table 2).
The vertical patterns of SOC in other types of forest also exhibited dissimilarities compared with those observed in temperate forest. As shown in Table 2, the resulted exponents in global boreal forest, tropical deciduous forest and tropical evergreen forest based on summarized results from Jobbágy and Jackson (2000) were −0.995, −2.127 and −1.337. Similar results were observed in a study depicting SOC distributions in subtropical and tropical forests of China based on the same data source from SNSS (Li and Zhao, 2001). The higher degree of disturbance to hydrological processes in boreal and tropical forests, such as soil frost and intensive rainfall, could be the main cause of this phenomenon. However, when all forest types are considered as a collective, the vertical distribution of SOC exhibits a scaling pattern that is consistent with the theoretical prediction, as shown (Figure 3) in the analysis based on data covering all types forest of China from Wang et al. (2004) and the summarized results of global forest from Jobbágy and Jackson (2000).
For evaluation of Equation (4), certain disparities were identified between the predicted values and field data in northeastern China. It is noteworthy that the data points that are out of the predicted range displayed notably higher SOC levels when compared to other soils at the corresponding depth. It is crucial to acknowledge that the dataset encompasses some soil samples collected from the northernmost region of China, characterized by the prevalence of boreal forests. Hence, it is plausible to suggest that these data points may correspond to soils associated with boreal forests. Overall, the agreement between the predicted range and the empirical data from northeastern China and NCSS in the United States in Figure 4 with estimated parameters demonstrated the pronounced potential to apply percolation theory to predicted SOC depth profile and it may contribute as an input to other comprehensive SOC models to estimate SOC storage in temperate forest soils.
5. Conclusion
The hypothesis that the vertical pattern of SOC in the subsurface layer of temperate forest soils is primarily controlled by the vertical transport of solute which can be described by percolation theory was supported by the agreement between the observed vertical distribution of SOC and the theoretical scaling. However, a comprehensive exploration of how root distribution affects the accuracy of applying percolation theory may still be necessary and requires further investigation. Moreover, vegetation cover and disturbance of hydrological processes can limit the application of percolation theory by altering the controlling factor of carbon source to the subsurface layer of soil or by affecting the vertical transport of solute. Overall, the predicted scaling of percolation theory and the predicted range of SOC depth profiles with estimated site parameters agreed well with field data. Therefore, percolation theory presented a promising method to describe the vertical distribution of SOC in temperate forests, and it showed significant potential for integration into comprehensive models to advance research in carbon cycle dynamics.
Data availability statement
Publicly available datasets were analyzed in this study. This data can be found here: National Cooperative Soil Survey of the United States: https://ncsslabdatamart.sc.egov.usda.gov/; Soil Science Database of China http://vdb3.soil.csdb.cn.
Author contributions
FY contributed to conception and design of the study. FY and QL wrote the first draft of the manuscript. CF and FY performed the statistical analysis. SL organized the database. All authors contributed to manuscript revision, read, and approved the submitted version.
Funding
The authors acknowledge the support of the National Natural Science Foundation of China for Young Scholars (32101498), the National Key Technology Research and Development Program of the Ministry of Science and Technology of China (2021FY100802-04), and Technology Development Program of Jilin Province (20230101250JC).
Conflict of interest
The authors declare that the research was conducted in the absence of any commercial or financial relationships that could be construed as a potential conflict of interest.
Publisher’s note
All claims expressed in this article are solely those of the authors and do not necessarily represent those of their affiliated organizations, or those of the publisher, the editors and the reviewers. Any product that may be evaluated in this article, or claim that may be made by its manufacturer, is not guaranteed or endorsed by the publisher.
References
Ahmed, I. U., Smith, A. R., Jones, D. L., and Godbold, D. L. (2016). Tree species identity influences the vertical distribution of labile and recalcitrant carbon in a temperate deciduous forest soil. For. Ecol. Manag. 359, 352–360. doi: 10.1016/j.foreco.2015.07.018
Bae, J., and Ryu, Y. (2015). Land use and land cover changes explain spatial and temporal variations of the soil organic carbon stocks in a constructed urban park. Landsc. Urban Plan. 136, 57–67. doi: 10.1016/j.landurbplan.2014.11.015
Baisden, W. T., and Parfitt, R. L. (2007). Bomb 14C enrichment indicates decadal C pool in deep soil? Biogeochemistry 85, 59–68. doi: 10.1007/s10533-007-9101-7
Cushman, J. H., and O’Malley, D. (2015). Fickian dispersion is anomalous. J. Hydrol. 531, 161–167. doi: 10.1016/j.jhydrol.2015.06.036
Domke, G. M., Perry, C. H., Walters, B. F., Nave, L. E., Woodall, C. W., and Swanston, C. W. (2017). Toward inventory-based estimates of soil organic carbon in forests of the United States. Ecol. Appl. 27, 1223–1235. doi: 10.1002/eap.1516
Egli, M., Dahms, D., and Norton, K. (2014). Soil formation rates on silicate parent material in alpine environments: different approaches–different results? Geoderma 213, 320–333. doi: 10.1016/j.geoderma.2013.08.016
FAO (2016). Global forest resources assessment 2015: how are the world’s forests changing? 2nd. Rome: Food and Agriculture Organization of the United Nations.
Fröberg, M., Hanson, P. J., Trumbore, S. E., Swanston, C. W., and Todd, D. E. (2009). Flux of carbon from 14C-enriched leaf litter throughout a forest soil mesocosm. Geoderma 149, 181–188. doi: 10.1016/j.geoderma.2008.11.029
Fröberg, M., Jardine, P. M., Hanson, P. J., Swanston, C. W., Todd, D. E., Tarver, J. R., et al. (2007). Low dissolved organic carbon input from fresh litter to deep mineral soils. Soil Sci. Soc. Am. J. 71, 347–354. doi: 10.2136/sssaj2006.0188
Gill, R. A., and Jackson, R. B. (2000). Global patterns of root turnover for terrestrial ecosystems: RESEARCH root turnover in terrestrial ecosystems. New Phytol. 147, 13–31. doi: 10.1046/j.1469-8137.2000.00681.x
Gunnell, Y. (2003). Radiometric ages of laterites and constraints on long-term denudation rates in West Africa. Geology 31:131. doi: 10.1130/0091-7613(2003)031<0131:RAOLAC>2.0.CO;2
Hao, X., Han, X., Li, L., Zou, W., Lu, X., and Qiao, Y. (2015). Profile distribution and storage of soil organic carbon in a black soil as affected by land use types. Chin. J. Appl. Ecol. 26, 965–972.
Hiederer, R. (2009). Distribution of organic carbon in soil profile data. EUR 23980 EN. Luxembourg: Office for Official Publications of the European Communities.
Hobley, E., Wilson, B., Wilkie, A., Gray, J., and Koen, T. (2015). Drivers of soil organic carbon storage and vertical distribution in Eastern Australia. Plant Soil 390, 111–127. doi: 10.1007/s11104-015-2380-1
Hunt, A. (2017). Spatiotemporal scaling of vegetation growth and soil formation: explicit predictions. Vadose Zone J. 16, 1–12. doi: 10.2136/vzj2016.06.0055
Hunt, A. G. (2015). Predicting rates of weathering rind formation. Vadose Zone Journal. 14, 1–13. doi: 10.2136/vzj2014.09.0123
Hunt, A. G., and Ghanbarian, B. (2016). Percolation theory for solute transport in porous media: geochemistry, geomorphology, and carbon cycling. Water Resource Res. 52, 7444–7459. doi: 10.1002/2016WR019289
Hunt, A. G., and Skinner, T. E. (2008). Longitudinal dispersion of solutes in porous media solely by advection. Philos. Mag. 88, 2921–2944. doi: 10.1080/14786430802395137
IPCC (2007). Contribution climate change 2007: the physical science basis. Of working groups I, the fourth assessment report of IPCC. Cambridge: Cambridge University Press.
Jenny, H. (1941). Factors of soil formation: a system of quantitative Pedology. New York: McGraw-Hill Book Company Inc.
Jobbágy, E. G., and Jackson, R. B. (2000). The vertical distribution of soil organic carbon and its relation to climate and vegetation. Ecol. Appl. 10, 423–436. doi: 10.1890/1051-0761(2000)010[0423:TVDOSO]2.0.CO;2
Joslin, J. D., Gaudinski, J. B., Torn, M. S., Riley, W. J., and Hanson, P. J. (2006). Fine-root turnover patterns and their relationship to root diameter and soil depth in a 14 C-labeled hardwood forest. New Phytol. 172, 523–535. doi: 10.1111/j.1469-8137.2006.01847.x
Kramer, C., Trumbore, S., Fröberg, M., Cisneros Dozal, L. M., Zhang, D., Xu, X., et al. (2010). Recent (<4 year old) leaf litter is not a major source of microbial carbon in a temperate forest mineral soil. Soil Biol. Biochem. 42, 1028–1037. doi: 10.1016/j.soilbio.2010.02.021
Lee, Y., Andrade, J. S., Buldyrev, S. V., Dokholyan, N. V., Havlin, S., King, P. R., et al. (1999). Traveling time and traveling length in critical percolation clusters. Phys. Rev. E 60, 3425–3428. doi: 10.1103/PhysRevE.60.3425
Leifeld, J., and KoÈgel-Knabner, I. (2001). Organic carbon and nitrogen in ®ne soil fractions after treatment with hydrogen peroxide. Soil Biol. 33, 2155–2158. doi: 10.1016/S0038-0717(01)00127-4
Li, Z., and Zhao, Q. (2001). Organic carbon content and distribution in soils under different land uses in tropical and subtropical China. Plant Soil 231, 175–185. doi: 10.1023/A:1010350020951
Liu, Y., Li, S., Sun, X., and Yu, X. (2016). Variations of forest soil organic carbon and its influencing factors in East China. Ann. For. Sci. 73, 501–511. doi: 10.1007/s13595-016-0543-8
Liu, S., Wei, Y., Post, W. M., Cook, R. B., Schaefer, K., and Thornton, M. M. (2013). The unified North American soil map and its implication on the soil organic carbon stock in North America. Biogeosciences 10, 2915–2930. doi: 10.5194/bg-10-2915-2013
National Cooperative Soil Survey (2023). Soil characterization data. Available at: https://ncsslabdatamart.sc.egov.usda.gov/advquery.aspx.
Neff, J. C., and Asner, G. P. (2001). Dissolved organic carbon in terrestrial ecosystems: synthesis and a model. Ecosystems 4, 29–48. doi: 10.1007/s100210000058
Ota, M., Nagai, H., and Koarashi, J. (2013). Root and dissolved organic carbon controls on subsurface soil carbon dynamics: a model approach: CONTROLS ON SUBSURFACE CARBON DYNAMICS. J. Geophys. Res. Biogeosci. 118, 1646–1659. doi: 10.1002/2013JG002379
Ottoy, S., Elsen, A., Van De Vreken, P., Gobin, A., Merckx, R., Hermy, M., et al. (2016). An exponential change decline function to estimate soil organic carbon stocks and their changes from topsoil measurements. Eur. J. Soil Sci. 67, 816–826. doi: 10.1111/ejss.12394
Pan, Y., Birdsey, R. A., Fang, J., Houghton, R., Kauppi, P. E., Kurz, W. A., et al. (2011). A large and persistent carbon sink in the world’s forests. Science 333, 988–993. doi: 10.1126/science.1201609
Qi, Y., Wei, W., Chen, C., and Chen, L. (2019). Plant root-shoot biomass allocation over diverse biomes: a global synthesis. Global Ecol. Conserv. 18:e00606. doi: 10.1016/j.gecco.2019.e00606
Rasmussen, C., Torn, M. S., and Southard, R. J. (2005). Mineral assemblage and aggregates control carbon dynamics in a California conifer forest. Soil Sci. Soc. Am. J. 69, 1711–1721. doi: 10.2136/sssaj2005.0040
Robinson, N., and Benke, K. (2023). Analysis of uncertainty in the depth profile of soil organic carbon. Environments 10:29. doi: 10.3390/environments10020029
Rumpel, C., and Kögel-Knabner, I. (2011). Deep soil organic matter—a key but poorly understood component of terrestrial C cycle. Plant Soil 338, 143–158. doi: 10.1007/s11104-010-0391-5
Schlesinger, W. H. (1977). Carbon balance in terrestrial detritus. Annu. Rev. Ecol. Syst. 8, 51–81. doi: 10.1146/annurev.es.08.110177.000411
Sheppard, A. P., Knackstedt, M. A., Pinczewski, W. V., and Sahimi, M. (1999). Invasion percolation: new algorithms and universality classes. J. Phys. A Math. Gen. 32, L521–L529. doi: 10.1088/0305-4470/32/49/101
Soucémarianadin, L. N., Cécillon, L., Guenet, B., Chenu, C., Baudin, F., Nicolas, M., et al. (2018). Environmental factors controlling soil organic carbon stability in French forest soils. Plant Soil 426, 267–286. doi: 10.1007/s11104-018-3613-x
Spycher, G., Sollines, P., and Rose, S. (1983). Carbon and nitrogen in the light fraction of a Forest soil: vertical distribution and seasonal patterns. Soil Sci. 135, 79–87. doi: 10.1097/00010694-198302000-00002
Tate, K. R., Lambie, S. M., Ross, D. J., and Dando, J. (2011). Carbon transfer from 14C-labelled needles to mineral soil, and 14C-CO2 production, in a young Pinus radiata Don stand. Eur. J. Soil Sci. 62, 127–133. doi: 10.1111/j.1365-2389.2010.01316.x
Trumbore, S., Da Costa, E. S., Nepstad, D. C., Barbosa De Camargo, P., Martinelli, L. A., Ray, D., et al. (2006). Dynamics of fine root carbon in Amazonian tropical ecosystems and the contribution of roots to soil respiration: AMAZON FINE ROOT CARBON DYNAMICS. Glob. Chang. Biol. 12, 217–229. doi: 10.1111/j.1365-2486.2005.001063.x
Vrugt, J. A., Van Wijk, M. T., Hopmans, J. W., and Šimunek, J. (2001). One-, two-, and three-dimensional root water uptake functions for transient modeling. Water Resour. Res. 37, 2457–2470. doi: 10.1029/2000WR000027
Wang, D., Geng, Z., She, D., He, W., and Hou, L. (2015). Soil organic carbon storage and vertical distribution of carbon and nitrogen across different forest types in the Qinling Mountains. Acta Ecol. Sin. 35, 5421–5329. doi: 10.5846/stxb201311032655
Wang, S., Huang, M., Shao, X., Mickler, R. A., Li, K., and Ji, J. (2004). Vertical distribution of soil organic carbon in China. Environ. Manag. 33, S200–S209. doi: 10.1007/s00267-003-9130-5
Wang, W., Wang, B., Lv, Z., Ren, B., Wang, N., Nie, S., et al. (2013). Study on the soil carbon stocks in different forest stands in Taiyue Mountains in Shanxi Province. J. Arid Land Resour. Environ. 27, 81–85.
Wei, Y., Yu, D., Wang, Q., Zhou, L., Zhou, W., Fang, X., et al. (2013). Soil organic density and its influencing factors of major forest types in the forest region of Northeast China. Chin. J. Appl. Ecol. 24, 3333–3340. doi: 10.13287/j.1001-9332.2013.0563
White, A. F., and Brantley, S. L. (2003). The effect of time on the weathering of silicate minerals: why do weathering rates differ in the laboratory and field? Chem. Geol. 202, 479–506. doi: 10.1016/j.chemgeo.2003.03.001
Wu, X., Guo, J., Yang, X., and Tian, X. (2011). Soil organic carbon storage and profiles inventory in the different vegetation types of Luya Mountain. Acta Ecol. Sin. 31, 3009–3019.
Yang, X., Cheng, J., Meng, L., and Han, J. (2010). Features of soil organic carbon storage and vertical distribution in different forests. Chinese Agric. Sci. Bull. 26, 132–135.
Yu, F., Faybishenko, B., Hunt, A., and Ghanbarian, B. (2017). A simple model of the variability of soil depths. Water 9:460. doi: 10.3390/w9070460
Yu, F., and Hunt, A. G. (2017). An examination of the steady-STATE assumption in soil development models with application to landscape evolution: STEADY-STATE IN SOIL DEVELOPMENT. Earth Surf. Process. Landforms 42, 2599–2610. doi: 10.1002/esp.4209
Keywords: soil organic carbon, vertical distribution, percolation theory, temperate forest, solute transport
Citation: Yu F, Liu Q, Fan C and Li S (2023) Modeling the vertical distribution of soil organic carbon in temperate forest soils on the basis of solute transport. Front. For. Glob. Change. 6:1228145. doi: 10.3389/ffgc.2023.1228145
Edited by:
Ling Zhang, Jiangxi Agricultural University, ChinaReviewed by:
Pingping Zhang, Institute of Earth Environment, ChinaTerefe Hanchiso Sodango, Wolkite University, Ethiopia
Copyright © 2023 Yu, Liu, Fan and Li. This is an open-access article distributed under the terms of the Creative Commons Attribution License (CC BY). The use, distribution or reproduction in other forums is permitted, provided the original author(s) and the copyright owner(s) are credited and that the original publication in this journal is cited, in accordance with accepted academic practice. No use, distribution or reproduction is permitted which does not comply with these terms.
*Correspondence: Chunnan Fan, Q2h1bm5hbkZhbkBvdXRsb29rLmNvbQ==