 Chenqin Lian
 Chiwei Xiao
 Zhiming Feng1,3*
 Qin Ma
- 1Institute of Geographic Sciences and Natural Resources Research, Chinese Academy of Sciences, Beijing, China
- 2Key Laboratory of Natural Disaster Monitoring, Early Warning and Assessment of Jiangxi Province (Jiangxi Normal University), Nanchang, China
- 3College of Resources and Environment, University of Chinese Academy of Sciences, Beijing, China
- 4Department of Forestry, Mississippi State University, Starkville, MS, United States
- 5School of Geography, Nanjing Normal University, Nanjing, China
Global wildfires have increased in frequency and intensity, especially in temperate regions, in the context of global warming. However, the spatiotemporal characteristics of wildfire frequency and intensity are still not well understood. Using Moderate Resolution Imaging Spectroradiometer (MODIS) Collection 6 (C6) wildfire products during 2003–2022, here, we analyzed the spatiotemporal patterns and evolutionary characteristics of the frequency and intensity of wildfires in China. The main conclusions are: (1) Over the past 20 years, the wildfire frequency and fire radiative power (FRP) have declined at rates of –1920/year (p < 0.001) and –76492 MW/year (p < 0.001), respectively, showing a highly significant downward trend, with declines of up to 63 and 81%. (2) Wildfires in China show a single peak pattern of high incidence in winter and spring, with the most frequent in March, followed by February and April. (3) The overall spatial distribution of wildfires in China is characterized by a bimodal distribution, with more in the south and less in the north. Wildfires are most abundant but less intense in the southern region(SR), fewer but most intense in the northeastern region(NER), and significantly influenced by El Niño in the southwestern region(SWR), with significant regional differences in wildfires in China. (4) The average FRP of wildfire spots presented a decreasing trend from 47 MW/spot in 2003 to only 25 MW/spot in 2022. This may be due to more dispersed wildfires, rather than concentrated wildfires. (5) The frequency and FRP of wildfires showed an overall negative correlation with the Standardized Precipitation Evapotranspiration Index (SPEI). Drought events (negative SPEI) have a significant effect on wildfires, especially in SR. This study demonstrates the effectiveness of current fire suppression policies in China in terms of disaster prevention and mitigation, and further provides data to further explore and analyze the impact of wildfires on the regional environment.
1 Introduction
Wildfires are an important component of the Earth system (Abatzoglou et al., 2018). They have important impacts on climate change (Turetsky et al., 2014; Jolly et al., 2015; van der Werf et al., 2017a), atmospheric environment (Huang et al., 2021; Xiao et al., 2022), biodiversity (Bowman et al., 2009), public health (Lelieveld et al., 2015), and the safety of human life and property (Bowman et al., 2009), and are also profoundly influenced by human activities and climate change (Zong et al., 2016). In the context of global warming, the frequency and intensity of global wildfires have increased (Fang et al., 2021; Bo Zheng et al., 2023), especially in temperate regions (Yi et al., 2017). For example, wildfires in Australia burned more than 10 million hectares in 2019 (Fang et al., 2021), causing an economic loss of about $110 billion, or 7.9% of the country’s total GDP in 2019 (Tang et al., 2022). In particular, the United Nations Environment Programme’s Frontiers 2022 report (23–40; United Nations Environment Programme, 2022) singled out the wildfires as one of the most prominent emerging environmental issues, with far-reaching social, economic and ecological impacts. Understanding spatial and temporal patterns and evolutionary characteristics of their frequency and intensity by monitoring wildfires at different scales, such as regional and national scales, is of great practical importance for policy formulation in disaster prevention and mitigation, improving the atmospheric environment, and mitigating climate change.
The main part of China is an important and fire-prone transition zone between the tropics and the boreal regions, yet the development of wildfires in monsoon climates is not well understood (Fang et al., 2021). China is one of the most wildfire-prone countries in the world (Guo et al., 2023), and it occurs mainly in the subtropical tropical monsoon climate zone in southwestern and southeastern China (Tian et al., 2013; Qin et al., 2014; Wei et al., 2020). China has the largest subtropical forest in the world (Wang et al., 2013), which combined with the prevalence of Asian summer winds, makes China a typical region for subtropical fire activity in a clarified monsoon climate. Since the 1987 extreme wildfires, China has implemented strict fire prevention and suppression policies, but major wildfire incidents are still frequently reported (Chen et al., 2017; Yi et al., 2017; Fang et al., 2021; Jin et al., 2022; Tian et al., 2022). For example, in 2003, the Heilongjiang forest fire was the second-largest forest fire since the founding of the country after 1987 (Zhang et al., 2012). In retrospect, many scholars have done some research on the wildfires in China. However, most studies have focused on the distribution of fires over shorter periods and at specific regional or interprovincial scales(Wang et al., 2023), and have only considered the frequency of fire data, neglecting fire radiative power (FRP) as an important indicator of fire intensity(Giglio et al., 2006), leaving important spatial and temporal characteristics of wildfires underdetermined.
Satellites with open access to products play an important role in obtaining wildfire information by its many advantages such as wide monitoring range, fast information acquisition, short detection period, low economic cost, and few restrictions. Wildfire products from remote sensing satellites, including burned area products (Flannigan et al., 2009), fire point products (Chuvieco et al., 2008), and various derived wildfire emission products (van der Werf et al., 2017b), show great potential for monitoring wildfire development activities (Schroeder et al., 2014; Yin, 2020). More than 20 years of MODIS Collection 6 (C6) wildfire products (Giglio et al., 2016, 2018), have been widely used to study global wildfire events (Giglio et al., 2003; Hantson et al., 2013), and in fire risk prediction, economic loss assessment (Yaduvanshi et al., 2015), air pollution evaluation (Voulgarakis and Field, 2015; Vadrevu and Lasko, 2018), climate change (Forsythe et al., 2012), carbon emissions (Earl and Simmonds, 2018). MODIS wildfire data products are the newest wildfire products with the longest time scale global coverage to date (Xiao et al., 2022), and offer significant advantages over other satellites in fire research, making them the best choice for current research on long-time series wildfires and related topics.
Here, with MODIS Collection 6 wildfire products (2003–2022), we analyzed the spatial and temporal patterns and evolutionary characteristics of wildfires and their intensity at the provincial, regional, national, and grid (0.25° × 0.25°) levels and at the monthly and annual scales using the frequency of occurrence and FRP indicators. In addition, we also discussed the influence of climate and policy on wildfires. This study will provide data support and a scientific basis for exploring the causes and driving mechanisms of wildfires in China, as well as policy formulation such as wildfire prevention.
2 Datasets and methods
2.1 MODIS active fire datasets
The National Aeronautics and Space Administration (NASA) Fire Information for Resource Management System (FIRMS) provides MODIS Collection 6 (C6) wildfire data. The data have a spatial resolution of 1 km (Davies et al., 2009) and contain a variety of metrics such as fire radiative power (FRP), latitude and longitude, acquisition date, and time. MODIS C6 wildfire products have a history of over 20 years and are well suited for long-time series fire observation studies at the global and national levels (Lian et al., 2023). Since 2003, the wildfire products of Terra and Aqua satellites can be provided to users at the same time. Therefore, we use Terra and Aqua wildfire products during 2003–2022 to explore the frequency and FRP of wildfires in China. In addition, a 0.25° × 0.25° grid was created in this study to analyze the spatial characteristics of wildfires and their differences in China.
2.2 China’s land-use/cover datasets
China’s Land-Use/Cover Datasets (CLCDs) is the first annual land cover product in China derived from 30-m Landsat imagery and includes nine land classes including cropland, forest, shrub, grassland, water, snow/ice, barren, impervious, and wetland (Yang and Huang, 2022). In this study, forest, shrub, and grassland, were selected for extracting wildfire fire points. Among them, forest fire points accounted for the highest percentage, up to over 90%. Meanwhile, this paper adopts the four major forest regions in China as the criteria for the division of regional scope, namely, the southern region (SR), northeastern region (NER), southwestern region (SWR), and northern region (NR; Figure 1).

Figure 1. Land cover types and regional divisions distribution in China.
2.3 Climate data
The Standardized Precipitation Evapotranspiration Index (SPEI) was used to understand the relationship between climate and wildfire. SPEI is an index characterizing wet and dry conditions calculated using multi-indicator data such as precipitation, temperature, and evapotranspiration, and can be calculated for a variety of time scales (1, 3, 12, 24 months, etc.). Larger SPEI values are wetter and smaller values are drier and are widely used in climate-related studies, especially on long time scales (Vicente-Serrano et al., 2010). The global gridded dataset (SPEIbase) used in this study was obtained from the University of East Anglia,1 spanning the period from January 2003 to December 2020, with a drought timescale of 3 months and a spatial resolution of 0.5°. To match our wildfire data, we produced a year-by-year SPEI dataset (0.25° × 0.25°) over the mainland area of China.
2.4 Time series trend analysis
The Theil-Sen slope (TS) is a robust trend analysis method, which was proposed by Theil in 1950 and further refined by Sen in 1968 as a non-parametric method. Since the TS method is calculated mainly based on the median of the data, and it has less impact from data outliers (Vanem and Walker, 2013). The TS method is well suited for time series analysis of large interannual variations. However, the TS method cannot complete the significance test of the trend, so this paper introduces the Mann-Kendall (MK) method to test the significance of the trend of wildfire in time series. The MK method is a nonparametric statistical method that does not require the sample to satisfy a certain distribution. The method for determining the significance of the trend by combining TS and MK for the frequency and FRP of wildfires from 2003 to 2022 is shown in Table 1.
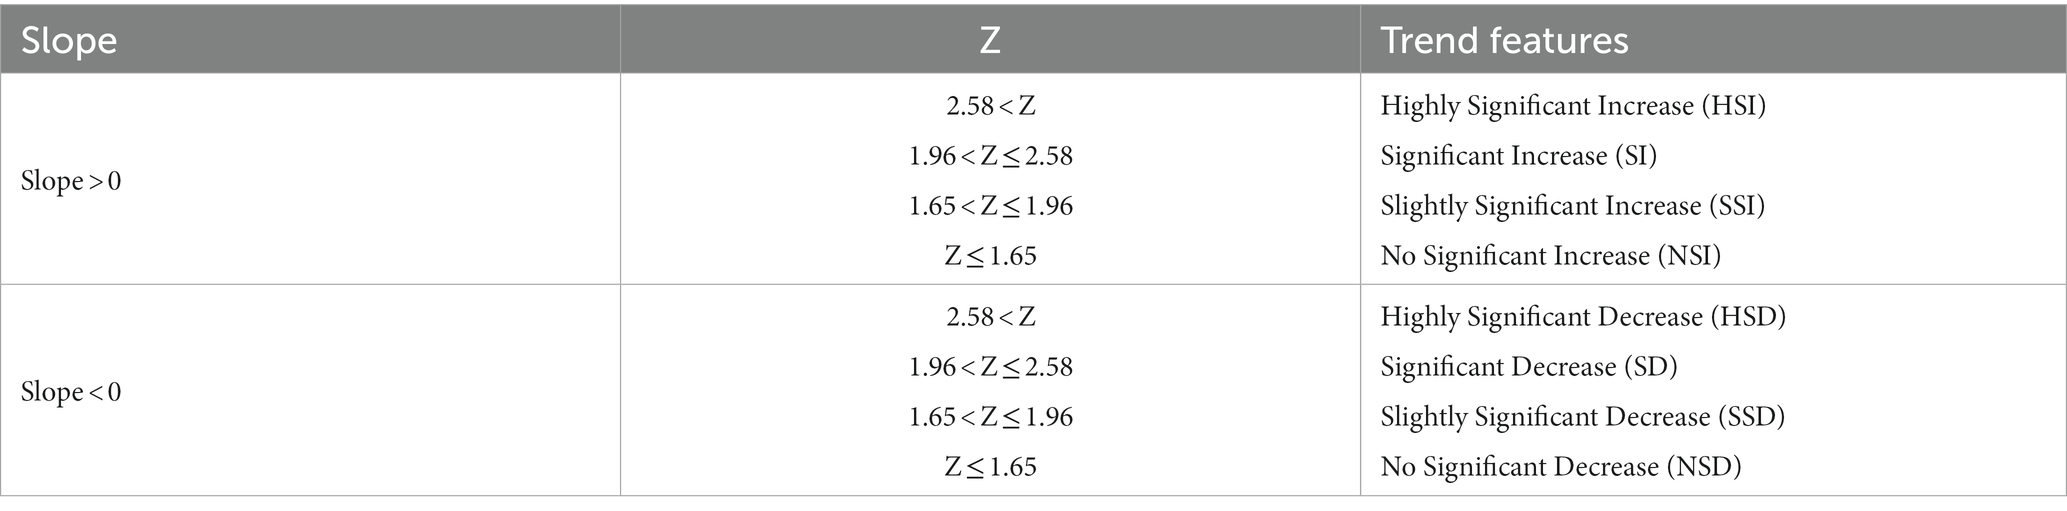
Table 1. Trend categories.
2.5 Kernel density analysis
In this study, we consider the spatial and temporal distribution of wildfires in China in terms of spatial and temporal clustering characteristics and use kernel density analysis to characterize their spatial variation. Kernel density analysis is often used to estimate the unit density of element measurements within a certain neighborhood to visualize their spatial clustering in a continuous area (Tian et al., 2022). In this study, the frequency and FRP of wildfires were analyzed using the kernel density method to reflect the spatial aggregation characteristics and intensity differences. The kernel density is calculated as follows:
Where: is the wildfire kernel density, his the search radius, k is the kernel density function, is the number of wildfire samples, is the estimated distance between the two fire points. In this paper, the 20 years were divided into five subperiods on average, and kernel density analysis was performed for each subperiod as well as for four seasons. Based on the wildfire distribution combined with the natural breakpoint method, the frequency and FRP of wildfires were classified into kernel density class categories as shown in Table 2.
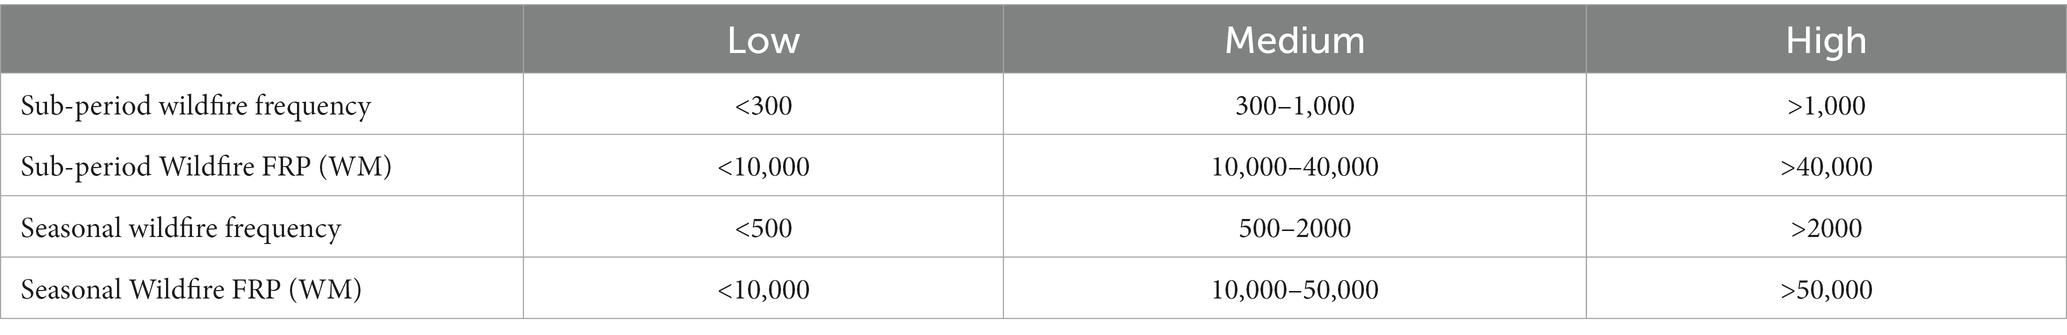
Table 2. Kernel density class categories.
3 Results and discussion
3.1 Wildfires in China have been on the decline for the past 20 years
From 2003 to 2022, the frequency of wildfires in China declined from 51.7 × 10³ to 19.1 × 10³, a decline of more than 63% (Figure 2A). During the same period, its intensity plummets from 241.7 × 10⁴ WM in 2003 to 45.9 × 10⁴ WM in 2022, a decline of 81% (Figure 2B). The peak of wildfire frequency and FRP were 60.7 × 10³ in 2008 and 241.6 × 10⁴ WM in 2003, respectively. Related studies showed that China, especially the southern region, experienced a prolonged and severe cold wave extreme in 2008, which led to a decrease in humidity within the forest and facilitated the occurrence of wildfires (Qin et al., 2014). In 2003, a global El Niño event caused frequent droughts and decreased precipitation, exacerbating the incidence and spread of wildfires(Tansey et al., 2008). Overall, the frequency and intensity of wildfires in China showed a significant downward trend over the past two decades. Our statistics showed that the frequency and FRP of wildfires in China decreased at the rates of −1920/year (p < 0.001) and − 76,492 MW/year (p < 0.001), respectively. Wildfire frequency decreased at the rates of −1,238/year (p < 0.001), −322/year (p < 0.01), and − 179/year (p < 0.01) in SR, SWR, and NER, respectively, and wildfire FRP decreased at the rates of −34,955 MW/year (p < 0.001), −11,810 MW/year (p < 0.01), and −10317 MW/year (p < 0.01), respectively. Correspondingly, wildfire frequency and FRP in NR increased at the rates of 119/year (p < 0.05) and 502 MW/year (p > 0.1), respectively, which need to be noticed and taken into account.
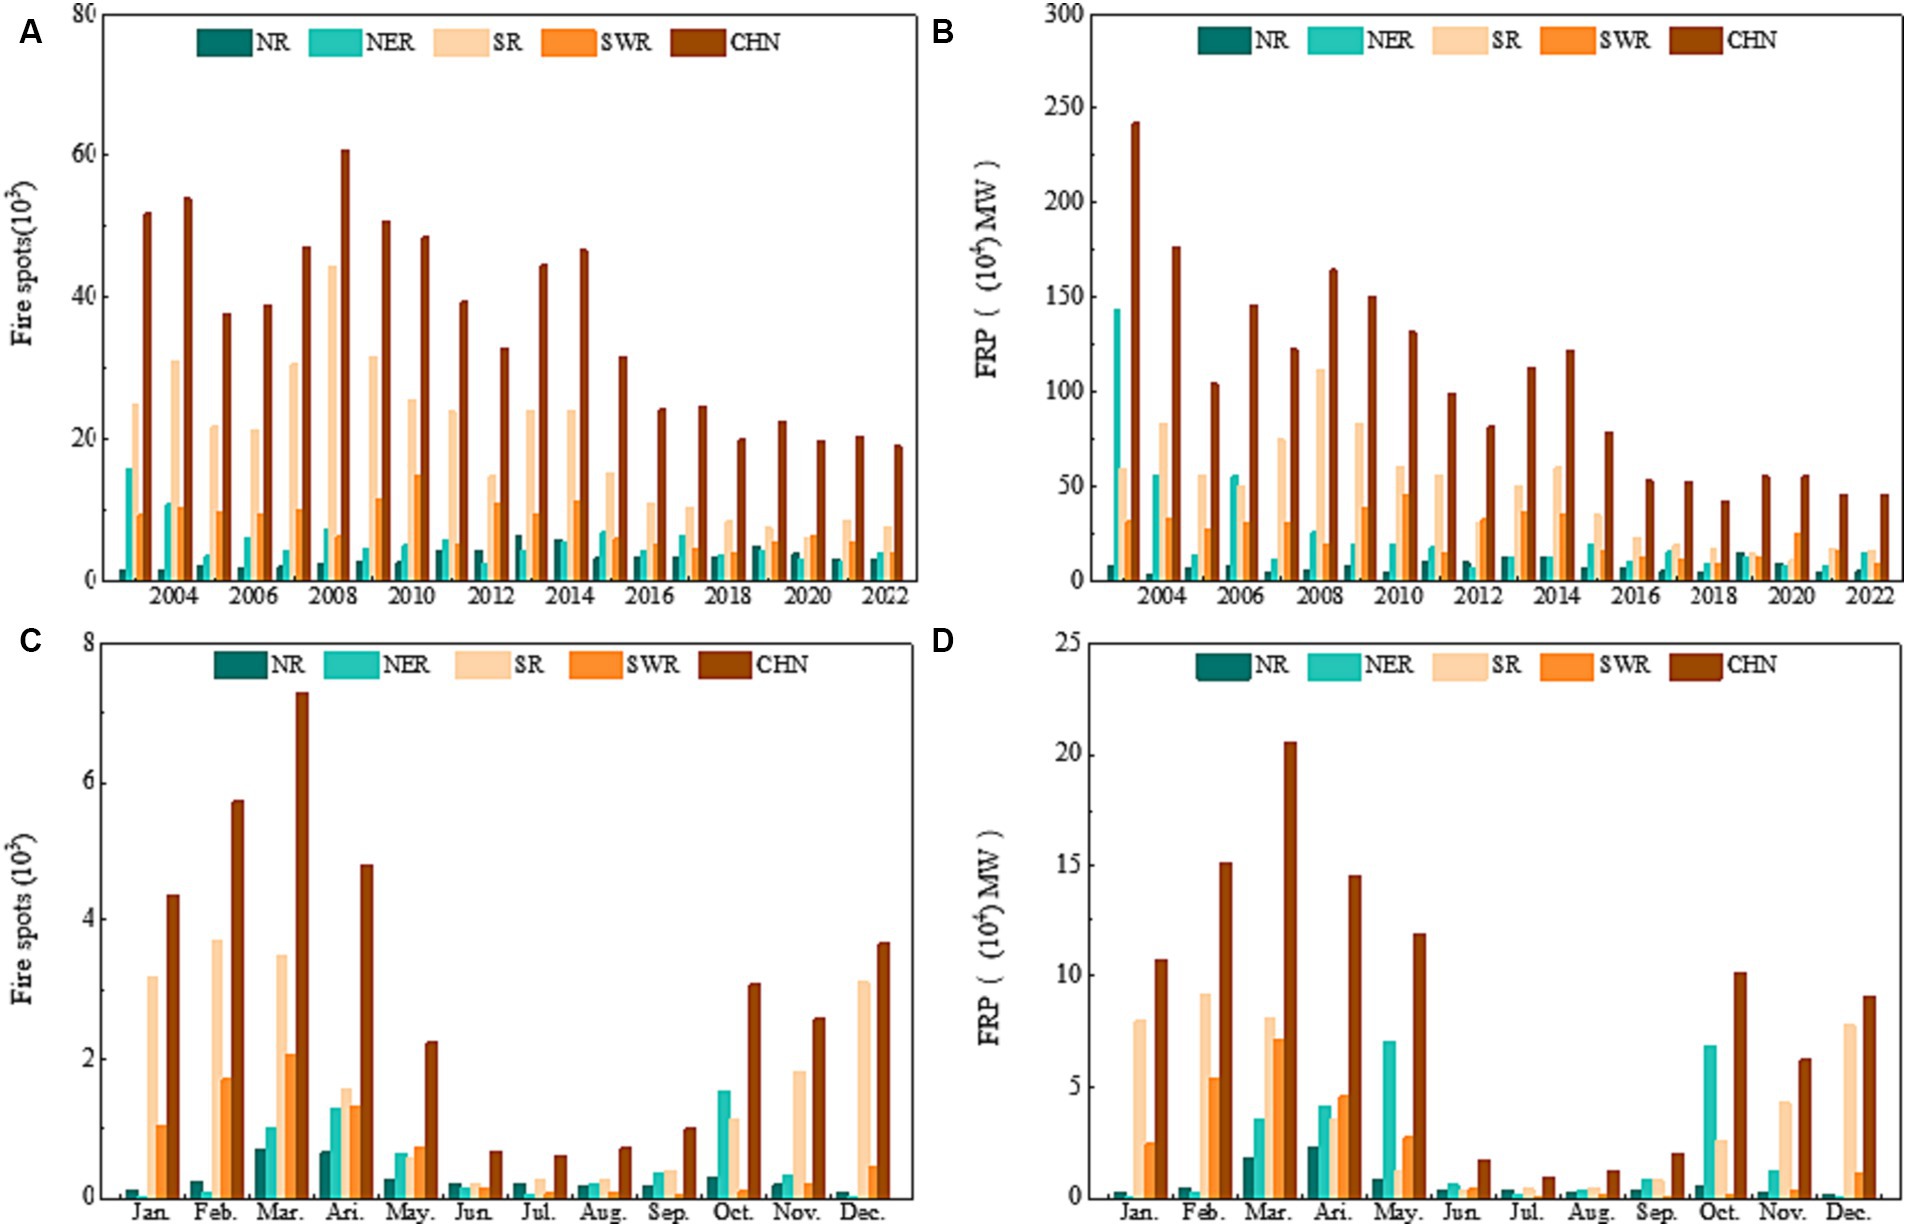
Figure 2. Average number (A,C) of wildfires and their FRP (B,D) during 2003–2022.
The frequency and FRP of wildfires have been decreasing in more than 90% of China since 2003 (Figure 3). Specifically, the areas with a highly significant decrease and a significant decrease in wildfire frequency accounted for 35.8 and 20.4% (Figure 3A); correspondingly, the FRP accounted for 32.5 and 20.2% (Figure 3B). Spatially, the areas with decreasing wildfire frequency and FRP in China were mainly located in southern Yunnan in SWR, most of Guangxi and western and northern Guangdong in SR, and parts of northern Heilongjiang in NER; the areas with increasing trends were sporadically distributed in southern Sichuan and southeastern Yunnan in SWR and eastern Guangxi in SR.
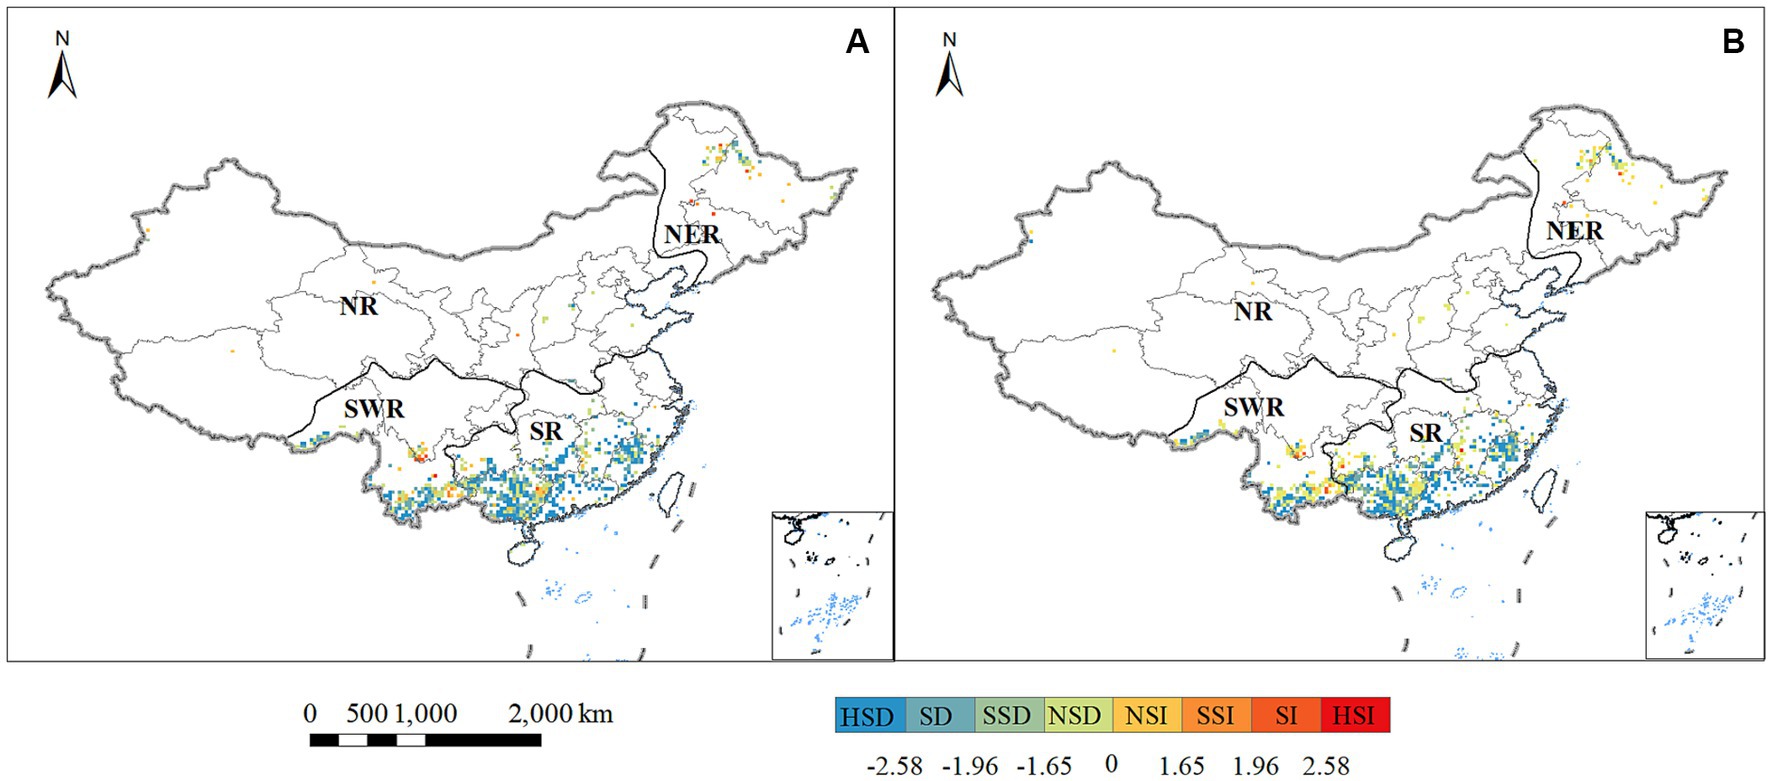
Figure 3. The trend of number (A) and FRP (B) of wildfires in China during 2003–2022.
3.2 Wildfires in China are less in the north and more in the south as well as a high incidence in winter and spring
According to MODIS active fire product statistics, the cumulative frequency and FRP of wildfires in China since 2003 were 734.8 × 10³ and 2083.7 × 104 WM. Among them, the cumulative frequency shares of the four major regions, namely, SR, SWR, NER, and NR, were 39.3 × 10⁴ (53.5%), 16.1 × 10⁴ (21.9%), 11.3 × 10⁴ (15.4%) and 6.8 × 10⁴ (9.2%), respectively; and the cumulative FRP weights were 44.7% (931.8 × 10⁴ WM), 23.7% (494.3 × 10⁴ WM), 23.9% (497.8 × 10⁴ WM) and 7.7% (159.7 × 10⁴ WM), respectively. Wildfires in China are bimodal from north to south, less in the north and more in the south, weaker in the south, and stronger in the north (Figure 4). The forest types in SR and SWR are mainly evergreen broadleaf forests, where wildfire intensity is usually low. Forests in NER are part of the Eurasian boreal forest biome, and forest types are predominantly temperate coniferous, broadleaf, and mixed forests, including larch, pine, spruce, and related boreal forest species (Hayes, 2020), and are therefore prone to high-intensity forest wildfires. Spatially, wildfires in China were mainly distributed in (1) the junction of the Xinganling Mountains, i.e., the western and northern parts of Heilongjiang Province; (2) the Hengduan Mountains, roughly located in the northwestern part of Yunnan and the southwestern part of Sichuan; (3) the southeastern hills, especially in Guangdong Province, the eastern part of Guangxi Province and the southern part of Hunan; and (4) the Yunnan-Guizhou Plateau, mainly located in the southern part of Yunnan. The analysis found that more than 90% of the wildfires were located in the eastern monsoon region, and the correlation between wildfire occurrence and development and monsoon climate needs further study.
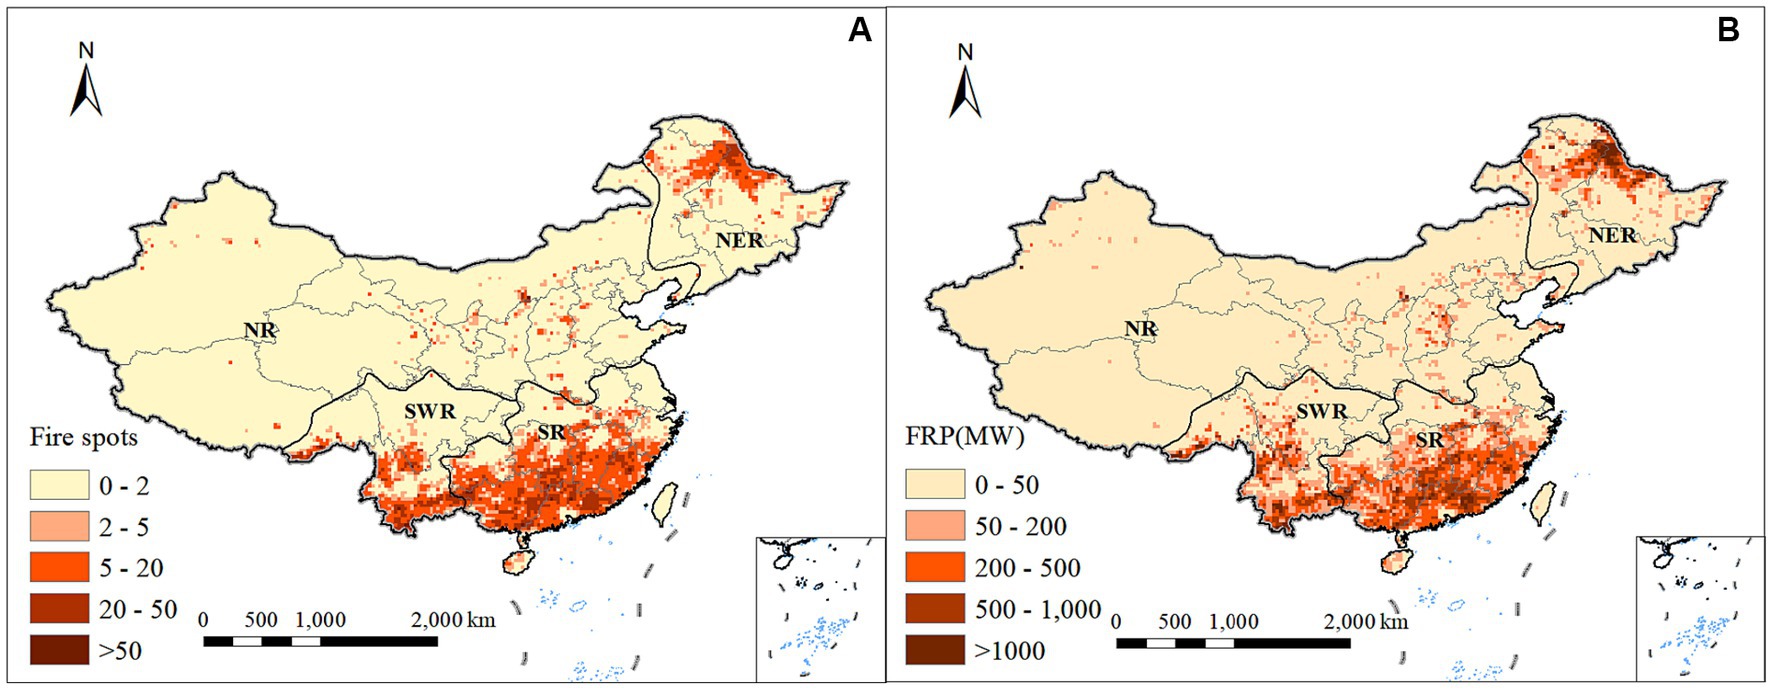
Figure 4. Spatial distribution of the annual average (A) number and (B) FRP of wildfires in China during 2003–2022.
Temporally, wildfires in China have generally had a higher incidence during winter and spring over the past 20 years (Figures 2C,D). MODIS wildfire data showed that the average monthly frequency and FRP of wildfires in China from 2003 to 2022 were 3.1 × 10³ and 8.7 × 10⁴ WM, respectively. The peak of both frequency and FRP occurs in March (7.3 × 10³, 20.5 × 10⁴ WM), followed by February (5.7 × 10³, 15.1 × 10⁴ WM) and April (4.8× 10³, 14.5 × 10⁴ WM). At the seasonal scale, the frequency of wildfires was 39%, 5%, 18%, and 37% for spring, summer, autumn, and winter, respectively. The corresponding FRP was 45%, 4%, 18%, and 34% in spring, summer, autumn, and winter, respectively. This showed that wildfires were frequent and severe in winter and spring, with a cumulative frequency and FRP ratio of more than 3/4. This is highly consistent with studies showing that China has a significant monsoon climate, with relatively dry winter and spring, and a large amount of dry biomass, which makes it more prone to wildfires (Yi et al., 2017).
3.3 Significant geographic variation in wildfires in China since 2003
Regional variations in wildfires across China’s four major regions from 2003 to 2022 are significant. In terms of the average frequency of occurrence, SR accounted for as much as 50% or more (19.66 × 10³) in the past 20 years, 2.2 times, 3.1 times, and 4.6 times more than SWR, NER, and NR; the difference between the average frequency of wildfires in SR and NR was as high as 16.27 × 10³. In terms of the corresponding FRP, SR accounted for about 43.17% (46.6 × 10⁴ WM), which is 21.9 × 10⁴ WM, 21.7 × 10⁴ WM, and 38.6 × 10⁴ WM more than SWR, NER, and NR, respectively. In terms of the average FRP of wildfires, 23.7 WM/point, 30.7 WM/point, 44.0 WM/point, and 23.6 WM /point were found in SWR, SR, NER, and NR, respectively, with the strongest in NER. It is easy to find that the fires in SR are more but weaker in intensity, while the fires in NER are less but stronger. In addition, the seasonal characteristics of wildfires in SR and SWR are consistent with those of the nation, i.e., the high incidence in winter and spring, concentrated in November through April (Figures 2C,D). Accordingly, wildfires in NER and NR occurred mainly in the spring and autumn and were concentrated from March to May and October (Figures 2C,D).
3.3.1 Low number of wildfires in NER with high-intensity
Our study showed that the average annual frequency of wildfires in NER from 2003–2022 accounted for less than 1/6 of the national rate, but the corresponding FRP exceeded the 1/5 level. In particular, the average FRP of wildfires over the past 20 years was 44.0 WM/point (24.2 WM/point-89.8 WM/point), accounting for more than 1/3 of the total, and was firmly in the top four regions. In other words, the overall fires in NER are less intense but strong. It was worth noting that the frequency and peak FRP of wildfires in NER was the same year as the national one (i.e., 2003), where the peak FRP was nearly 60% of the national level. In addition, the FRP of wildfires in NER was generally consistent with the national interannual trend until 2007. Thus, it can be seen that the FRP of NER was dominant at the national level and determined the general trend of national wildfire intensity. Previous research has indicated that the 2003 forest fire in Heilongjiang was the second largest on record after the one in 1987 since the founding of the country, resulting in significant damage to the local ecological environment and economic development.
Temporally, the average monthly frequency of wildfires in NER was highest in October (27.1%), followed by April (22.56%), March (18.1%), and May (11.3%), with a cumulative share of nearly 80%. Correspondingly, FRP was highest in May (28.3%), followed by October (27.4%), April (16.6%), and March (14.1%), with a cumulative share of nearly 90%. It is easy to see that wildfires in NER occur mainly in the spring and autumn, especially in May and October. NER has a moderately cold temperate monsoon climate with long, cold winters and dry spring and autumn seasons, combined with extensive boreal forests and deciduous broadleaf forests (Hayes, 2020), which facilitate the development of wildfires, resulting in a high incidence of wildfires in NER in spring and autumn. Our results are consistent with previous studies (Qin et al., 2014; Chen et al., 2017; Fang et al., 2021).
3.3.2 High number but low intensity of wildfires in SR
Over the past 20 years, wildfires in SR have been the most frequent among the four major regions, with an average annual frequency of 53.5% (39.3 × 10³), dominating the country. Meanwhile, its corresponding FRP was about 44.7% (931.8 × 10⁴ WM). In particular, the average FRP level for wildfires in SR from 2003 to 2022 was low at 23.7 WM/point (18.4 WM/point-26.8 WM/point) compared to NER (44.0 WM/point). It can be seen that the fires in SR are more frequent but less intense. The peak frequency and FRP of wildfires in SR were both in 2008, and the interannual trend of their FRP afterward was synchronized with that of the whole country. Existing research suggested that the rise in global temperatures was causing more frequent extreme weather events, and the rare weather anomalies that occurred in SR in 2008 created favorable conditions for the increased incidence of wildfires.
The seasonal distribution of wildfires in SR was different from that in NER, mainly in winter and spring. Statistics showed that the average monthly frequency and FRP of wildfires in SR were highest in February (3.7 × 10³, 9.1 × 10⁴ WM), followed by 3.5 × 10³ (17.7%) and 8.1 × 10⁴ WM (17.4%) in March, 3.2 × 10³ (16.2%), 8.0 × 10⁴ WM (17.1%) in January, 3.1 × 10³ (15.8%) in December 103 (15.8%), and 7.8 × 10⁴ WM (16.7%). On the one hand, SR is the most densely populated area of China’s subtropical forests, which is extremely rich in combustible and combustion-assisting materials. On the other hand, due to the influence of the winter monsoon climate, SR has a dry climate with little rain in winter and spring (Fang et al., 2021). The combination of these factors exacerbated the occurrence and spread of wildfires in SR.
3.3.3 Wildfires in SWR are significantly affected by El Niño
From 2003 to 2022, the average annual frequency and FRP of wildfires in SWR were 8.0 × 10³ and 24.7 × 10⁴ WM, respectively, which were 9.2 and 7.7% of the national level. In particular, its multi-year average wildfire FRP of 30.7 WM/point (21.6 WM/point-39.4 WM/point) was comparable to the national average of 28.4 WM/point. Notably, the peak annual average frequency (15.0 × 10³) and FRP (46.0 × 10⁴ WM) of wildfires in SWR both occurred in 2010, with secondary peaks of 11.4 × 10³ and 35.6 × 10⁴ WM in 2014. Research showed that 2010 and 2014 were strong El Niño years globally. It can be seen that the development of wildfires in SWR is significantly affected by the El Niño phenomenon.
Next, the monthly average frequency and FRP of wildfires in SWR peaked at 2.07 × 10³ and 7.13 × 10⁴ WM in March, followed by 1.7 × 10³ and 5.4 × 10⁴ WM in February, and 1.3 × 10³ and 4.6 × 10⁴ WM in April, with a cumulative share of over 60% from February to April. The climate in SWR is diverse, influenced by the Indian Ocean monsoon, and mostly dominated by high mountain valleys, dry and hot river valleys, and highland mountains; the dry season (November–April) and the rainy season (May–October) are distinct, and the dry season is dry, especially from February to April, and thus wildfires are highly prevalent. SWR, in the non-monsoon season (winter and spring) experiences seasonal drought stress, relatively dry climate, higher temperatures, and a large amount of dry biomass, more prone to wildfire, so the winter and spring season is a serious fire risk season (Yi et al., 2017). In addition, SWR is the second-largest natural forest region in China, with rich forest resources and one of the richest concentrations of biodiversity and combustible materials in the world. With the increasing trend of global warming and the increase of extreme weather phenomena, the development of wildfires in SWR is complex and variable, and its development needs special attention.
3.3.4 Wildfires in NR are small and sporadic
Over the past 20 years, wildfires in NR were small and sporadic. From 2003 to 2022, the average annual frequency and FRP of wildfires in NR were 3.4 × 10³ and 8.0 × 10⁴ WM, respectively. In terms of average FRP for wildfire, NR was about half the level of NER (44.00 WM/point) at only 23.6 WM/point (15.5 WM/point-48.3 WM/point). In particular, spring was the highest season for wildfires in NR, accounting for 48.6% of the total.
Temporally, there was a high concentration of wildfires in NR. From 2003–2022, the average monthly frequency of wildfires in NR was highest in March (0.7 × 10³), followed by April (0.6 × 10³), with a cumulative share of 40.4% in both months. Accordingly, the FRP was strongest in April (4.1 × 10⁴ WM) and second in March (3.5 × 10⁴ WM), accounting for more than 50% in both months. It is worth noting that although both the frequency and FRP of wildfires in NR have averaged less than 10% of the national level over the past 20 years, their frequency share has increased from 3.2% in 2003 to 12.2%, and the corresponding FRP share has increased from 3.1 to 16.5% in 2022. Undoubtedly, this increasing trend requires special attention and analysis of its causes.
3.4 The density of wildfires shows a decreasing trend with significant seasonal differences
Since 2003, the overall density properties of China’s wildfires have shown a north–south clustering and a central sparsity (Figure 5). In terms of frequency of occurrence and FRP for the five subperiods (2003–2006, 2007–2010, 2011–2014, 2015–2018, 2019–2022), kernel density analysis showed that the high-value area in 2003–2006 was mainly located in northern Heilongjiang in NER and southern Yunnan in SWR, and Guangxi, Guangdong, most of Fujian, and southern Hunan in SR. Compared to the first subperiod, the high-value area in NER of northern Heilongjiang decreased from 2007 to 2010, and the overall high-value area in the southern and SWR expanded further northward. From 2011 to 2014, the high-value areas in NER of northern Heilongjiang disappeared, and the high-value areas in SR and SWR also decreased significantly, with the high-value areas mainly located in parts of southern Yunnan, eastern Guangxi, most of Guangdong, and southern Hunan. In 2015–2022 (the fourth and fifth subperiods), the national high-value areas were mainly located in parts of Yunnan and Guangxi. Spatially, the frequency of wildfires in China and the kernel density of FRPs were largely consistent, and they were highly correlated. It is important to emphasize that the overall decreasing trend of the high-value areas of wildfire frequency and FRP in China over the past 20 years has been observed only in the second subperiod (2007–2010), with a local increase.
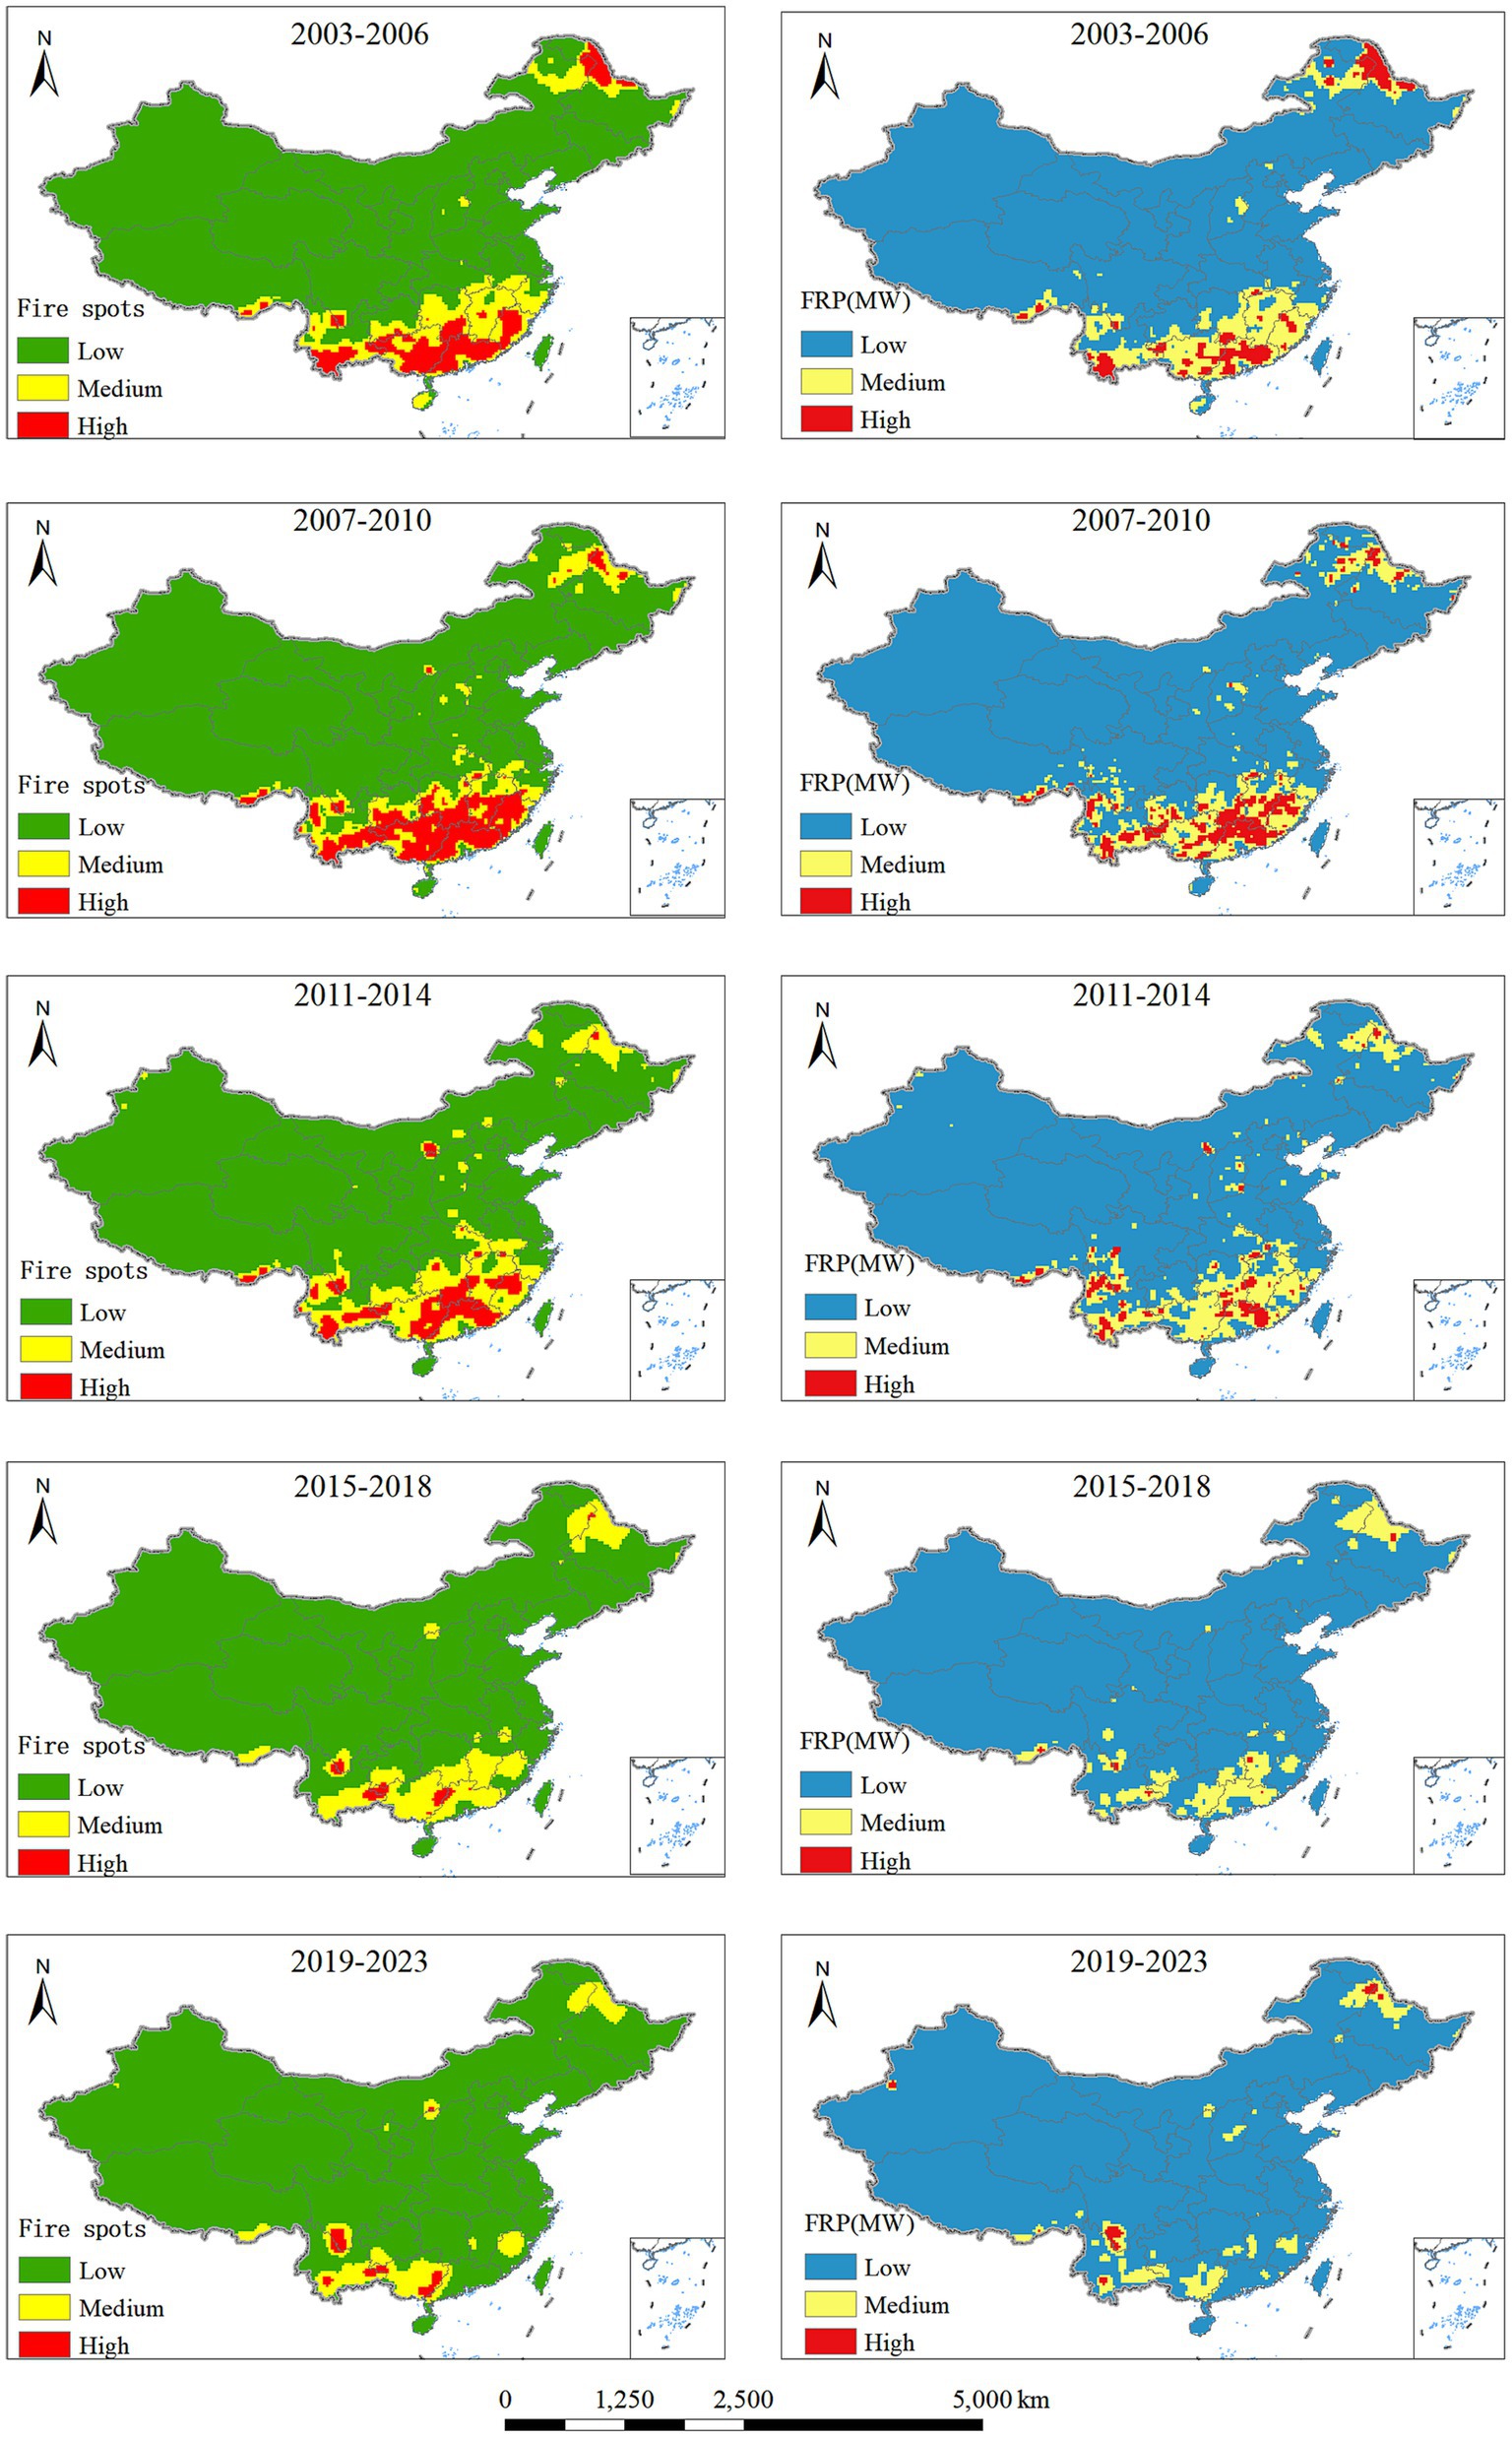
Figure 5. The kernel density of number and FRP for five subperiods of wildfires in China.
In terms of seasonal distribution, there are significant seasonal differences in wildfire frequency and FRP, with overall clustering in winter and spring and sparseness in summer and autumn. In regard to the seasonal kernel density analysis of the frequency, the high-value areas in spring were mainly located in the northwestern part of Heilongjiang in NER and the southern part of Yunnan in SWR. During the summer, only sporadic median areas occurred nationwide. In autumn, the high-value areas existed only in the northern part of Heilongjiang in NER, and the medium-value areas were highly concentrated in SR. In winter, the medium to high-value areas for wildfires were located in SR and SWR, mainly in Guangdong, Guangxi, and Yunnan. The seasonal kernel density characteristics of wildfire FRPs were highly consistent with the frequency of wildfires. Overall, the highest density of wildfire was observed in winter, followed by spring and fall, and the weakest in summer (Figure 6).

Figure 6. The kernel density of the number and FRP of seasonal wildfires in China during 2003–2022.
3.5 Climate significantly affects wildfires
Climate plays an important role in influencing the intensity and frequency of wildfires (Yang et al., 2023). Changes in climate, such as increased drought, can create conditions that increase the risk of wildfire (Schoennagel et al., 2017). Understanding the impact of drought on wildfire dynamics is critical to assessing the potential impact of climate change on wildfire activity in China (Yang et al., 2023). SPEI, which incorporates a wide range of climate metrics such as precipitation, temperature, and evapotranspiration (Vicente-Serrano et al., 2010), can identify the role of temperature increases in future drought conditions and can explain the possible impacts of temperature changes beyond the context of global warming. SPEI has been widely used to characterize meteorological droughts and has become a dominant integrated climate indicator for exploring the relationship between climate and wildfires and for revealing the effects of climate on wildfires.
Consistent with previous studies, wildfires showed an overall negative correlation with SPEI, indicating that the drier the climate is, the more likely it is to cause wildfire. Wildfires typically occur under persistent drought conditions (Clarke et al., 2020), and pre-existing drought is an important driver because fuel loads and factors associated with ignition are controlled by prior climatic conditions (Zhao et al., 2023). Specifically, the frequency and FRP of wildfires showed a negative correlation with SPEI in over 70% of the wildfire areas. Among them, the areas with medium-strong negative correlation (correlation coefficient < −0.4) are mainly located in SR (Figure 7), especially in most parts of Fujian, south-central Guangxi, Guangdong, Hainan, and southern Hunan. The sensitivity of wildfires to pre-existing drought is higher in these areas than in other areas. This may be due to the large geographic areas, limited vegetation cover, and less frequent wildfire occurrences in other regions (Yang et al., 2023). In summary, drought events (negative SPEI) have a significant effect on wildfires, especially in SR.
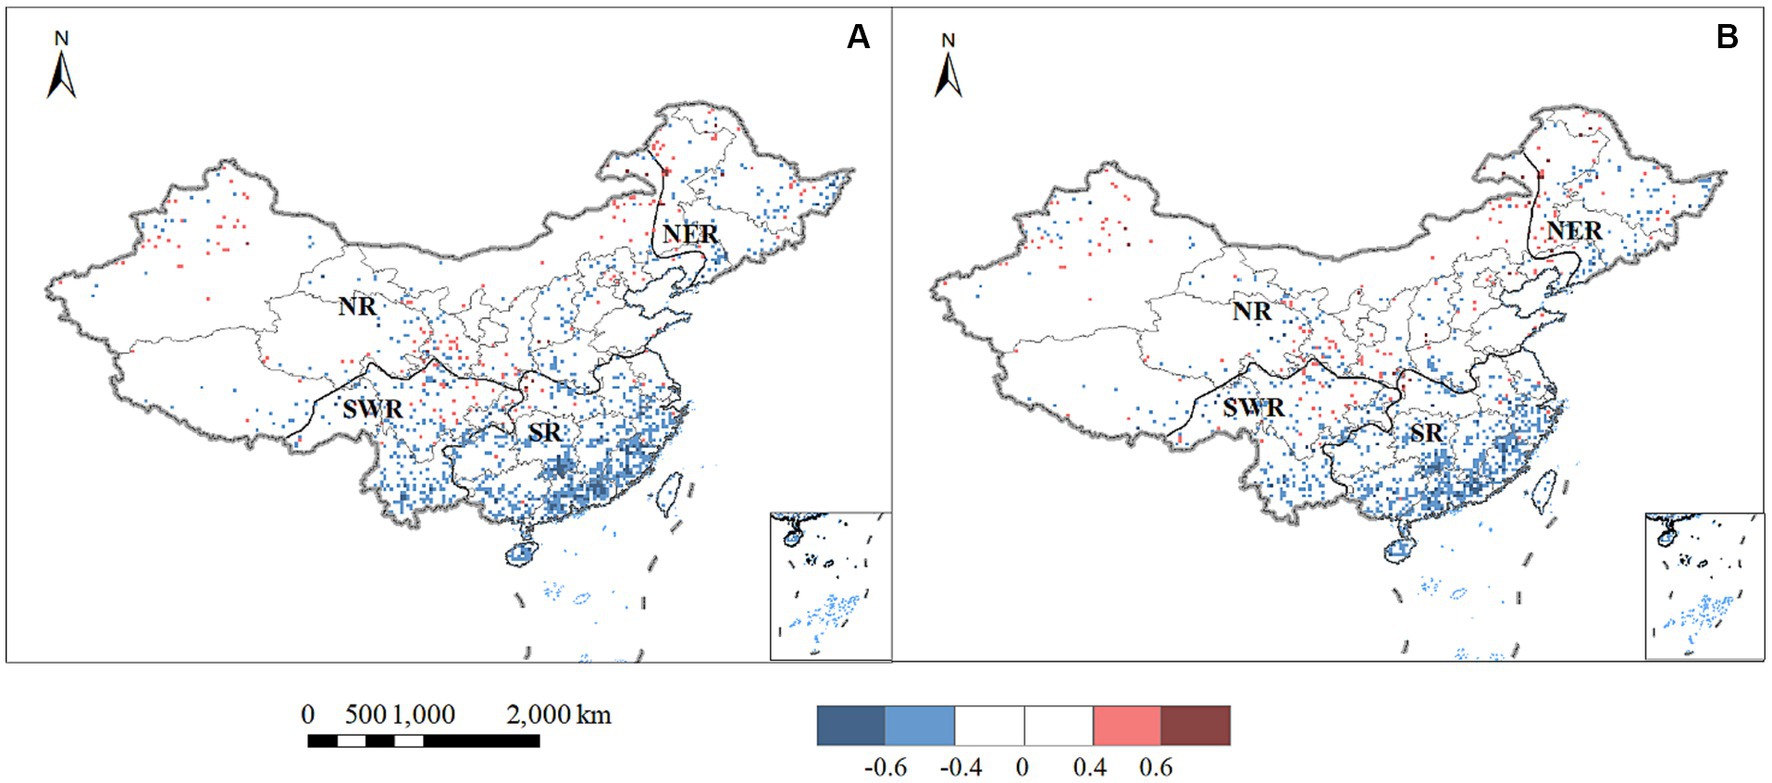
Figure 7. Correlation between the annual (A) number and (B) FRP of wildfires and SPEI.
3.6 Wildfire prevention policies continue to be introduced
In the context of global warming, countries such as the United States and Australia have experienced frequent and catastrophic wildfires in recent years (Dutta et al., 2016; Iglesias et al., 2022). However, wildfires in China have shown a significant downward trend in the 21st century. Undoubtedly, this downward trend is related to the development and implementation of fire prevention and suppression policies in China (Hayes, 2020). Since the 1987 wildfires, China’s forest fire prevention work has been characterized by a high-pressure situation. From the mode of “group prevention and protection, combining mass and professional forest protection” to the establishment of a sound organizational management and responsibility system and the development of regulations and systems and a system of fire control by the law. In 1988, China’s first specialized administrative law on forest fire prevention, the Forest Fire Prevention Regulations, laid the foundation for promoting fire prevention under the law (Zhou et al., 2022).
Since the 21st century, the Chinese government has continued to pay attention to wildfires, and relevant fire prevention policies have been introduced one after another. China has gradually established the policy of “prevention first and active eradication.” In 2008, the State Council of China amended the Forest Fire Prevention Regulations, which were enacted in 1998, under the Forest Law of the People’s Republic of China. The Regulations refined the responsibilities of the main bodies in preventing and fighting forest fires, as well as the system and measures for fighting fires and the legal responsibilities for violations of the law that should be punished following the law (Zhou et al., 2022). Following this, the relevant departments of the State Council of China issued a series of policies one after another. For example, the National Forest Fire Prevention Command and the State Forestry Administration issued the “Norms for the Management of National Forest Fire Prevention Communication Organizations (for Trial Implementation)” in 2011. The purpose is to standardize the management of the national forest fire prevention communication organization and improve the scientific, professional, and standardized level of forest fire prevention communication construction. In 2016, the State Forestry Administration issued the National Forest Fire Prevention Plan (2016–2025), which provides a detailed narrative on how to improve the forest fire prevention construction system. In 2021, the Office of the State Forestry and Grassland Administration issued the Circular on Strengthening Forest and Grassland Fire Prevention Work in Fall and Winter Across the Country. China’s wildfire prevention entered a new period in 2022 when the Opinions on Comprehensively Strengthening Forest and Grassland Fire Prevention and Suppression in the New Situation was jointly issued by the General Office of the Central Committee of the Communist Party of China (CPC) and the General Office of the State Council on October 14 of the same year. The opinions pointed out that, affected by global warming, increased extreme weather, and other factors, wildfires have raged in countries around the world, causing significant losses and impacts, emphasizing that the implementation of responsibility is the fundamental guarantee for good forest and grassland fire prevention and suppression, clarified the responsibility of the local party committees and governments, and set up a mechanism for supervision and accountability. However, how to measure the impact of policies is a topic that deserves in-depth study. Some scholars have made some attempts to reveal the effects of policies on wildfires. Tian et al. (2020) used a burn probability model to assess the effectiveness of wildfire management in the Daxinganling forest area. The study modeled the acreage burned by wildfires based on historical fire records. The simulated data were also compared with data from actual wildfires to reveal the impact of fire prevention policies. Zhou et al. (2022) explored the changes in wildfire drivers that may have resulted from different periods of fire prevention policies in the Daxinganling forest area. These studies provide us with ideas and tools for assessing the effects of policies on wildfires.
Although great progress has been made in wildfire prevention and management policies in China, there are still some problems to be solved. In recent decades, a large number of trees have been planted in China, which has greatly increased the fuel load of forests and increased the potential risk of forest fires (Zhou et al., 2022). At the same time, frequent human activities (e.g., straw burning, wildfires, rituals, etc.) and extreme weather events (e.g., El Niño) will also facilitate the development of wildfires (Xiao et al., 2022). This makes the current forest fire prevention situation increasingly severe. Therefore, to ensure that wildfires in China are under control, more efforts need to be invested in research on the mechanisms of wildfire development, prediction, and wildfire prevention.
3.7 Limitations
To present, some studies have used active fire products (e.g., MODIS and VIIRS) to reveal the spatiotemporal distribution and variability of wildfires at global, regional, and national scales (Li et al., 2020). However, some factors may limit our ability to develop a comprehensive understanding of wildfire regimes. First, wildfire activity is recognized as a growing problem in many parts of the world, but its definition remains elusive and difficult to quantify on large spatial scales (Resco de Dios et al., 2022). In this paper, land cover types such as forests, shrubs, and grassland are used to extract wildfire fire points from the fire point data. No further distinction is made between the causes of such fire points, and some errors exist. Second, the wildfire data we use is MODIS data with a spatial resolution of 1 kilometer provided by NASA. When the scale of wildfire is large enough, it may be recorded as multiple fire spots in observation. In this study, the number of fire points was used to analyze the temporal and spatial evolution of wildfires. This limitation of data observation may bring errors to our research. Finally, the presence of clouds and shadows may affect wildfire detection, especially in tropical and/or sub-tropical regions (Li et al., 2014). This is a very paradoxical issue because more than 70% of wildfires in China occur in tropical subtropical regions, which is a challenge for cloud-free observations. However, due to the frequent occurrence of wildfires during the dry winter and spring seasons in the tropics and subtropics, this also facilitates effective observations using optical satellites. These constitute an important source of uncertainty in wildfire research. However, for national-level analysis, moderate spatial resolution is appropriate.
4 Conclusion and outlook
In this study, with MODIS C6 wildfire products (2003–2022), we investigated the spatial and temporal patterns and evolution characteristics of wildfires in China. Over the past 20 years, the wildfire frequency and fire radiative power (FRP) have declined at rates of −1920/year (p < 0.001) and −76492 MW/year (p < 0.001), respectively, showing a highly significant downward trend, with declines of up to 63 and 81%. Wildfires in China show a single peak pattern of high incidence in winter and spring, with the most frequent in March, followed by February and April. The overall spatial distribution of wildfires in China is characterized by a bimodal distribution, with more in the south and less in the north. Wildfires are most prevalent in SR (54%), followed by SWR (21%) and NER (15%), and least in NR (9%). Wildfires are most abundant but less intense in SR, fewer but most intense in NER, and significantly influenced by El Niño in SWR, with significant regional differences in wildfires in China. The average FRP of wildfire spots presented a decreasing trend from 47 MW/spot in 2003 to only 25 MW/spot in 2022. This may be due to more dispersed wildfires, rather than concentrated wildfires. The frequency and FRP of wildfires showed an overall negative correlation with SPEI. Drought events (negative SPEI) have a significant effect on wildfires, especially in SR. This study demonstrates the effectiveness of current fire suppression policies in China in terms of disaster prevention and mitigation, and further provides data to further explore and analyze the impact of wildfires on the regional environment.
In the future, we will pay attention to the following aspects: the influencing factors, driving mechanism, and a series of environmental effects caused by wildfires in China, to reveal the occurrence and development mechanism of wildfires in China and quantify the potential impact of wildfires on the ecological environment and social economy. In addition, it is necessary to further study the relationship between wildfire and climate, especially the relationship between wildfires and extreme climate, such as the relationship between El Nino, La Nina, and the Indian Ocean dipole. Generally, the government and the scientific community need to make sustained efforts in this field.
Data availability statement
The original contributions presented in the study are included in the article/supplementary material, further inquiries can be directed to the corresponding author.
Author contributions
CL: writing – original draft and data curation. CX: writing – review and editing, data curation, funding acquisition, and supervision. ZF: writing – review and editing, funding acquisition and supervision. QM: writing – review and editing. All authors contributed to the article and approved the submitted version.
Funding
This paper was supported by the National Natural Science Foundation of China (42130508 and 42001226), and the Opening Fund of Key Laboratory of Natural Disaster Monitoring, Early Warning and Assessment of Jiangxi Province (Jiangxi Normal University; JXZRZH202305).
Conflict of interest
The authors declare that the research was conducted in the absence of any commercial or financial relationships that could be construed as a potential conflict of interest.
Publisher’s note
All claims expressed in this article are solely those of the authors and do not necessarily represent those of their affiliated organizations, or those of the publisher, the editors and the reviewers. Any product that may be evaluated in this article, or claim that may be made by its manufacturer, is not guaranteed or endorsed by the publisher.
Footnotes
References
Abatzoglou, J. T., Williams, A. P., Boschetti, L., Zubkova, M., and Kolden, C. A. (2018). Global patterns of interannual climate-fire relationships. Glob. Chang. Biol. 24, 5164–5175. doi: 10.1111/gcb.14405
Bo Zheng, P.C., Chevallier, Frederic, and Yang, Hui,Canadell, Josep G., and Chen, Yang. (2023). Record-high CO2 emissions from boreal fires in 2021. Science. 379, 912–917. doi: 10.1126/science.ade0805
Bowman, D., Balch, J. K., Artaxo, P., Bond, W. J., Carlson, J. M., Cochrane, M. A., et al. (2009). Fire in the earth system. Science 324, 481–484. doi: 10.1126/science.1163886
Chen, D. M., Pereira, J. M. C., Masiero, A., and Pirotti, F. (2017). Mapping fire regimes in China using MODIS active fire and burned area data. Appl. Geogr. 85, 14–26. doi: 10.1016/j.apgeog.2017.05.013
Chuvieco, E., Giglio, L., and Justice, C. (2008). Global characterization of fire activity: toward defining fire regimes from earth observation data. Glob. Chang. Biol. 14, 1488–1502. doi: 10.1111/j.1365-2486.2008.01585.x
Clarke, H., Penman, T., Boer, M., Cary, G. J., Fontaine, J. B., Price, O., et al. (2020). The proximal drivers of large fires: a Pyrogeographic study. Front. Earth Sci. 8:90. doi: 10.3389/feart.2020.00090
Davies, D. K., Ilavajhala, S., Min Minnie, W., and Justice, C. O. (2009). Fire information for resource management system: archiving and distributing MODIS active fire data. IEEE Trans. Geosci. Remote Sens. 47, 72–79. doi: 10.1109/TGRS.2008.2002076
Dutta, R., Das, A., and Aryal, J. (2016). Big data integration shows Australian bush-fire frequency is increasing significantly. R. Soc. Open Sci. 3:150241. doi: 10.1098/rsos.150241
Earl, N., and Simmonds, I. (2018). Spatial and temporal variability and trends in 2001-2016 global fire activity. J. Geophys. Res.-Atmos. 123, 2524–2536. doi: 10.1002/2017JD027749
Fang, K., Yao, Q., Guo, Z., Zheng, B., Du, J., Qi, F., et al. (2021). ENSO modulates wildfire activity in China. Nat. Commun. 12:1764. doi: 10.1038/s41467-021-21988-6
Flannigan, M. D. K., Krawchuk, M. A., de Groot, W., Wotton, B. M., and Gowman, L. M. (2009). Implications of changing climate for global wildland fire. Int. J. Wildland Fire 18, 483–507. doi: 10.1071/WF08187
Forsythe, N., Kilsby, C. G., Fowler, H. J., and Archer, D. R. (2012). Assessment of runoff sensitivity in the upper Indus Basin to interannual climate variability and potential change using MODIS satellite data products. Mt. Res. Dev. 32, 16–29. doi: 10.1659/MRD-JOURNAL-D-11-00027.1
Giglio, L., Boschetti, L., Roy, D. P., Humber, M. L., and Justice, C. O. (2018). The collection 6 MODIS burned area mapping algorithm and product. Remote Sens. Environ. 217, 72–85. doi: 10.1016/j.rse.2018.08.005
Giglio, L., Csiszar, I., and Justice, C. O. (2006). Global distribution and seasonality of active fires as observed with the Terra and Aqua moderate resolution imaging Spectroradiometer (MODIS) sensors. J. Geophysical Res. Biogeosci. 111. doi: 10.1029/2005JG000142
Giglio, L., Descloitres, J., Justice, C. O., and Kaufman, Y. J. (2003). An enhanced contextual fire detection algorithm for MODIS. Remote Sens. Environ. 87, 273–282. doi: 10.1016/S0034-4257(03)00184-6
Giglio, L., Schroeder, W., and Justice, C. O. (2016). The collection 6 MODIS active fire detection algorithm and fire products. Remote Sens. Environ. 178, 31–41. doi: 10.1016/j.rse.2016.02.054
Guo, M., Yao, Q., Suo, H., Xu, X., Li, J., He, H., et al. (2023). The importance degree of weather elements in driving wildfire occurrence in mainland China. Ecol. Indic. 148. doi: 10.1016/j.ecolind.2023.110152
Hantson, S., Padilla, M., Corti, D., and Chuvieco, E. (2013). Strengths and weaknesses of MODIS hotspots to characterize global fire occurrence. Remote Sens. Environ. 131, 152–159. doi: 10.1016/j.rse.2012.12.004
Hayes, J. P. (2020). Fire suppression and the wildfire paradox in contemporary China: policies, resilience, and effects in Chinese fire regimes. Hum. Ecol. 49, 19–32. doi: 10.1007/s10745-020-00183-z
Huang, L., Zhu, Y., Wang, Q., Zhu, A., Liu, Z., Wang, Y., et al. (2021). Assessment of the effects of straw burning bans in China: emissions, air quality, and health impacts. Sci. Total Environ. 789:147935. doi: 10.1016/j.scitotenv.2021.147935
Iglesias, V., Balch, J. K., and Travis, W. R. (2022). U.S. fires became larger, more frequent, and more widespread in the 2000s. Science. Advances 8:eabc0020. doi: 10.1126/sciadv.abc0020
Jin, Q., Wang, W., Zheng, W., Innes, J. L., Wang, G., and Guo, F. (2022). Dynamics of pollutant emissions from wildfires in mainland China. J. Environ. Manag. 318:115499. doi: 10.1016/j.jenvman.2022.115499
Jolly, W. M., Cochrane, M. A., Freeborn, P. H., Holden, Z. A., Brown, T. J., Williamson, G. J., et al. (2015). Climate-induced variations in global wildfire danger from 1979 to 2013. Nat. Commun. 6:11. doi: 10.1038/ncomms8537
Lelieveld, J., Evans, J. S., Fnais, M., Giannadaki, D., and Pozzer, A. (2015). The contribution of outdoor air pollution sources to premature mortality on a global scale. Nature 525, 367–384. doi: 10.1038/nature15371
Li, P., Feng, Z., Jiang, L., Liao, C., and Zhang, J. (2014). A review of Swidden agriculture in Southeast Asia. Remote Sens. 6, 1654–1683. doi: 10.3390/rs6021654
Li, P., Xiao, C. W., Feng, Z. M., Li, W. J., and Zhang, X. Z. (2020). Occurrence frequencies and regional variations in visible infrared imaging radiometer suite (VIIRS) global active fires. Glob. Chang. Biol. 26, 2970–2987. doi: 10.1111/gcb.15034
Lian, C., Xiao, C., and Feng, Z. (2023). Spatiotemporal characteristics and regional variations of active fires in China since 2001. Remote Sens. 15, 1–54. doi: 10.3390/rs15010054
Qin, X., Yan, H., Zhan, Z., and Li, Z. (2014). Characterising vegetative biomass burning in China using MODIS data. Int. J. Wildland Fire 23, 69–77. doi: 10.1071/WF12163
Resco de Dios, V., Yao, Y., Cunill Camprubi, A., and Boer, M. M. (2022). Fire activity as measured by burned area reveals weak effects of ENSO in China. Nat. Commun. 13:4316. doi: 10.1038/s41467-022-32013-9
Schoennagel, T., Balch, J. K., Brenkert-Smith, H., Dennison, P. E., Harvey, B. J., Krawchuk, M. A., et al. (2017). Adapt to more wildfire in western north American forests as climate changes. Proc. Natl. Acad. Sci. 114, 4582–4590. doi: 10.1073/pnas.1617464114
Schroeder, W., Oliva, P., Giglio, L., and Csiszar, I. A. (2014). The new VIIRS 375 m active fire detection data product: algorithm description and initial assessment. Remote Sens. Environ. 143, 85–96. doi: 10.1016/j.rse.2013.12.008
Tang, X., Machimura, T., Li, J., Yu, H., and Liu, W. (2022). Evaluating seasonal wildfire susceptibility and wildfire threats to local ecosystems in the largest forested area of China. Earth’s Future 10. doi: 10.1029/2021EF002199
Tansey, K., Beston, J., Hoscilo, A., Page, S. E., and Hernandez, C. U. P. (2008). Relationship between MODIS fire hot spot count and burned area in a degraded tropical peat swamp forest in Central Kalimantan, Indonesia. J. Geophys. Res.-Atmos. 113. doi: 10.1029/2008JD010717
Tian, X., Cui, W., and Shu, L. (2020). Evaluating fire management effectiveness with a burn probability model in Daxing’anling, China. Can. J. For. Res. 50, 670–679. doi: 10.1139/cjfr-2019-0413
Tian, Y., Wu, Z., Bian, S., Zhang, X., Wang, B., and Li, M. (2022). Study on spatial-distribution characteristics based on fire-spot data in northern China. Sustain. For. 14:6872. doi: 10.3390/su14116872
Tian, X., Zhao, F., Shu, L., and Wang, M. (2013). Distribution characteristics and the influence factors of forest fires in China. For. Ecol. Manag. 310, 460–467. doi: 10.1016/j.foreco.2013.08.025
Turetsky, M. R., Benscoter, B., Page, S., Rein, G., van der Werf, G. R., and Watts, A. (2014). Global vulnerability of peatlands to fire and carbon loss. Nat. Geosci. 8, 11–14. doi: 10.1038/ngeo2325
United Nations Environment Programme , (2022). Frontiers 2022: Noise, blazes and mismatches – Emerging issues of environmental concern. Nairobi.
Vadrevu, K., and Lasko, K. (2018). Intercomparison of MODIS AQUA and VIIRS I-band fires and emissions in an agricultural landscape-implications for air pollution research. Remote Sens. 10:978. doi: 10.3390/rs10070978
van der Werf, G. R., Randerson, J. T., Giglio, L., van Leeuwen, T. T., Chen, Y., Rogers, B. M., et al. (2017). Global fire emissions estimates during 1997–2016. Earth Syst. Sci. Data 9, 697–720. doi: 10.5194/essd-9-697-2017
Vanem, E., and Walker, S.-E. (2013). Identifying trends in the ocean wave climate by time series analyses of significant wave heightdata. Ocean Eng. 61, 148–160. doi: 10.1016/j.oceaneng.2012.12.042
Vicente-Serrano, S. M., Beguería, S., and López-Moreno, J. I. (2010). A multiscalar drought index sensitive to global warming: the standardized precipitation evapotranspiration index. J. Clim. 23, 1696–1718. doi: 10.1175/2009JCLI2909.1
Voulgarakis, A., and Field, R. D. (2015). Fire influences on atmospheric composition, air quality and climate. Current Pollution Reports 1, 70–81. doi: 10.1007/s40726-015-0007-z
Wang, B., Liu, J., Kim, H. J., Webster, P. J., Yim, S. Y., and Xiang, B. (2013). Northern hemisphere summer monsoon intensified by mega-El Nino/southern oscillation and Atlantic multidecadal oscillation. Proc. Natl. Acad. Sci. U. S. A. 110, 5347–5352. doi: 10.1073/pnas.1219405110
Wang, W., Zhao, F., Wang, Y., Huang, X., and Ye, J. (2023). Seasonal differences in the spatial patterns of wildfire drivers and susceptibility in the southwest mountains of China. Sci. Total Environ. 869:161782. doi: 10.1016/j.scitotenv.2023.161782
Wei, X., Wang, G., Chen, T., Hagan, D. F. T., and Ullah, W. (2020). A Spatio-temporal analysis of active fires over China during 2003–2016. Remote Sens. 12:1787. doi: 10.3390/rs12111787
Xiao, C., Feng, Z., and Li, P. (2022). Active fires show an increasing elevation trend in the tropical highlands. Glob. Chang. Biol., 1–14. doi: 10.1111/gcb.16097
Yaduvanshi, A., Srivastava, P. K., and Pandey, A. C. (2015). Integrating TRMM and MODIS satellite with socio-economic vulnerability for monitoring drought risk over a tropical region of India. Physics and Chemistry of the Earth, Parts A/B/C 83-84, 14–27. doi: 10.1016/j.pce.2015.01.006
Yang, J., and Huang, X. (2022). The 30 m annual land cover datasets and its dynamics in China from 1990 to 2021 [data Set]. Earth Syst. Sci. Data 13, 3907–3925. doi: 10.5194/essd-13-3907-2021
Yang, S., Zeng, A., Tigabu, M., Wang, G., Zhang, Z., Zhu, H., et al. (2023). Investigating drought events and their consequences in wildfires: an application in China. Firehouse 6:223. doi: 10.3390/fire6060223
Yi, K. P., Bao, Y. L., and Zhang, J. Q. (2017). Spatial distribution and temporal variability of open fire in China. Int. J. Wildland Fire 26, 122–135. doi: 10.1071/WF15213
Yin, S. (2020). Biomass burning spatiotemporal variations over south and Southeast Asia. Environ. Int. 145, 106153–106112. doi: 10.1016/j.envint.2020.106153
Zhang, D., Deng, O., Li, G., and Feng, Z. (2012). Temporal and spatial characteristics of Forest fires in Heilongjiang Province between 1980 and 2005. Scientia Silvae Sinicae 48, 175–179.
Zhao, J., Wang, J., Meng, Y., Du, Z., Ma, H., Qiu, L., et al. (2023). Spatiotemporal patterns of fire-driven forest mortality in China. For. Ecol. Manag. 529:120678. doi: 10.1016/j.foreco.2022.120678
Zhou, Q., Zhang, H., and Wu, Z. (2022). Effects of Forest fire prevention policies on probability and drivers of Forest fires in the boreal forests of China during different periods. Remote Sens. 14:5724. doi: 10.3390/rs14225724
Zong, Z., Wang, X., Tian, C., Chen, Y., Qu, L., Ji, L., et al. (2016). Source apportionment of PM<sub>2.5</sub> at a regional background site in North China using PMF linked with radiocarbon analysis: insight into the contribution of biomass burning. Atmos. Chem. Phys. 16, 11249–11265. doi: 10.5194/acp-16-11249-2016
Keywords: wildfires, MODIS collection 6, occurrence frequency, fire radiative power (FRP), spatiotemporal evolution, China
Citation: Lian C, Xiao C, Feng Z and Ma Q (2024) Accelerating decline of wildfires in China in the 21st century. Front. For. Glob. Change. 6:1252587. doi: 10.3389/ffgc.2023.1252587
Edited by:
Ana Cristina Russo, University of Lisbon, PortugalReviewed by:
José Manuel Fernández-Guisuraga, University of León, SpainVirgílio Bento, University of Lisbon, Portugal
Copyright © 2024 Lian, Xiao, Feng and Ma. This is an open-access article distributed under the terms of the Creative Commons Attribution License (CC BY). The use, distribution or reproduction in other forums is permitted, provided the original author(s) and the copyright owner(s) are credited and that the original publication in this journal is cited, in accordance with accepted academic practice. No use, distribution or reproduction is permitted which does not comply with these terms.
*Correspondence: Zhiming Feng, ZmVuZ3ptQGlnc25yci5hYy5jbg==