 Akli Benali
 Bruno A. Aparício
 Ana Gonçalves
 Sandra Oliveira
- 1Centro de Estudos Florestais e Laboratório Associado TERRA, Instituto Superior de Agronomia, Universidade de Lisboa, Lisbon, Portugal
- 2Centro de Estudos Geográficos e Laboratório Associado TERRA, Instituto de Geografia e Ordenamento do Território, Universidade de Lisboa, Lisbon, Portugal
Introduction: In Portugal, the 2017 fire season was particularly extreme, leading to an unprecedented large number of fatalities, injured people, destruction of houses and infrastructures. These dramatic outcomes have contributed to raise awareness regarding the importance of ensuring the safety of people and assets from high intensity uncontrollable wildfires. It is crucial to identify the settlements at higher risk and the most suitable mitigation actions that can maximize the protection of people and assets.
Methods: We developed a simple methodology that combines exposure and vulnerability to estimate wildfire risk at the local level. Exposure was estimated using a fire spread simulation approach that was used to determine the probability of (i) a wildfire generating firebrands that could affect a settlement and (ii) a high intensity wildfire occurring adjacent to a settlement. Exposure was estimated using two fuel scenarios created to represent the current year of 2023 (short-term scenario) and 2030, assuming that no fuel management nor large fires occur in the meantime (medium-term worst-case scenario). Vulnerability was determined by the (i) Index of Total Dependence (IDT), and (ii) evacuation difficulty. Exposure and vulnerability metrics were normalized in percentiles, distributed into quadrants and combined to provide six levels of wildfire risk. For each vulnerability\exposure combination, we proposed a set of priority mitigation actions. The methodology was applied to three areas in Portugal where the risk estimates were analyzed and compared with the implementation rate of two risk mitigation programs already in place.
Results: Results showed that 8.7% of the settlements had “very high” wildfire risk and about 19.5% had “high” wildfire risk, potentially affecting 8,403 and 34,762 inhabitants, respectively. The spatial distribution of settlements at higher risk was very heterogeneous across the study areas and the total fraction ranged between 14% in Coimbra to 36% in Barlavento Algarvio. The overall implementation of mitigation programs in the study areas is very low, with only around 1% of the settlements in “very high” risk having any of the mitigation programs implemented. Conversely, our results also suggest that the implementation rate in settlements classified in lower risk classes is disproportionately high.
Discussion: The application of this risk analysis methodology can be used to assess the implementation status of mitigation actions, and contribute to tailor the actions that maximize the protection of people and assets according to the specific conditions found in each targeted area.
1 Introduction
Wildfires can threaten human communities by injuring, sometimes fatally, residents and firefighters, and damaging or destroying infrastructures, including households (Calkin et al., 2014; Moritz et al., 2014). In recent years, wildfires have caused fatalities and significant damages across the world (Molina-Terrén et al., 2019; Brown, 2020; Nolan et al., 2020). In Portugal, the 2017 fire season was particularly extreme, not only due to its record-breaking burned area (540,654 ha) (ICNF, 2023a), but mostly because of the very large number of fatalities (118) and injured people (1,101) (ANEPC, 2023a,b), destruction of houses and infrastructures (2480), and large economic losses (over 275 M €) (Guerreiro et al., 2018). These dramatic outcomes contributed to raise the awareness of the importance in improving the safety of people and assets in communities from high intensity uncontrollable wildfires, particularly in a fire-prone country like Portugal, where these events are likely to increase in the future (Beighley and Hyde, 2018).
Managing the wildfire problem in the wildland-urban interface (WUI) requires an adequate risk analysis. Risk results from the integration of wildfire likelihood and potential consequences (Dunn et al., 2020) and can be determined by the combination of the probability of occurrence of a severe wildfire event that can affect valued assets (i.e., exposure) and the vulnerability of the valuable resources (Thompson et al., 2013; Oliveira et al., 2021; Chuvieco et al., 2023). In particular, exposure to wildfires can be determined by the combination of: (i) the location of settlements in fire-prone areas; (ii) the probability of wildfires occurring near settlements, and (iii) the probability of the wildfire having a behavior that can expose settlements to flames and\or firebrands, which is correlated with fire intensity and rate-of-spread (Calkin et al., 2014). Vulnerability depends on (i) resistance of infrastructures to ignition and existence of fuel in the home ignition zone (Cohen, 20002010), and (ii) individual\collective characteristics of the people in the community that determine their capacity to anticipate, prepare and respond to a wildfire, that include sheltering and evacuation (Carroll and Paveglio, 2016; Evers et al., 2019; Palaiologou et al., 2019).
Mitigation options can target different risk components, have different costs, responsibilities and effectiveness (Calkin et al., 2014). Reducing wildfire exposure means decreasing the probability that a wildfire will start and/or spread with high intensity close to a settlement (Oliveira et al., 2020; Jahdi et al., 2023). In this case, mitigation options can be applied in the form of fuel treatments, either strategically located in the landscape or adjacent to settlements. Some authors argue that fuel treatments in the landscape tend to have low effectiveness on reducing the probability of losses in settlements, because their spatial planning often encompasses objectives other than settlements’ protection (Cohen, 2000; Calkin et al., 2014). Additionally, the dispersion of settlements and land ownership fragmentation also decreases fuel treatment effectiveness. The responsibility of these mitigation actions are usually attributed to land management entities, although adjacent to settlements the responsibility is often of the homeowners.
The vulnerability of the population to wildfires can be reduced through individual and collective behaviors that improve self-protection abilities, using proper shelters or refuges, or by developing and adopting evacuation plans, where the community can evacuate to a safe location within or outside the settlement (Cova et al., 2011; Lovreglio et al., 2019). The susceptibility of infrastructures to wildfires can be decreased by using fire-resistant building materials and clearing of nearby vegetation in the home ignition zone (e.g., Champ et al., 2013). According to Cohen (2000) managing the surroundings is the main factor determining home ignition potential during wildfires, a finding later corroborated by Penman et al. (2018), who highlighted the creation of a defensible space around a house as a main mitigation strategy. Another study conducted in Australia found that the best predictors for wildfire impact to houses were whether the house was defended and the distance to forest toward the direction of fire spread (Price et al., 2021).
In Portugal, most of the above mentioned mitigation options have been applied. Fuel treatments across the landscape are the responsibility of public entities, have low execution rates and are usually not targeted to reduce the probability of an intense wildfire reaching a settlement (Davim et al., 2022). Fuel treatments adjacent to rural built-up areas (between 50 and 100 m of protective buffer) are mandatory by law and should be executed by the corresponding landowners, and in case of non-compliance, the responsibility is transferred to the municipalities. The implementation of this mitigation measure is hindered by the structure of land tenure in the country, since the vast majority of rural lands are privately owned and an updated land registry is still lacking in most of the territory, particularly where small-scale ownership prevails (Canadas et al., 2023).
After the extreme wildfires of 2017, several initiatives have been promoted by different entities to help prevent the negative effects of large wildfires in the country. The “Village Condominium,” a program managed by the General-Directorate of the Territory (DGT), aims at transforming the landuse/landcover (LULC) in the WUI, reducing fuel loads and ensuring the maintenance of low flammability vegetation (DGT, 2023a). The “Safe People and Safe Village” (SPSV) programs are led by the National Authority for Emergency and Civil Protection (ANEPC) and executed by local municipalities (ANEPC, 2023b). These programs include optional protective measures in settlements implemented with the purpose of improving coping capacity and self-protection capabilities of their inhabitants, such as, the creation of shelters and refuges, the definition of an evacuation plan and the installation of signage, the nomination of a safety officer to liaise with the residents and the local authorities, and training through simulacrums. The mitigation actions associated with the SPSV programs are targeted to decrease vulnerability to wildfires and increase the response capacity of the community.
Despite the merits and shortcomings of each approach, limited resources hinder the implementation of such mitigation actions in all the settlements with considerable wildfire risk associated. Therefore, it is crucial to identify where the settlements at higher risk are located and what are the most appropriate types of mitigation actions that maximize the protection of people and assets. Thus, the objective of this work was to develop a robust yet straightforward methodology that combines settlement exposure and vulnerability to (1) identify the settlements with highest wildfire risk in the short and medium-term, (2) identify which mitigation actions are more suitable to effectively reduce risk, and (3) compare the implemented mitigation measures with estimated wildfire risk.
2 Study areas
The study areas were selected based on existing initiatives and the current legal framework regarding wildfires in Portugal. The National Action Program (NAP), whose main objective is to protect Portugal from severe rural fires (AGIF, 2021), was developed by the Agency for Integrated Rural Fire Management (AGIF) in collaboration with other entities, and put in place in 2021. Three pilot areas (hereafter study areas) were defined with the aim of testing NAP’s implementation at local level: (a) Alto Tâmega, located in the Northern region; (b) Coimbra, in the Central region; and (c) Barlavento Algarvio in the south of mainland Portugal (Figure 1). These were selected due to their representativeness according to ownership structure, forest types, vulnerability, and heterogeneity of fire risk and fire regime.
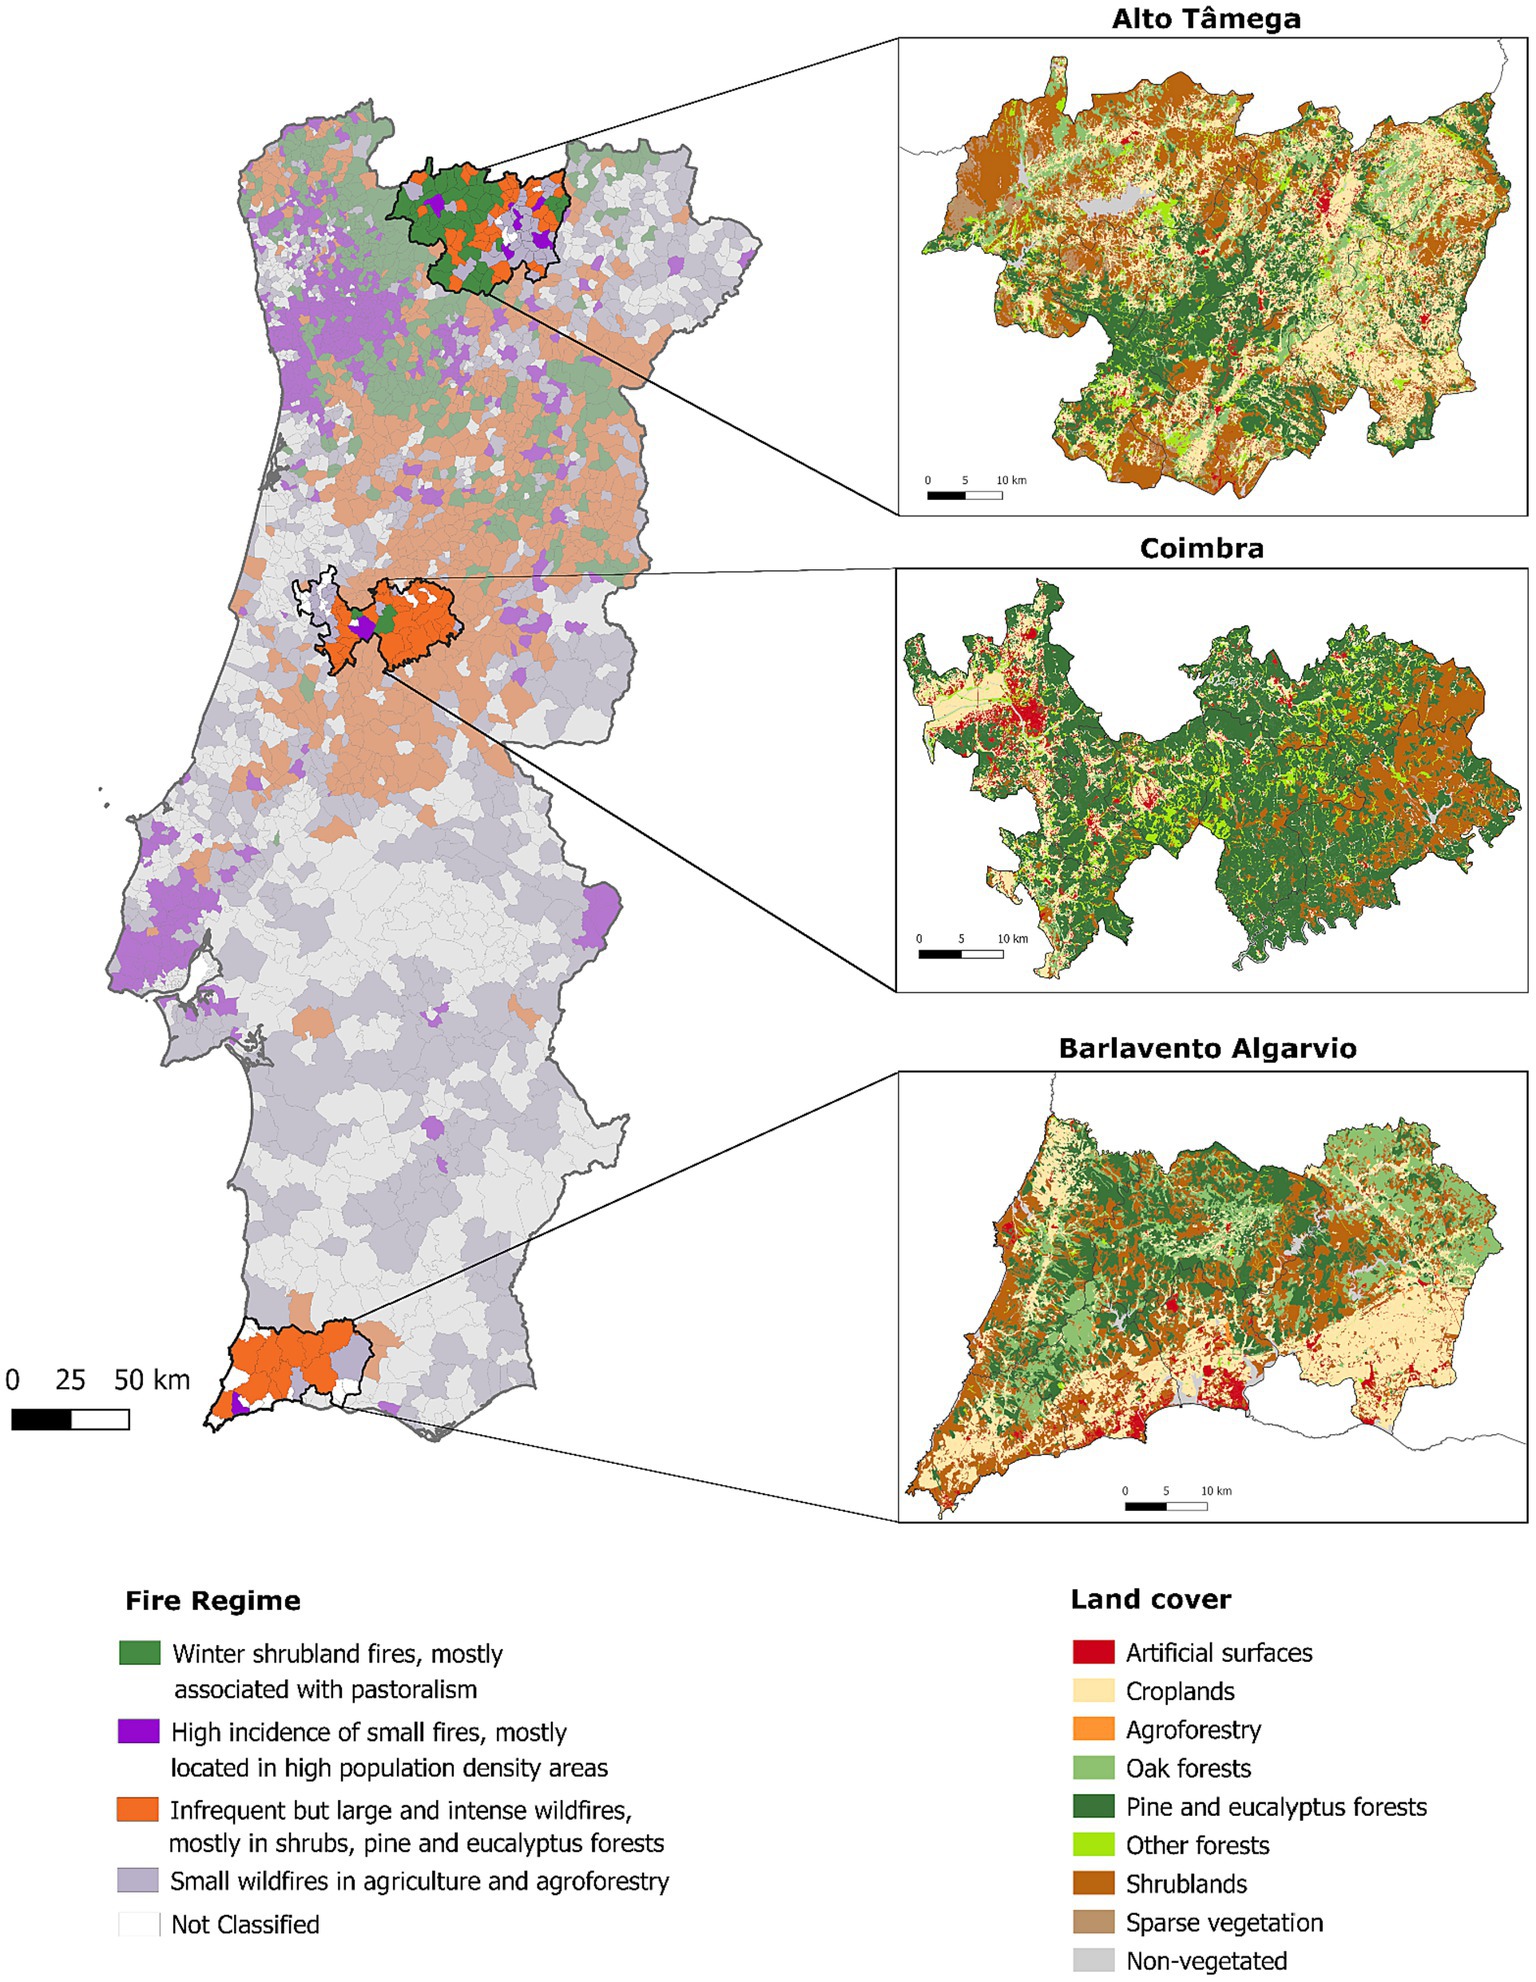
Figure 1. Location of the three study areas, corresponding fire regime (Pereira et al., 2022; left) and dominant land cover (COS2018; DGT, 2018a right).
According to the Portuguese Land Cover map for 2018 (COS2018) (DGT, 2018a), the Alto Tâmega study area is dominated by pine forests, shrublands and agricultural areas. According to the latest census data (INE, 2021), the total population of the 6 municipalities that compose this region is ca. 84,200 inhabitants and decreased about 10% in relation to 2011, corresponding to the largest population loss in the last 10 years among the three areas. The proportion of elderly people (above 65 years old) reaches 35% and the aging index is the highest (ca. 384). According to the Institute for Nature Conservation and Forests (ICNF), 65% of its area has high and very high structural wildfire hazard (ICNF, 2020). Alto Tâmega has a mixture of fire regimes composed of shrubland fires related to pastoralism (in the west), infrequent but large and intense wildfires, mostly associated with shrublands and pine forests, and small wildfires related to agriculture and agroforestry (in the east, Pereira et al., 2022).
The Coimbra study area is dominated by large extents of eucalypt and pine forests (DGT, 2018a). In the last decade, it lost about 3.4% of inhabitants and is characterized by a profound asymmetry in the characteristics of its communities: younger inhabitants located in larger settlements in the west, that contrast with older inhabitants located in smaller and scattered settlements in the east (DGT, 2018b; INE, 2021). The total number of inhabitants in the seven municipalities that compose the study area is ca. 194,200, mostly located in the larger settlements located in the west, in the municipality of Coimbra. Around 71% of its area has high and very high structural wildfire hazard (ICNF, 2020) and its fire regime is dominated by infrequent but large and intense wildfires (Pereira et al., 2022).
The Barlavento Algarvio study area is dominated by eucalypt forests and shrublands, and to a lower extent, by oak woodlands (DGT, 2018a). The total number of inhabitants is ca. 148,000. With the exception of Monchique (center-west of the study area), the most fire-prone municipality in the study area, the other 5 municipalities showed an increase in resident population in the last 10 years (mean of about 6%) and the aging index is, overall, the lowest of the three study areas (c.a. 180). About 42% of its total area has high and very high structural wildfire hazard, the lowest of the study areas, with Monchique having more than 90% of its area falling in the highest hazard classes (ICNF, 2020). The fire regime is dominated by infrequent but large and intense wildfires (Pereira et al., 2022).
3 Data and methods
3.1 Conceptual approach
Data on settlements, including location, boundaries, size and other attributes, were obtained from the cartography of built-up areas (DGT, 2018b). This dataset was drawn from LULC maps, superimposing the artificial surfaces class with the location of residential buildings. From this overlap, three classes were defined: concentrated housing, for areas with 10 or more residential buildings; dispersed housing, with less than 10 residential buildings; non-residential areas, when the existing buildings had other functions (e.g., industrial or commercial). The built-up areas classified as concentrated or dispersed housing were used to represent human settlements, the base unit for risk estimation.
Wildfire risk in the settlements was estimated by combining exposure and vulnerability. Exposure was characterized using two metrics: (i) probability of a wildfire generating burning embers (i.e., spotting) that can reach a settlement, and; (ii) probability of a wildfire reaching the immediate surroundings of a settlement with high intensity. Vulnerability was characterized using two metrics: (i) the total dependency index (IDT), and; (ii) evacuation difficulty. These concepts are explained in detail in the following sections.
The four exposure and vulnerability metrics were normalized according to their distribution in all the study areas and defined in percentiles. These were organized in quadrants, combining the two metrics of exposure or vulnerability, separately. The quadrants of exposure and vulnerability were then combined to assign a risk class to each settlement. Based on the framing of each settlement in the exposure/vulnerability quadrants, we identified the most suitable mitigation actions. The full conceptual approach is represented in Figure 2.
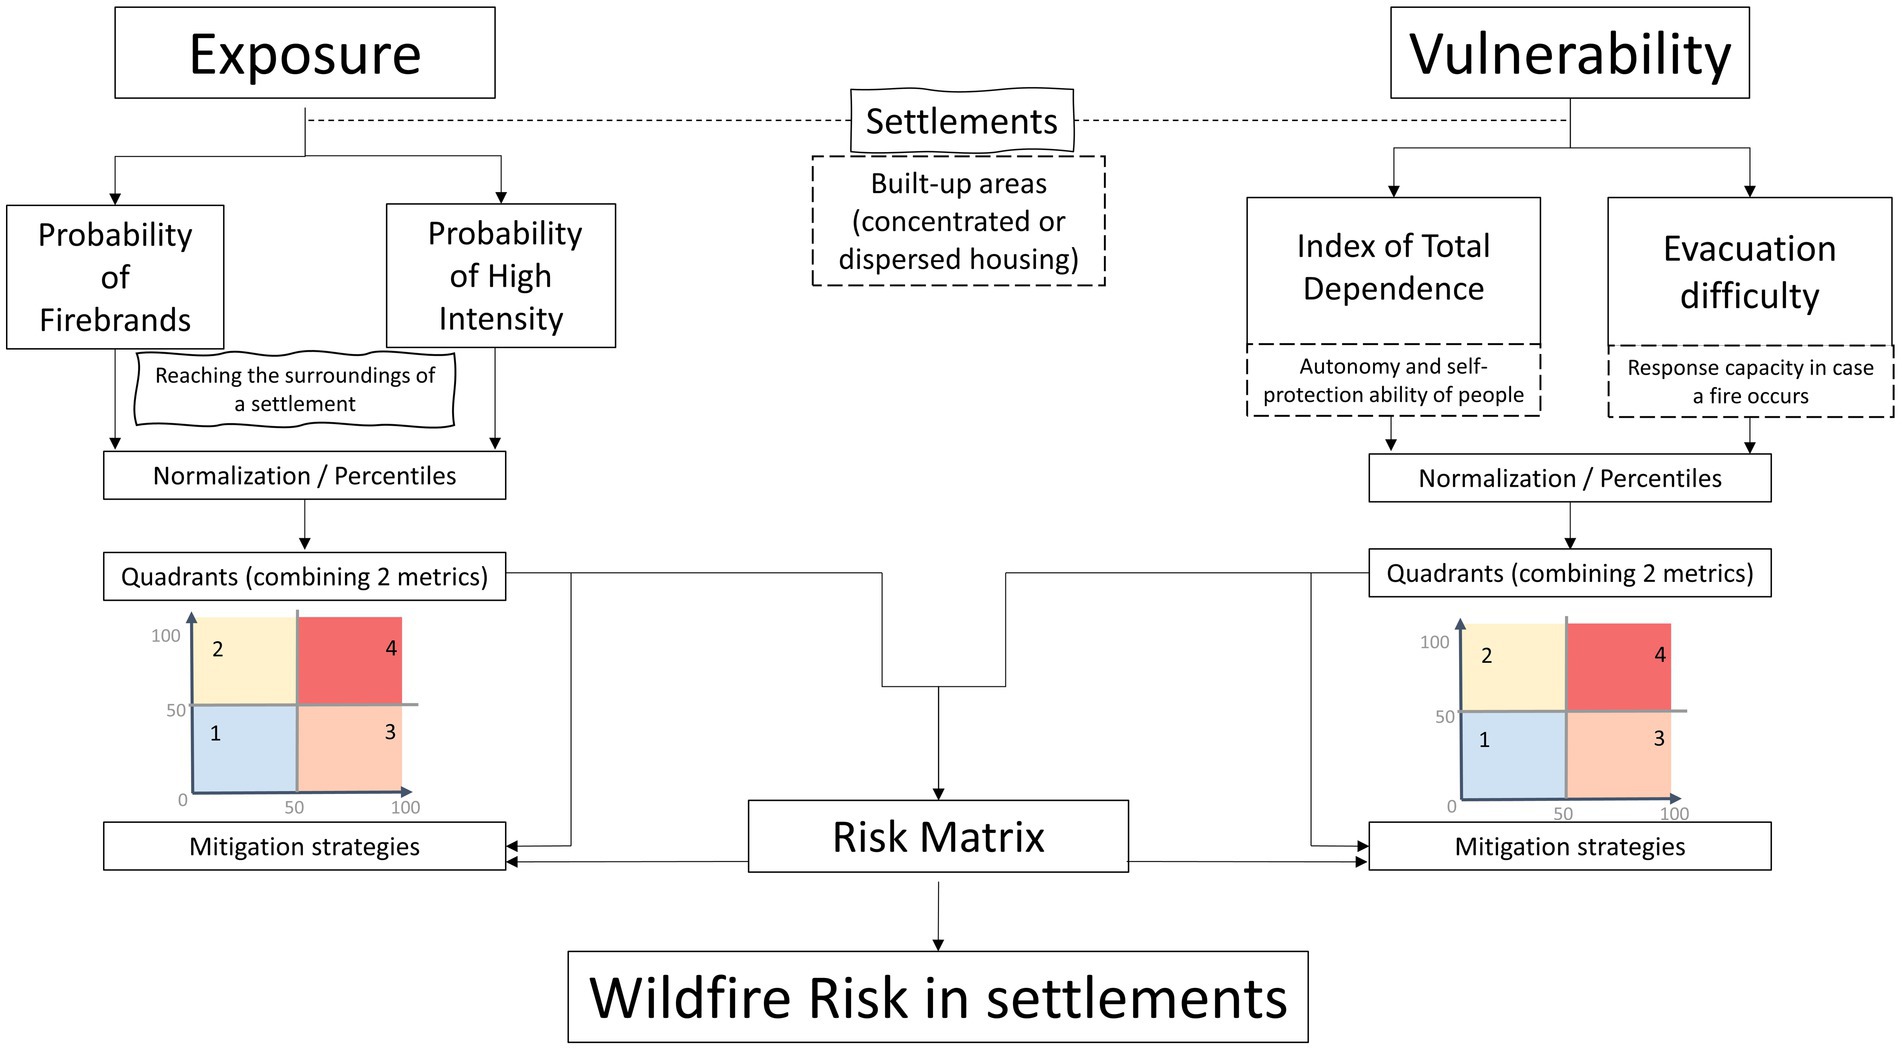
Figure 2. Conceptual approach of wildfire risk estimation in settlements.
3.2 Fire exposure
Exposure to wildfires refers to the probability of a wildfire to occur and potentially cause losses and damages, and depends on various factors that affect fire behavior and regime, such as ignition patterns, weather and fuel conditions. We used a stochastic fire simulation approach to estimate potential fire behavior in the landscape, with particular focus in the surroundings of settlements. We used the minimum travel time algorithm (MTT) (Finney et al., 2011) implemented in the FConstMTT command line version to model fire growth in the three study areas. The MTT algorithm computes a two-dimensional fire growth by identifying the pathways with the shortest fire spread times from the cell corners. Surface fire spread is predicted using Rothermel’s model (Rothermel, 1972) and fireline intensity (kW m−1) using Byram’s equation (Byram, 1959) and converted to flame length (FL). Flame length, which is converted to flame length (FL) is a proxy of suppression difficulty and spotting activity (Tedim et al., 2018). MTT and FConstMTT have been widely used as a fire simulation tool, in multiple contexts and geographies (e.g., Alcasena et al., 2019; Palaiologou et al., 2020; Salis et al., 2021; Sá et al., 2022). It is important to note that semi-empirical simulations are affected by several sources of uncertainties (e.g., Benali et al., 2016b) and are likely to underestimate the behavior of extreme wildfires, particularly when their main drivers are not accounted for in the fire spread models (e.g., strong pyroconvection).
The density of exposed elements (resident population and number of buildings) were not included in the exposure dimension, to avoid biasing values in larger and more populated settlements, but whose surroundings are usually less fire-prone. On the contrary, smaller and more dispersed settlements, with low number of inhabitants, tend, in the geographic context of mainland Portugal, to have a greater WUI extent and be more exposed to intense and more damaging wildfires.
3.2.1 Data for fire simulation
Fire simulation requires (at least) input data on (i) weather, (ii) topography, fuel models and canopy cover and, (iii) ignition(s).
The meteorological conditions associated with large historical fires (≥100 ha) were obtained by extracting ERA5-Land meteorological variables (Muñoz-Sabater et al., 2021) associated in space with the Portuguese fire-atlas perimeters for 2001–2022 (ICNF, 2023b) and, in time, with the correspondent burning dates (Benali et al., 2016a).
Slope and aspect were derived from the European Digital Elevation Model (EU-DEM, version 1.1). Historical fuel maps were constructed using a simplified version of the methodology developed by Sá et al. (2023), combining (i) COS2018 and Corine Land Cover 2018 (CLC2018) (European Environment Agency, 2018), (ii) the year since the last fire, estimated from the Portuguese fire-atlas, and (iii) shrub type (Sá et al., 2023). The fuel models correspond mostly to the typology developed by Fernandes et al. (2009) for Portugal, complemented with model 4 from Anderson (1982) to represent dense pine regeneration stands. Landscape data were gridded at a common spatial resolution of 100 m.
The historical pattern of ignitions (2001–2022) was defined using data from the Forest Fire Information Management System (ICNF, 2023a) for the Portuguese mainland territory, combined with data from Mahood et al. (2022) for the bordering Spanish territory. Ignitions that led to large fires (≥100 ha) were then used to derive an ignition probability surface using kernel density interpolation method. The bandwidth required for the kernel density function was calculated independently for each study area by using the Moran’s I test, following previous work (Alcasena et al., 2021).
3.2.2 Calibration
The simulation system was calibrated for each study area considering the 2001–2022 period and performance was evaluated by comparing (i) the historical vs. estimated fire size distribution, and (ii) the spatial distribution of observed fire frequency vs. simulated burn probability. The recently developed MTTfireCAL Package for R (Aparício et al., 2023) was used to calibrate FConstMTT for each study area. Overall, FConstMTT was able to reproduce the observed historical fire patterns in all the study areas. The calibration process is detailed in supplementary material.
3.2.3 Fuel scenarios
Once FConstMTT was calibrated for the three study areas, two scenarios were run changing the fuel conditions in the landscape according to different target years: (1) 2023 (i.e., short-term scenario), and (2) 2030, assuming that no fuel management nor large fires occurred until that year (i.e., medium-term worst-case scenario). For the latter, we assumed that fuel builds up through time according to the empirical rules defined in Sá et al. (2023). For each study area, a large number of ignitions were simulated to saturate the landscape so that more than 99% of the burnable cells burned at least once. Simulations had a 100 m resolution, and both spotting and fire suppression were not simulated.
3.2.4 Exposure metrics
For each fuel scenario and study area, we estimated the annual burn probability (aBP) and the flame length probability (FLP) for posterior analyses. Burn probability provides an estimate of how likely a given pixel will burn. The aBP was calculated to allow comparisons between the three study areas, as follows:
where the aBPj is the annual burn probability at the j-th pixel, Nj is the number of times the j-th pixel burned, and Y is the number of simulated years (Finney et al., 2011). The FLP provides the probability the j-th pixel will burn with a given flame length, considering 0.5 m bins ranging from 0 to 10 m.
The exposure of settlements was quantified using two metrics: (i) the probability of a wildfire generating firebrands (i.e., spotting) that could reach a settlement (Pfbrand) (Figure 3A), and; (ii) the probability of a wildfire reaching a settlement’s adjacency with high intensity flames (Pflame) (Figure 3B). Both reflect very different conditions under which a settlement might be exposed to a wildfire.
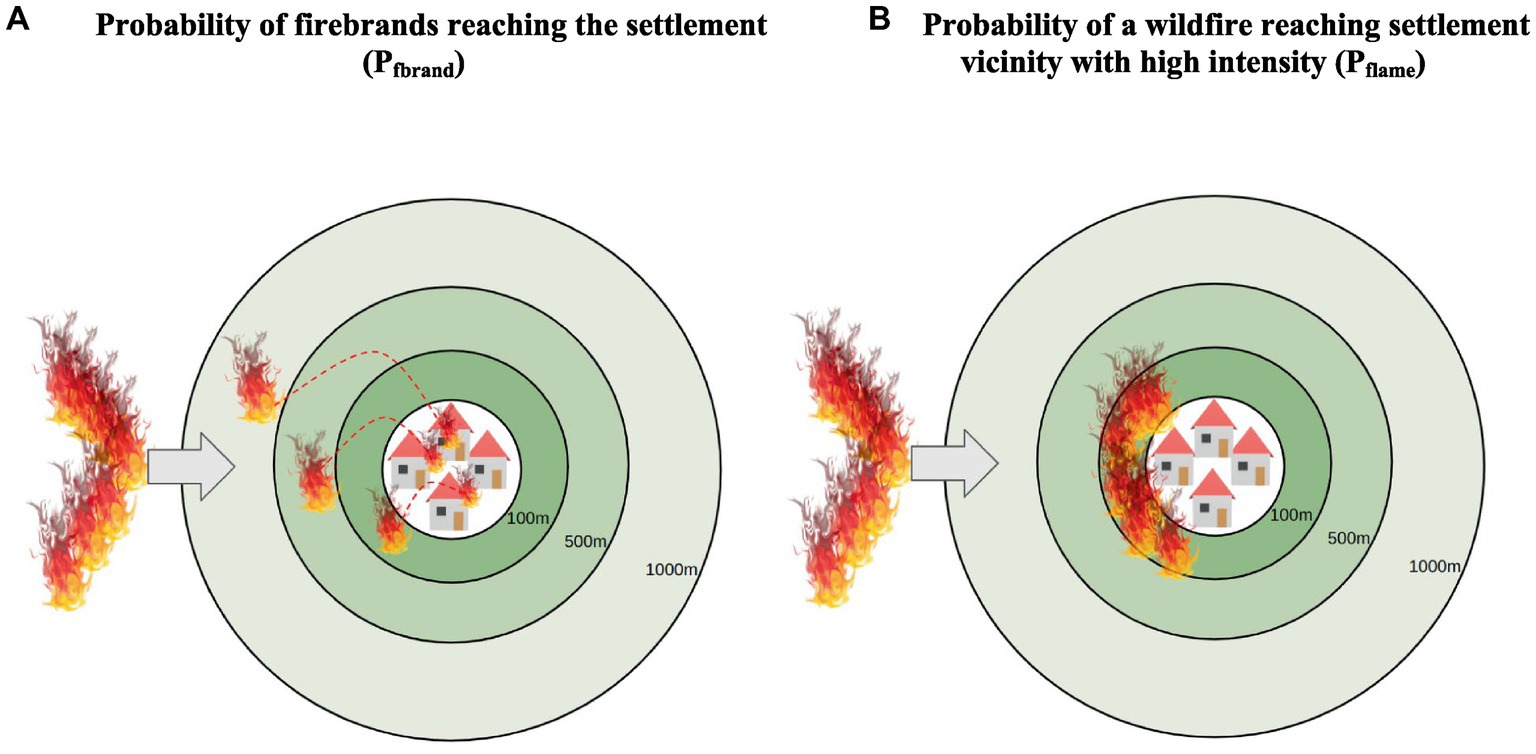
Figure 3. Schematic description of how the probabilities of occurrence of spot fires (A) and the probability of high intensity fire in the direct surrounding of settlements (B) are calculated. When a wildfire reaches the surroundings of a settlement, the probability of spot fires affecting the settlement is calculated separately for three different buffers (100, 500, and 1,000 m) and combined afterwards into a unique value (A). When a wildfire grows and reaches the inner buffer (100 m), the probability of it burning with high intensity is estimated (B).
The probability of a firebrand reaching a settlement (Pfbrand) results from the combination of the probability of a fire reaching its surroundings (assumed as ≤1,000 m) and the probability of burning with enough intensity to generate embers (i.e., it is a conditional probability). Since spotting was not explicitly simulated, we used the maximum spotting distance expected under different surface fire intensities, as presented in Tedim et al. (2018). The spotting probability was estimated for three buffer distances around settlements: 100, 500, and 1,000 m (Figure 3). Pfbrand was then averaged considering the estimates for all the pixels located up to 1,000 m of a settlement.
Similarly, the probability of a fire reaching the direct vicinity of a settlement with high intensity (Pflame) was calculated at the pixel-level as the combination of a wildfire burning in areas closer than 100 m of built up areas with a flame length larger than 2.5 m (equivalent to 2,000–4,000 kW m−1), following the work of Lozano et al. (2017):
Where Pflame(j) is the probability of the j-th pixel to burn with a FL larger than 2.5 m; FLPi is the flame length probability of a fire at the flame length category equal or greater than 2.5 m in j-th pixel, and aBPj is the annual burn probability in the j-th pixel. Pflame was then averaged considering the estimates for all the pixels up to 100 m distance of a settlement.
3.3 Vulnerability
Vulnerability refers to the ability of the inhabitants to cope with wildfires and reduce their propensity for losses or damages.It depends on individual (e.g., age) and collective (e.g., proximity to fire stations) characteristics. Vulnerability analysis, when applied at the municipal or civil parish level in Portugal, can incorporate multiple variables that are aggregated into a composite index (e.g., Bergonse et al., 2022). These aggregated indices are useful when representing larger territories, however, are unable to distinguish vulnerability levels for small human settlements or specific built-up areas (villages). Therefore, and due to data constraints at this scale, vulnerability was based on a smaller set of variables that could be retrieved for each settlement. To describe the vulnerability of each settlement, we calculated two distinct metrics: (i) the Index of Total Dependence, related with social vulnerability, and (ii) the evacuation difficulty, related with response capacity.
3.3.1 Index of total dependence
The Index of Total Dependence (IDT) is a proxy for lack of autonomy and protection capacity of the resident population, estimated based on the age group distribution. IDT was calculated using the following formula provided by Statistics Portugal (INE, 2011):
where:
• pop0-14, number of inhabitants aged up to 14 years (inclusive)
• pop>65, number of inhabitants aged 65 years or older
• pop15-64, number of inhabitants aged between 15 and 64 years
The base assumption is that, the higher the proportion of “dependent” inhabitants (ages from 0 to 14 and > 65) in relation to the more autonomous inhabitants (ages between 15 and 64), the higher the vulnerability of a settlement.
Data on population age groups were obtained from the 2021 census, specifically from the information at the subsection level of the Geographic Reference Base of Information (BGRI) (INE, 2021). The boundaries of the subsections to which the age groups data are available do not match the boundaries of the settlements obtained from the built-up areas. As such, the IDT was first calculated for the original subsection level and afterwards a process of spatial intersection was applied to estimate the IDT at the settlement level, by calculating the weighted mean of the IDT values for the intersected area. The resulting IDT was reclassified into six classes:
• No residents (IDT = NA)
• IDT = 0, with numerator = 0 and denominator >0 (no young or elderly, only adult population—very low vulnerability)
• IDT < 100 (more adult population than dependent population—low vulnerability)
• IDT from 100 to 200 (more dependent population than adult population—moderate vulnerability)
• IDT > 200 (dependent population more than twice of the adult population—high vulnerability)
• IDT = 0, with numerator >0 and denominator = 0 (only elderly and young, no adult population—very high vulnerability)
3.3.2 Evacuation difficulty
Evacuation difficulty is a proxy for response capacity and follows the base assumption that the more difficult it is to evacuate a settlement, the more vulnerable it is to losses caused by wildfires. Evacuation difficulty for a given settlement was estimated by combining the arrival time to a safe place with the number of road exits. Evacuation difficulty will be greater as the arrival time to a safe location increases and the number of exits decreases. This response capacity variable includes the possibility of staying within the village (equivalent to shelter-in-place) but assuming that people will still need to evacuate to a safe location, instead of staying home. In our calculations, this option was selected when the settlement included already a designated safe location. When this safe location (shelter) was not identified, the possibility of evacuation to a safe location outside the settlement was then preferred. This option derives from the conditions found in small human settlements in the most fire-prone regions of mainland Portugal, characterized by dispersed villages composed of old buildings, many of them vacant and used only seasonally, where the majority of inhabitants are elderly people, and where a robust and fire-resistant building suitable to become a shelter may not exist (Oliveira et al., 2017, 2020).
The arrival time was defined by calculating the shortest cost-distance from a settlement to a safe destination (both inside or outside the study area). We used the road network from HERE (2005). After discussions with several relevant entities, namely ANEPC, ICNF, the National Republican Guard (GNR), AGIF and municipalities, we defined the set of possible safe destinations as: (i) the center location of each civil parish (DGAL, 2023), and (ii) the “Safe Villages” with a shelter implemented, based on information that was provided by ANEPC (last update in December 2022). The cost-distance function from ArcGIS Pro (Environmental Systems Research Institute, 2023) calculates the optimal path between each settlement and the nearest safe destination, following paved roads and taking into account the effect of topography. The distance, obtained in meters, was converted into time (in minutes) assuming the evacuation is done on a vehicle traveling at 50 km/h. The arrival time was then weighted by the number of exits in the settlement. The fewer exits, the greater the time penalty applied, as follows:
• 3 or more exits = calculated arrival time remains the same (i.e., no penalty)
• 2 exits = calculated arrival time + 1/3 of the respective calculated arrival time
• only 1 exit = calculated arrival time + 2/3 of the respective calculated arrival time.
3.4 Settlement wildfire risk
The four metrics representing exposure and vulnerability were individually converted to percentiles according to their distribution in all the study areas. Regarding exposure, the distribution of each metric combined distributions for the two fuel scenarios. Each settlement had a pair of exposure percentile metrics, for each fuel scenario, and a pair of vulnerability percentile metrics, that were separately combined and distributed into four quadrants (Figure 4). Each quadrant combined a specific percentile interval of the metrics, starting from the lowest values (bottom left quadrant) to the highest values (top right quadrant). The combination of exposure and vulnerability metrics in quadrants was meant to provide a simple and quick interpretation regarding the major problems potentially affecting a settlement during a wildfire.
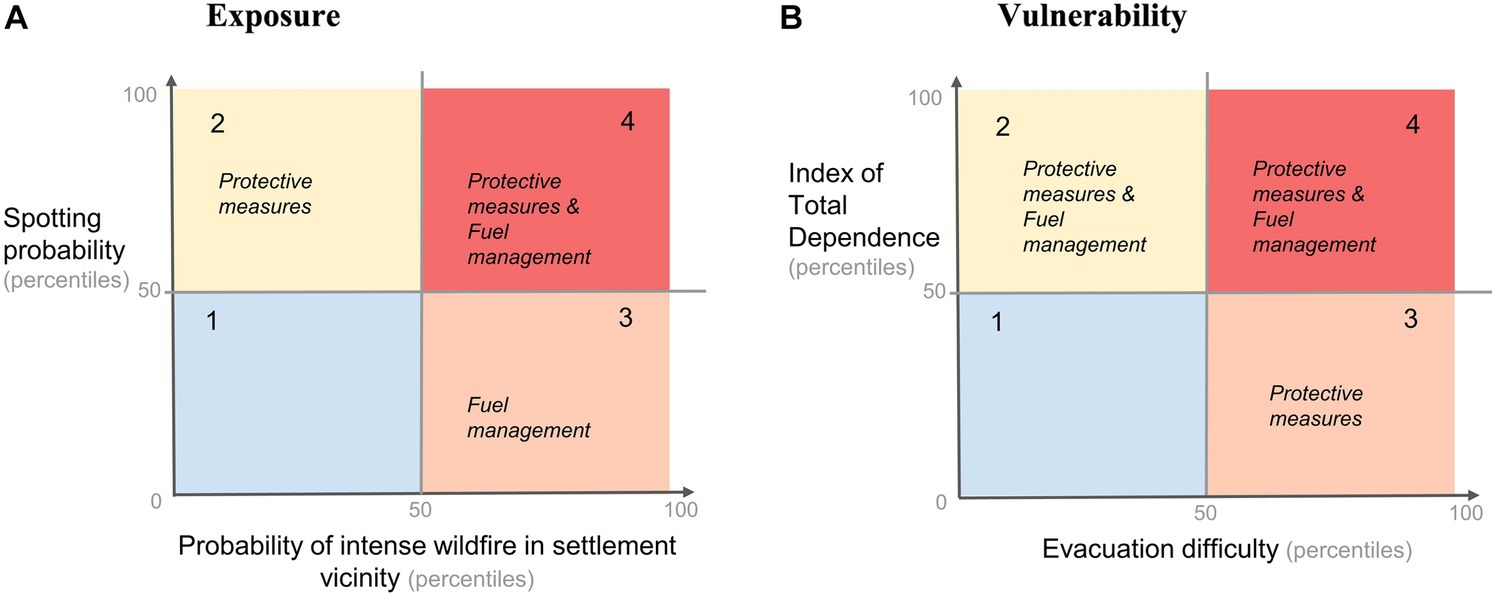
Figure 4. Distribution in quadrants of the metrics that compose the exposure (A) and vulnerability (B). For each quadrant, the priority mitigation actions considered most appropriate are identified.
For each quadrant, based on the framing of each settlement with regard to the exposure/vulnerability metrics, and including expert knowledge and stakeholder consultation (see entities mentioned above), we identified the most suitable and priority mitigation actions to protect people and assets in the settlements.
Regarding exposure (Figure 4A), high Pfbrand (Q1) suggests that fuel management in the surrounding of the settlement may be ineffective and therefore protective measures are priority. On the contrary, high Pflame (Q3) suggests a strong need to implement fuel management in the surrounding of the settlement in order to reduce direct fire intensity. When both, Pfbrand and Pflame are high, both protective measures and fuel management are necessary (Q4). Note that we did not consider fuel management strategies in the landscape as a mitigation option. However, fuel treatments when planned with the objective of settlement protection can reduce both Pfbrand and Pflame, for example, by reducing the probability of a wildfire reaching the surroundings of settlements and/or reducing surface fire intensity and vertical fuel continuity that will reduce the likelihood of spotting.
Regarding vulnerability (Figure 4B), we assumed that a high evacuation difficulty will favor sheltering, and therefore will lead to prioritizing protective measures (Q3). We assumed that a high IDT requires the combination of protective measures and fuel management to reduce vulnerability (Q2), as well as its combination with high evacuation difficulty (Q4).
Fire risk in each settlement was estimated by combining the exposure and vulnerability quadrants (Figure 5). Risk was only calculated for settlements currently with resident population (disregarding seasonal occupants and visitors) and was divided into five classes: very high, high, moderate, low, and very low. A settlement classified as “very high” risk has very high exposure (Q4), characterized by high probability of being affected by firebrands and direct flames, and very high vulnerability (Q4), characterized by a highly dependent population and high evacuation difficulty. Settlements classified as “high” risk can be characterized by very high exposure (Q4) and vulnerability that is at least high in one of its components (either IDT or evacuation difficulty, Q2 or Q3), or very high vulnerability and at least one high exposure component.
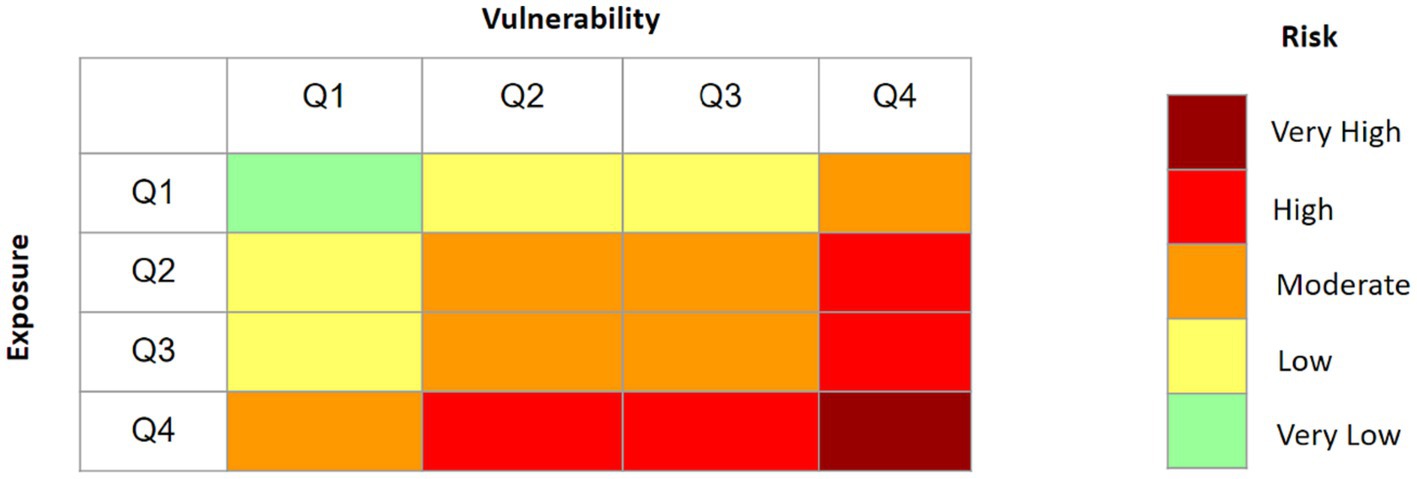
Figure 5. Risk matrix that combines exposure quadrants with vulnerability quadrants into five classes. Q = quadrant as explained in Figure 4.
3.5 Mitigation actions
We evaluated the overall distribution of the number of settlements in each risk class, and compared it with the implementation of two common risk mitigation options in Portugal:
• SPSV programs that promote protective measures and have been implemented in 2,231 settlements across the country. In the study areas, SPSV has been implemented in 81, 104, and 20 settlements in the Alto Tâmega, Coimbra and Barlavento Algarvio, respectively. Data was provided by ANEPC.
• Village Condominium, which promotes short and long-term fuel management measures, has been implemented in 105 settlements in Portugal. Village Condominiums have been implemented in 6, 46, and 19 settlements in the Alto Tâmega, Coimbra and Barlavento Algarvio study areas, respectively. Data was provided by Fundo Ambiental, AGIF and the municipalities.
Note that data regarding the execution of mandatory fuel management actions were not available.
4 Results
4.1 Wildfire risk estimates in settlements: short-term scenario (2023)
Out of the 12,915 settlements analyzed in the three study areas, 8.7% were classified as having “very high” wildfire risk, considering the short-term fuel scenario (year 2023), and about 19.5% had “high” wildfire risk. The distribution of the short-term wildfire risk in the settlements is quite heterogeneous for the three study areas (Figure 6). Alto Tâmega has 26% of settlements in the two highest risk classes, Coimbra has 14%, and Barlavento Algarvio has 36%. Out of the c.a. 426,400 inhabitants, the settlements identified as having “very high” and “high” wildfire risk have 8,403 and 34,762 inhabitants, respectively, which together correspond to about 10% of the total population in the study areas.
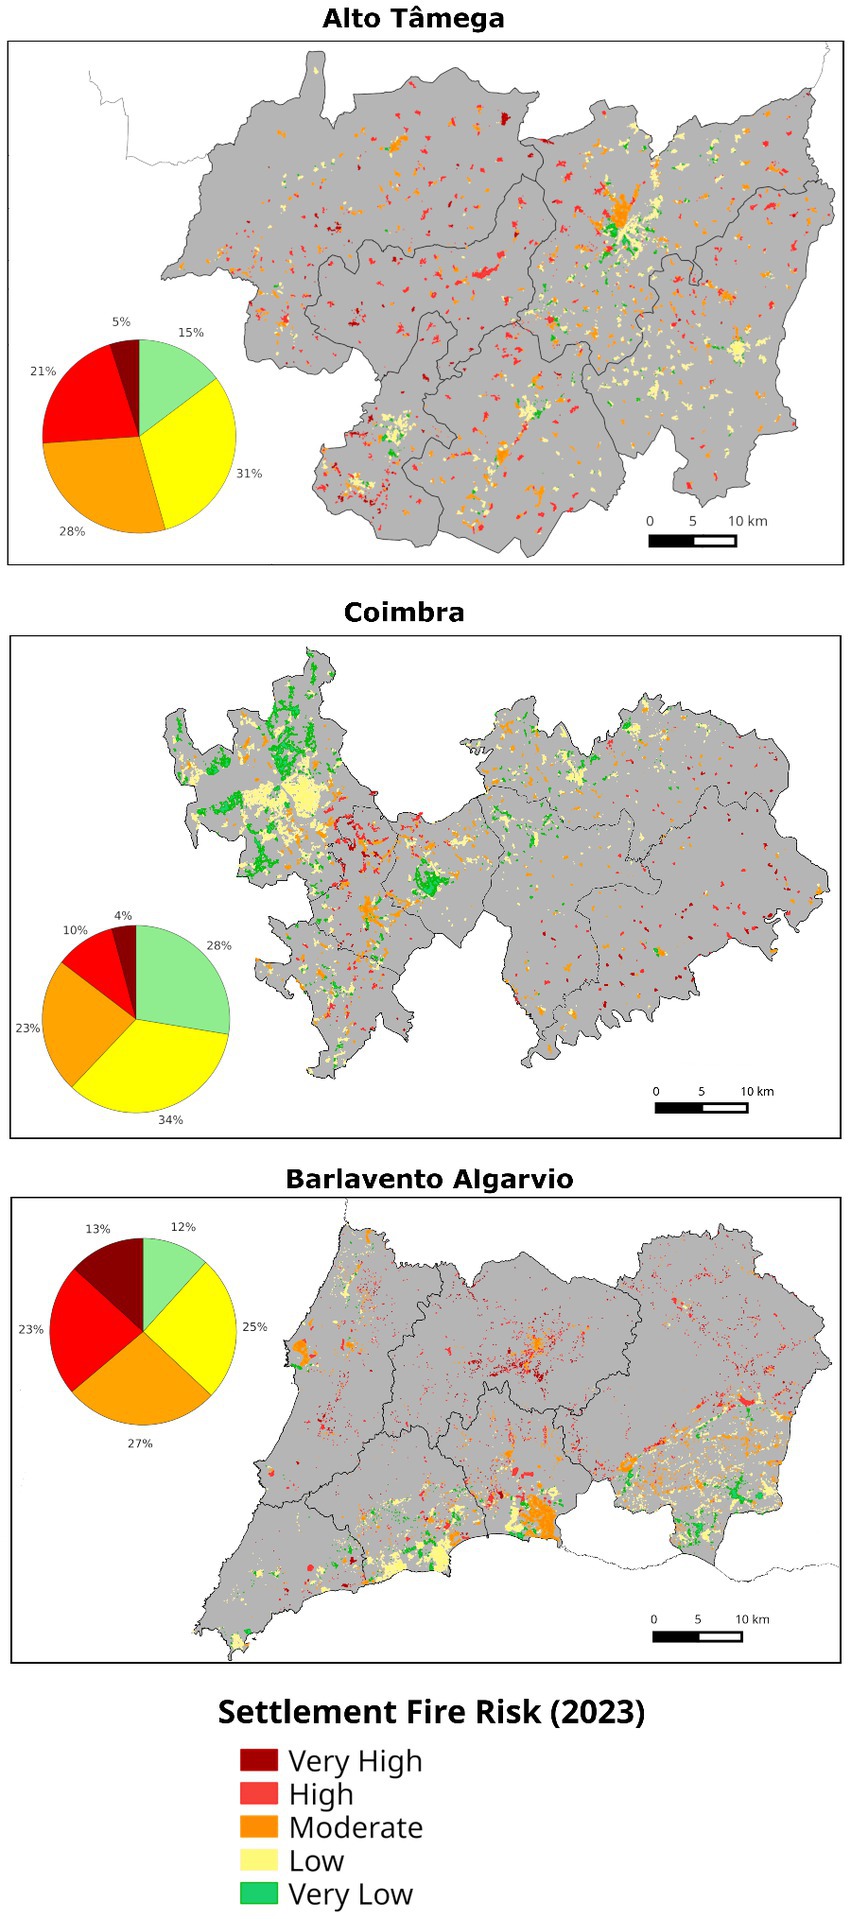
Figure 6. Spatial distribution of fire risk in settlements (2023) for the three study areas.
In Alto Tâmega, the highest risk settlements are mostly located in forest and shrublands that have not burned for more than 10 years (center and western part), while the lowest risk settlements are located nearby agroforestry and cropland areas (eastern part), as well as areas that regardless of the dominant land cover were affected by several large wildfires in 2022 (Figure 6).
In Coimbra, the lowest risk settlements are located in the west (municipality of Coimbra) and mostly correspond to large concentrated housing areas that were affected by the very large wildfires of 2017 (Figure 6). The highest risk settlements are located in two main areas: (i) settlements of concentrated housing in the western part that have not burned for at least 10 years; and (ii) settlements of dispersed housing, with an aged population, in the east\southeastern part. Both areas are dominated by shrublands and both eucalypt and pine forests (Figure 1).
Barlavento Algarvio has the highest number of settlements of the three study areas, a large part of them are small and isolated groups of houses, usually located along roads, creating a very distinct pattern of dispersed built-up areas (Figure 6). The highest risk settlements are located in the forested mountains of Monchique and most of them are associated with dispersed housing and isolated built-up areas. The lowest risk settlements are located in the south, in less fire prone areas dominated by agriculture and with a relatively younger population when compared with the Monchique area (as well as the other study areas).
The distribution of exposure and vulnerability factors (metrics) varies across the study areas. In Alto Tâmega, 30% of the settlements are exposed to a high probability of being affected by firebrands and direct flames (Q4), while other 23% are exposed due to high firebrand probability (Figure 7). More than 40% of the settlements have low exposure (Q1). In terms of vulnerability, only 17% of the settlements are in Q4. The highly aged population stands out, particularly considering the large percentage of settlements in Q2 (42%). In Alto Tâmega, risk stems mostly from the fact that more than half of the settlements are exposed due to potentially high intensity wildfires that can generate medium to long-distance embers and are vulnerable due to a highly dependent and aged population.
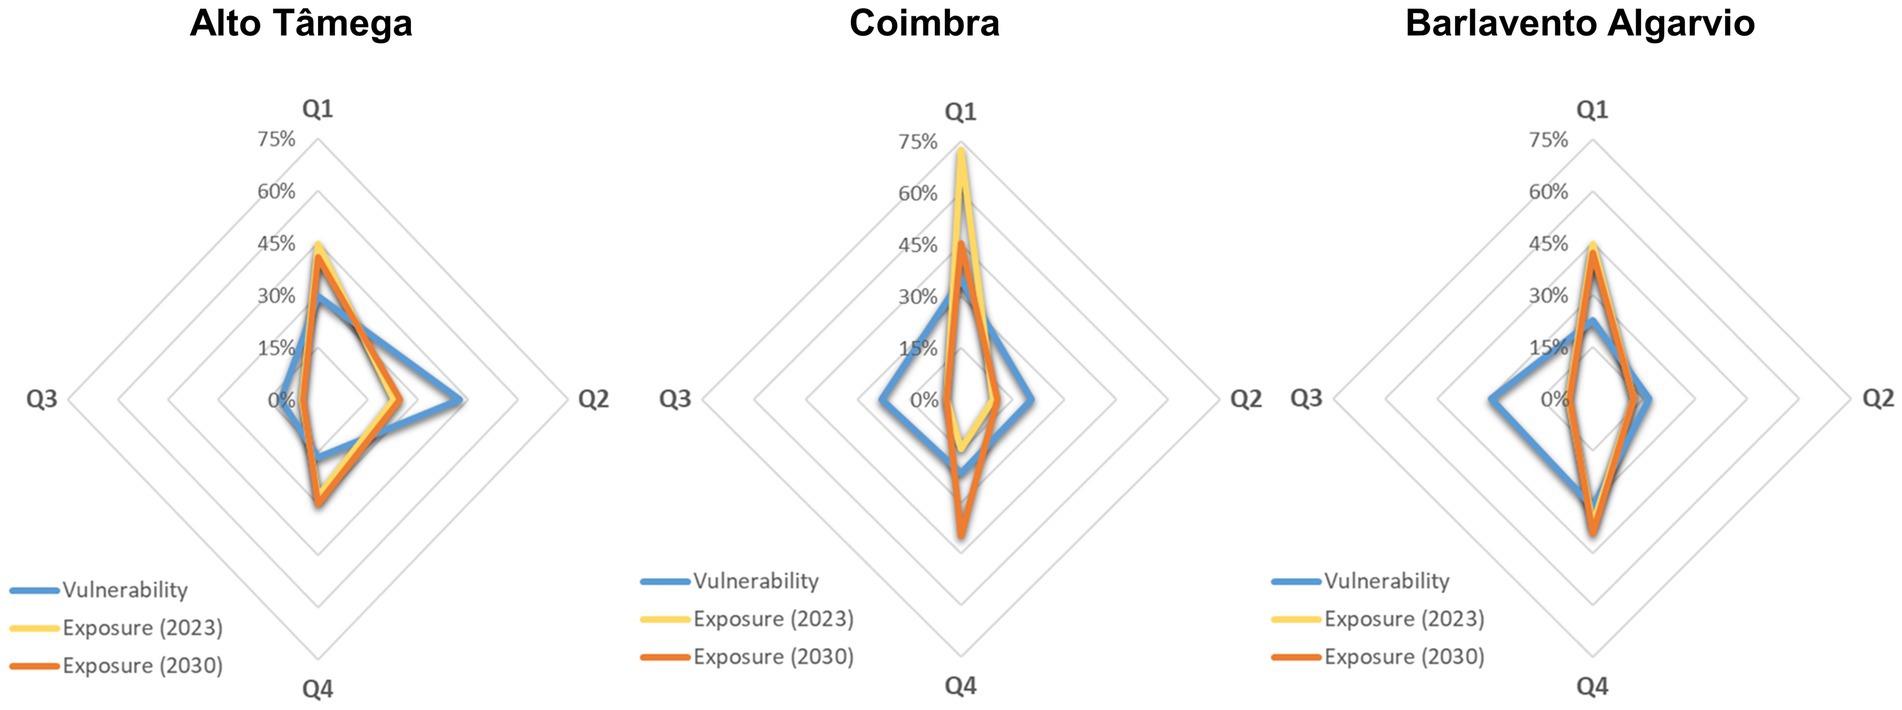
Figure 7. Relative frequency of exposure and vulnerability for each quadrant, divided by study area. Exposure is divided in two scenarios: short-term (2023) and medium-term (2030). The quadrants are described in Figure 4.
In Coimbra, the relative distributions of exposure and vulnerability are different from Alto Tâmega (Figure 7). Most of the settlements still have low exposure (72%, Q1), due to the large extent of burned area in 2017, and only 15% of the settlements have high exposure (Q4). Exposure increases as a function of all components and there does not seem to be a dominant factor, contrary to Alto Tâmega where Pfbrand was the most relevant. Vulnerability is more evenly distributed in Coimbra than in Alto Tâmega, with almost the same percentage associated with Q2, Q3, and Q4 (ca. 20%).
In Barlavento Algarvio, the shape of exposure is similar to Coimbra (Figure 7). Both have similar fire regimes (in most of their area) and had large wildfires in recent years, although in Barlavento Algarvio the extension was lower than in Coimbra. About 37% of the settlements have high exposure (Q4) and, as in Coimbra, there is no dominant exposure factor. Regarding vulnerability, the shape is largely different from the remaining study areas. About 30% of the settlements have high vulnerability (Q4), which corresponds to the highest value in all study areas, and 29% have large evacuation difficulties (Q3). Thus, evacuation difficulty is high for 61% of the settlements.
4.2 Wildfire risk estimates in settlements: medium-term scenario (2030)
Assuming no large wildfires nor large-scale fuel treatments\LULC conversion occur in the study areas until 2030, fuel build-up will increase exposure in 14% of the settlements. The largest increase is projected to occur in Coimbra, as shown in Figure 6, due to the increase of available fuel through time. In 2030, 14 years would have passed since the extensive 2017 burned area, which is coherent with the average time between large wildfires in the Central region of Portugal and characterizes the large, intense and infrequent regime that dominates Coimbra’s study area.
Exposure does not increase uniformly with time (Figure 8). The highest exposure quadrant (Q4) receives 10% of the changes out of the total 14%, which are mostly due to steep increases in low exposure settlements (Q1 in 2023). This shows again that, in Coimbra and Barlavento Algarvio, increases in exposure can be due to increases in both factors considered (Pfbrand and Pflame). The remaining increases of exposure to Q4 are 1.3% from Q3 and 2.2% from Q2. Increases from Q1, other than to Q4, occur mostly to Q2 (3.2%), particularly in Alto Tâmega. Considering only changes to exposure, 11.5% of the settlements will have increases in their wildfire risk.
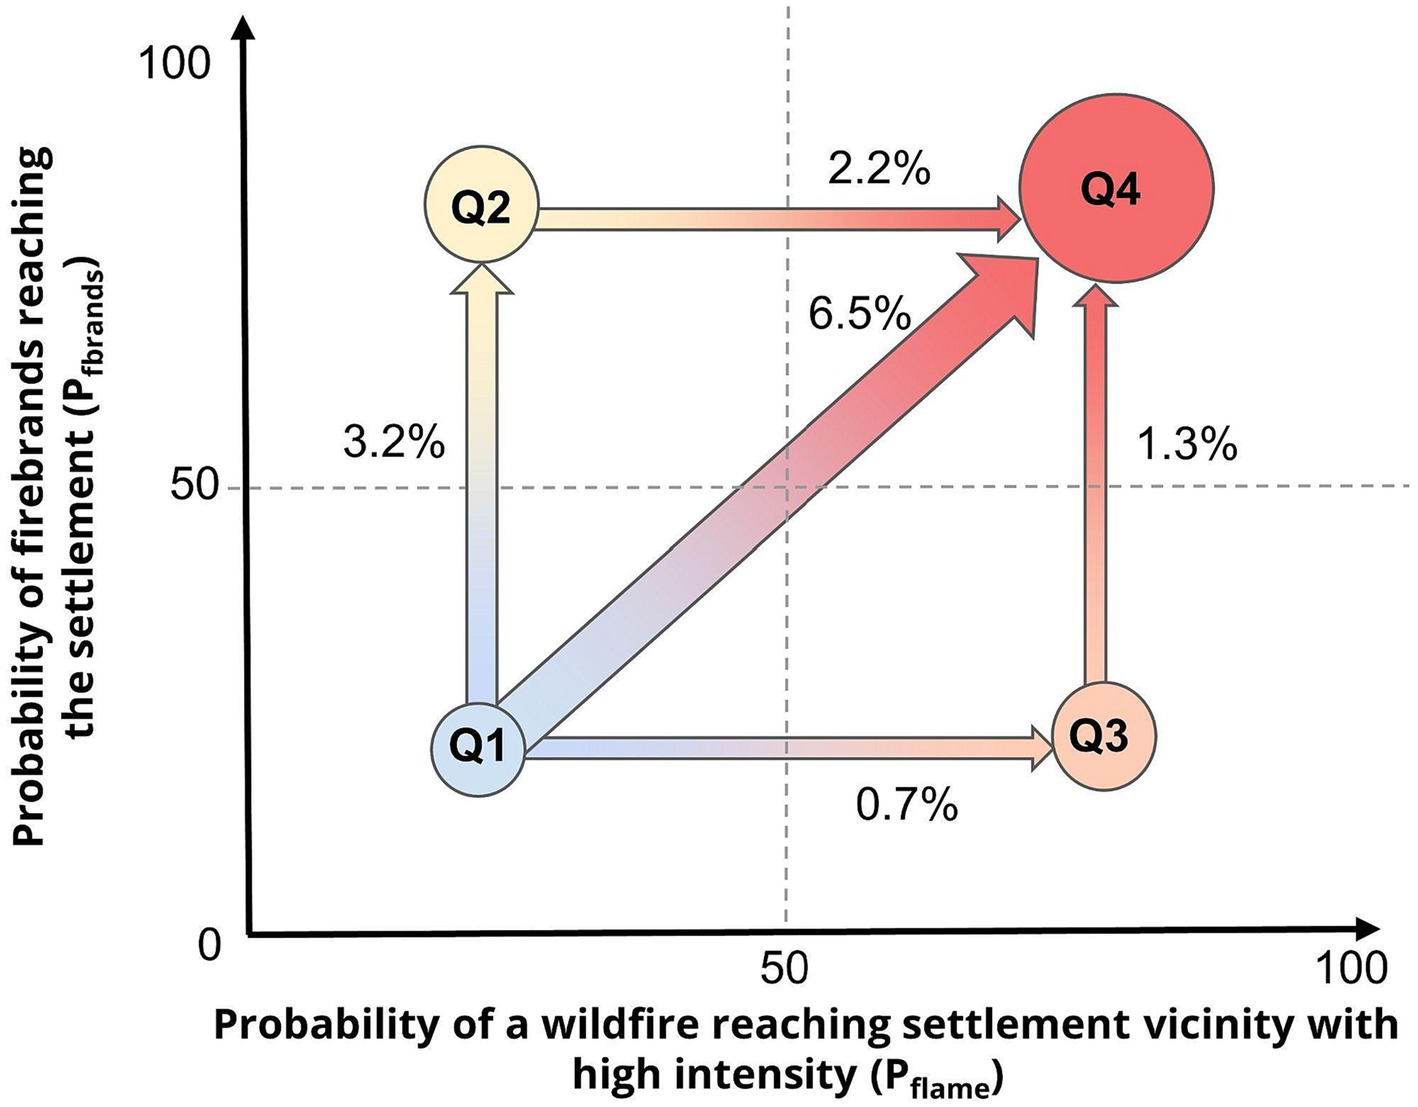
Figure 8. Percentage of settlements that change its exposure quadrant from 2023 to 2030.
4.3 Wildfire risk mitigation actions
The higher the risk in the settlements, the more urgent it is to intervene and implement mitigation actions. The type and priority of the mitigation actions depend on the combination of exposure and vulnerability and their underlying factors (section 3.4).
For each exposure and vulnerability quadrant, we proposed priority mitigation actions (Figure 3) and compared them the implementation rate of two common mitigation programs in Portugal: the “Safe Village, Safe People” (SPSV) and the “Village Condominium” (VC) that are broadly focused on protective measures and fuel management, respectively (Table 1).
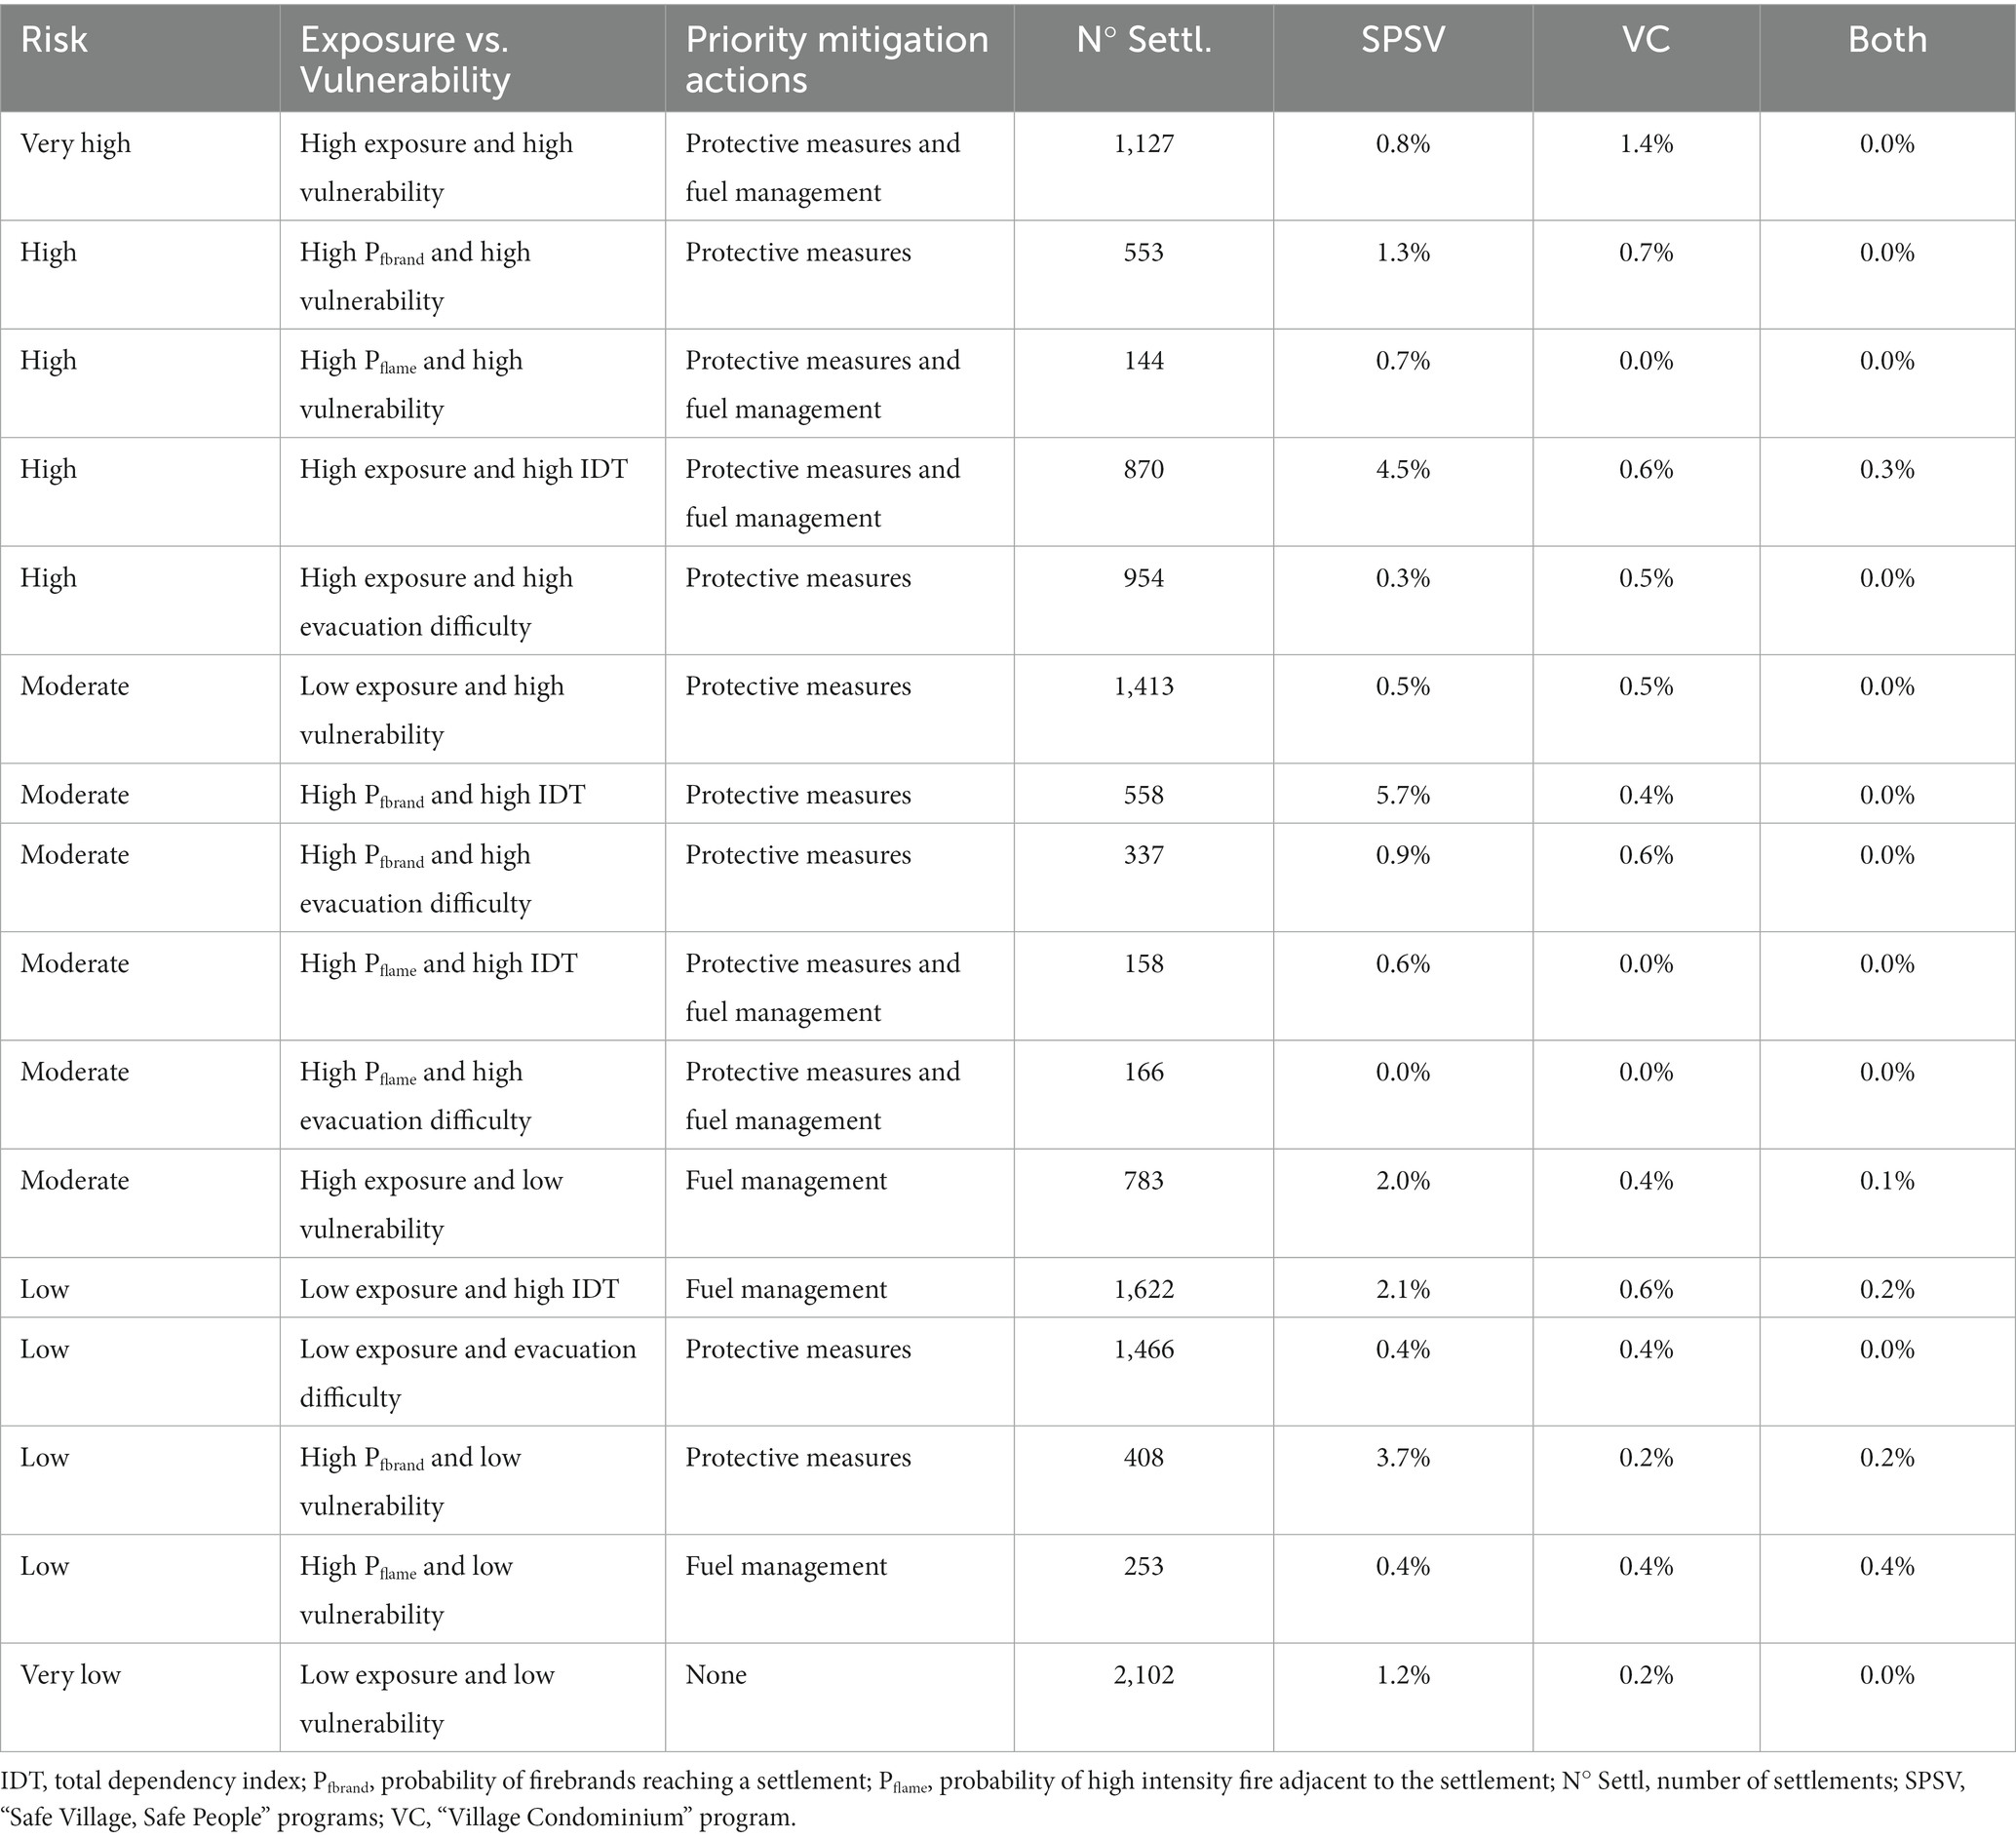
Table 1. Detailed comparison between proposed priority mitigation actions according to exposure/vulnerability quadrants and corresponding metrics, and two mitigation programs being implemented in the country.
Results showed that the overall implementation of the mitigation actions in the study areas is very low. About 1.5% of the settlements have SPSV implemented, and about 0.5% have the VC implemented. Both are simultaneously implemented only in 0.1% of the settlements. The implementation of SPSV and VC in very high risk settlements is 0.8% and 1.4% respectively, and in high risk settlements is 2% and 0.5%. Considering the broad risk levels, the implementation of SPSV is lowest in the “very high” risk (0.8%) and highest in the “high” risk settlements (2.0%), with remaining classes ranging between 1.2 and 1.8%. Regarding the VC program, the implementation is highest in the “very high” risk (1.4%) and lowest in “very low” risk settlements (0.2%), while the intermediate classes have around 0.5% implementation.
The implementation of mitigation actions is much higher in Coimbra than the remaining study areas. In particular, 6% and 3% of “high” and “very high” risk settlements have SPSV and VC implemented, respectively. On the other hand, Barlavento Algarvio has the lowest SPSV implementation rate (0.2%), and a VC implementation rate similar to Alto Tâmega (c.a. 0.3%).
Settlements with “very high” risk, have high exposure and high vulnerability, thus require a combination of protective measures and adjacent fuel treatments. In total, 1,102 settlements require immediate intervention, divided in 178 in Alto Tâmega, 115 in Coimbra and 809 in Barlavento Algarvio, this particular area having a large number of scattered and small settlements. However, overall only 0.8% of the settlements have the SPSV programs implemented and 1.4% have the VC implemented. None have both programs implemented simultaneously. These results stress the urgency of implementing mitigation actions in “very high” risk settlements to reduce the probability of potential negative impacts on people and assets.
Settlements in “high” risk require (at least) protective measures to mitigate wildfire impacts. The SPSV program is currently implemented in 2.0% of “high” risk settlements, a considerably larger value than in the ones with “very high” risk (0.8%). Notably, three high risk settlements have both actions being implemented, which contrasts with the generic absence of simultaneous implementation of both programs in the settlements classified as moderate, high and very high risk.
The SPSV program has been implemented in 1.8% of the moderate, 1.5% of the low and 1.2% of the very low risk settlements. The VC program has been implemented in 0.4% of moderate and low risk settlements and 0.2% of very low risk settlements. Results show that the implementation values in lower risk classes are in the same magnitude as in settlements classified with higher risk.
5 Discussion
5.1 Insights on risk analysis for human settlements
We proposed a simple yet meaningful methodology to estimate wildfire risk and identify priority mitigation actions in settlements. Its application enabled identifying 8.7% out of 12,915 settlements in the three study areas that currently show “very high” risk. These settlements have c.a. 8,403 inhabitants (c.a. 2% of the total) and the large majority might require mitigation actions associated with both protective measures, to increase the response capacity of residents, and fuel management in the surrounding area to decrease exposure. Identifying the location of these very high risk settlements can help prioritize efforts to protect people and assets, a topic that is further discussed in section 5.2.
The methodology captured a large spatial variability in settlement risk, exposure and vulnerability levels, between as well as within each study area. The lower risk areas are commonly associated with LULC dominated by agroforestry and croplands, and\or with larger settlements that have a high number of evacuation exits and a low fraction of dependent population. These low risk patterns are clear in the eastern part of Alto Tâmega, the northwest of Coimbra (coinciding with the location of Coimbra’s urban area), and the south/southeast of Barlavento Algarvio.
The configuration of exposure and vulnerability components is different for each study area and provides useful information for the risk analysis, helping to understand which type of mitigation actions can be more effective in reducing wildfire risk. In Alto Tâmega, threats to settlements are mostly due to high firebrand probability and a highly dependent population, contrasting with different exposure\vulnerability configurations found in Coimbra and Barlavento Algarvio. In the latter, exposure is driven by both Pflame and Pfbrand, which can be explained by the high fuel continuity and the low number of relevant cropland\agroforestry buffers adjacent to settlements (in contrast with Alto Tâmega). The higher vulnerability in Coimbra and Barlavento Algarvio seems to be driven mostly by evacuation difficulty, which may be explained by the large number of settlements located in convoluted mountainous areas where the road network is sparse.
Barlavento Algarvio has the highest number of settlements in “high” and “very high” risk (36%), and a large fraction of them are isolated settlements. Prior studies have pointed out that housing arrangement and location are relevant factors for explaining damages and structure loss caused by wildfires, particularly in shrubland-dominated areas with low housing density (Syphard et al., 2012; Moritz et al., 2014). It has also been argued by local stakeholders that the scattered spatial distribution of settlements in Barlavento Algarvio hampers the effectiveness of mitigation programs, which in turn may explain their very low implementation rate. The scattered settlements are often distributed along a road, which can explain the high vulnerability associated with evacuation difficulty (Figure 6). Regardless, we were able to identify clusters of settlements with high and very high risk where mitigation actions are needed. Previous research carried out in the central USA found that combining different mitigation strategies, at building and at the landscape levels, had the highest exposure reduction (Alcasena et al., 2022).
Vulnerability is spatially heterogeneous due to the presence of municipalities with very different spatial arrangements of settlements, population age distribution and road network characteristics. Strategies related to demographic issues, such as aging population reflected in the IDT metric, are not handled directly by wildfire management, and the reduction in vulnerability levels must be linked to improving the coping capacity of the population, as also indicated by prior studies done in Portugal (Oliveira et al., 2020; Bergonse et al., 2022).
The methodology captured the risk patterns associated with the different components and underlying factors and allowed to quantify the expected risk evolution in the forthcoming years. Results suggest that the short and medium-term risk estimates could be combined to define different priorities of intervention in settlements. For example, Coimbra has the lowest number of settlements in “high” and “very high” risk (14%), reflecting the recent extreme fire seasons in the region (ICNF, 2023a). However, the scenario analysis suggests that this number could increase in the forthcoming years due to an increase in exposure caused by fuel build-up. In addition, considering the overall aging trend in most municipalities, one should expect a wildfire risk increase in more than 11.5% of the settlements, considering that no measures that reduce exposure and\or vulnerability are implemented.
5.2 Insights on the implementation of mitigation actions
The configuration of the exposure and vulnerability components is different for each study area and acknowledging these differences is critical to define the most suitable and efficient strategies to reduce wildfire risk. We analyzed two very distinct mitigation programs: SPSV and VC. The application of the risk methodology based on exposure and vulnerability quadrants, and associated priority mitigation actions, can help decision-makers to frame the problem and define the main types of actions that can be used to reduce potential negative wildfire impacts. Overall, results showed that the rate of implementation of mitigation actions is low, but most importantly, they suggest that the decision-making criteria used on these mitigation measures are not fully consistent with the risk levels in human settlements and may include other factors that have not been integrated in this analysis (e.g., willingness of residents to accept the implementation of mitigation actions). Other characteristics of the communities, such as their institutional and social diversity or the economic means of the residents, influence their capacity and willingness to engage in preparedness and mitigation actions (Paveglio et al., 2009; Chas-Amil et al., 2022). The benefit of using a straightforward risk methodology is that it provides a sound and quantitative background, easy to interpret, to further support such decisions (implement mitigation actions, and if yes, which type?).
The comparison between proposed and implemented actions for moderate, low and very low risk must be done with caution. First, it should be noted that the VC program started in 2020 and SPSV in 2018. Second, exposure varies from year to year, mostly depending on fuel continuity and availability. Considering the recent occurrence of very large wildfires in the study area of Coimbra (2017), Barlavento Algarvio (2018, 2020, and 2021), and Alto Tâmega (2022), the implementation of SPSV and VC programs could have been done in periods when exposure was perceived as high. A detailed assessment is beyond the scope of the work. Nevertheless, the comparison between estimated risk, proposed priority mitigation actions and implemented (or planned) mitigation actions can provide relevant insights on how decision-making has been made.
5.3 Strengths of the risk methodology
The methodology combines two components, exposure and vulnerability, each obtained from the analysis of two specific metrics. Both risk components can be described using a large number of variables, as it has been done in prior research (Palaiologou et al., 2019; Bergonse et al., 2022). However, one of the strengths of the proposed methodology is the inclusion of a small set of relevant variables that can be easily quantified without the need, for example, of detailed and often unavailable local settlement data (e.g., mobility of inhabitants and house construction materials).
The work developed allows the identification of the settlements at higher wildfire risk and provides information on the type of mitigation measures that are most suitable to minimize risk. Having a sound and straightforward risk analysis methodology provides objective and independent means to evaluate the quality of decisions typically made at a local-level (i.e., monitoring) and target the actions that maximize the protection of people and assets balanced by cost-effective investments (i.e., planning; Calkin et al., 2014). The risk analysis using scenarios provides the decision-maker with a planning perspective in the short and medium term, as demonstrated here with the fuel scenarios for 2023 and 2030, respectively.
Nonetheless, the methodology has other relevant applications. It can be used to (i) target awareness raising campaigns prior and during the fire season; (ii) help prioritize the supervision of mandatory fuel treatments around built-up areas; (iii) improve the allocation of pre-suppression resources, including deterrent surveillance actions; (iv) support a rapid assessment during a wildfire to mitigate potential negative impacts. For the latter application, the conceptual approach could, for example, be applied to near-real time fire spread simulation.
Another important aspect of the methodology is that it entails the potential wildfire behavior in the risk analysis, considering two distinct threats to the settlements: (i) the probability of a settlement being affected by firebrands (Pfbrand), and (ii) the probability of a wildfire reaching a settlement’s adjacency with high intensity flames (Pflame). Combining fire spread simulations with easily available census and settlement data, can be replicated to perform a national-level settlement risk analysis. One of its benefits is the fact that the most relevant changes in the landscape (e.g., wildfires, fuel treatments, LULC change) can be incorporated in the simulations (by changing the fuel maps), frequently updating the risk analysis across time.
5.4 Limitations of the risk methodology and future improvements
The limitations of the risk analysis methodology are mainly associated with the estimation of exposure, vulnerability and the combination of both into risk.
The exposure estimation is dependent on reliable flame length (or fireline intensity) predictions. The recent calibration package developed by Aparício et al. (2023) ensures that the model is well calibrated based on the spatial pattern of fire occurrrence and fire size distribution. However, due to the lack of observed fire behavior data it does not guarantee accurate estimates of rate-of-spread nor flame length. Recently published fire behavior data for Portugal (Benali et al., 2023) can, in principle, be used to improve FConstMTT calibration in the future.
Other relevant aspects regarding flame length estimation are: (i) accurate canopy data, which is currently not available for Portugal; (ii) more accurate and higher resolution fuel models. Regarding the first issue, LIDAR data combined with field data has the potential to improve the characterization of the canopies (e.g., Kelly et al., 2017). When such data is accurate enough and freely available for the entire Portuguese territory it could be used to improve flame length and spotting probability estimations. Regarding the second issue, DGT has recently created a simplified annual land cover map with a 10 m resolution (DGT, 2023b) that can help improve both the resolution, as well as the accuracy of the fuel model map, thus improving the estimation of fire behavior metrics. Finally, we assumed that spotting distance was only associated with intensity and it was always “aligned” with the settlement. These were necessary simplifications that can be improved in the future, using specific firebrand models (Koo et al., 2010; Albini et al., 2012) or by integrating recent knowledge on the factors that drive spotting activity (Storey et al., 2020).
Regarding vulnerability, a major drawback of an analysis done at the settlement level is the absence of data representing sociodemographic conditions, compatible with such spatial scale. The calculation of the IDT required the intersection of layers obtained at different scales, which can bring uncertainty to the results. Although the estimates obtained are considered sufficiently reliable for permanent residents, they do not include seasonal population, such as immigrants who return to their hometown during summertime or tourists, as such data is unavailable. In this regard, it is important to note that, even if preventive and protective strategies are implemented in the settlements, this seasonal population may not be fully aware of what they should do in case a wildfire occurs.
Another limitation regards the timescale of data used in the two components; whereas exposure can be easily updated in short timeframes (e.g., annually), since it mostly depends on fuel and weather data, the data used for vulnerability assessment regarding population characteristics represents longer timeframes, as the 10-year lag of Census data. These differences in temporal availability must be considered when combining the two components and when monitoring the implementation of mitigation actions.
It is worth mentioning the uncertainties associated with the road network data. It is crucial to frequently update the location and the classification of roadways. This helps understanding the types of existing roads (paved roads, forest paths, etc.), thereby allowing the identification of the most appropriate evacuation routes for people to reach the nearest shelter safely. Another aspect to consider is the necessity of greater precision in the vectorization of roadways, enabling the exclusion of dead-end paths within the settlements that should not be considered during evacuations. By making sure the data is updated frequently and is accurate, it becomes possible to significantly enhance knowledge and the execution of a more efficient evacuation process.
The combination of exposure and vulnerability was made using a simple risk matrix (e.g., Oliveira et al., 2020). The integration of both components can be done in different ways, however, the matrix enables to have a methodology that is simple, meaningful and easily understandable by decision-makers. Describing exposure and vulnerability in quadrants is a good example of a very simple yet robust way of communicating risk. Future improvements should consider the trade-off between complexity and clarity for decision-making.
We acknowledge that the results need to be evaluated, for example, comparing losses and injuries\fatalities in settlements in relation to risk classes. This would require collecting data that, at this moment, is not available in a consistent and systematic way.
Regarding the replication of this methodology at national level, some challenges are foreseen; first, in areas with scarce fire history, estimating exposure will be challenging, as these locations can correspond to areas with very low ignition probability but continuous and high fuel load across that landscape that can lead to intense and large wildfires. In addition, both the estimates for exposure (FCONST MTT calibration and application) and vulnerability (computing distance from settlements to the nearest “safe location”) will require large computing capacity.
6 Conclusion
In this work, we developed a simple robust methodology to quantify the wildfire risk in settlements in the short and medium-term based on a combination of exposure and vulnerability metrics. In addition we also proposed the major mitigation actions more suitable to effectively reduce risk.
Applying the methodology to three study areas, we estimated that, in the short-term, 8.7% of the settlements had “very high” wildfire risk, and about 19.5% had “high” wildfire risk, potentially affecting 8,403 and 34,762 inhabitants, respectively. The spatial distribution of settlements at higher risk was very heterogeneous across the study areas, and the total fraction ranged between 14% in Coimbra to 36% in Barlavento Algarvio.
Results showed that the combination of exposure and vulnerability varies across the study area, which provides useful information for a better risk analysis. The exposure\vulnerability configurations in the three study areas clearly highlighted their differences and can help target effective risk mitigation strategies.
Assuming no large wildfires nor large scale fuel treatments occur until 2030, results suggest that exposure will increase in 14% of the settlements, with the largest increases projected to occur in the Coimbra study area. This corresponds to a risk increase in 11.5% of the settlements, assuming vulnerability conditions will remain unchanged. Results also showed that exposure does not increase uniformly through time and space, and integrating this information in risk analysis could help decision-makers better plan mitigation actions.
Finally, we compared the estimated wildfire settlement risk with two common mitigation programs implemented in Portugal: the “Safe Village, Safe People” and the “Village Condominium.” The overall implementation of these mitigation programs in the study areas is very low. The implementation rate is highest in the Coimbra study area and lowest in the Barlavento Algarvio. Only 0.8 and 1.4% of settlements in “very high” risk had SPSV and VC implemented, respectively. Results also showed that the implementation rate in lower risk classes is in the same order of magnitude of higher risk classes.
The application of this risk analysis methodology can be used to evaluate the implementation of mitigation actions, target the actions that maximize the protection of people and assets using cost-effective investments.
Data availability statement
The raw data supporting the conclusions of this article will be made available by the authors upon request, without undue reservation.
Author contributions
AB: Conceptualization, Investigation, Writing – original draft, Writing – review & editing. BA: Investigation, Methodology, Writing – review & editing. AG: Investigation, Methodology, Writing – review & editing. SO: Investigation, Methodology, Writing – review & editing.
Funding
The author(s) declare financial support was received for the research, authorship, and/or publication of this article. This study was funded by the project FRISCO: Managing Fire-induced Risks of Water Quality Contamination (PCIF/MPG/0044/2018) funded by Fundação para a Ciência e a Tecnologia I.P. (FCT). The Forest Research Centre, a research unit was funded by FCT (UIDB/00239/2020). AB was funded by FCT through a CEEC contract (CEECIND/03799/2018/CP1563/CT0003). BA was supported by the Ph.D. fellowship funded by FCT (UI/BD/150755/2020). SO was funded by FCT through a CEEC contract (2020.03873.CEECIND). AG was supported by the Ph.D. fellowship funded by FCT (2020.07651.BD).
Acknowledgments
The authors would like to thank the representatives of AGIF, GNR, ANEPC, DGT, ICNF, Secretaria de Estado das Florestas and from all of the municipalities in the three study areas for providing data and valuable inputs that helped to develop the proposed risk methodology. This collaboration was possible thanks the European Union via the Structural Reform Support Programme in cooperation with the Directorate General for Structural Reform Support of the European Commission under the project (REFORM/SC2021/063).
Conflict of interest
The authors declare that the research was conducted in the absence of any commercial or financial relationships that could be construed as a potential conflict of interest.
Publisher’s note
All claims expressed in this article are solely those of the authors and do not necessarily represent those of their affiliated organizations, or those of the publisher, the editors and the reviewers. Any product that may be evaluated in this article, or claim that may be made by its manufacturer, is not guaranteed or endorsed by the publisher.
Supplementary material
The Supplementary material for this article can be found online at: https://www.frontiersin.org/articles/10.3389/ffgc.2023.1270210/full#supplementary-material
References
AGIF (2021). National action plan. Available at: https://www.agif.pt/en/national-action-plan (Accessed July 2023).
Albini, F. A., Alexander, M. E., and Cruz, M. G. (2012). A mathematical model for predicting the maximum potential spotting distance from a crown fire. Int. J. Wildland Fire 21, 609–627. doi: 10.1071/WF11020
Alcasena, F. J., Ager, A. A., Bailey, J. D., Pineda, N., and Vega-García, C. (2019). Towards a comprehensive wildfire management strategy for Mediterranean areas: framework development and implementation in Catalonia, Spain. J. Environ. Manag. 231, 303–320. doi: 10.1016/j.jenvman.2018.10.027
Alcasena, F., Ager, A. A., Belavenutti, P., Krawchuk, M., and Day, M. A. (2022). Contrasting the efficiency of landscape versus community protection fuel treatment strategies to reduce wildfire exposure and risk. J. Environ. Manag. 309:114650. doi: 10.1016/j.jenvman.2022.114650
Alcasena, F., Ager, A., Le Page, Y., Bessa, P., Loureiro, C., and Oliveira, T. (2021). Assessing wildfire exposure to communities and protected areas in Portugal. Fire 4:82. doi: 10.3390/fire4040082
Anderson, H. E. (1982). Aids to determining fuel models for estimating fire behavior USDA Forest Service, Intermountain Forest and Range Experiment Station Available at: https://www.nwcg.gov/sites/default/files/training/docs/s-290-usfs-aids-to-determining-fuel-models.pdf.
ANEPC (2023b). Operational decision support system (SADO) National Authority for Emergency and Civil Protection (ANEPC).
ANEPC (2023a). Safe village, safe people programs Available at: https://aldeiasseguras.pt/ (Accessed January 2023).
Aparício, B. A., Benali, A., Pereira, J. M., and Sá, A. C. (2023). MTTfireCAL package for R—an innovative, comprehensive, and fast procedure to calibrate the MTT fire spread modelling system. Fire 6:219. doi: 10.3390/fire6060219
Beighley, M., and Hyde, A. C. (2018). Portugal wildfire management in a new era assessing fire risks, resources and reforms. Indep. Rep. 9:52.
Benali, A., Ervilha, A. R., Sá, A. C., Fernandes, P. M., Pinto, R. M., Trigo, R. M., et al. (2016b). Deciphering the impact of uncertainty on the accuracy of large wildfire spread simulations. Sci. Total Environ. 569-570, 73–85. doi: 10.1016/j.scitotenv.2016.06.112
Benali, A., Guiomar, N., Gonçalves, H., Mota, B., Silva, F., Fernandes, P. M., et al. (2023). The portuguese large wildfire spread database (PT-FireSprd). Earth Syst Sci Data 15, 3791–3818. doi: 10.5194/essd-15-3791-2023
Benali, A., Russo, A., Sá, A. C., Pinto, R. M., Price, O., Koutsias, N., et al. (2016a). Determining fire dates and locating ignition points with satellite data. Remote Sens. 8:326. doi: 10.3390/rs8040326
Bergonse, R., Oliveira, S., Santos, P., and Zêzere, J. L. (2022). Wildfire risk levels at the local scale: assessing the relative influence of Hazard, exposure, and social vulnerability. Fire 5:166. doi: 10.3390/fire5050166
Byram, G. M. (1959). “Combustion of forest fuels” in Forest fire: control and use. ed. K. P. Davis (New York, NY: McGraw-Hill), 61–89.
Calkin, D. E., Cohen, J. D., Finney, M. A., and Thompson, M. P. (2014). How risk management can prevent future wildfire disasters in the wildland-urban interface. Proc. Natl. Acad. Sci. U.S.A. 111, 746–751. doi: 10.1073/pnas.1315088111
Canadas, M. J., Leal, M., Soares, F., Novais, A., Ribeiro, P. F., Schmidt, L., et al. (2023). Wildfire mitigation and adaptation: two locally independent actions supported by different policy domains. Land Use Policy 124:106444. doi: 10.1016/j.landusepol.2022.106444
Carroll, M., and Paveglio, T. (2016). Using community archetypes to better understand differential community adaptation to wildfire risk. Philos. Trans. R. Soc. B Biol. Sci. 371:20150344. doi: 10.1098/rstb.2015.0344
Champ, P. A., Donovan, G. H., and Barth, C. M. (2013). Living in a tinderbox: wildfire risk perceptions and mitigating behaviours. Int. J. Wildland Fire 22, 832–840. doi: 10.1071/WF12093
Chas-Amil, M. L., Nogueira-Moure, E., Prestemon, J. P., and Touza, J. (2022). Spatial patterns of social vulnerability in relation to wildfire risk and wildland-urban interface presence. Landsc. Urban Plan. 228:104577. doi: 10.1016/j.landurbplan.2022.104577
Chuvieco, E., Yebra, M., Martino, S., Thonicke, K., Gómez-Giménez, M., San-Miguel, J., et al. (2023). Towards an integrated approach to wildfire risk assessment: when, where, what and how may the landscapes burn. Fire 6:215. doi: 10.3390/fire6050215
Cohen, J. D. (2000). Preventing disaster, home ignitability in the wildland-urban in- terface. J Forestry 98, 15–21. doi: 10.1093/jof/98.3.15
Cova, T. J., Dennison, P. E., and Drews, F. A. (2011). Modeling evacuate versus shelter-in-place decisions in wildfires. Sustainability 3, 1662–1687.
Davim, D. A., Rossa, C. G., Pereira, J. M., and Fernandes, P. M. (2022). Evaluating the effect of prescribed burning on the reduction of wildfire extent in Portugal. For. Ecol. Manag. 519:120302. doi: 10.1016/j.foreco.2022.120302
DGAL (2023). Portuguese rmunicipal portal. Available at: http://www.portalautarquico.dgal.gov.pt/ (Accessed January 2023).
DGT (2018a). Portuguese land cover and land use map for 2018. Available at: https://www.dgterritorio.gov.pt/Carta-de-Uso-e-Ocupacao-do-Solo-para-2018 (Accessed January 2023).
DGT (2018b). Built-up areas cartography for 2018. Geographic information provided by the Directorate-General of the Territory. Available at: https://www.dgterritorio.gov.pt/dados-abertos (Accessed January 2023).
DGT (2023a). Village Condominium program. Available at: https://www.dgterritorio.gov.pt/paisagem/ptp/condominio-aldeia (Accessed July 2023).
DGT (2023b). Portuguese land cover map for 2022. Available at:https://www.dgterritorio.gov.pt/COSc2022-Carta-de-Ocupacao-do-Solo-Conjuntural-de-2022 (Accessed July 2023).
Dunn, C. J., O’connor, C. D., Abrams, J., Thompson, M. P., Calkin, D. E., Johnston, J. D., et al. (2020). Wildfire risk science facilitates adaptation of fire-prone social-ecological systems to the new fire reality. Environ. Res. Lett. 15:15. doi: 10.1088/1748-9326/ab6498
European Environment Agency . (2018). Corine land cover 2018 (CLC2018) - version 20_20. Technical guidelines. Copenhagen: European Environment Agency.
Evers, C. R., Ager, A. A., Nielsen-Pincus, M., Palaiologou, P., and Bunzel, K. (2019). Archetypes of community wildfire exposure from national forests of the western US. Landsc. Urban Plan. 182, 55–66. doi: 10.1016/j.landurbplan.2018.10.004
Fernandes, P., Gonçalves, H., Loureiro, C., Fernandes, M., Costa, T., Cruz, M., et al. (2009). “Modelos de combustível florestal para Portugal” in Actas do. 6º Congresso Florestal Nacional. (Portugal: SPCF, Lisboa), 348–354.
Finney, M. A., McHugh, C. W., Grenfell, I. C., Riley, K. L., and Short, K. C. (2011). A simulation of probabilistic wildfire risk components for the continental United States. Stoch. Env. Res. Risk A. 25, 973–1000. doi: 10.1007/s00477-011-0462-z
Guerreiro, J., Fonseca, C., Salgueiro, A., Fernandes, P., Iglésias, E. L., Neufville, R., et al.. Avaliação dos Incêndios ocorridos entre 14 e 16 de outubro de 2017 em Portugal 837 continental, Comissão Técnica Independente, Lisbon. Available at: https://www.parlamento.pt/Documents/2018/Marco/RelatorioCTI190318N.pdf, (2018).
HERE (2005). Road network dataset for Portugal. Available at: https://www.here.com/navteq (Accessed January 2023).
ICNF (2020). National fire hazard cartography. Available at: https://geocatalogo.icnf.pt/geovisualizador/perigosidade_estrutural_2020_2030.htm (Accessed July 2023).
ICNF (2023a). Sistema de gestão de incêndios florestais (SGIF). Available at: https://fogos.icnf.pt/sgif2010/ (Accessed July 2023).
ICNF (2023b). Portuguese Fire Atlas 1975–2022. Available at: https://geocatalogo.icnf.pt/catalogo_tema5.html (Accessed July, 2023).
INE (2011). System of metainformation. Available at: https://smi.ine.pt/ (Accessed January 2023).
INE (2021). Censos 2021: final results. Available at: https://censos.ine.pt/ (tabular data) and https://mapas.ine.pt/ (BGRI, cartographic data) (Accessed January 2023).
Jahdi, R., Del Giudice, L., Melis, M., Lovreglio, R., Salis, M., Arca, B., et al. (2023). Assessing the effects of alternative fuel treatments to reduce wildfire exposure. J. For. Res. 34, 373–386. doi: 10.1007/s11676-022-01504-2
Kelly, M., Su, Y., Di Tommaso, S., Fry, D. L., Collins, B. M., Stephens, S. L., et al. (2017). Impact of error in lidar-derived canopy height and canopy base height on modeled wildfire behavior in the Sierra Nevada, California, USA. Remote Sens. 10:10. doi: 10.3390/rs10010010
Koo, E., Pagni, P. J., Weise, D. R., and Woycheese, J. P. (2010). Firebrands and spotting ignition in large-scale fires. Int. J. Wildland Fire 19, 818–843. doi: 10.1071/WF07119
Lovreglio, R., Kuligowski, E., Gwynne, S., and Strahan, K. (2019). A modelling framework for householder decision-making for wildfire emergencies. International Journal of Disaster Risk Reduction 41:101274
Lozano, O. M., Salis, M., Ager, A. A., Arca, B., Alcasena, F. J., Monteiro, A. T., et al. (2017). Assessing climate change impacts on wildfire exposure in Mediterranean areas. Risk Anal. 37, 1898–1916. doi: 10.1111/risa.12739
Mahood, A. L., Lindrooth, E. J., Cook, M. C., and Balch, J. K. (2022). Country-level fire perimeter datasets (2001–2021). Sci. Data 9:458. doi: 10.1038/s41597-022-01572-3
Molina-Terrén, D. M., Xanthopoulos, G., Diakakis, M., Ribeiro, L., Caballero, D., Delogu, G. M., et al. (2019). Analysis of forest fire fatalities in southern Europe: Spain, Portugal, Greece and Sardinia (Italy). Int. J. Wildland Fire 28, 85–98. doi: 10.1071/WF18004
Moritz, M. A., Batllori, E., Bradstock, R. A., Malcolm Gill, A., Handmer, J., Hessburg, P. F., et al. (2014). Learning to coexist with wildfire. Nature 515, 58–66. doi: 10.1038/nature13946
Muñoz-Sabater, J., Dutra, E., Agustí-Panareda, A., Albergel, C., Arduini, G., Balsamo, G., et al. (2021). ERA5-land: a state-of-the-art global reanalysis dataset for land applications. Earth Syst. Sci. Data 13, 4349–4383. doi: 10.5194/essd-13-4349-2021
Nolan, R. H., Boer, M. M., Collins, L., Resco de Dios, V., Clarke, H., Jenkins, M., et al. (2020). Causes and consequences of eastern Australia's 2019-20 season of mega-fires. Glob. Chang. Biol. 26, 1039–1041. doi: 10.1111/gcb.14987
Oliveira, S., Gonçalves, A., Benali, A., Sá, A., Zêzere, J. L., and Pereira, J. M. (2020). Assessing risk and prioritizing safety interventions in human settlements affected by large wildfires. Forests 11:859. doi: 10.3390/f11080859
Oliveira, S., Rocha, J., and Sá, A. (2021). Wildfire risk modeling. Curr. Opin. Environ. Sci. Health 23:100274. doi: 10.1016/j.coesh.2021.100274
Oliveira, S., Zêzere, J. L., Queirós, M., and Pereira, J. M. (2017). Assessing the social context of wildfire-affected areas. The case of mainland Portugal. Appl. Geogr. 88, 104–117. doi: 10.1016/j.apgeog.2017.09.004
Palaiologou, P., Ager, A. A., Nielsen-Pincus, M., Evers, C. R., and Day, M. A. (2019). Social vulnerability to large wildfires in the western USA. Landsc. Urban Plan. 189, 99–116. doi: 10.1016/j.landurbplan.2019.04.006
Palaiologou, P., Kalabokidis, K., Ager, A. A., and Day, M. A. (2020). Development of comprehensive fuel management strategies for reducing wildfire risk in Greece. Forests 11:789. doi: 10.3390/f11080789
Paveglio, T. B., Jakes, P. J., Carroll, M. S., and Williams, D. R. (2009). Understanding social complexity within the wildland–urban interface: a new species of human habitation? Environ. Manag. 43, 1085–1095. doi: 10.1007/s00267-009-9282-z
Penman, S. H., Price, O. F., Penman, T. D., and Bradstock, R. A. (2018). The role of defensible space on the likelihood of house impact from wildfires in forested landscapes of south eastern Australia. Int. J. Wildland Fire 28, 4–14. doi: 10.1071/WF18046
Pereira, J. M. C., Silva, P. C., Melo, I., Oom, D., Baldassarre, G., and Pereira, M. G. (2022). Cartografia de Regimes de Fogo à Escala da Freguesia (1980-2017). ForestWISE (Coord.) - Projetos AGIF 2021 (P32100231).
Price, O. F., Whittaker, J., Gibbons, P., and Bradstock, R. (2021). Comprehensive examination of the determinants of damage to houses in two wildfires in eastern Australia in 2013. Fire 4:44. doi: 10.3390/fire4030044
Rothermel, R. C. A mathematical model for predicting fire spread in wildland fuels. US Department of Agriculture, Intermountain Forest & Range Experiment Station, Forest Service: Ogden, UT (1972).
Sá, A. C. L., Benali, A., Aparicio, B. A., Bruni, C., Mota, C., Pereira, J. M. C., et al. (2023). A method to produce a flexible and customized fuel models dataset. MethodsX 10:102218
Sá, A. C. L., Aparicio, B. A., Benali, A., Bruni, C., Salis, M., Silva, F., et al. (2022). Coupling wildfire spread simulations and connectivity analysis for hazard assessment: a case study in Serra da Cabreira, Portugal. Nat. Hazards Earth Syst. Sci. Discuss. 22, 3917–3938. doi: 10.5194/nhess-22-3917-2022
Salis, M., Ager, A. A., Arca, B., Finney, M. A., Bacciu, V., Duce, P., et al. (2012). Assessing exposure of human and ecological values to wildfire in Sardinia, Italy. Int. J. Wildland Fire 22, 549–565. doi: 10.1071/WF11060
Salis, M., Arca, B., Del Giudice, L., Palaiologou, P., Alcasena-Urdiroz, F., Ager, A., et al. (2021). Application of simulation modeling for wildfire exposure and transmission assessment in Sardinia, Italy. Int. J. Disaster Risk Reduct. 58:102189. doi: 10.1016/j.ijdrr.2021.102189
Storey, M. A., Price, O. F., Sharples, J. J., and Bradstock, R. A. (2020). Drivers of long-distance spotting during wildfires in South-Eastern Australia. Int. J. Wildland Fire 29, 459–472. doi: 10.1071/WF19124
Syphard, A. D., Keeley, J. E., Massada, A. B., Brennan, T. J., and Radeloff, V. C. (2012). Housing arrangement and location determine the likelihood of housing loss due to wildfire. PLoS One 7:e33954. doi: 10.1371/journal.pone.0033954
Tedim, F., Leone, V., Amraoui, M., Bouillon, C., Coughlan, M., Delogu, G., et al. (2018). Defining extreme wildfire events: difficulties, challenges, and impacts. Fire 1:9. doi: 10.3390/fire1010009
Keywords: communities, exposure, vulnerability, fire behavior, wildland-urban interface (WUI), coping capacity
Citation: Benali A, Aparício BA, Gonçalves A and Oliveira S (2023) Defining priorities for wildfire mitigation actions at the local scale: insights from a novel risk analysis method applied in Portugal. Front. For. Glob. Change. 6:1270210. doi: 10.3389/ffgc.2023.1270210
Edited by:
Juan Ramón Molina, University of Cordoba, SpainReviewed by:
Nuria Prat-Guitart, Fundación Pau Costa, SpainLuciana Ghermandi, National Scientific and Technical Research Council (CONICET), Argentina
Copyright © 2023 Benali, Aparício, Gonçalves and Oliveira. This is an open-access article distributed under the terms of the Creative Commons Attribution License (CC BY). The use, distribution or reproduction in other forums is permitted, provided the original author(s) and the copyright owner(s) are credited and that the original publication in this journal is cited, in accordance with accepted academic practice. No use, distribution or reproduction is permitted which does not comply with these terms.
*Correspondence: Akli Benali, YWtsaWJlbmFsaUBnbWFpbC5jb20=