 Qi Sheng
 Zhaogang Liu*
- Key Laboratory of Sustainable Forest Ecosystem Management-Ministry of Education, College of Forestry, Northeast Forestry University, Harbin, China
Introduction: Climate change affects forest distribution, species composition, structure, and yield due to the sensitivity of forests to temperature, precipitation, and CO2. Therefore, for forest management decisions regarding climate change, it is crucial to explore the response of forest growth, mortality, and recruitment to future climate. We aimed to establish tree species’ responses by introducing variables such as climate, stand spatial structure parameters, and diversity indices.
Methods: We produced fixed parameter transition matrix model (FM), climate-sensitive matrix growth model (CM) and climate-spatial matrix growth model (SCM) using data from 786 plots collected during the 7th (2010), and 8th (2015), Chinese National Forest Inventories in Heilongjiang Province, and long-term predictive performance of CM, SCM, and FM were compared using same data. The models were compared using tenfold cross-validation and long-term predictive performance analysis. To predict the response of major tree species in the Lesser Khingan Mountains to three future climate change scenarios (RCP2.6, RCP4.5, RCP8.5).
Results and discussion: The cross-validation results show small significant differences among the three models for short-term prediction (5 years), with the FM performing slightly better than the CM and the SCM. In contrast, for long-term projections (85 years), SCM outperformed FM and CM under three different RCPs, and SCM and CM under three representative concentration paths (RCPs), i.e., RCP2.6, RCP4.5, and RCP8.5, suggesting that rather different dynamics are more reliable, since climatic factors are taken into account which may significantly affect forest dynamics, while changes in stand spatial structure also affect the sensitivity of trees to climate, especially in long-term prediction interval, the results of this paper may provide a theoretical basis for optimizing forest management strategies under climate change.
1 Introduction
Global warming has become an important issue of global concern. According to the IPCC, the global average surface temperature increased by 0.85°C from 1880 to 2012 and will continue to increase in the future (Liu et al., 2014; Zhao et al., 2014; Tian et al., 2015). As the main body of forest ecosystems, forests play an important role in maintaining ecological balance, biodiversity, climate regulation, and carbon sequestration. Conversely, climate change will inevitably impact the distribution, species composition, stand structure, and timber harvest of forests (Sibyll et al., 2016; Any et al., 2021; Bayat et al., 2022). Changes in tree species due to climate change often lag changes in tree species abundance or forest composition (Zhu et al., 2012; Akane et al., 2021; Liang et al., 2022), and the effects of climate change on forests and tree species depend on local conditions and physiological thresholds (Allen et al., 2010). As forests grow, trees can absorb carbon dioxide from the air and convert it to biomass through photosynthesis (Zhao et al., 2018; Holtmann et al., 2021).
To project future climate scenarios, the RCP represents the possible future emission pathways (high, medium, and low); the concentrations of CO2, other GHGs, and aerosols are calculated using the carbon cycle climate model; and each concentration path corresponds to the radiative forcing due to concentrations in 2100 (2.6, 4.5 and 8.5 W/m2). The Northeast China region is mainly characterized by an increase in temperature and precipitation under the three different RCP scenarios, but at different rates (Chen et al., 2008; Xu and Xu, 2012; Zhu et al., 2021). While temperature and precipitation play key roles in influencing forest growth and forest dynamics, it is critical to accurately estimate the impact of climate change on future tree growth and mortality and the differential response of different tree species, to address forest management under climate change (Yang et al., 2006; Gustafson et al., 2020 Guo et al., 2022; Ma et al., 2023;).
A research hotspot is the use of growth models to study the response of forest growth and harvesting to climate change. The matrix growth model, on the other hand, represents the state of the stand distribution at a given time in terms of vectors. It simulates and predicts changes in the structural state of uneven-aged forests using a transition matrix. Later, researchers used the matrix model as the basis for forest management by fitting the dynamic growth system model of natural uneven-aged forests using tree recruitment, diameter upward growth, and mortality (Hao et al., 2005; Choi and An, 2008). Early applications of matrix growth models used fixed transition matrix, indicating that stand diameter growth, recruitment, and mortality probabilities do not change with time or environment, but fixed transition matrix models excel at short-term prediction (Roberts and Hruska, 1986; Roitman and Vanclay, 2015). However, forest dynamics are closely related to stand conditions and the stand environment and they do change over time (Liang et al., 2011; Liang and Picard, 2013), so the accuracy of long-term predictions cannot be guaranteed. By replacing the fixed transition matrix with a variable that is limited by stand (stand density, stand structure), site (elevation, slope, aspect), and environmental (temperature, precipitation) drivers, the above problems are more fully addressed, and the model becomes more accurate and robust in the long-term (Liang et al., 2005; Zhao et al., 2005; Du et al., 2020; Zhang et al., 2022).
Traditionally, the growth of trees has been mainly influenced by the size of the trees themselves, competition factors, and stand conditions, but as research progresses, an increasing number of scientists are focusing on the effects of stand spatial structure and stand diversity on stand growth (Wang et al., 2016; Vannoppen et al., 2019). There is a significant correlation between species diversity, tree size diversity, and stand growth, and climate warming will lead to changes in these patterns of dominance and species composition relationships (Here et al., 2020; Campbell et al., 2021). Regarding forest structure, the forest spatial structure focuses on the arrangement of trees across a landscape and their associated characteristics. Tree growth and mortality, competition between trees, and natural regeneration all affect the spatial arrangement of tree characteristics and thus the structural characteristics of forests. Climate change affects forest structure and function to some extent. Tree competition, distribution patterns, stand structural diversity, and mixed degree all influence forest growth and productivity (Murray and Woodward, 2003; Young et al., 2011; Hui et al., 2019).
Based on the above, this study aimed to (1) introduce climate, diversity indicators, stand spatial structure parameters, and stand factors based on the traditional matrix growth model and then establish a climate-sensitive matrix growth model (CM) and a climate-spatial matrix growth model (SCM) for different tree species in the study area. This was to reveal the relationship between stand growth, recruitment, and mortality with climate, stand spatial structure, and species diversity; and (2) assess and contrast the effectiveness of the SCM with a fixed parameter transition matrix model (FM) and a climate-sensitive transition matrix model (CM); and (3) investigate the response of different tree species in the Lesser Khingan Mountains to future climate change and simulate changes in stand density, basal area, and diversity indices under three future RCP scenarios to provide a basis for forest management under climate change.
2 Method
2.1 Study site
The study area is in the northern part of Heilongjiang Province in the Lesser Khingan Mountains, 46°10′22″–51°2′22″N, 125°54′00″–130°56′00″E, close to the Russian region, separated by the Heilongjiang River. The Lesser Khingan Mountains are a key forestry base in China, with rich forest vegetation and forest coverage rate of 72.6%. The eastern part of the Lesser Khingan Mountains belongs to the Changbai flora, which contains more than 2,000 species of plants and undisturbed forests with dense trees and ground cover above and below the forest canopy. The climate is cold and humid, with a minimum temperature of −48.1°C and a maximum temperature of 37.7°C. The frost-free period is 100–125 days, and the ground is covered with snow for 6 months of the year. The annual snow thickness is 30–60 cm; the annual precipitation is 480–650 mm and is mostly concentrated in June–August due to the warm and rainy summer, providing a short and favorable season for forest growth. There are many valuable species in the Lesser Khingan Mountains, such as Picea asperata Mast, Abies fabri, and Pinus koraiensis Sieb. Among them, broad-leaved forests are the most abundant and they play an important role in maintaining the ecological balance in China.
2.2 Data and pre-analysis
This paper uses the national forest inventory established in the Lesser Khingan Mountains for different stand conditions, in different forests, and at different densities and elevations; the data include the seventh (2010) and eighth (2015) National Forest Inventory (NFI) plots of 0.06 ha in the area. Clearly disturbed plots, such as logging or artificial disturbance, were excluded, and a total of 786 plot observations were selected. Tree species, number, diameter at breast height (DBH), condition, and coordinates were recorded, and the elevation, slope, aspect, and other stand factors were investigated (see Tables 1, 2).
Table 1. The main tree species surveyed in plots.
Table 2. Plot information statistics.
2.3 Climate data
In this study, the climate data were downloaded from,1 a database of high spatial resolution (1 km × 1 km) global weather and climate data. We chose the average annual temperature and average annual precipitation, summarized as annual averages by ArcGIS 10.8 software. The descriptions of climate variables are shown in Figure 1. MAP and MAT represent mean annual temperature and mean annual precipitation, respectively.
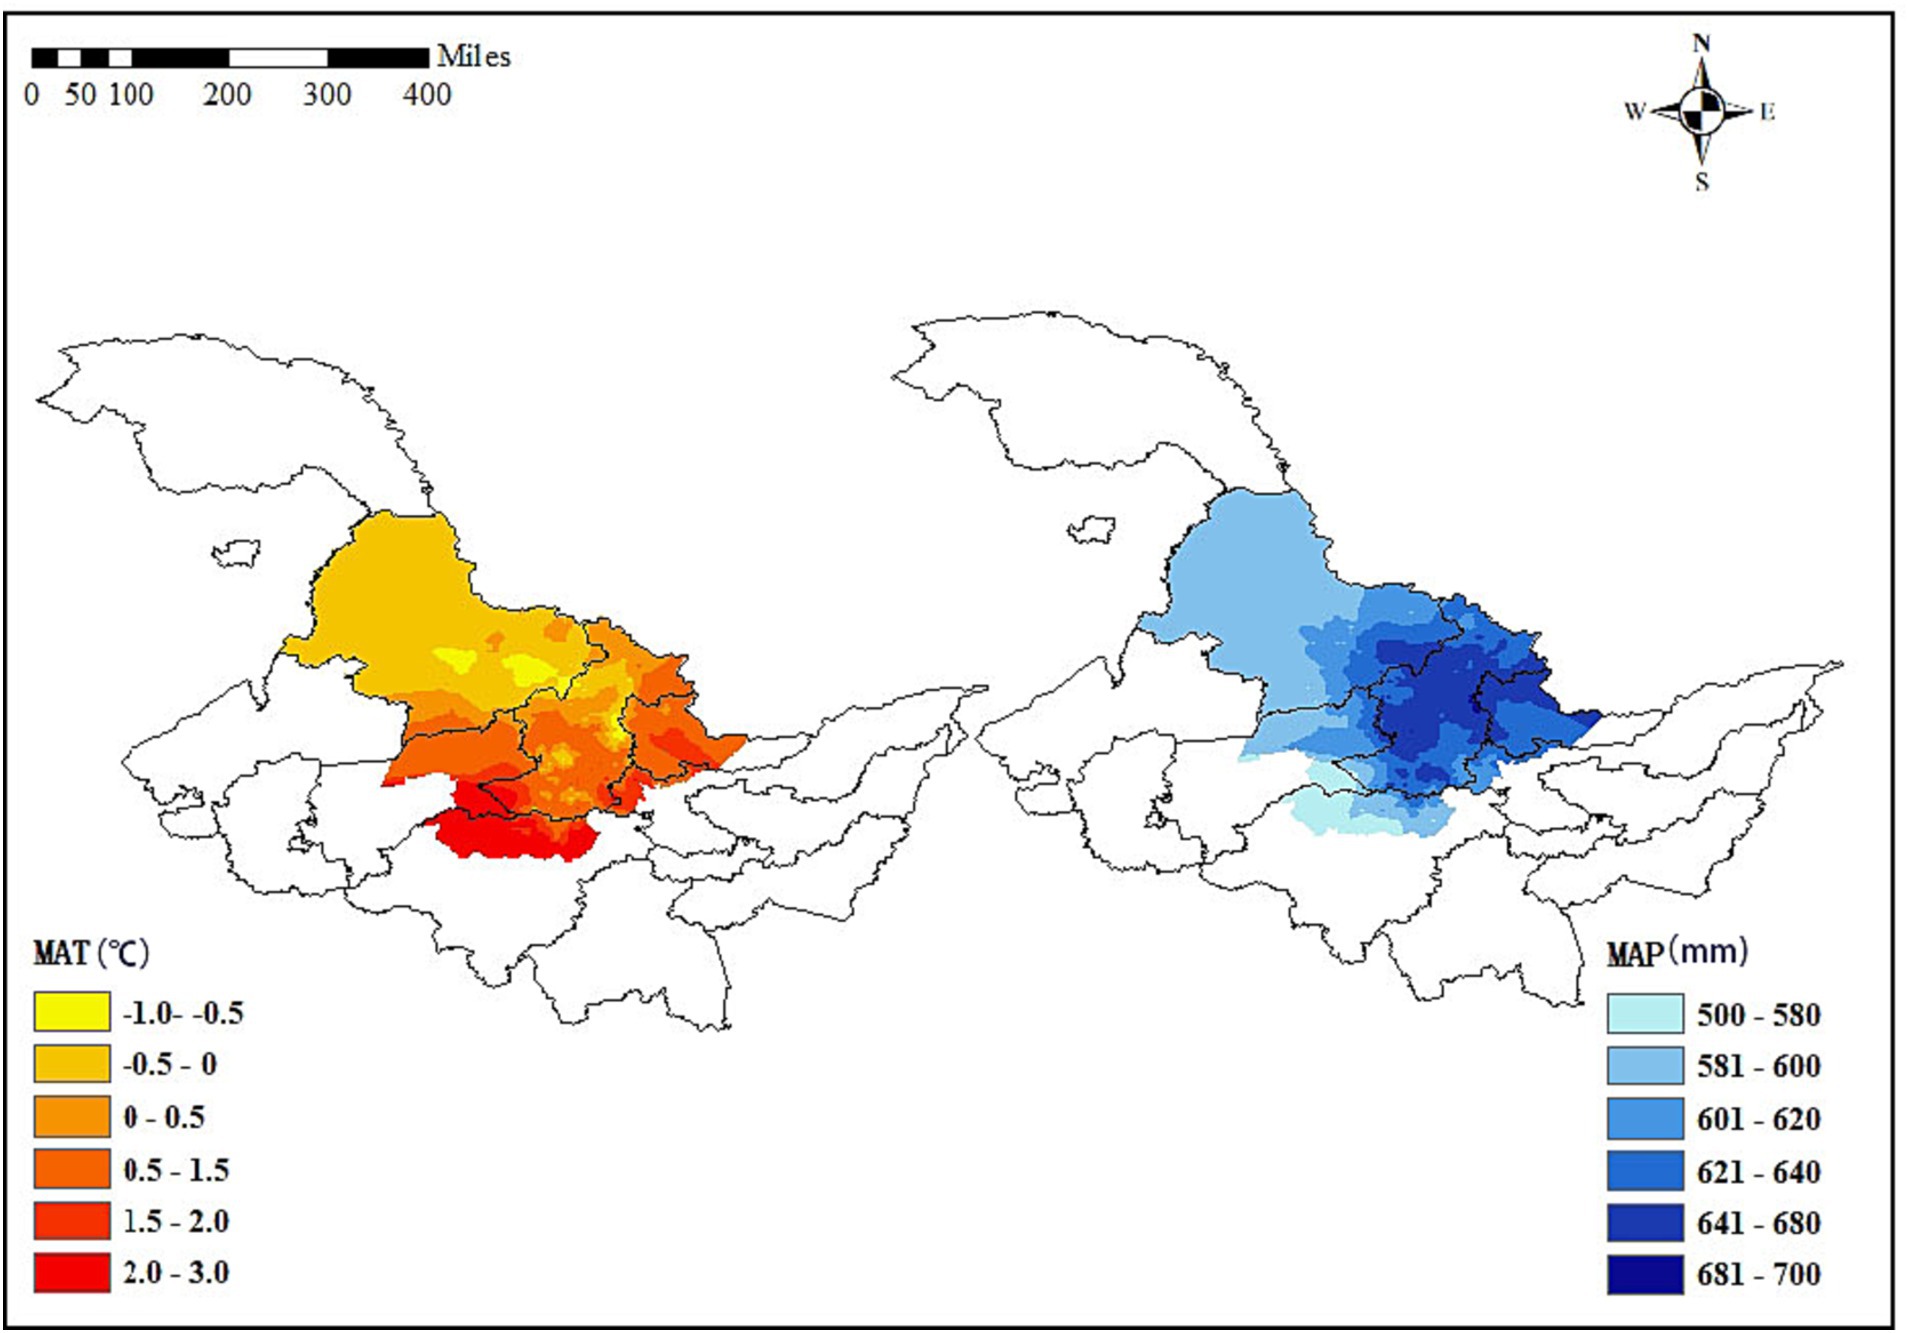
Figure 1. Mean annual temperature (MAT) and mean annual precipitation (MAP) in the initial two inventories in Lesser Khingan Mountains of Heilongjiang province.
To predict the diameter distribution of different tree species’ responses to future climate change, ClimateAP generated the future mean annual precipitation and temperature from 2015 to 2100 (Wang et al., 2018). The main future scenarios are high emissions (RCP8.5), moderate emissions (RCP4.5), and low emissions (RCP2.6) (Xu and Xu, 2012). The changes in temperature and precipitation under the three scenarios are shown in Figure 2. Overall, the future MAT and MAP trends, from 2010 to 2100, increased under the three RCP scenarios. Additionally, MAP increased under the three RCP scenarios, although fluctuations were expected.
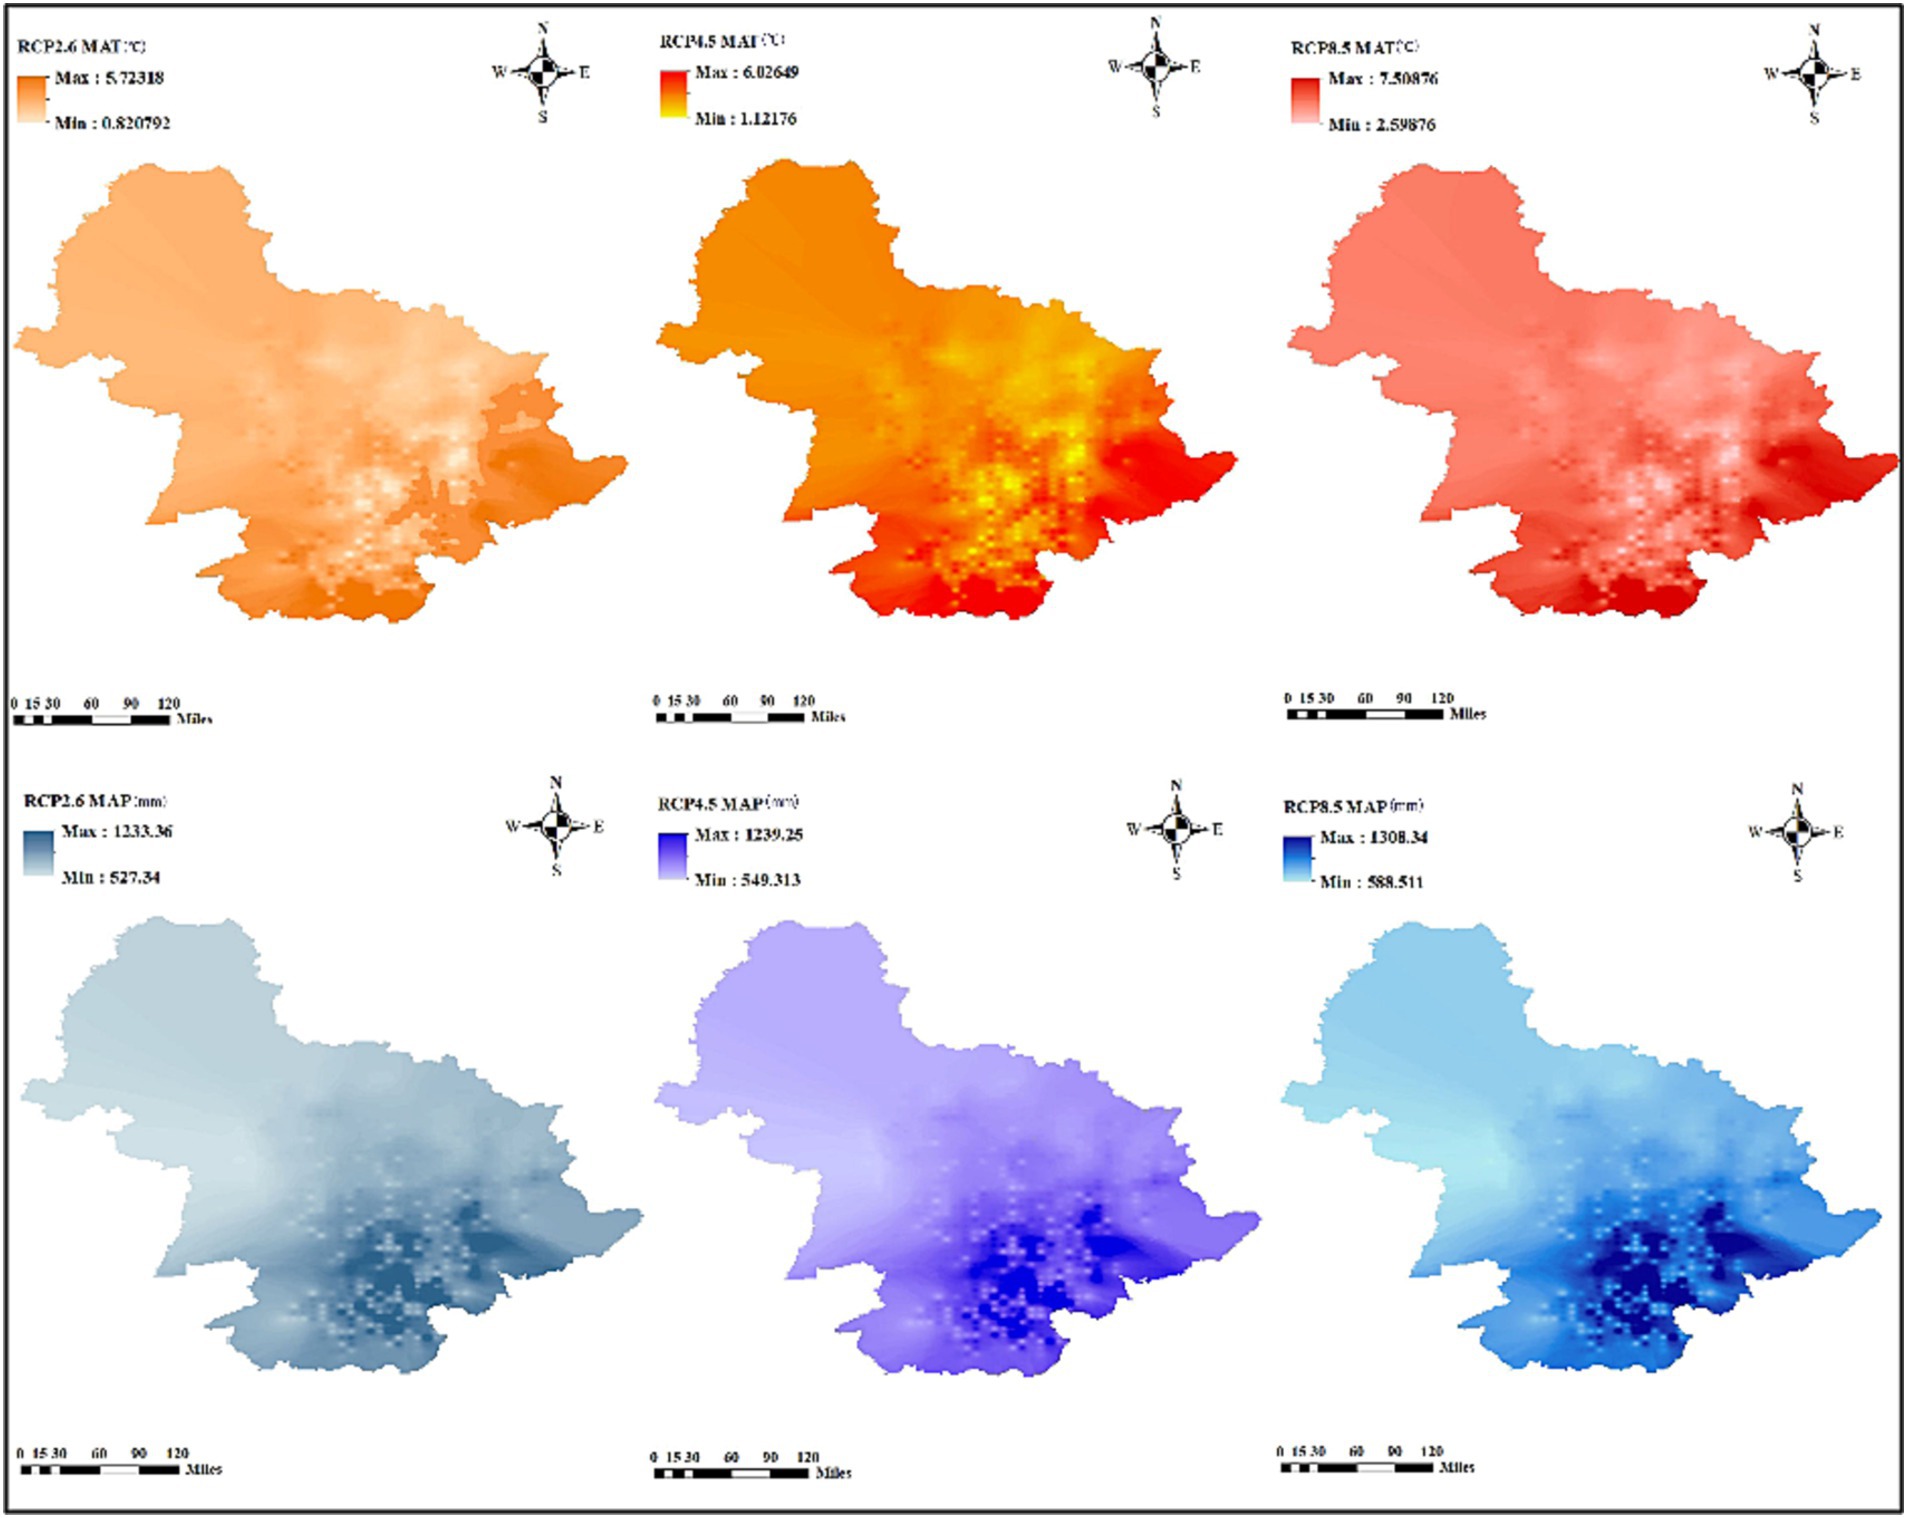
Figure 2. Temporal changes of MAT (°C) and MAP (mm) under future three RCPs in Lesser Khingan Mountains of Heilongjiang province.
2.4 Model variable and model structure
The study included seven stand parameters, such as diameter at breast height (DBH), basal area (BA), and number of trees per hectare (N); two diversity indicators, including tree species diversity (H1) and size diversity (H2), H1 indicates species diversity represented by the Shannon–Wiener index; H2 denotes tree size diversity represented by the Shannon–Wiener index; six stand structural parameters, including aspect, slope, and soil thickness; two climate factors, including temperature and precipitation, which mainly affect forest growth; and four stand spatial structural parameters, such as uniform angle index, mingling, dominance and competition index. Based on the transition matrix growth model, the above variables were used to determine the multicollinearity between the independent variables by using variance inflation factor (VIF) to exclude the variables with strong covariance with VIF >10 and introduced to construct the CM and SCM. All variables are defined in Table 3.
Table 3. Variable and definition.
The transition matrix growth model can be described as follows:
where yt = [yijt] denotes a column vector denoting the number of trees alive in species group i (i = 1, 2, 3, …, sp.) and diameter class j (j = 1, 2, 3, …, dc) at time t; yt is a column vector of space and time affected by forest dynamics and harvesting. ht = [hijt] denotes the number of trees logged in species group i and diameter class j at time t, if there is no logging at time t, ht = 0; the growth matrix Gt describes the growth or mortality of individual trees between t and t + 1; Rt represents the number of trees recruited between t and t + 1 for each species group in the smallest diameter class; and indicates the random error vector.
The G and R matrices are:
where aij is the probability that a tree in species group i and diameter class j is alive and still in the original diameter class j between t and t + 1; m and n denote the number of species groups and diameter classes, respectively; and bij represents the probability that a tree in species group i and diameter class j remains alive and grows to the next diameter class j + 1, where mij denotes the probability of tree mortality in species group i and diameter class j between t and t + 1. Ri is a time-, stand-structure-, and climate-related recruitment vector that shows the number of trees recruiting the smallest diameter class of each species between t and t + 1. The most important step for developing a transition matrix growth model is to define three submodels, i.e., aij, bij, and mij. The bij probability could be derived by dividing the annual tree diameter increment, gij, by the diameter class width. The functional expression for gij is as follows:
A generalized least squares (GLS) method was used to estimate the parameters of the tree diameter increment model, and the parameters in the model were defined in Table 3. Because the recruited trees show a continuous, skewed, bounded, and non-normal pattern, it is truncated to positive and zero values (Tobin, 1958; Liang et al., 2011). Therefore, the Tobit model was used to estimate the trees recruited for species group i from t to t + 1. The expression of the Tobit model is as follows:
The maximum likelihood (ML) method was used to estimate the Tobit recruitment equation parameter. Ω and ω denote the standard normal cumulative function and density function, respectively; σi is the standard deviation of the residuals νi obtained by estimating the parameter β. The annual probability of tree mortality was expressed using a probit model. The expression of the probit model is as follows:
The maximum likelihood (ML) method was used for parameter estimation; where Mij is the probability of a tree in species i and diameter class j dying within T years; δs; ξij denote the parameter and error, respectively.
2.5 Model validation and comparison
In this study, the simulation results of the model were tested using a 10-fold cross-validation method under the R caret package, and then the root mean square error (RMSE), and coefficient of determination (R2) were calculated directly from the prediction errors as quantitative measures of accuracy, and then the total RMSE, MAE and R2 were calculated as follows. We also produced SCM (climate-spatial matrix growth model), CM (climate-sensitive matrix growth model) and FM (fixed parameter transition matrix) mode using the same plots. Firstly, the fit of these three models was compared using the Akaike information criterion (AIC) and the Bayesian information criterion (BIC). Second, the CM, the SCM with the addition of spatial structure parameters, the FM were subjected to the same cross-validation technique to compare the accuracy of these three models by calculating the RMSEs.
RMSE j , MAE j and R2 j represent the RMSE, and R2 in the jth folder; where k is equal to 10; Yij is the ith observed value in the jth fold; represents the ith estimated value in the jth fold; is the mean observed value in the jth fold; nj denotes the number of observations in the jth fold.
2.6 Long-term prediction of major tree species to future climate change
To investigate the response of different tree species to future climate change in the area, two groups of four plots were selected at the same temperature with different precipitation and at the same precipitation with different temperatures. Changes in stand density, basal area, species diversity, and tree size diversity were simulated for three future climate change scenarios (RCP2.6, RCP4.5, and RCP8.5) to explore how different climate scenarios affect forest dynamics (2010–2100). Plot information is shown in Figure 3.
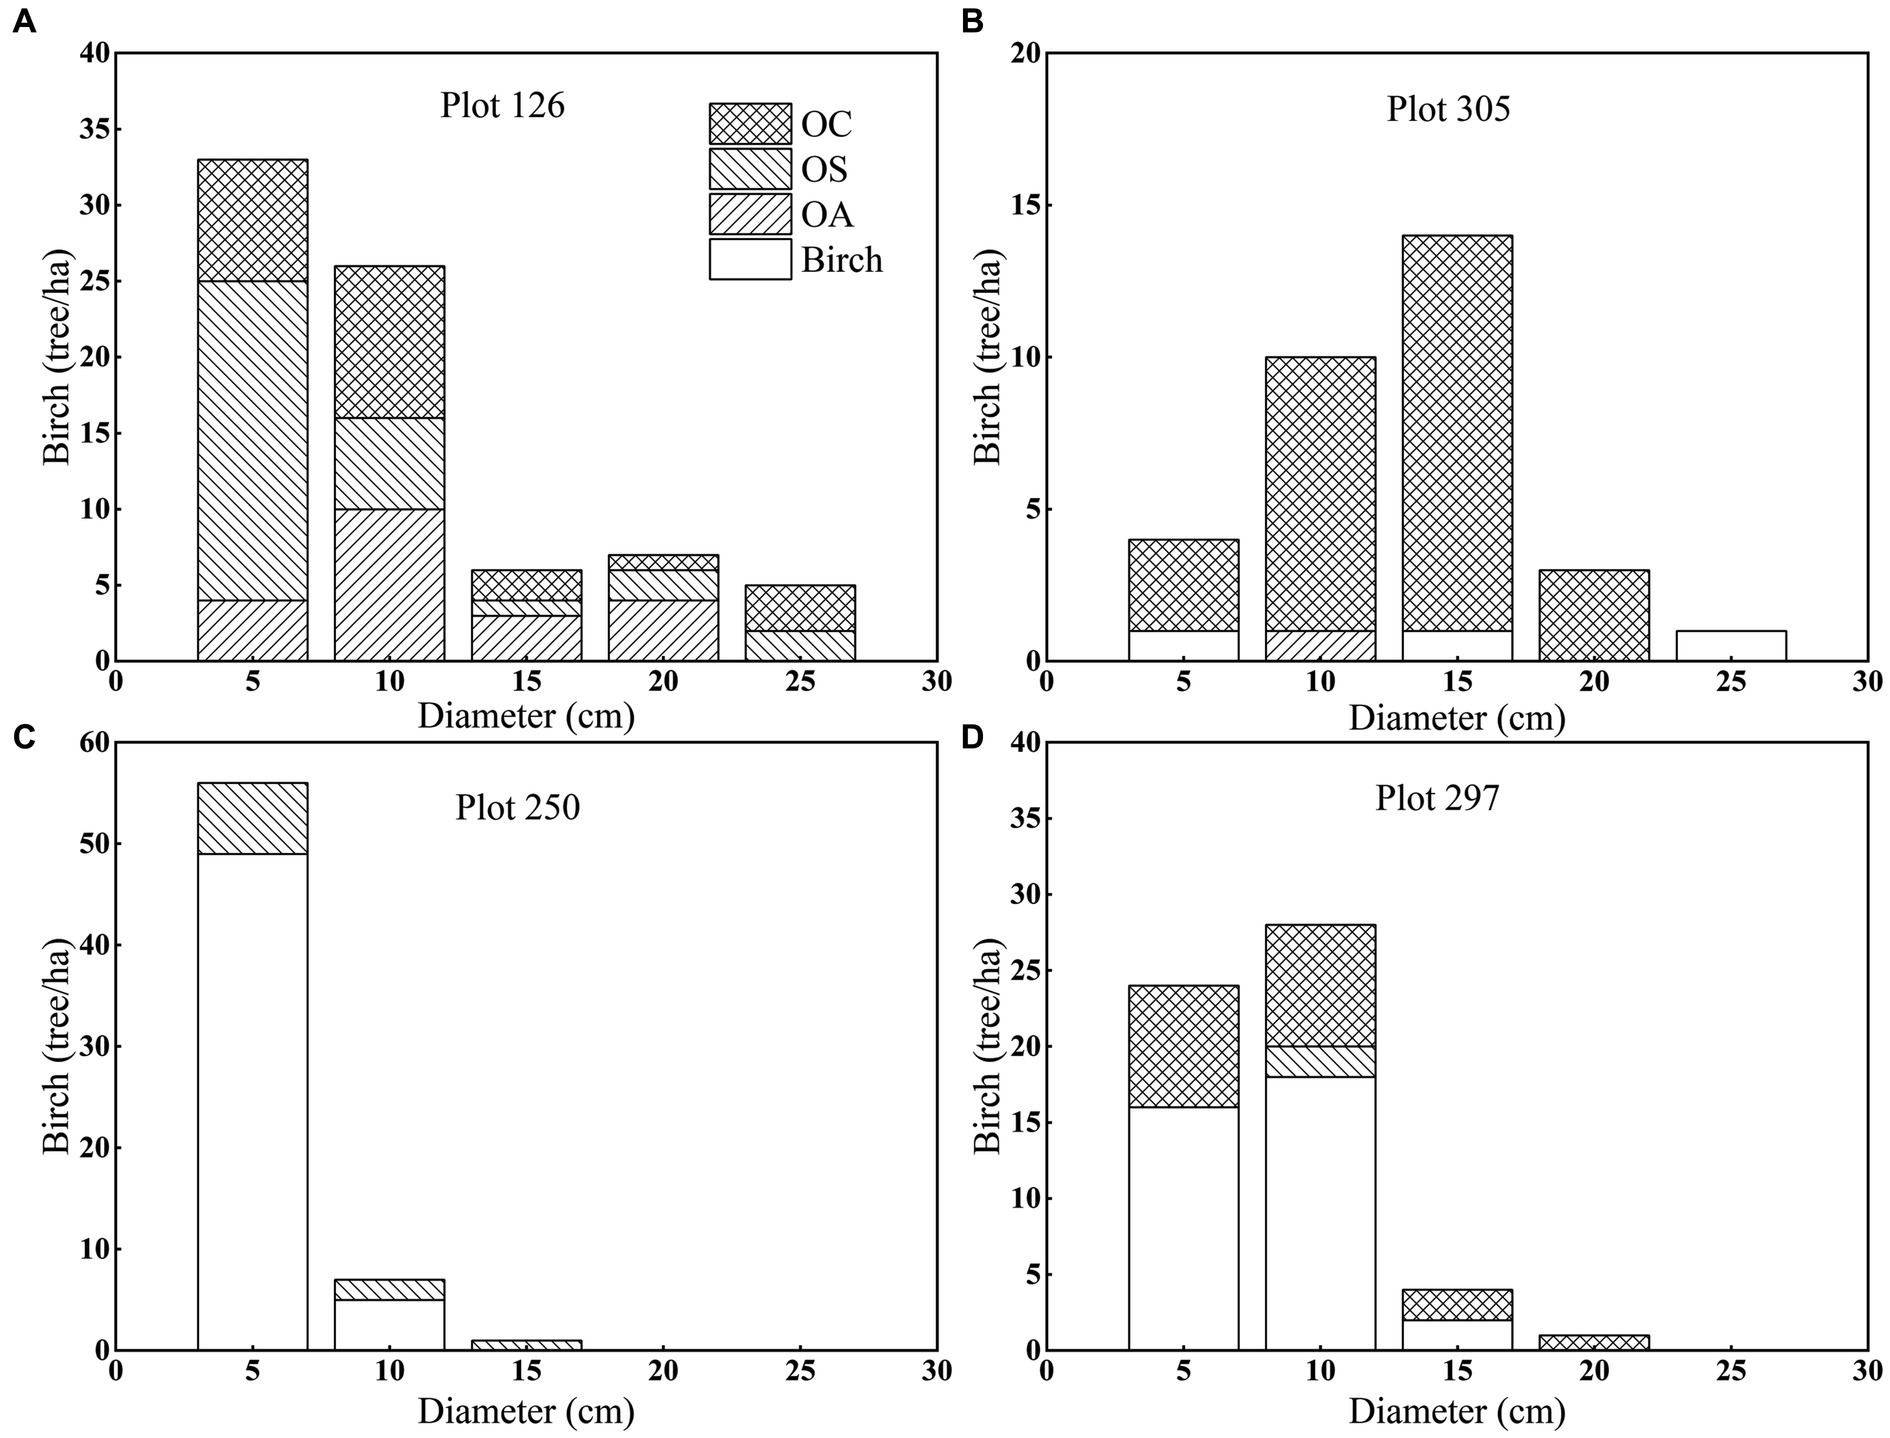
Figure 3. Diameter distribution and species composition of CNFI plots numbers (A) 126, (B) 305, (C) 250 and (D) 297 by species group and diameter class.
3 Results
3.1 Estimates of parameters
The estimated parameters of tree diameter increment model and the lack-of-fit statistics are provided in Tables 4, 5. The DBH size had a significant effect (p < 0.01) on the growth of Birch and OC, and DBH size was positively correlated with tree growth; that is, the larger the tree’s diameter at breast height, the faster the tree grew. DBH2 and B had significant effects (p < 0.01) on the growth of all tree species (groups), and they were negatively correlated with growth. BA had a significant effect (p < 0.01) on Birch, OA and OC and was negatively correlated with birch, OA, and OC growth. Dg had a significant effect on OS and OA growth (p < 0.01) and was positively correlated with tree growth; H1 had a significant effect on Birch, OA, and OC growth (p < 0.05) and was positively correlated with tree growth; H2 had a significant effect on birch and OA growth and was positively correlated with Birch growth and negatively correlated with OA growth (p < 0.01). ST, HT, and SLcosASP had significant effects on Birch, OS, and OC growth (p < 0.01), where ST and SLcosASP were negatively correlated with tree growth and HT was positively correlated with tree growth.
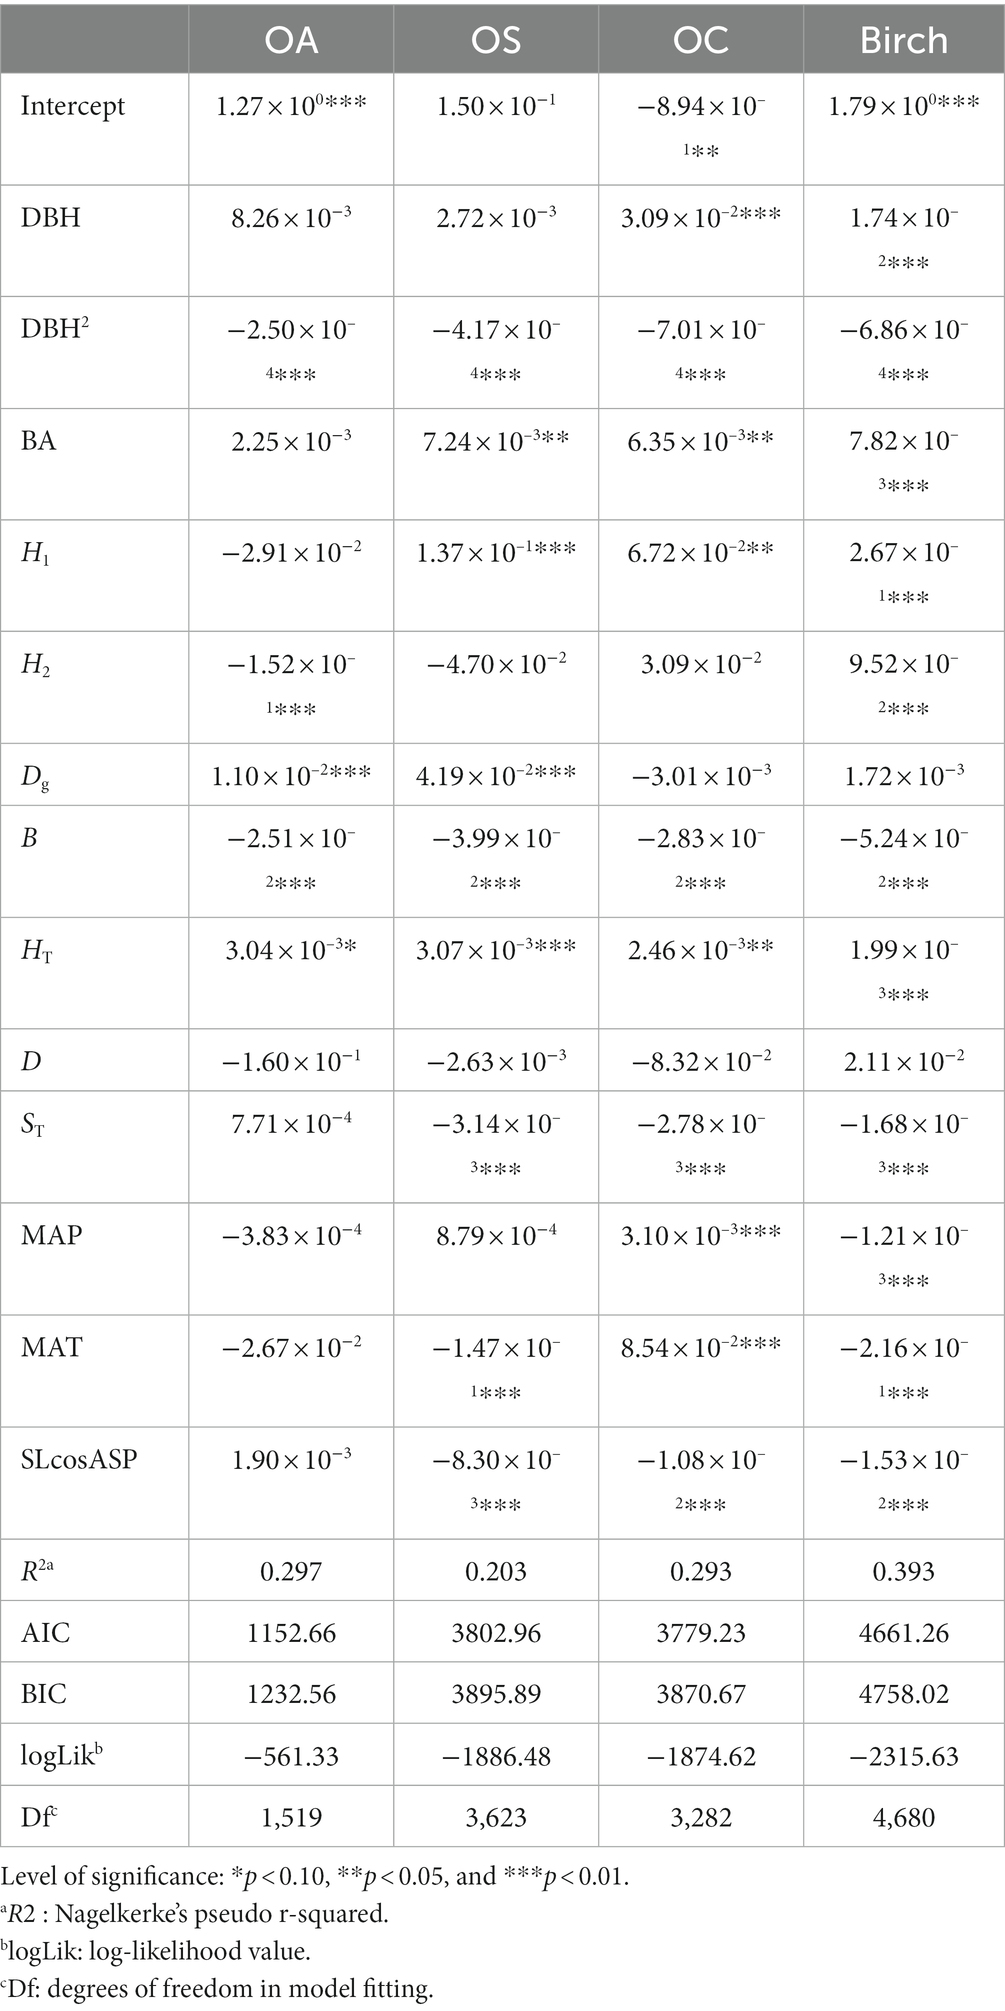
Table 4. Increment model CM.
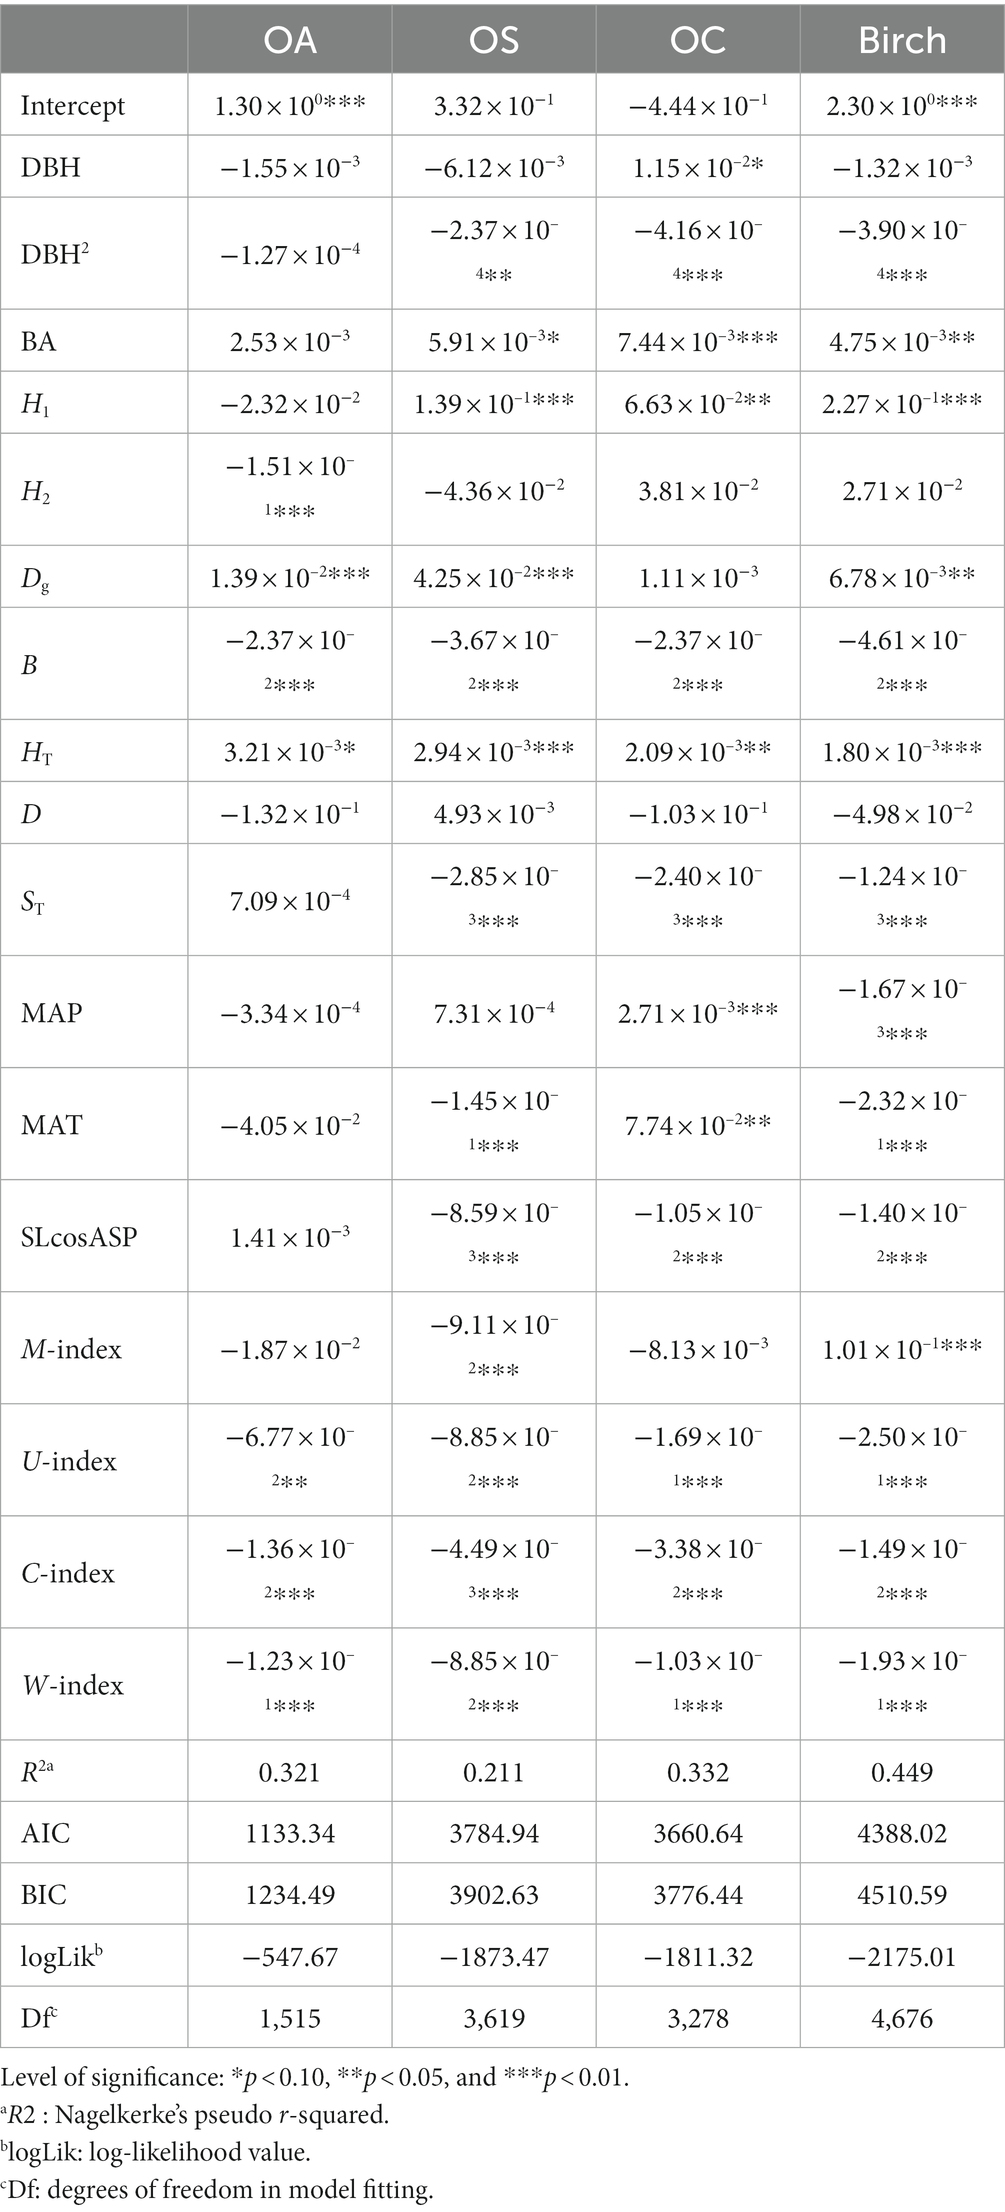
Table 5. Increment model SCM.
MAT had a significant effect on Birch, OS and OC growth (p < 0.01), where MAT was negatively correlated with Birch and OS growth, and positively correlated with the OC growth. For instance, the higher MAT is, the faster the growth of OC, and conversely, the higher MAT is, the slower the growth of Birch and OS. MAP had a significant effect on Birch and OC growth (p < 0.01), with MAP being negatively correlated with Birch and positively correlated with OC. The W-index, C-index and U-index had significant effects (p < 0.01) on all species groups, and the U-index and C-index were negatively correlated with tree growth, i.e., competition among trees in the stand inhibited tree diameter growth; the W-index was negatively correlated with tree growth because the clustered distribution of trees increases the pressure between trees and thus inhibits tree growth. The M-index, as a spatial structure index reflecting the diversity of tree species, had a significant effect on Birch and OS (p < 0.01) and was positively correlated with Birch and OS growth.
Based on the mortality model (Tables 6, 7), DBH, DBH2, and HT significantly affected the mortality of Birch and OS, and DBH was positively correlated with Birch and OS, i.e., the smaller the diameter at breast height size, the higher tree mortality; DBH2 and HT were negatively correlated with Birch and OS (p < 0.05). BA, Dg, B and H2 significantly affected mortality for all tree species (groups) (p < 0.05), where Dg was negatively correlated with tree mortality, BA, B and H2 positively correlated with tree mortality (p < 0.01; p < 0.05), and the greater BA, B and H2 were the higher tree mortality. H1 and SLsinASP significantly affected Birch, OS, and OC (p < 0.01), and they were negatively correlated with the mortality of OA. D had a significant positive correlation with the mortality of OS, OA and OC, i.e., the greater the D was, the higher tree mortality.
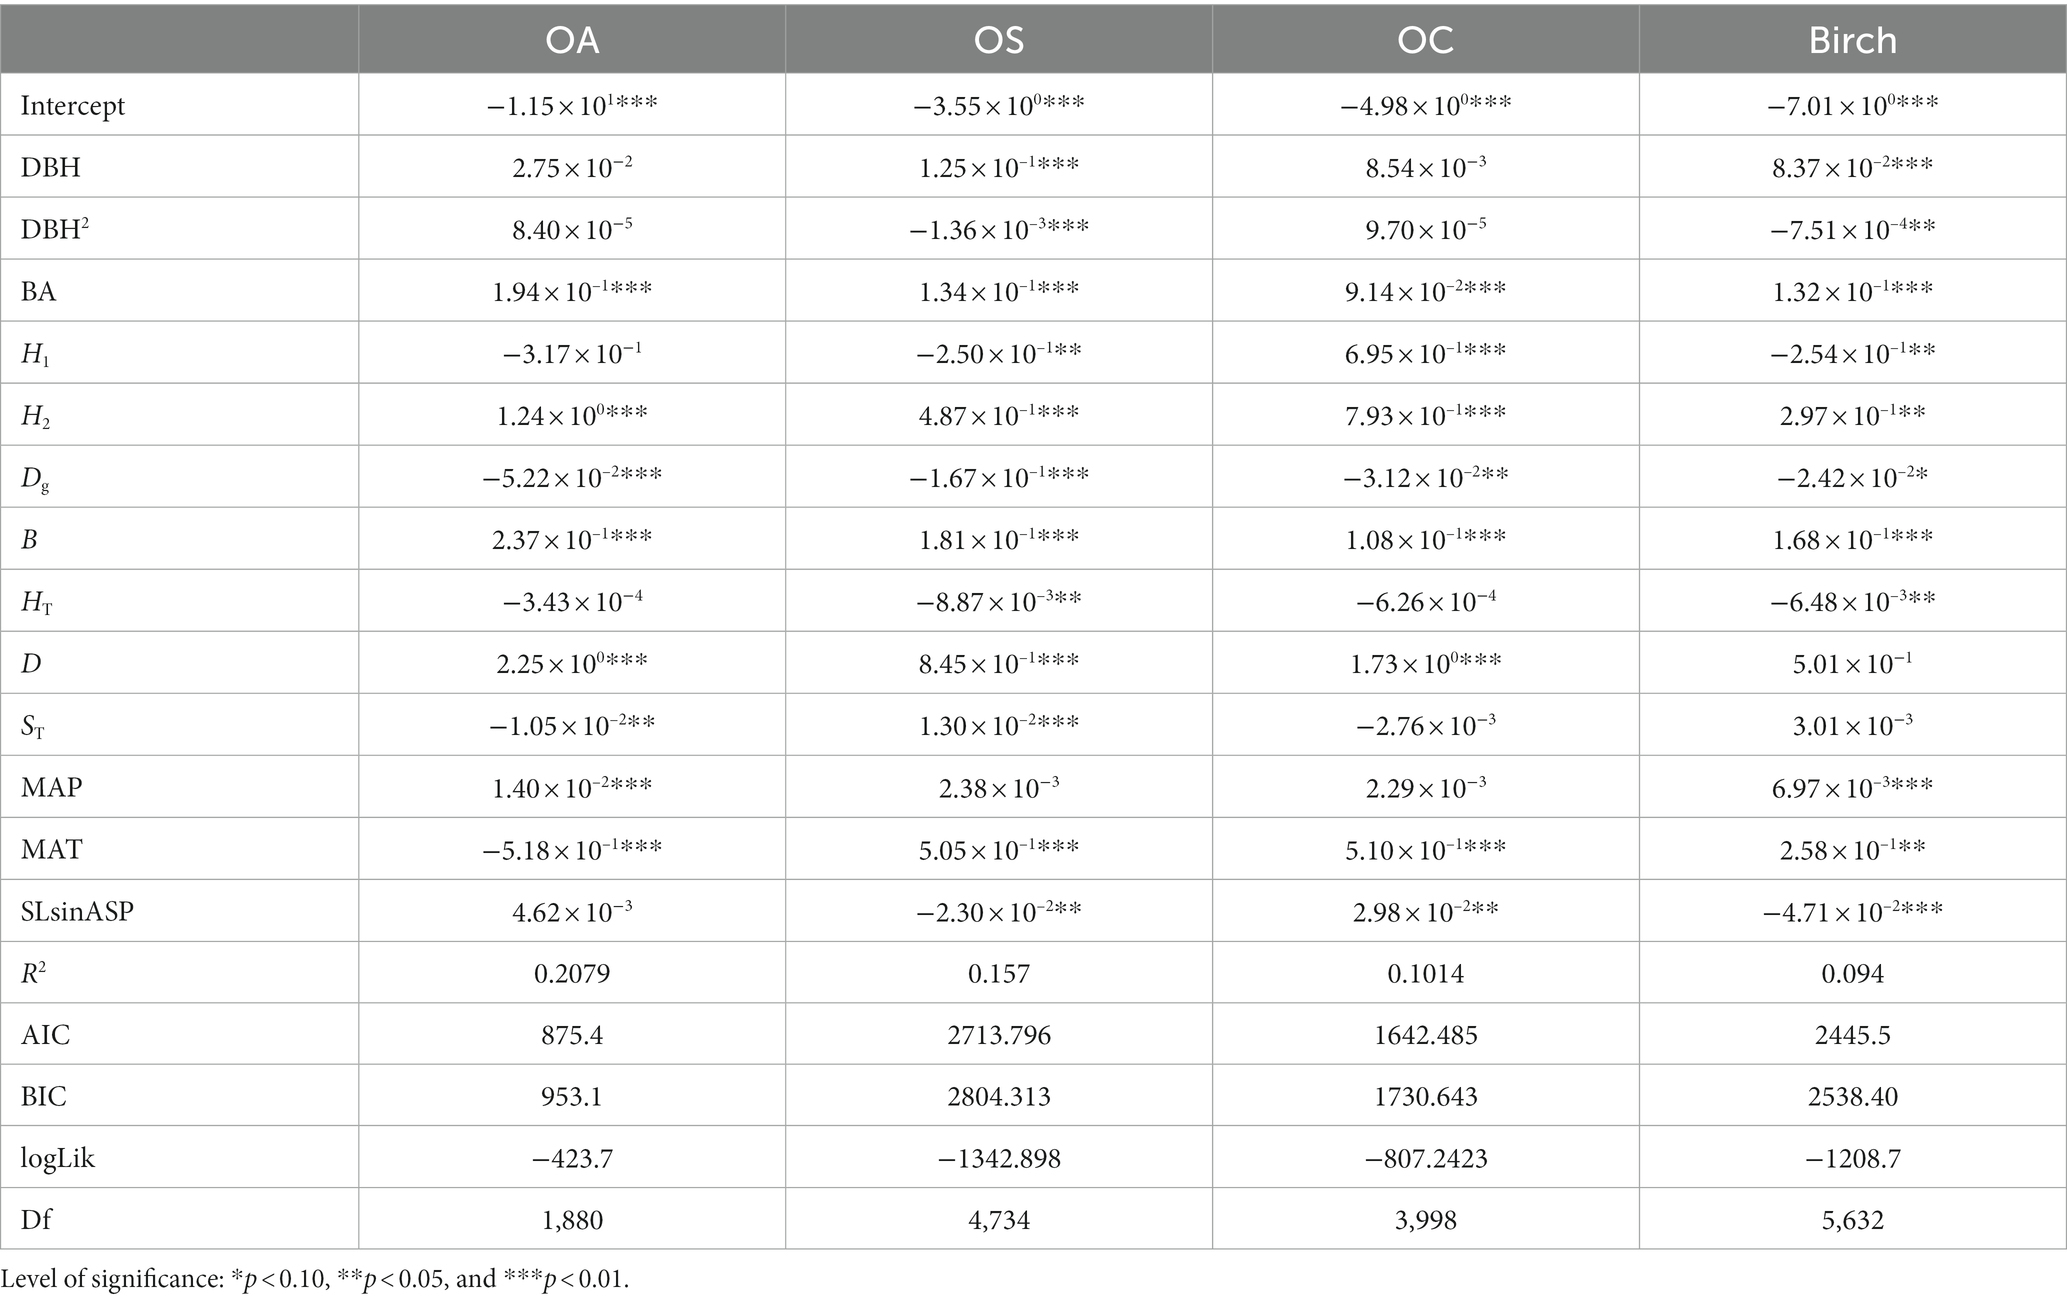
Table 6. Mortality model CM.
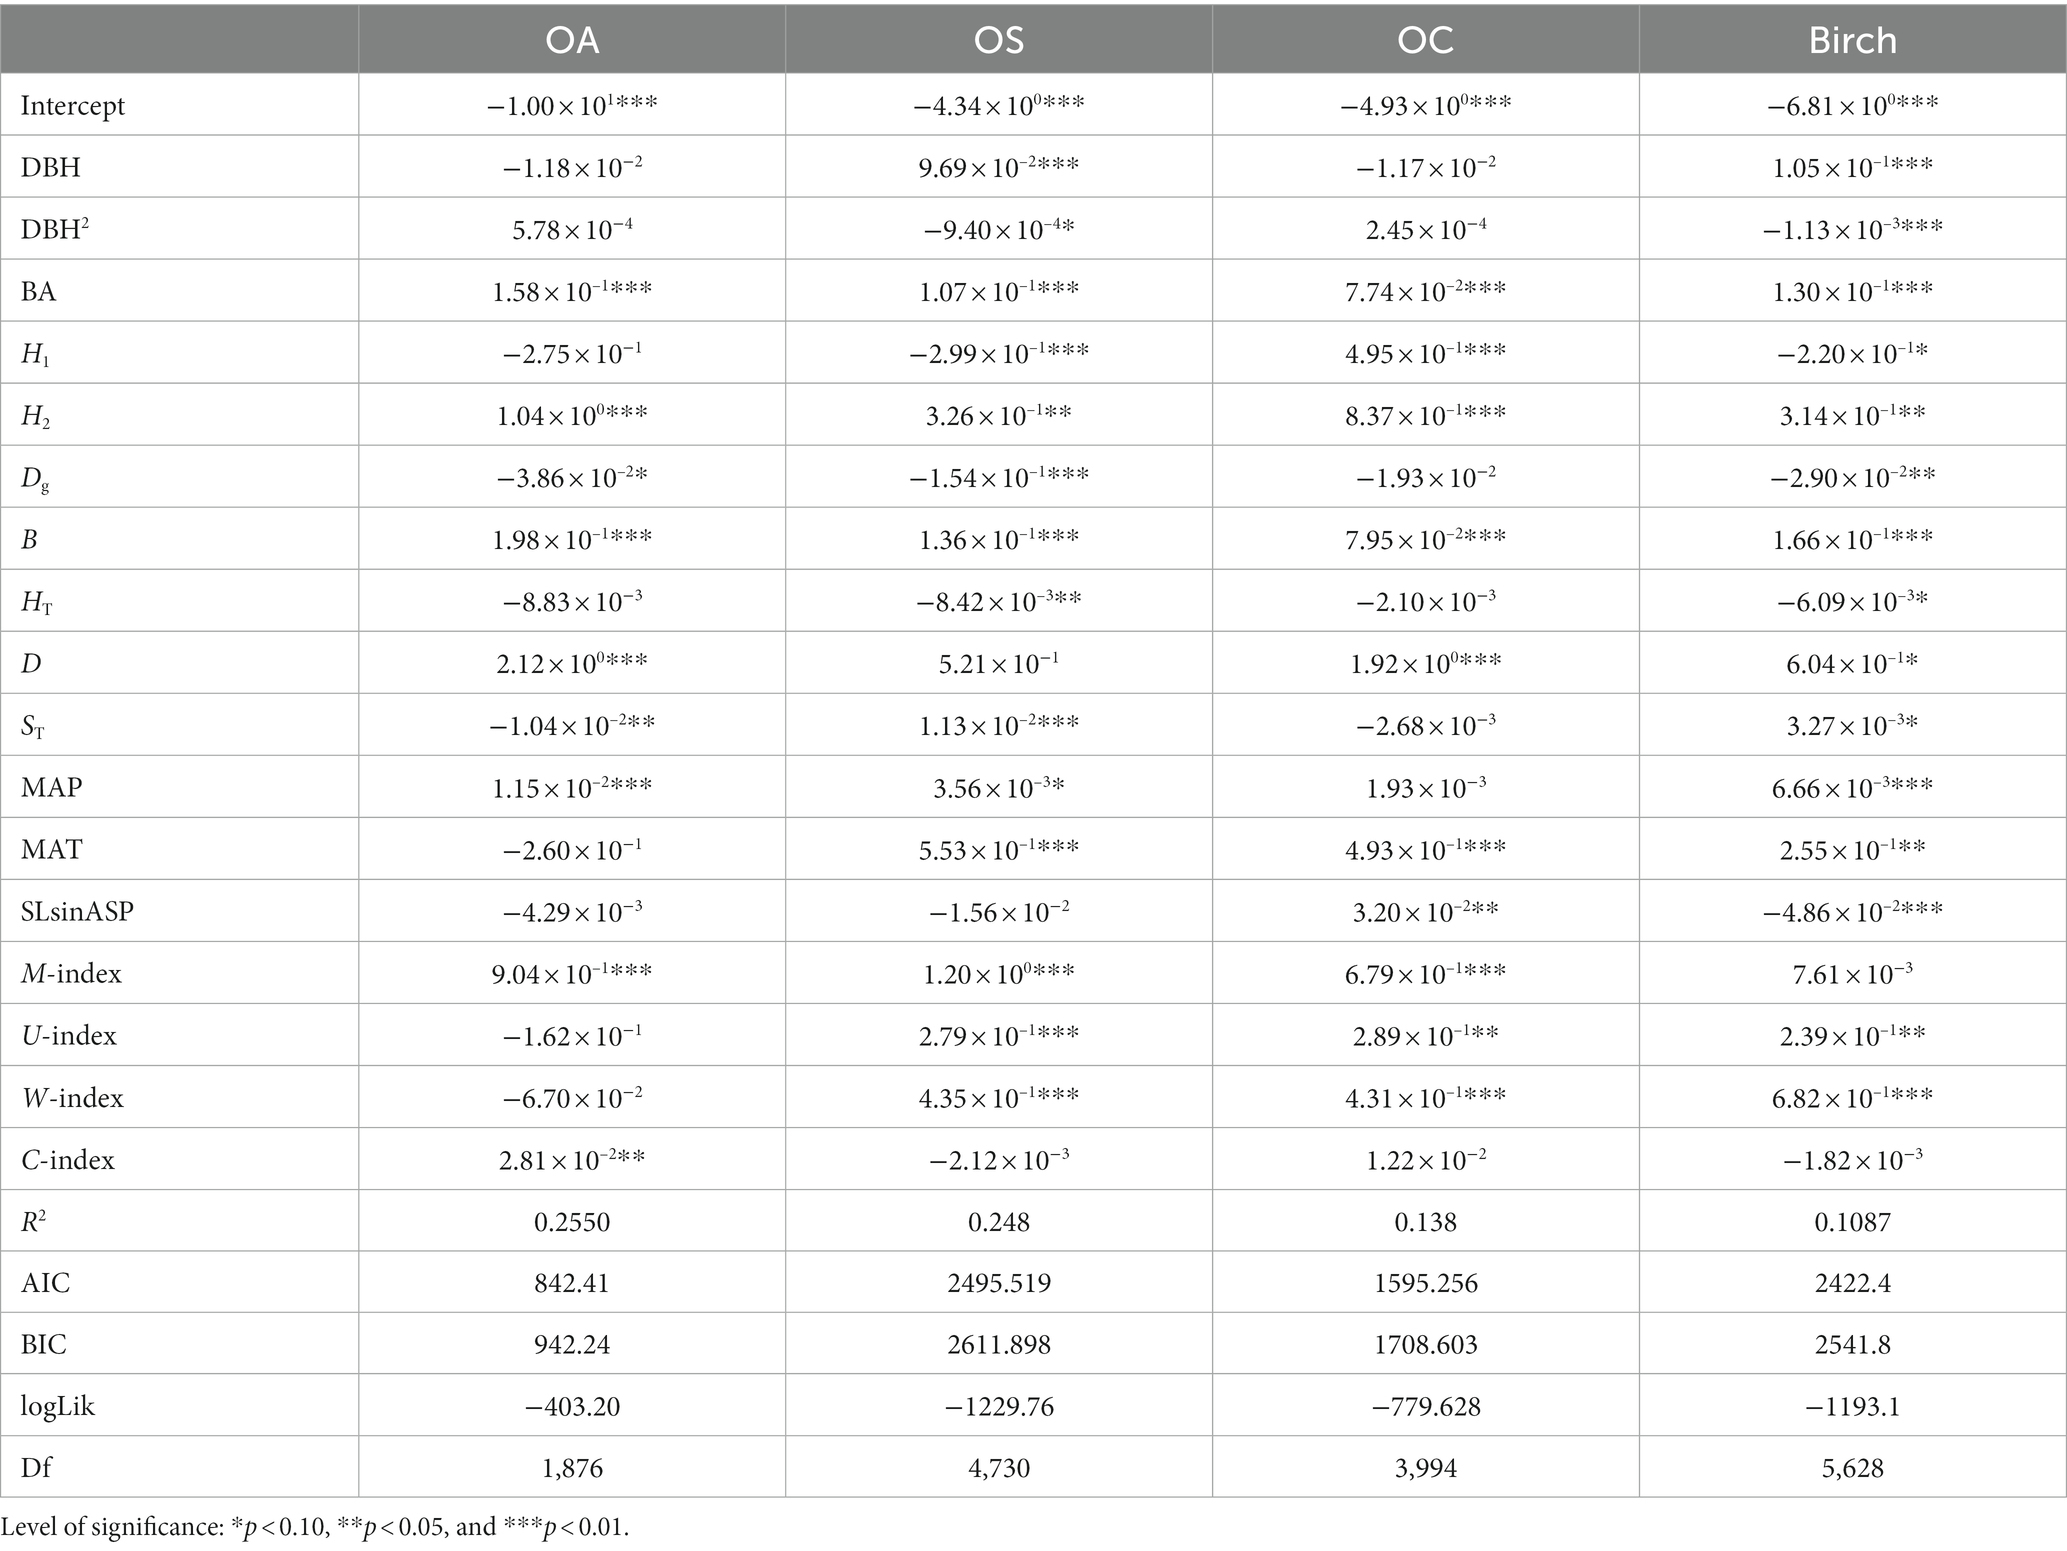
Table 7. Mortality model SCM.
MAT significantly affected (p < 0.01) the mortality rates of all tree species (groups), and was negatively correlated with the mortality rate of OA and positively correlated with the mortality rate of the other three tree species (groups), i.e., the higher the MAT was, the higher tree mortality rates; MAP had a significant positive effect on the mortality rates of Birch and OA (p < 0.01), i.e., the higher the MAP was, the higher tree mortality rates. The W-index and U-index significantly affected (p < 0.01) the three species groups, Birch, OS, and OC. The U-index was positively correlated with the mortality rate of the three species, i.e., a greater U-index indicated a stronger competition among trees and higher tree mortality, while the W-index was positively correlated with the mortality rate of the three species.
The recruitment model in Tables 8, 9 shows that N significantly affected the recruitment and was negatively correlated with Birch, OA, and OC (p < 0.05). BA significantly affected the three tree species (groups), Birch, OA and OS, where BA was inversely correlated with the recruitment of Birch and OS (p < 0.01), indicating that the larger the basal area was, the smaller the recruitment, while BA was positively correlated with the recruitment of OA. Dg and ST significantly affected the recruitment of all species (groups) (p < 0.01), and they were negatively correlated with tree recruitment, i.e., the larger Dg and thicker soil thickness caused the lower number of recruits. H1 and H2 significantly affected recruitment in all species groups (p < 0.01), where H1 was positively correlated with recruitment of Birch only and negatively correlated with recruitment of the other three species; H2 was positively correlated with recruitment of Birch and OA and inversely correlated with recruitment of OS and OC. SLcosASP significantly affected the recruitment of all tree species groups (p < 0.01) and was negatively correlated with the recruitment of Birch and positively correlated with the recruitment of the other three species.
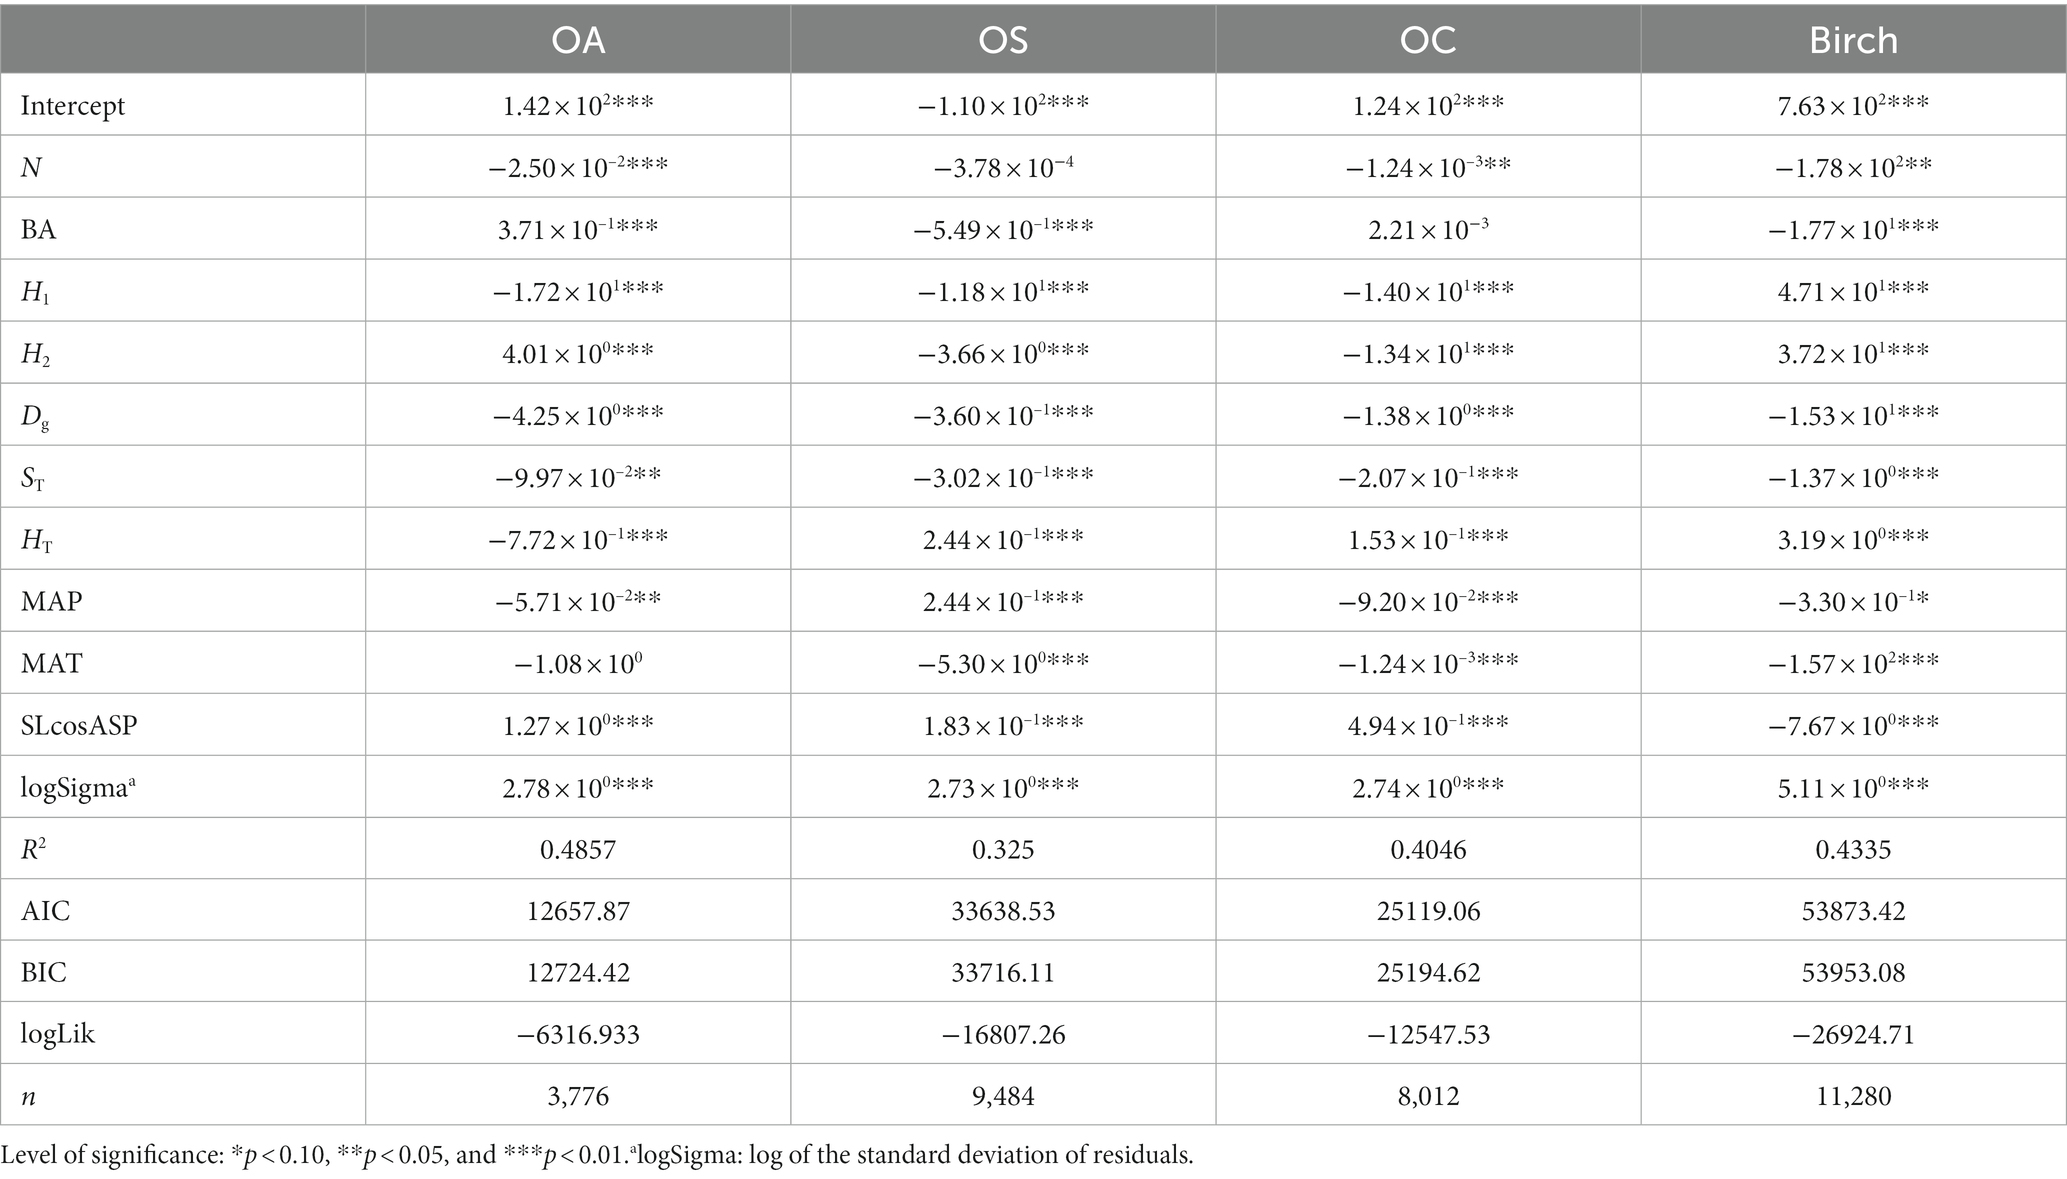
Table 8. Recruitment model CM.
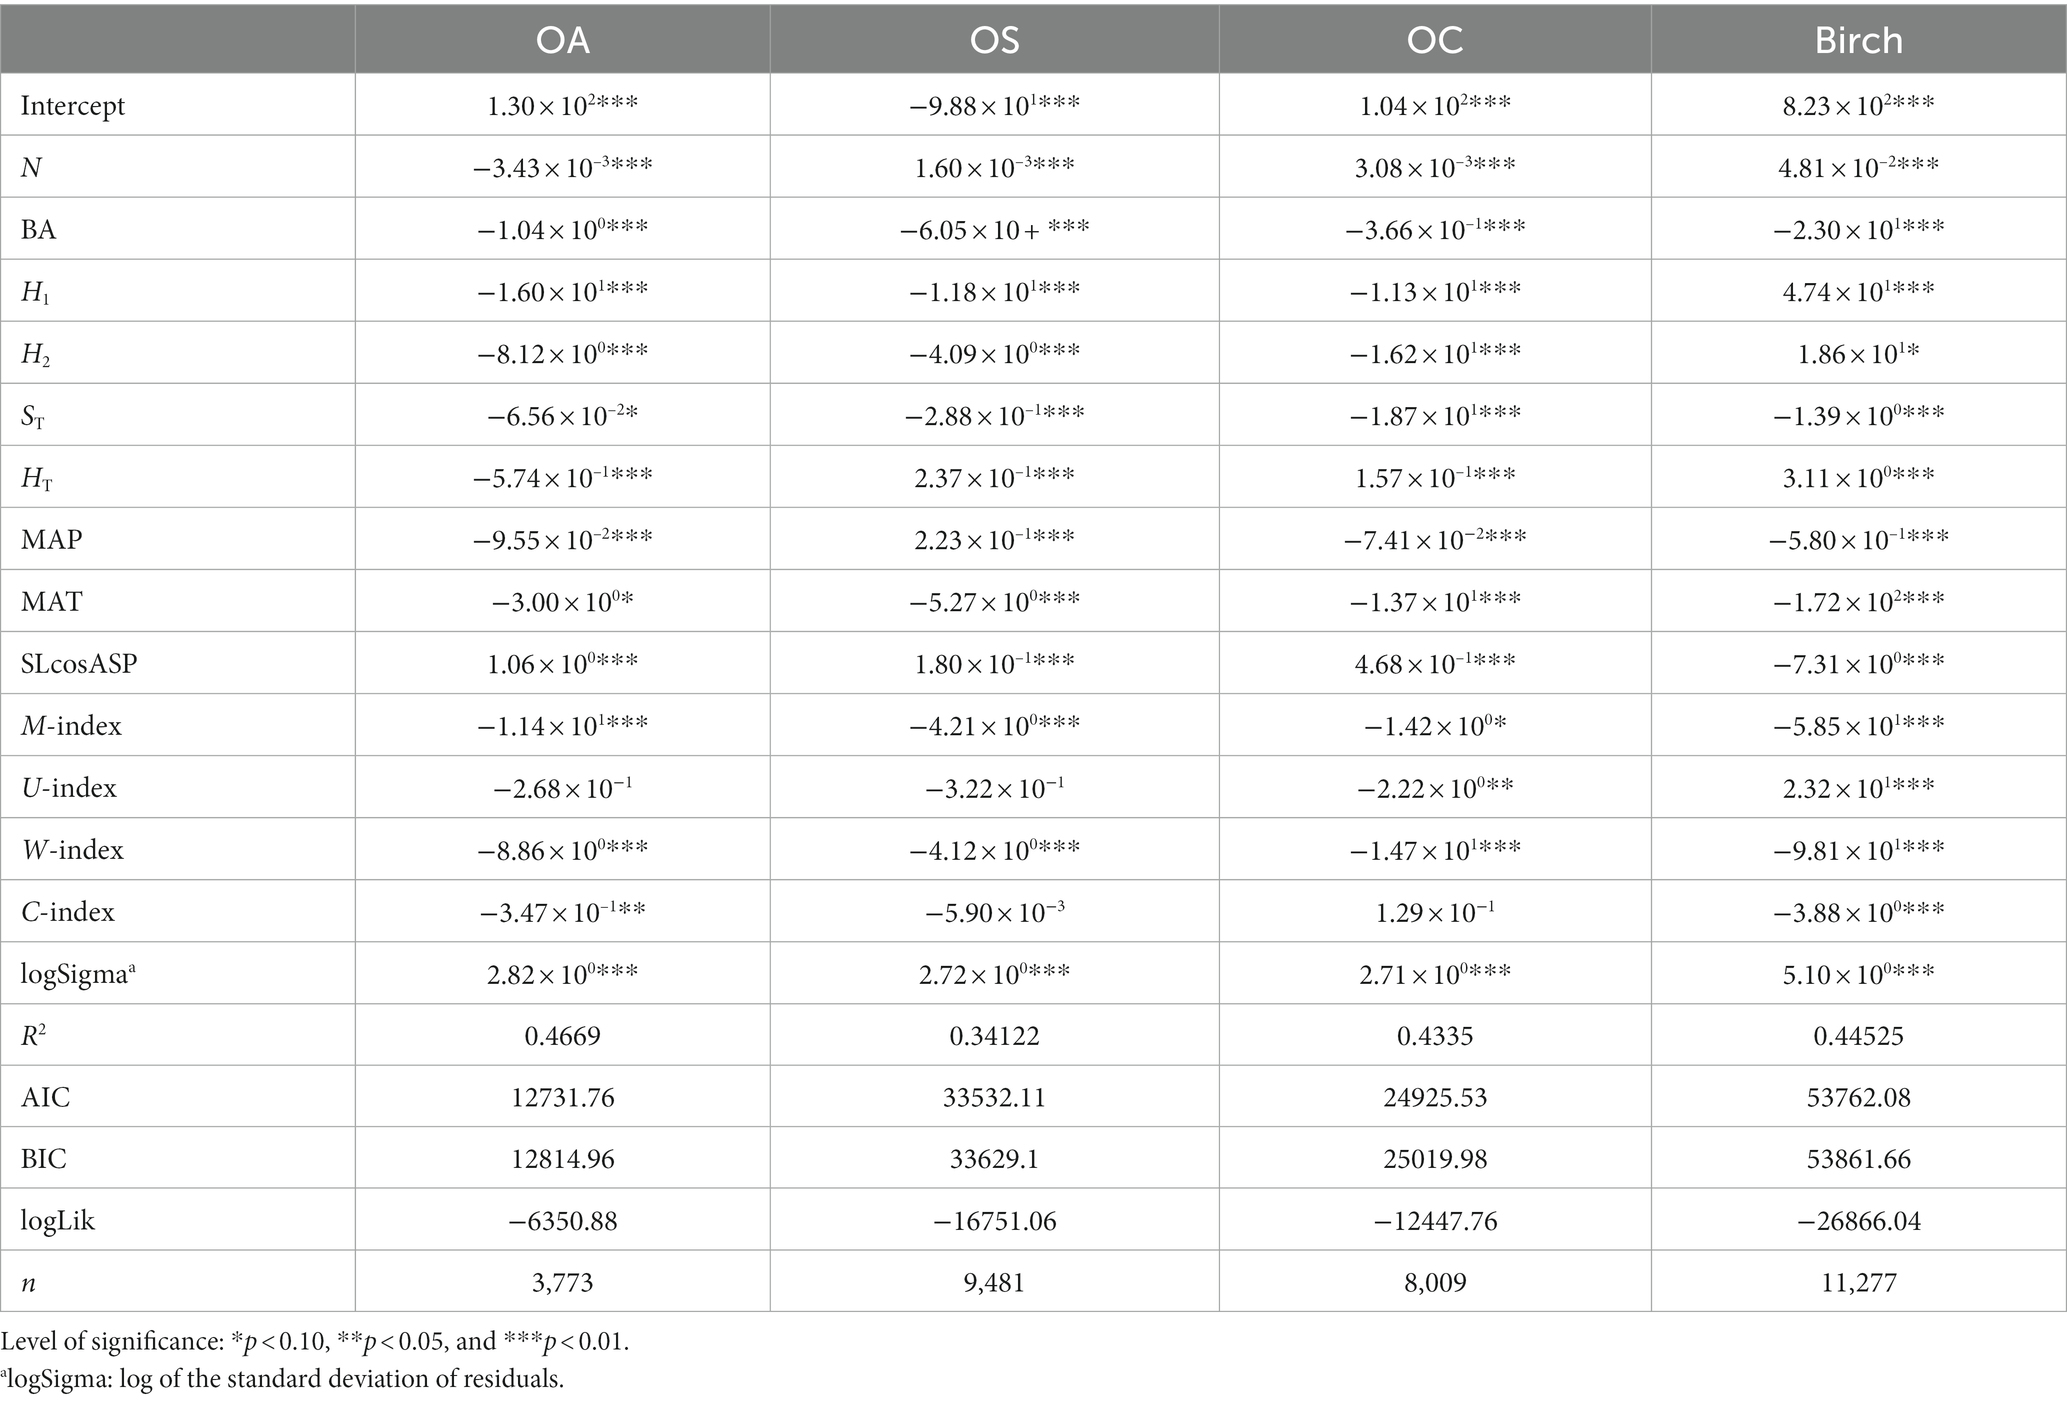
Table 9. Recruitment model SCM.
MAT significantly affected the recruitment of Birch, OS and OC, and was negatively correlated with the recruitment of tree species groups, i.e., the higher the mean annual temperature, the lower number of recruits; MAP significantly affected all tree species groups and was inversely correlated with the recruitment of Birch and OA and positively correlated with the recruitment of OS and OC. In the SCM model, the M-index and W-index significantly affected Birch, OA, OS, and OC, and they were inversely proportional to the number of recruits, i.e., the greater the W-index and the more clustered the spatial distribution of trees, the lower number of recruits. The C-index was significantly negatively correlated with Birch recruitment; the U-index significantly affected Birch and OC recruitment, and was positively correlated with Birch recruitment and negatively correlated with OC.
3.2 Model validation and comparison
To investigate the effect of climate on predicted forest growth, we also produced FM. We used AIC and BIC to measure the fit of these two prediction models for CM and SCM (Table 10).
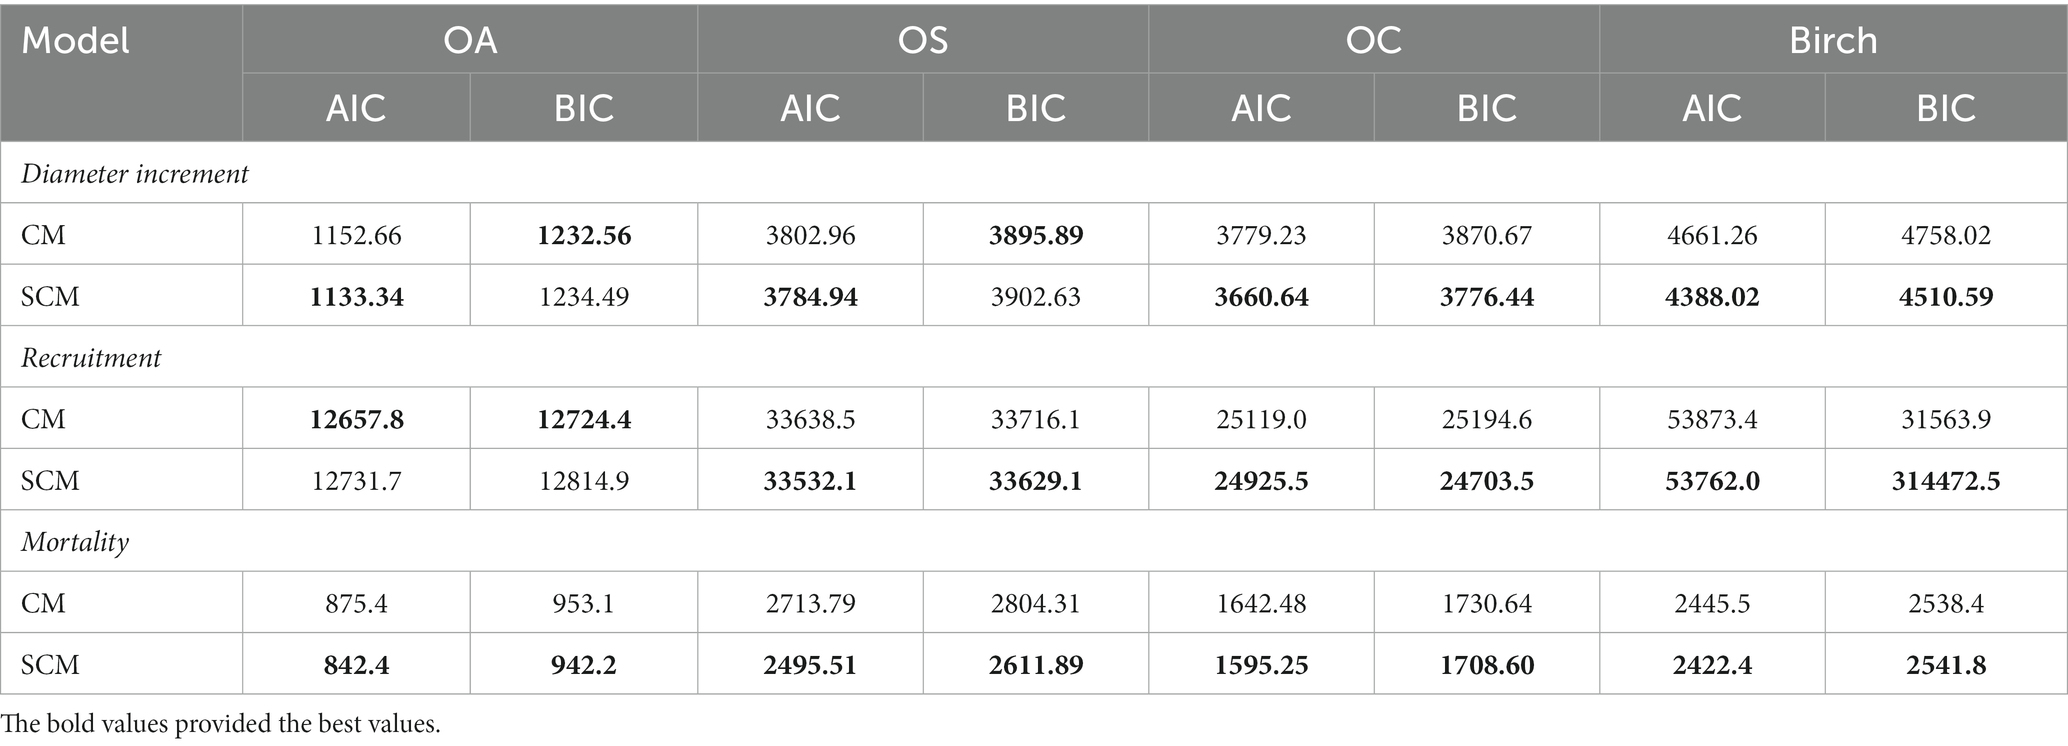
Table 10. Model fitting results comparing AIC and BIC.
We found that SCM showed better performance than CM in predicting diameter increments, and SCM predicted slightly better performance than CM in predicting recruitment except for OA; SCM showed better performance than CM in predicting mortality. The validation results of FM, CM and SCM models for four species of OA, OS, and OC and birch were finally obtained by 10-fold cross-test. Table 11 reports that the R2, RMSE, and MAE for the three models indicates slight variation among different species groups, the FM generally performs the best, yet the difference is very small (see Figure 4).
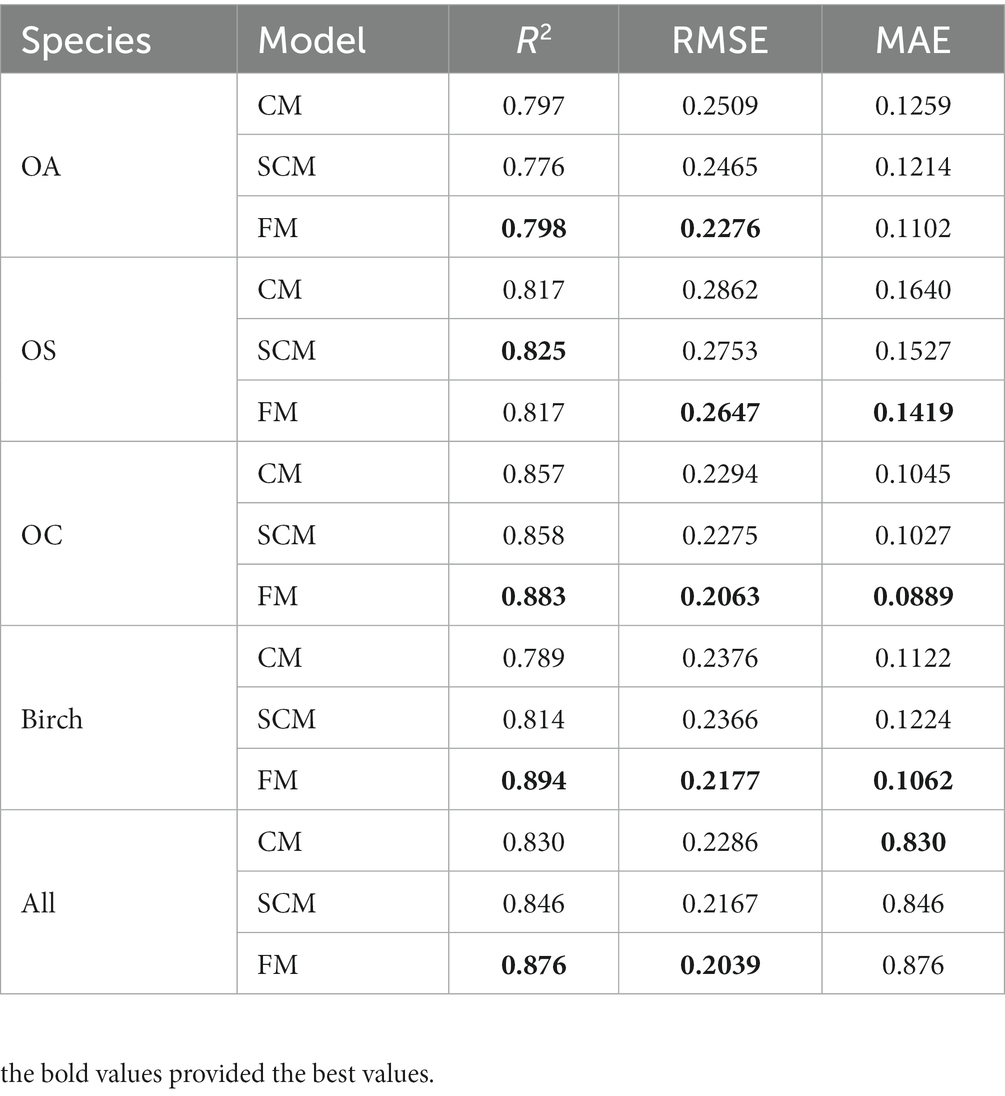
Table 11. Results of 10-fold cross-validation.
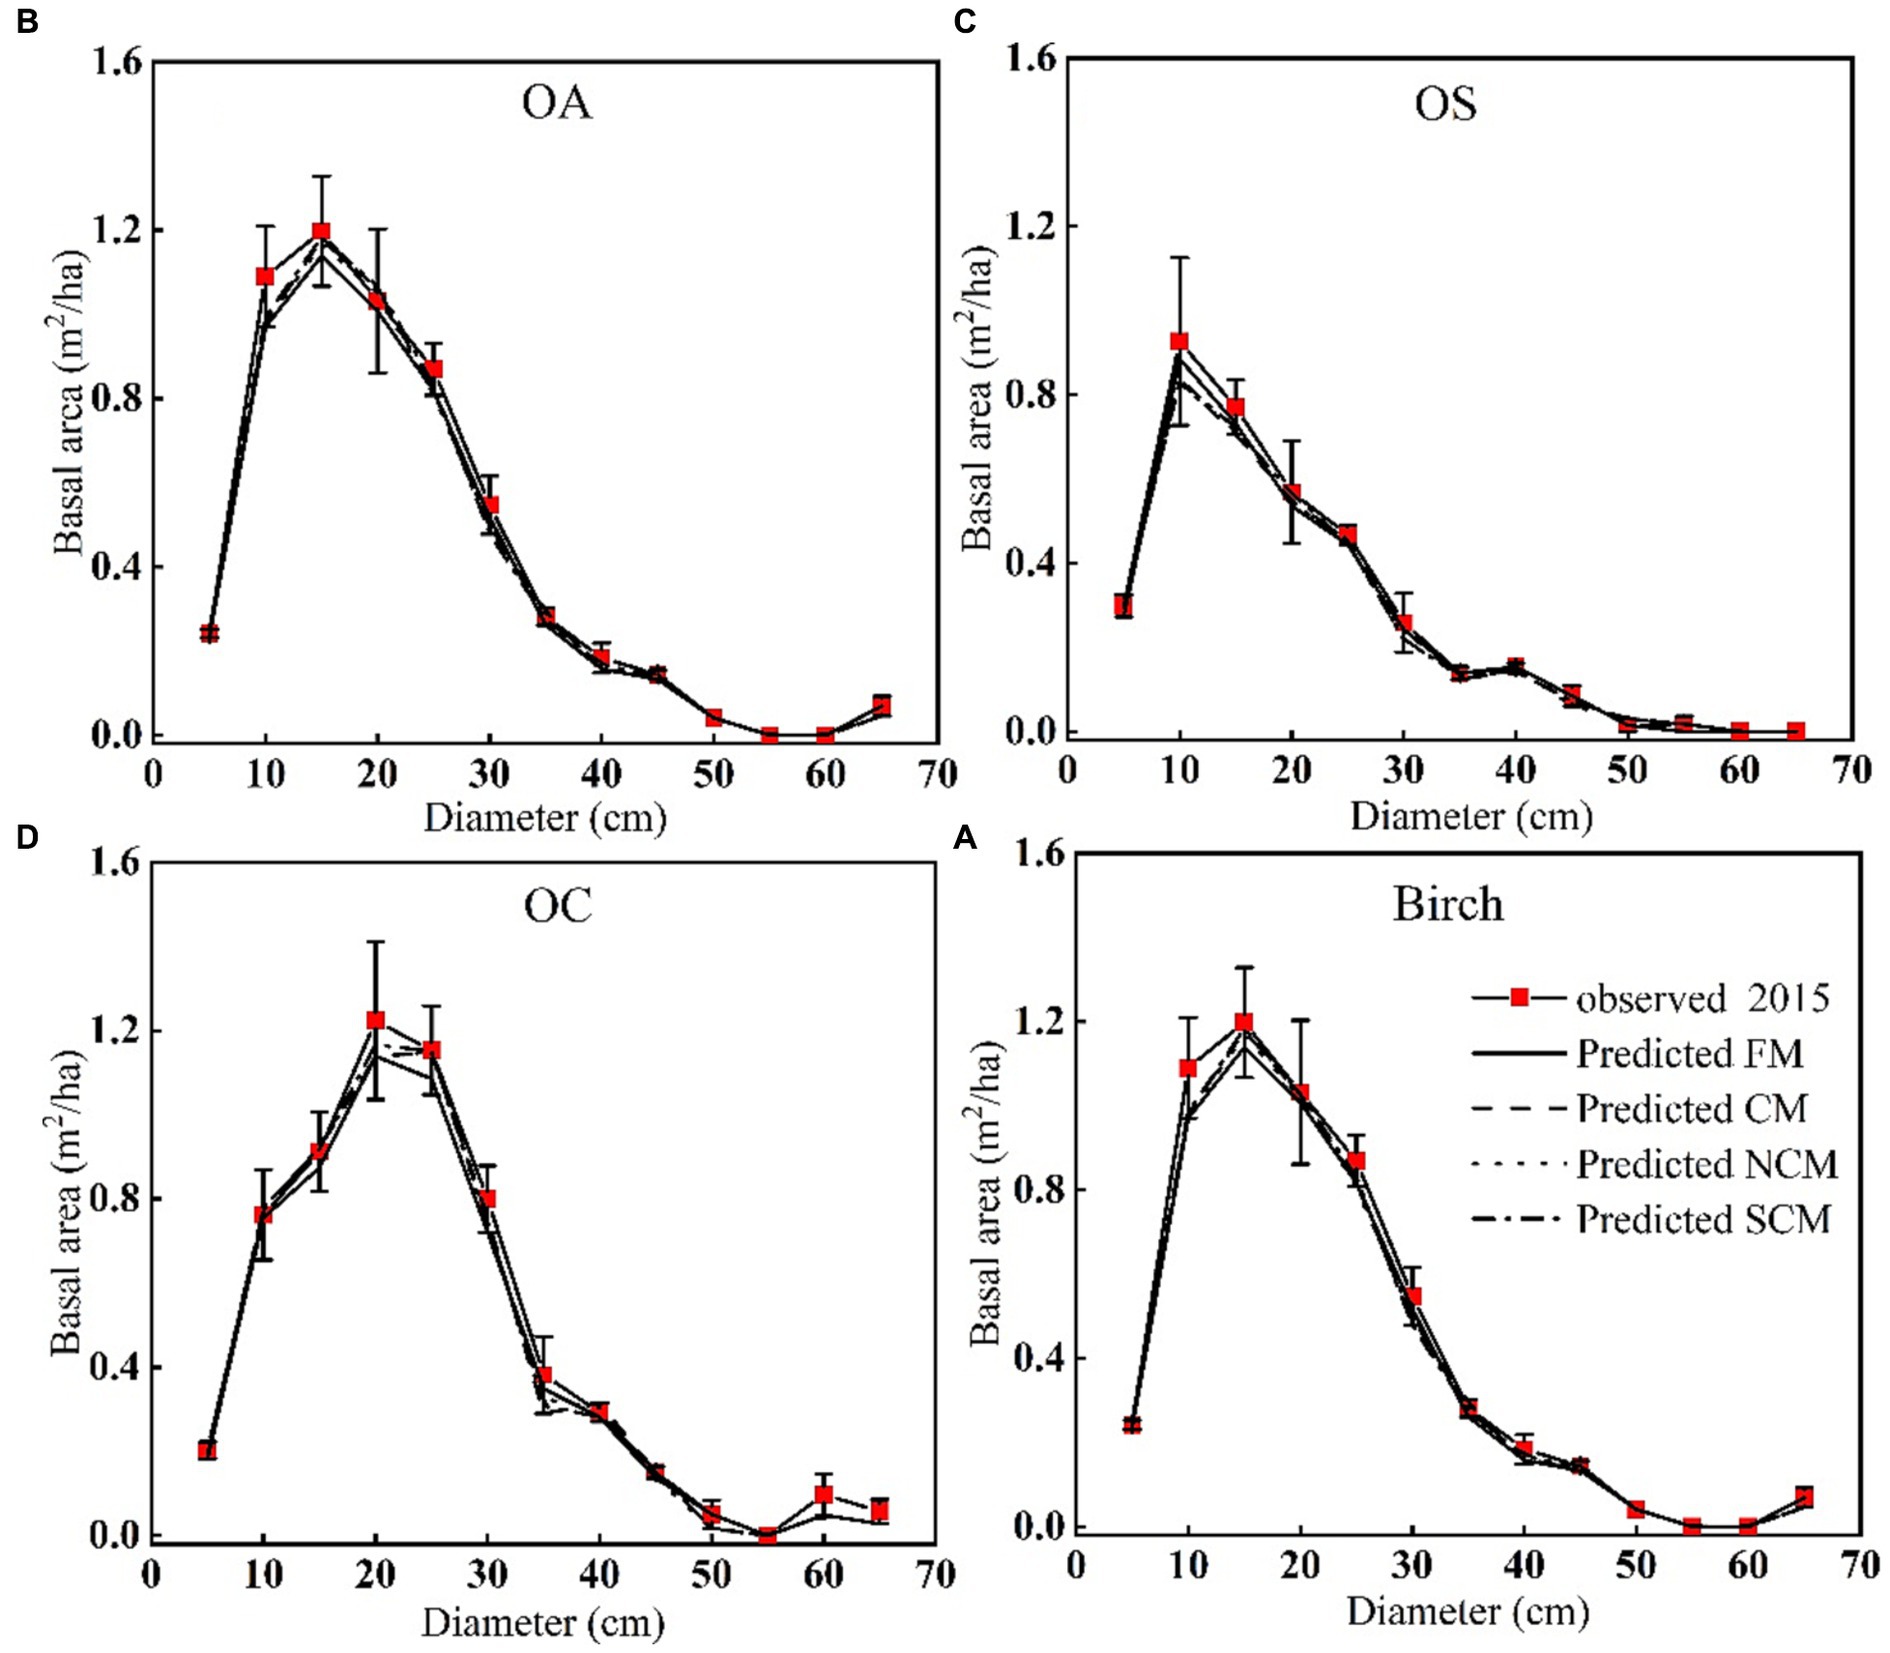
Figure 4. Basal area of different diameter for each tree species group plots. Average predicted and observed basal area by diameter class of (A) OA, (B) OS, (C) OC, (D) Birch.
3.3 Long-term prediction of major tree species to future climate change
Figure 5 shows that the fixed parameter transition matrix model (FM) did not depend on stand and climate conditions, and the prediction of N showed a linear growth pattern. According to the three different RCPs, the CM-predicted N showed an increasing trend. After 2040, the increasing trend of RCP8.5 was obvious, and the RCP8.5-predicted N was higher than those of RCP2.6 and RCP4.5 over time for all three different scenarios; RCP2.6 leveled off after 2070. We found that the difference between the CM and SCM was small in the short-term projections, but there was a significant difference between the CM and SCM in the long-term projections for the next 85 years under three different climate change scenarios; the number of trees (N) predicted by the two models showed a significant change (Figure 5). The N predicted by SCM under three different RCPs indicated that RCP2.6 showed a significant decreasing trend, except for 126, where RCP4.5 and RCP8.5 showed an increasing trend, with RCP8.5 having the fastest increase. Plots 126, 305, 250, and 297 all showed lower SCM-predicted N than CM-predicted N. Figure 6 shows that the basal area (BA) predicted by FM had a linear increasing pattern. In contrast, the CM-predicted BA, in general, showed a growing pattern and a large increase under RCP8.5 conditions, while the BA predicted under RCP2.6 showed a small increasing pattern. We found that for SCM, BA showed a flat or decreasing trend under RCP2.6 and an increasing trend under RCP8.5 and RCP4.5, with a significant increase under RCP8.5. This may be because changes in the spatial structure of the stand impact the trees’ sensitivity to climate change.
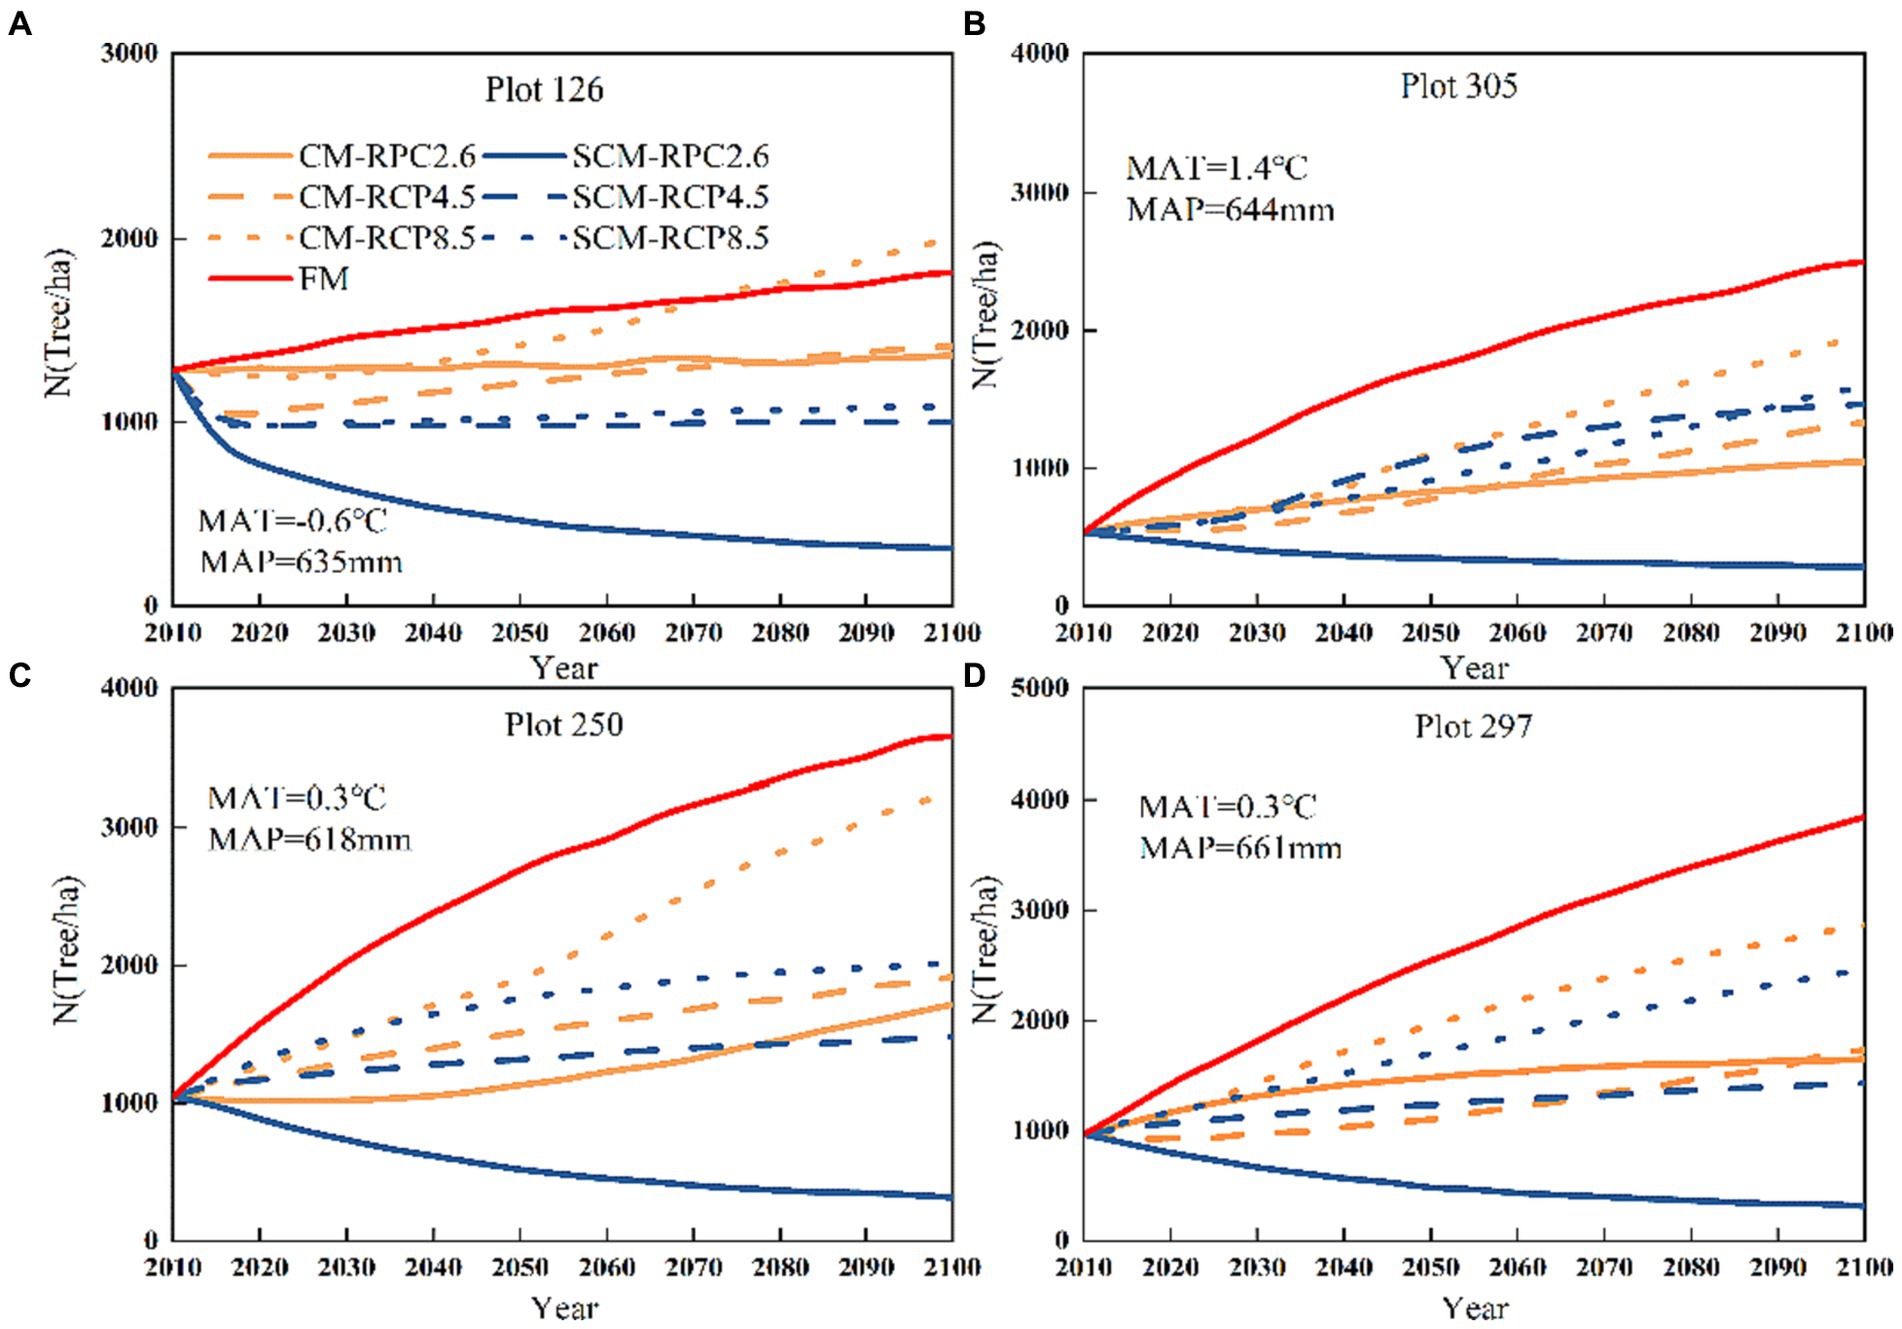
Figure 5. Plot numbers (A) 126, (B) 305, (C) 250 and (D) 297 tree numbers change under three different RCPs (2010–2100).
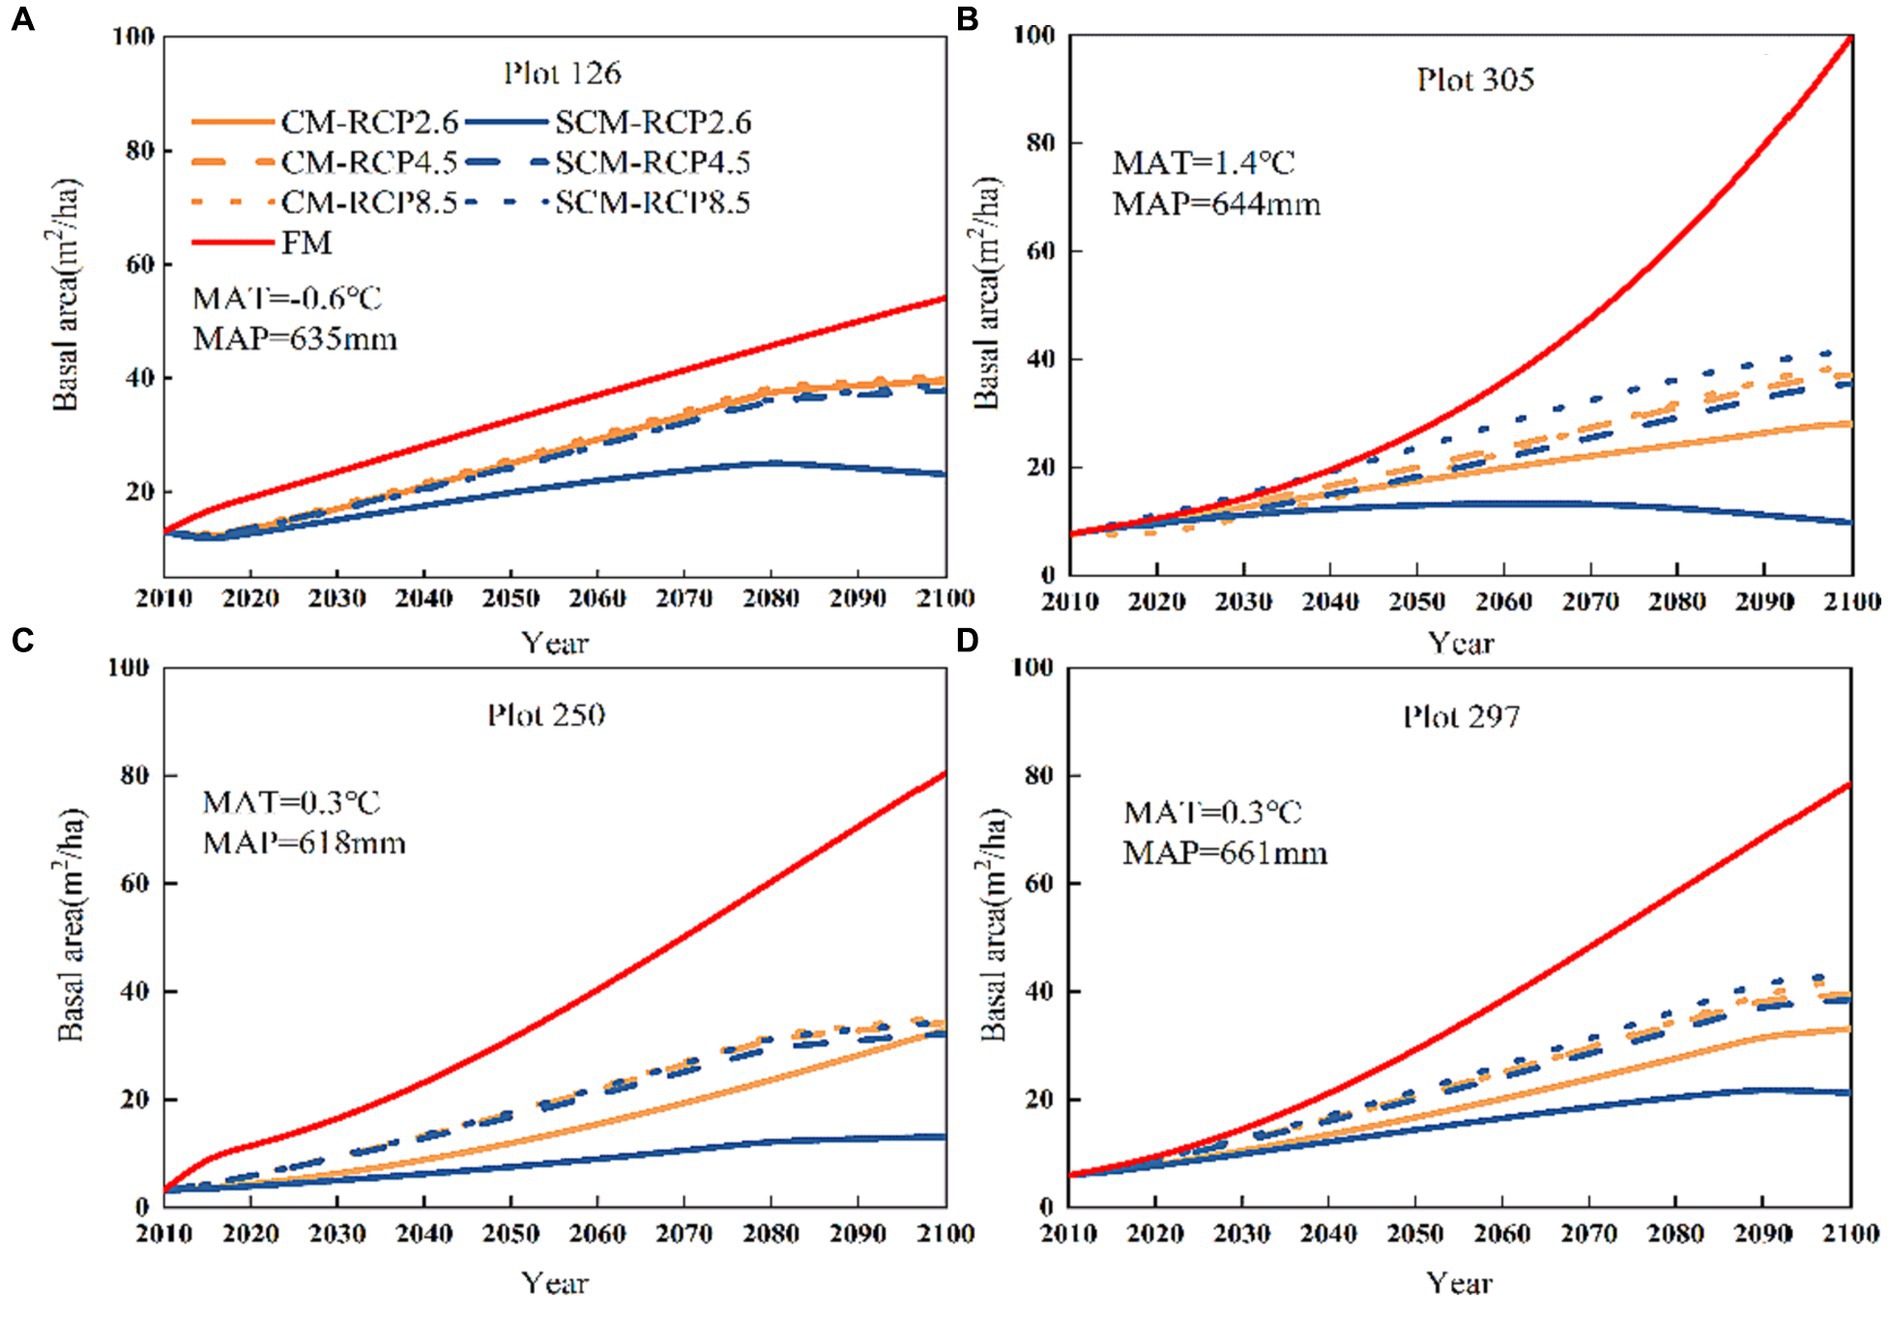
Figure 6. Plot numbers (A) 126, (B) 305, (C) 250, and (D) 297 Basal area change under three different RCPs (2010–2100).
Tree species diversity (H1) predicted by FM was relatively stable over time, and RCP8.5 initially showed an increasing trend for H1 predicted by CM under the three different climate scenarios but then stabilized. In contrast, RCP4.5 and RCP2.6 showed a small increasing pattern over 85 years, with only small differences between RCP4.5 and RCP2.6, except for plot 126 (Figure 7). Under RCP2.6 and RCP4.5, the CM-predicted tree species diversity (H1) for plots 126 and 305 tended to increase then decrease, while the SCM-predicted H1 showed a pattern of first decreasing, then increasing and then leveling off. In the RCP8 scenario, the CM-predicted H1 for plot 297 showed first an increase and then leveled off, while the SCM-predicted H1 showed first a small decrease and then leveled off.
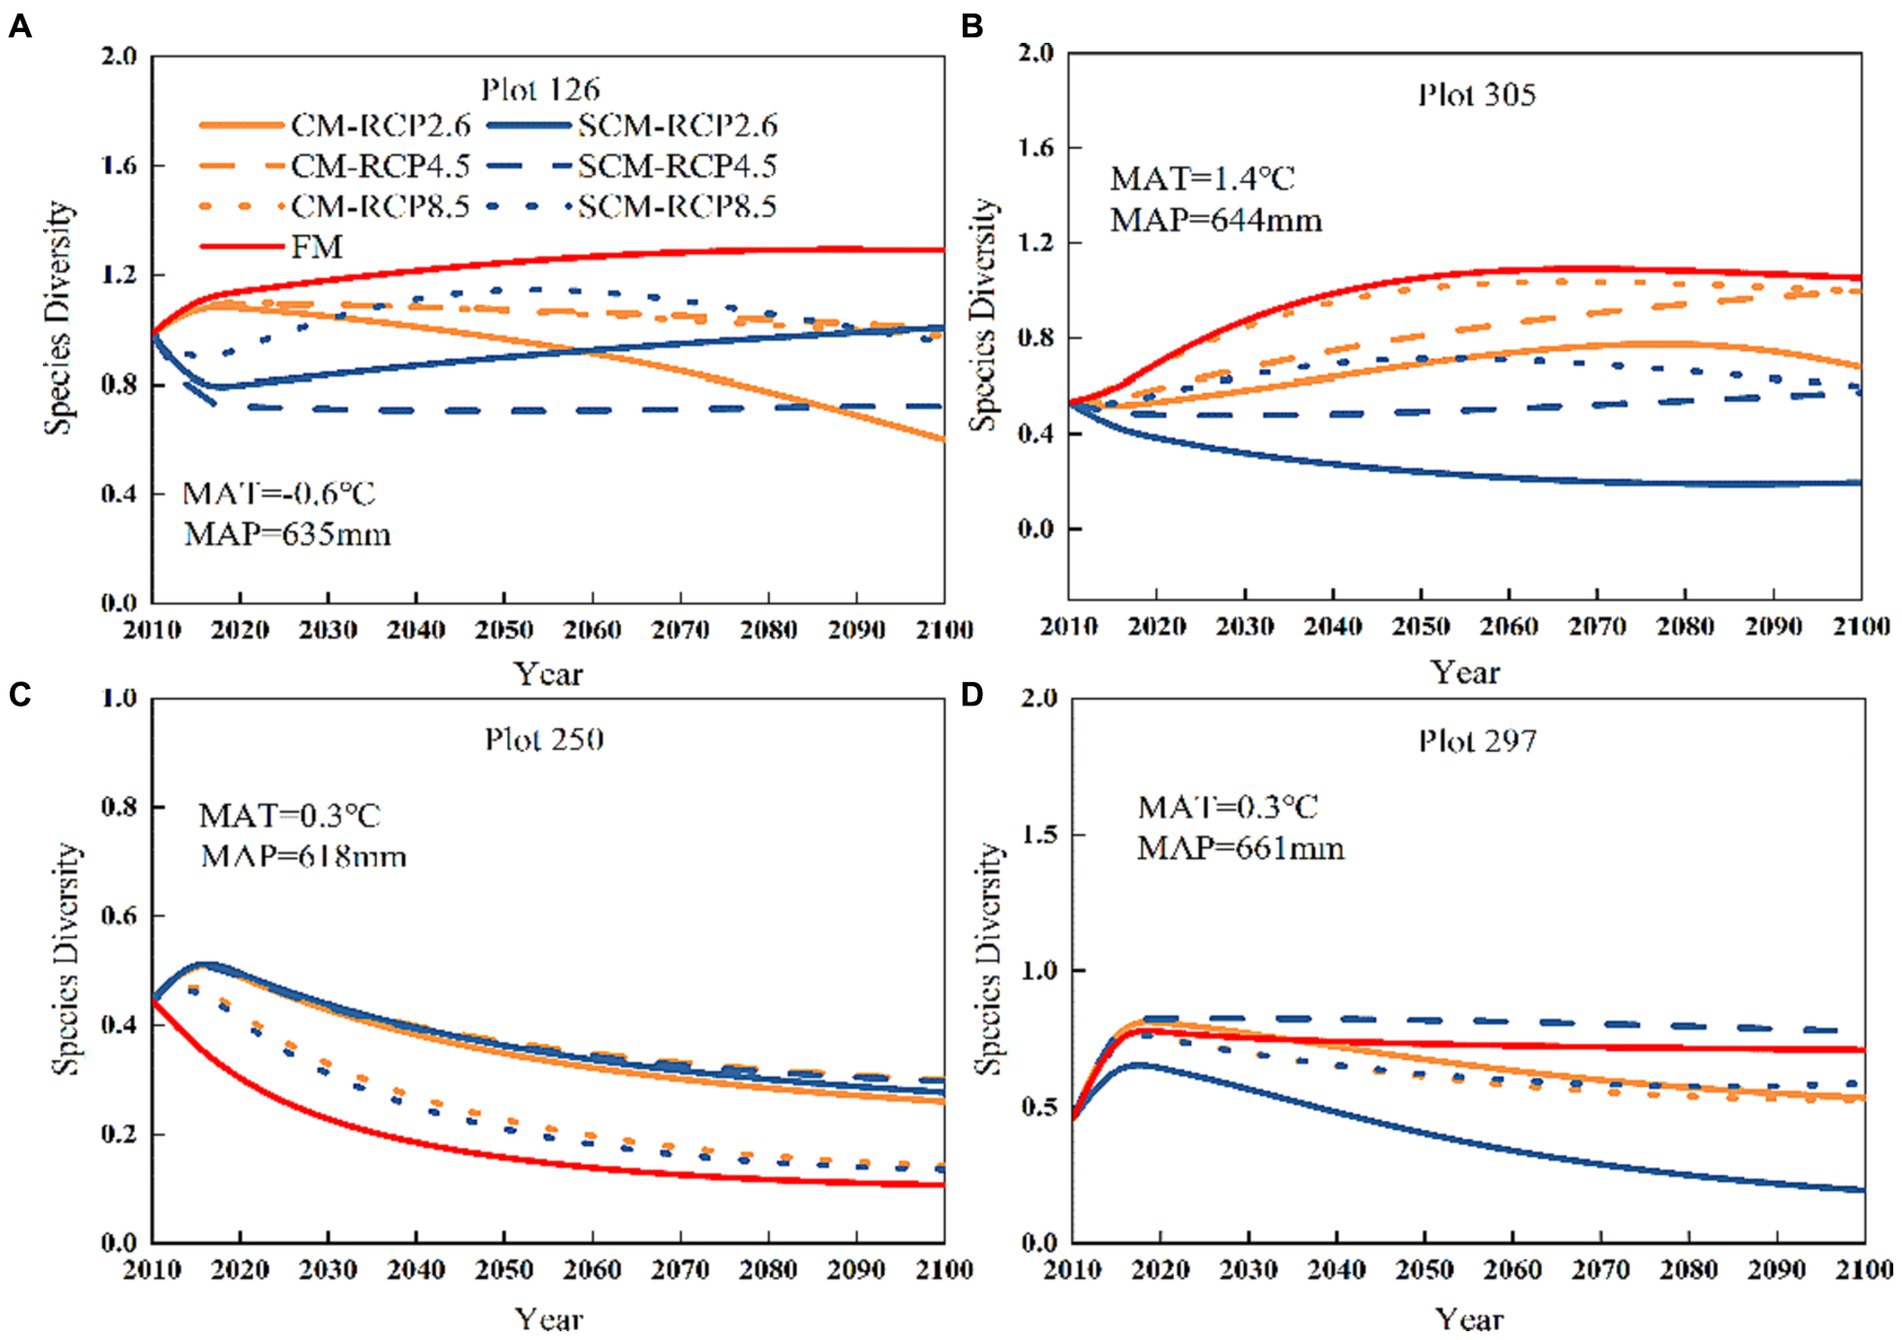
Figure 7. Plot numbers (A) 126, (B) 305, (C) 250 and (D) 297 species diversity change under three different RCPs (2010–2100).
In general, FM-predicted tree size diversity (H2) showed an increasing trend over 85 years (Figure 8). In contrast, under the three different climate change scenarios, H2 predicted by CM initially showed an increasing pattern, with a generally flattening pattern observed after 2080. Furthermore, the highest H2 predictions were observed under RCP2.6 for plots 126, 305, and 297. But, the two models in the three different scenarios predicted little variability in H2, and the tree size diversity trend was the same, with a gradual upward trend generally observed, which tended to level off after 2080.
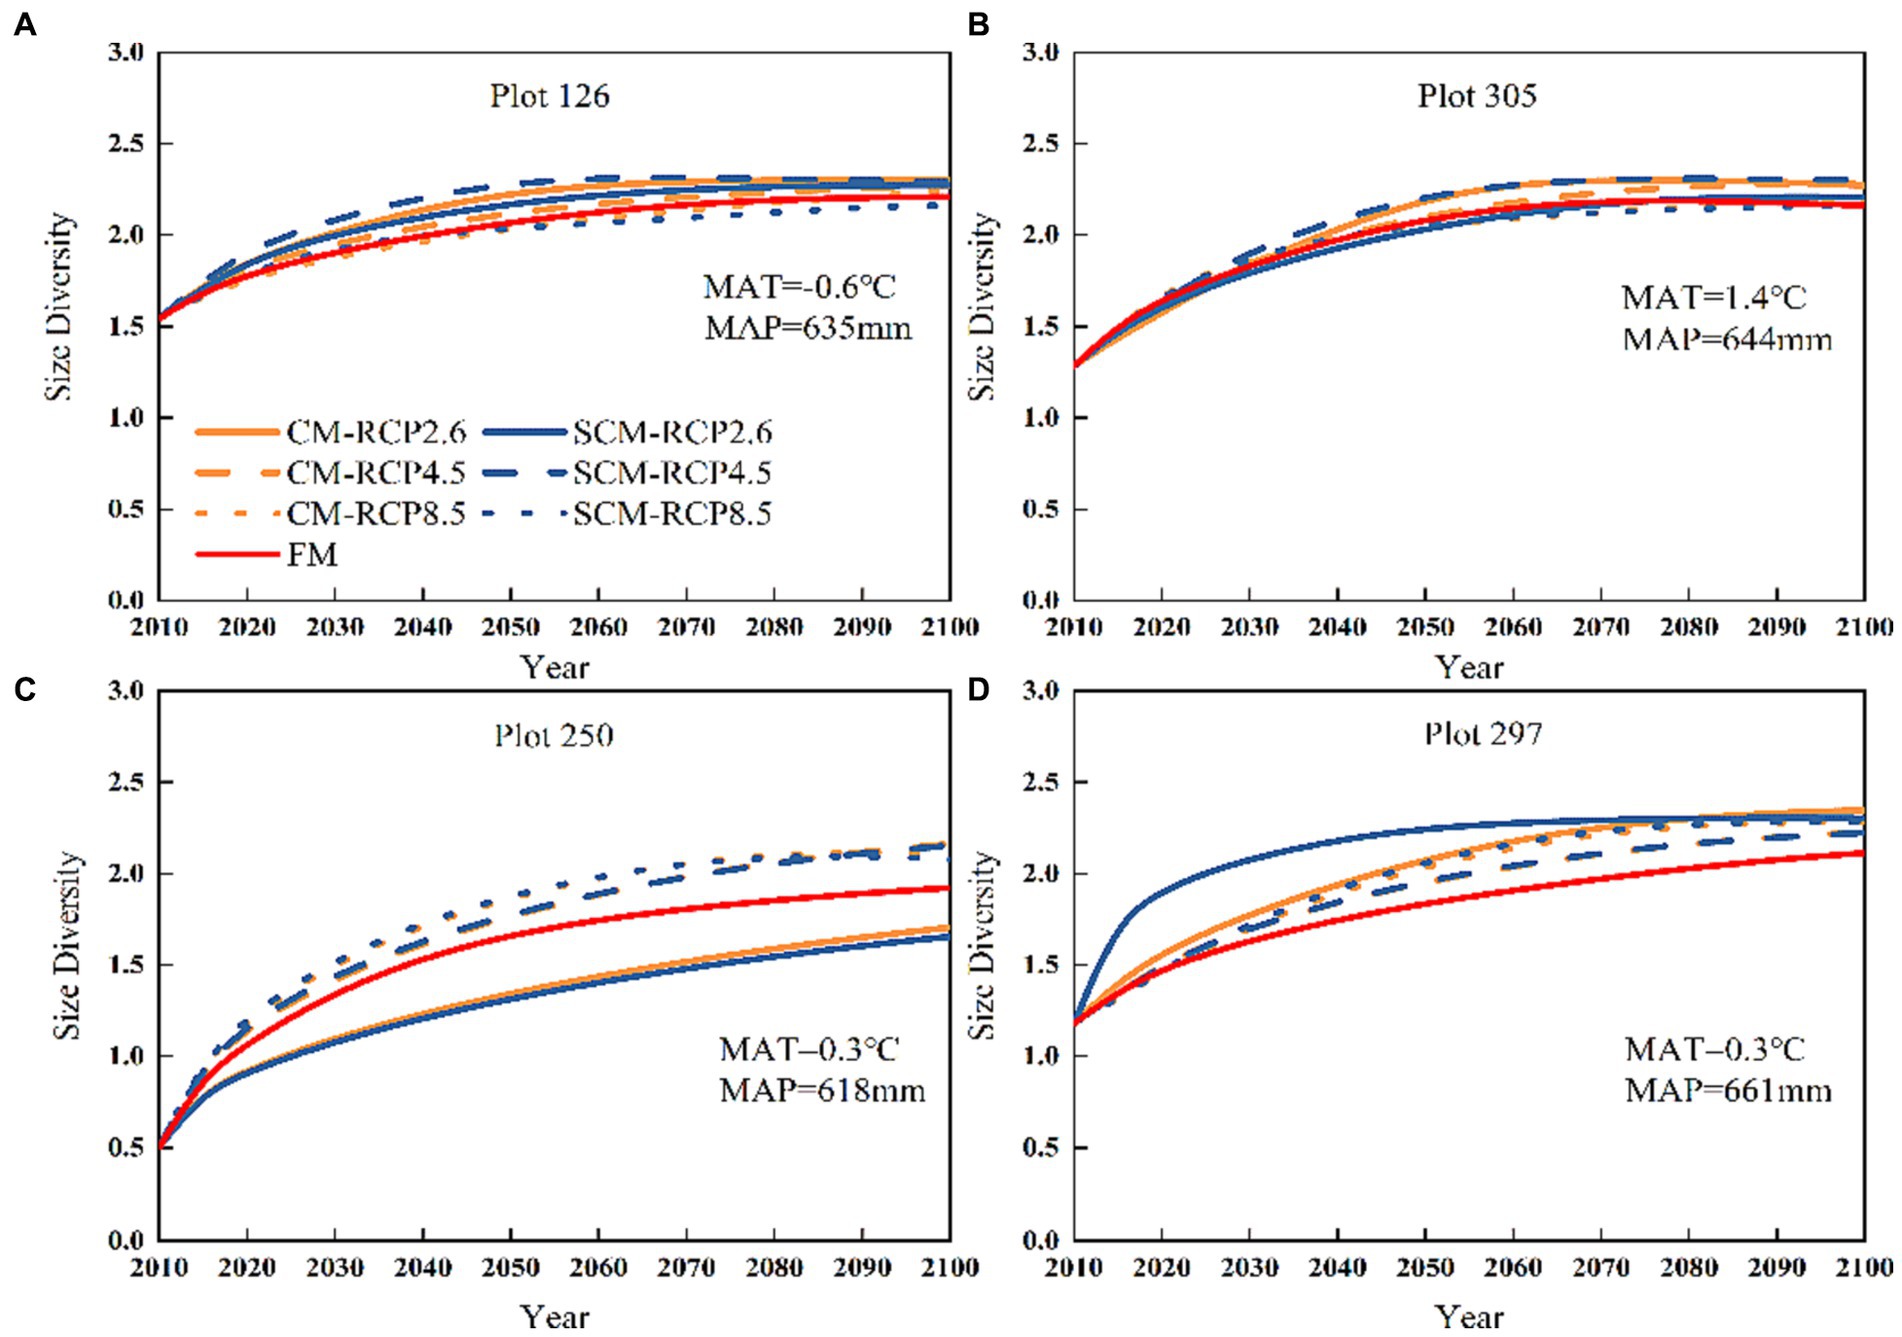
Figure 8. Plot numbers (A) 126, (B) 305, (C) 250 and (D) 297 tree size diversity change under three different RCPs (2010–2100).
4 Discussion
The mean annual temperature (MAT) had a significant negative effect on the Birch and OS diameter growth in this study, while it had a significant positive effect on OC. However, there is no uniform conclusion on whether tree growth responds positively or negatively to temperature. Related studies have shown that average temperatures have a significant positive effect on diameter growth (Foster et al., 2016; Burkhart et al., 2018). Some studies have also shown that elevated temperatures inhibit tree growth, and elevated temperatures are an important factor in sudden droughts if the increase in temperature is not accompanied by an increase in precipitation. Additionally, the temperature has an important effect on seedling growth, as increasing temperature intensifies water evaporation and reduces the soil water content, thus inhibiting tree growth (Pillet et al., 2017; Davis et al., 2019). Similar results were obtained in our study.
MAT was significantly and positively correlated with Birch, OS, and OC mortality but negatively correlated with OA mortality. Temperature and precipitation lead to increased tree mortality, especially in semihumid and semiarid regions, where increased temperature increases tree mortality (Park et al., 2012; Dai, 2013).
In addition to temperature, precipitation is also a key factor affecting forest growth. The increase in precipitation contributed to the diameter growth of the stands during the growing season (Lie et al., 2018; Wise and Dannenberg, 2022), which is consistent with the significant positive correlation between MAP and OC, while MAP was significantly negatively correlated with birch, indicating that precipitation may not be a limiting factor for this species group. Additionally, the effect of precipitation on forest biomass is related to forest type, and tree species in different regions do not respond to climate change in the same way (Qiao et al., 2022). Mean annual precipitation (MAP) in this study was significantly positively correlated with Birch and OA mortality, and recruitment was significantly negatively correlated. As precipitation increased, stand diameter and density increased, leading to increased competitive pressure, which reduced tree seedling survival, resulting in higher mortality.
An increase in the M-index, a parameter reflecting the characteristics of species diversity at the scale of adjacent tree spatial units, promotes stand growth. The results of this paper corroborated this pattern (Steckel et al., 2020), where elevated M-index promotes birch diameter growth while inhibiting OS and OC diameter growth, resulting in increased OA, OS, and OC mortality and decreased recruitment. The U-index and C-index reflect the competition between trees, competitive relationships among trees affect the forests’ response to climate change and that the sensitivity of competition is influenced by temperature and precipitation. At the same competition level, increasing temperature and precipitation promote competition between trees (Ruiz-Benito et al., 2014; Reich et al., 2018). The overall decrease in tree diameter growth with increasing U-index and C-index, stand mortality increases with increasing U-index and C-index (Lei et al., 2009; Xiang et al., 2016). The U-index and C-index were significantly negatively correlated with the diameter growth of all tree species (groups) and significantly positively correlated with tree mortality and recruitment. Increasing the U-index decreased the diameter growth of the trees to a much greater extent than decreasing the mixing degree. Generally, when the stand W-index is larger, it indicates a higher degree of aggregation among trees, a higher competitive pressure, which negatively affects the tree growth (Hisano et al., 2019).
Tree species diversity (H1) was positively correlated with Birch, OS, and OC diameter growth, indicating that higher species diversity promotes tree growth. Many studies have shown that increasing the number of tree species changes the structure of forests so that differences in access to light and spatial resources by multiple mixed species result in enhanced ecological niche differences, which in turn have a positive impact on species diversity (Loreau and Hector, 2001;Turnbull et al., 2016; Ingram et al., 2018; Vargas-Larreta et al., 2021). H1 was negatively correlated with the number of recruits and mortality in Birch and OA. Tree species diversity (H1) harms recruitment and mortality.
In this study, tree size diversity (H2) was positively correlated with diameter growth in Birch, indicating that increasing tree size diversity can promote tree growth and recruitment. H2 was positively correlated with the mortality of all tree species. Other studies have reached the same conclusion changes (Antonio et al., 2016; Fichtner et al., 2018). However, there are also relevant studies showing that tree size diversity leads to reduced diameter growth (Charles et al., 2004; Wright et al., 2014), and a similar phenomenon was found in our study, where tree size diversity (H2) was negatively correlated with the diameter growth of OS and with the number of OS and OC recruits. This indicates that tree size diversity harms tree growth and recruitment, that tree size diversity influences tree distribution patterns and thus affects tree growth and recruitment (Wang et al., 2016).
The predicted N under the three different RCPs showed a slight decreasing or increasing trend, indicating that drought stress caused by temperature increase could be mitigated by increasing precipitation under future climate change. The increase under RCP8.5 was greater than that under RCP4.5 and RCP2.6 under the three RCPs, following the same trend as the future temperature increase. While the predicted stand densities under RCP2.6 tended to decrease significantly under the competition-climate interaction, the stand densities increased with increasing emissions. The increase in emissions will lead to a significant increase in stand density and basal area, and a high stand density will reduce the economic value of the forest (Liang and Picard, 2013; Zhang et al., 2022). Basal area, on the other hand, tended to increase slightly between all three RCPs and did not vary significantly between the three RCPs, with RCP8.5 being slightly larger than RCP4.5 and RCP2.6. Due to the interaction between competition and climate, the predicted basal area under RCP2.6 is stable or slightly decreasing. This suggests that the sensitivity of trees to climate is influenced by changes in the spatial structure of stands.
The atmospheric CO2 concentration was positively correlated with MAT and MAP. Predicted species diversity under these three climate scenarios first trended upward and then downward, suggesting that species diversity may be negatively affected by climate change (Yang et al., 2006). The long-term predicted size diversity under the three RCPs had the same trend as the predicted species diversity trends, suggesting that climate change (increased CO2) can reduce tree size diversity and that the reduction trend depends on emissions (Du et al., 2020; Zhang et al., 2022). Competition among trees (C-index and U-index) affects the forests’ response to climate change, and the competition-tree climate sensitivity relationship, which gradually increases with increasing stand density and decreasing temperature and precipitation, shows that climate and competition together affect tree growth, basal area, etc. (Liang et al., 2017). The M-index and U-index, however, have the most significant effects on species diversity, while the spatial distribution pattern of trees also directly affects diameter growth, seedling growth, and survival (Wang et al., 2016).
5 Conclusion
We introduced the stand spatial structure parameters and climate variables developed a climate-spatial transition matrix growth model (SCM) to forecast the dynamics major tree species in Lesser Khingan Mountains under the three simulated future climate scenarios. In order to compare and analyze the prediction effects of the model, we conducted a comparative analysis with a fixed probability transition matrix model (FM) and a climate-sensitive transition matrix growth model (CM).
The results show that the 10-fold cross validation indicated minimal differences among the three predictive models. However, for long-term projections, the climate-spatial model outperformed the fixed probability and climate models, providing more reliable forecasts under the three different representative concentration pathways (RCPs). Therefore, the FM model we established is only suitable for short-term predictions (5 years) when climate and site conditions remain stable; it is not suitable for long-term projections. But the climate-sensitive transition matrix growth model will make a substantial contribution to long-term projections of major tree species in Lesser Khingan forests, which provide a theoretical basis for forest management in response to climate change and stand spatial structure adjustment under climate change. Meanwhile, the introduction of the interaction between stand spatial structure and climate can improve the model estimation accuracy, but the interaction effect of different stand spatial structure indicators and climate factor composition is not consistent and can be explored in future studies.
Data availability statement
The original contributions presented in the study are included in the article/Supplementary material, further inquiries can be directed to the corresponding author.
Author contributions
QS: Conceptualization, Data curation, Methodology, Software, Writing – original draft, Formal analysis. ZL: Conceptualization, Funding acquisition, Project administration, Supervision, Writing – review & editing. LD: Supervision, Writing - review & editing.
Funding
The author(s) declare financial support was received for the research, authorship, and/or publication of this article. This work was funded by the National Key Research and Development Program of China.
Conflict of interest
The authors declare that the research was conducted in the absence of any commercial or financial relationships that could be construed as a potential conflict of interest.
Publisher’s note
All claims expressed in this article are solely those of the authors and do not necessarily represent those of their affiliated organizations, or those of the publisher, the editors and the reviewers. Any product that may be evaluated in this article, or claim that may be made by its manufacturer, is not guaranteed or endorsed by the publisher.
Supplementary material
The Supplementary material for this article can be found online at: https://www.frontiersin.org/articles/10.3389/ffgc.2023.1309189/full#supplementary-material
Footnotes
References
Akane, A., Christopher, W., and Javier, G. (2021). Forest migration outpaces tree species range shift across North America. Biol. Sci. 8. doi: 10.21203/rs.3.rs-840978/v1
Allen, C. D., Macalady, A. K., Chenchouni, H., Bachelet, D., Mcdowell, N., and Vennetier, M. (2010). A global overview of drought and heat-induced tree mortality reveals emerging climate change risks for forests. For. Ecol. Manag. 259, 660–684. doi: 10.1016/j.foreco.2009.09.001
Antonio, G. Q. J., Roberto, A., and Cordero, S. (2016). Neighborhood structure influences the convergence in light capture efficiency and carbon gain: an architectural approach for cloud forest shrubs. Tree Physiol. 36, 712–724. doi: 10.1093/treephys/tpw012
Any, M., Ion, C., Andrea, H., Helge, W., and Olivier, B. (2021). Climate warming predispose sessile oak forests to drought-induced tree mortality regardless of management legacies. For. Ecol. Manag. 491:119097. doi: 10.1016/j.foreco.2021.119097
Bayat, M., Knoke, T., Heidari, S., Hamidi, S. K., Burkhart, H., and Jaafari, A. (2022). Modeling tree growth responses to climate change: a case study in natural deciduous mountain forests. Forests 13:1816. doi: 10.3390/f13111816
Burkhart, H. E., Brooks, E. B., Dinon-Aldridge, H., Sabatia, C. O., Gyawali, N., Wynne, R. H., et al. (2018). Regional simulations of loblolly pine productivity with CO2 enrichment and changing climate scenarios. For. Sci. 64, 349–357. doi: 10.1093/forsci/fxy008
Campbell, E. M., Magnussen, S., Antos, J. A., and Parish, R. (2021). Size-, species-, and site-specific tree growth responses to climate variability in old-growth subalpine forests. Ecosphere 12:e03529. doi: 10.1002/ecs2.3529
Charles, D., Canham, P. T., LePage, K., and Dave, C. (2004). A neighborhood analysis of canopy tree competition: effects of shading versus crowding. Can. J. For. Res. 34, 778–787. doi: 10.1139/x03-232
Chen, S., Jiang, Z. H., Chen, W. L., and Laurent, L. (2008). Changes in temperature extremes over China under 1.5°C and 2°C global warming targets. Adv. Clim. Chang. Res. 9, 120–129. doi: 10.1016/j.accre.2017.11.003
Choi, J., and An, H. (2008). A forest growth model for the natural broadleaved forests in northeastern Korea. Forests 7:288. doi: 10.3390/f7110288
Dai, A. (2013). Increasing drought under global warming in observations and models. Nat. Clim. Chang. 3, 52–58. doi: 10.1038/nclimate1633
Davis, K. T., Dobrowski, S. Z., Higuera, P. E., Holden, Z. A., Veblen, T. T., Rother, M. T., et al. (2019). Wildfires and climate change push low-elevation forests across a critical climate threshold for tree regeneration. Proc. Natl. Acad. Sci. U.S.A. 116, 6193–6198. doi: 10.1073/pnas.1815107116
Du, X., Chen, X. Y., Zeng, W. S., and Meng, J. H. (2020). A climate-sensitive transition matrix growth model for uneven-aged mixed-species oak forests in north China. Forestry 2:2. doi: 10.1093/forestry/cpaa035
Fichtner, A., Härdtle, W., Bruelheide, H., Kunz, M., Li, Y., and Oheimb, G. V. (2018). Neighbourhood interactions drive overyielding in mixed-species tree communities. Nat. Commun. 9:1144. doi: 10.1038/s41467-018-03529-w
Foster, J. R., Finley, A. O., D’Amato, A. W., Bradford, J. B., and Banerjee, S. (2016). Predicting tree biomass growth in the temperate-boreal ecotone: is tree size, age, competition, or climate response most important? Glob. Chang. Biol. 22, 2138–2151. doi: 10.1111/gcb.13208
Guo, H., Lei, X., You, L., Zeng, W., Lang, P., and Lei, Y. (2022). Climate-sensitive diameter distribution models of larch plantations in north and northeast China. For. Ecol. Manag. 506:119947. doi: 10.1016/j.foreco.2021.119947
Gustafson, E. J., Kern, C. C., Miranda, B. R., Sturtevant, B. R., Bronson, D. R., and Kabrick, J. M. (2020). Climate adaptive silviculture strategies: how do they impact growth, yield, diversity and value in forested landscapes? For. Ecol. Manag. 470–471:118208. doi: 10.1016/j.foreco.2020.118208
Hao, Q., Meng, F., and Zhou, Y. (2005). Determining the optimal selective harvest strategy for mixed-species stands with a transition matrix growth model. New For. 29, 207–219. doi: 10.1007/s11056-005-5656-0
Here, A. M., Petritan, I. C., Bigler, C., Curtu, A. L., and Yuste, J. C. (2020). Legacies of past forest management determine current responses to severe drought events of conifer species in the Romanian Carpathians. Sci. Total Environ. 751:141851. doi: 10.1016/j.scitotenv.2020.141851
Hisano, M., Chen, H. Y. H., Searle, E. B., and Reich, P. B. (2019). Species-rich boreal forests grew more and suffered less mortality than species-poor forests under the environmental change of the past half-century. Ecol. Lett. 22, 999–1008. doi: 10.1111/ele.13259
Holtmann, A., Huth, A., Pohl, F., Rebmann, C., and Fischer, R. (2021). Carbon sequestration in mixed deciduous forests: the influence of tree size and species composition derived from model experiments. Forests 12:726. doi: 10.3390/f12060726
Hui, G., Zhang, G., and Zhao, Z. (2019). Methods of forest structure research: a review. Curr. For. Rep. 5, 142–154. doi: 10.1007/s40725-019-00090-7
Ingram, T., Costa-Pereira, R., and Araújo, M. S. (2018). The dimensionality of individual niche variation. Ecology 99, 536–549. doi: 10.1002/ecy.2129
Lei, X. D., Wang, W. F., and Peng, C. G. (2009). Relationships between stand growth and structural diversity in spruce-dominated forests in New Brunswick, Canada. Can. J. For. Res. 39, 1835–1847. doi: 10.1139/X09-089
Liang, J., Buongiorno, J., and Monserud, R. A. (2005). Growth and yield of all-aged Douglas-fir -western hemlock forest stands: a matrix model with stand diversity effects. Can. J. For. Res. 35, 2368–2381. doi: 10.1139/x05-137
Liang, Y., Duveneck, M. J., Gustafson, E. J., Serra-Diaz, J. M., and Thompson, J. R. (2017). How disturbance, competition, and dispersal interact to prevent tree range boundaries from keeping pace with climate change. Glob. Chang. Biol. 24, e335–e351. doi: 10.1111/gcb.13847
Liang, Y., Gustafson, E. J., He, H. S., Serra-Diaz, J. M., Duveneck, M. J., and Thompson, J. R. (2022). What is the role of disturbance in catalyzing spatial shifts in forest composition and tree species biomass under climate change? Glob. Chang. Biol. 29, 1160–1177. doi: 10.1111/gcb.16517
Liang, J., and Picard, N. (2013). Matrix model of forest dynamics: an overview and outlook. For. Sci. 59, 359–378. doi: 10.5849/forsci.11-123
Liang, J., Zhou, M., Verbyla, D. L., Zhang, L., Springsteen, A. L., and Malone, T. (2011). Mapping forest dynamics under climate change: a matrix model. For. Ecol. Manag. 262, 2250–2262. doi: 10.1016/j.foreco.2011.08.017
Lie, Z., Xue, L., and Jacobs, D. F. (2018). Allocation of forest biomass across broad precipitation gradients in China’s forests. Sci. Rep. 8:10536. doi: 10.1038/s41598-018-28899-5
Liu, Y., Feng, J., and Ma, Z. (2014). An analysis of historical and future temperature fluctuations over China based on CMIP5 simulations. Adv. Atmos. Sci. 31, 457–467. doi: 10.1007/s00376-013-3093-0
Loreau, M., and Hector, A. (2001). Erratum: Partitioning selection and complementarity in biodiversity experiments. Nature 413:548. doi: 10.1038/35097128
Ma, T. X., Liang, Y., Li, Z. Y., Liu, Z. H., Liu, B., Wu, M. M., et al. (2023). Age-related patterns and climatic driving factors of drought-induced forest mortality in northeast China. Agric. For. Meteorol. 332:109360. doi: 10.1016/j.agrformet.2023.109360
Murray, A. C., and Woodward, S. (2003). In vitro interactions between bacteria isolated from Sitka spruce stumps and Heterobasidion annosum. For. Pathol. 33, 53–67. doi: 10.1046/j.1439-0329.2003.00307.x
Park, W. A., Allen, C. D., and Macalady, A. K. (2012). Temperature as a potent driver of regional forest drought stress and tree mortality. Nat. Clim. Chang. 3, 292–297. doi: 10.1038/nclimate1693
Pillet, M., Joetzjer, E., and Belmin, C. (2017). Disentangling competitive vs climatic drivers of tropical forest mortality. J. Ecol. 106, 1165–1179. doi: 10.1111/1365-2745.12876
Qiao, J., Sun, Y., and Pan, L. (2022). Variability in the climate-radial growth correlation of Pinus massoniana of different diameter classes. J. For. Res. 33, 1781–1792. doi: 10.1007/s11676-022-01472-7
Reich, P. B., Sendall, K. M., and Stefanski, A. (2018). Effects of climate warming on photosynthesis in boreal tree species depend on soil moisture. Nature 562, 263–267. doi: 10.1038/s41586-018-0582-4
Roberts, M. R., and Hruska, A. J. (1986). Predicting diameter distributions: a test of the stationary Markov model. Can. J. For. Res. 16, 130–135. doi: 10.1139/x86-022
Roitman, I., and Vanclay, J. K. (2015). Assessing size-class dynamics of a neotropical gallery forest with stationary models. Ecol. Model. 297, 118–125. doi: 10.1016/j.ecolmodel.2014.11.009
Ruiz-Benito, P., Madrigal-González, J., and Ratcliffe, S. (2014). Stand structure and recent climate change constrain stand basal area change in European forests: a comparison across boreal, temperate, and Mediterranean biomes. Ecosystems 17, 1439–1454. doi: 10.1007/s10021-014-9806-0
Sibyll, S., Christopher, P. O. R., Dmitry, S., Dieter, G., and Anatoly, S. (2016). Tamm review: observed and projected climate change impacts on Russia’s forests and its carbon balance. For. Ecol. Manag. 361, 432–444. doi: 10.1016/j.foreco.2015.11.043
Stage, A. R. (1976). An expression for the effect of aspect, slope, and habitat type on tree growth. For. Sci. 22, 457–460.
Steckel, M., del Río, M., Heym, M., Aldea, J., Bielak, K., Brazaitis, G., et al. (2020). Species Mixing Reduces Drought Susceptibility of Scots Pine (Pinus Sylvestris L.) and Oak (Quercus Robur L., Quercus Petraea (Matt.) Liebl.) – Site Water Supply and Fertility Modify the Mixing Effect.. Forest Ecology and Management, 461, 117908. Available at: https://doi.org/10.1016/j.foreco.2020.117908.
Tian, D., Guo, Y., and Dong, W. (2015). Future changes and uncertainties in temperature and precipitation over China based on CMIP5 models. Adv. Atmos. Sci. 32, 487–496. doi: 10.1007/s00376-014-4102-7
Tobin, J. (1958). Estimation of relationships for limited dependent variables. Econometrica 26, 24–36. doi: 10.2307/1907382
Turnbull, L. A., Isbell, F., Purves, D. W., Loreau, M., and Hector, A. (2016). Understanding the value of plant diversity for ecosystem functioning through niche theory. Proc. R. Soc. B 283:20160536. doi: 10.1098/rspb.2016.0536
Vannoppen, A., Kint, V., and Ponette, Q. (2019). Tree species diversity impacts average radial growth of beech and oak trees in Belgium, not their long-term growth trend. For. Ecosyst. 6:10. doi: 10.1186/s40663-019-0169-z
Vargas-Larreta, B., López-Martínez, J. O., and González, E. J. (2021). Assessing above-ground biomass-functional diversity relationships in temperate forests in northern Mexico. For. Ecosyst. 8:8. doi: 10.1186/s40663-021-00282-3
Wang, J., Cheng, Y., Zhang, C., Zhao, Y., Zhao, X., and Gadow, K. (2016). Relationships between tree biomass productivity and local species diversity. Ecosphere 7:e01562. doi: 10.1002/ecs2.1562
Wang, H., Peng, H., and Hui, G. (2018). Large trees are surrounded by more heterospecific neighboring trees in Korean pine broad-leaved natural forests. Sci. Rep. 8:9149. doi: 10.1038/s41598-018-27140-7
Wise, E. K., and Dannenberg, M. P. (2022). Simulating the impacts of changes in precipitation timing and intensity on tree growth. Geophys. Res. Lett. 49:e2022GL100863. doi: 10.1029/2022GL100863
Wright, A., Schnitzer, S. A., and Reich, P. B. (2014). Living close to your neighbors: the importance of both competition and facilitation in plant communities. Ecology 95, 2213–2223. doi: 10.1890/13-1855.1
Xiang, W., Lei, X., and Zhang, X. (2016). Modelling tree recruitment in relation to climate and competition in semi-natural Larix-Picea-Abies forests in northeast China. For. Ecol. Manag. 382, 100–109. doi: 10.1016/j.foreco.2016.09.050
Xu, C. H., and Xu, Y. (2012). The projection of temperature and precipitation over China under RCP scenarios using a CMIP5 multi-model ensemble. Atmos. Ocean. Sci. Lett. 5, 527–533. doi: 10.1080/16742834.2012.11447042
Yang, Y. H., Watanabe, M., Li, F. D., Zhang, J. Q., Zhang, W. J., and Zhai, J. W. (2006). Factors affecting forest growth and possible effects of climate change in the Taihang Mountains, northern China. Forestry 79, 135–147. doi: 10.1093/forestry/cpi062
Young, B., Liang, J., and Stuart, C. F. (2011). Effects of species and tree size diversity on recruitment in the Alaskan boreal forest: a geospatial approach. For. Ecol. Manag. 262, 1608–1617. doi: 10.1016/j.foreco.2011.07.011
Zhang, L., He, Y., Wang, J., and Meng, J. (2022). Development of a climate-sensitive matrix growth model for Larix gmelinii mixed-species natural forests and its application for predicting forest dynamics under different climate scenarios. Forests 13:574. doi: 10.3390/f13040574
Zhao, D. H., Borders, B., and Wilson, M. (2005). A density-dependent matrix model for bottomland hardwood stands in the lower Mississippi Alluvial Valley. Ecol. Model. 184, 381–395. doi: 10.1016/j.ecolmodel.2004.11.002
Zhao, T., Chen, L., and Ma, Z. (2014). Simulation of historical and projected climate change in arid and semiarid areas by CMIP5 models. Chin. Sci. Bull. 59, 412–429. doi: 10.1007/s11434-013-0003-x
Zhao, K., Zheng, M., Fahey, T. J., Jia, Z., and Ma, L. (2018). Vertical gradients and seasonal variations in the stem CO2 efflux of Larix principis-rupprechtii Mayr. Agric. For. Meteorol. 262, 71–80. doi: 10.1016/j.agrformet.2018.07.003
Zhu, H. H., Jiang, Z. H., and Laurent, L. (2021). Projection of climate extremes in China, an incremental exercise from CMIP5 to CMIP6. Sci. Bull. 66, 2528–2537. doi: 10.1016/j.scib.2021.07.026
Keywords: climate change, RCP scenarios, matrix growth model, forests spatial structure, stand diversity, diameter distribution
Citation: Sheng Q, Liu Z and Dong L (2023) A climate-spatial matrix growth model for major tree species in Lesser Khingan Mountains and responses of forest dynamics change to different representative concentration path scenarios. Front. For. Glob. Change. 6:1309189. doi: 10.3389/ffgc.2023.1309189
Edited by:
Xianzhao Liu, Chinese Academy of Forestry, ChinaReviewed by:
Jun Lu, Chinese Academy of Forestry, ChinaWei Xiang, Beijing Forestry University, China
Zongzheng Chai, Guizhou University, China
Copyright © 2023 Sheng, Liu and Dong. This is an open-access article distributed under the terms of the Creative Commons Attribution License (CC BY). The use, distribution or reproduction in other forums is permitted, provided the original author(s) and the copyright owner(s) are credited and that the original publication in this journal is cited, in accordance with accepted academic practice. No use, distribution or reproduction is permitted which does not comply with these terms.
*Correspondence: Zhaogang Liu, bHpnMTk3MDA2MDJAMTYzLmNvbQ==