- 1Institute of Forest Ecology, Xinjiang Academy of Forestry, Urumqi, China
- 2School of Ecology, Sun Yat-sen University, Shenzhen, China
- 3Management Committee of Kanas State-level Nature Reserve, Altay, China
Introduction: Understanding the pattern of species diversity and underlying ecological determinants driving a forest ecosystem is fundamental to conservation biology and forest management. Boreal forests play an irreplaceable role in providing ecosystem services and maintaining the carbon cycle globally, yet research attention remains disproportionately limited and lacking throughout time.
Methods: Based on field measurement data from a large (25 ha) fully-mapped coniferous forest plot, the present study quantified patterns of species diversity and their determinants in Kanas of Xinjiang, northwest China. We applied linear regression analysis to test the effects of biotic and soil factors on alpha-diversity and local contribution of beta diversity (LCBD), and then we adopted path analysis to test the determinants that affected the species diversity index.
Results and discussion: Our results revealed that alpha-diversity indices did not vary greatly across different subplots, and richness value (between 2 and 6) was low in Kanas. Noteworthy is the discerned negative association between the average diameter at breast height (DBH) and species richness, suggesting that areas with smaller DBH values tend to harbor greater species richness. For beta-diversity, a higher value was observed in the substory layer (0.221) compared to both the canopy layer (0.161) and the understory layer (0.158). We also found that the species abundance distance matrix of biological and soil environmental factors were significantly correlated with species geographic distance matrices. More importantly, our results showed that average DBH and soil pH would affect the alpha diversity indices, and average DBH, soil Ph, average height and soil total Phosphorous would affect the beta diversity indices. Soil pH also indirectly affected the LCBDunder, LCBDsub, and LCBDcan (p ≤ 0.001), upon mediation of alpha diversity indices. Overall, our results provide crucial revelations about species diversity patterns in boreal forests, and insights that can support the protection of forest biodiversity in China.
1 Introduction
Seeking explanation on mechanisms of species coexistence, which determine the spatial patterns of species and dynamics of communities of a forest ecosystem (Shaheen et al., 2023; Haq et al., 2023c), has been a longtime endeavor within community ecology research (Whittaker, 1960). Although several studies have sought to explain species coexistence and community structure (Gravel et al., 2011; Levine et al., 2017), and the relationships between biodiversity and ecosystem functioning, it is still a great challenge to interpret how biotic and abiotic factors affect plant diversity functions (Sanaei et al., 2021). These factors are not exclusively influential but rather mutually correlated, rendering it challenging to discern the specific role of each in shaping community structure (Pyšek et al., 2005; He et al., 2022). Hence, a detailed study on the relationship between forest species diversity and environmental factors is vital to shed light on key influential factors and underlying ecological mechanisms (He et al., 2022).
Species diversity remains one of the central topics in contemporary ecology and the subject of various studies, from community to landscape-level, and in all types of ecosystems (Pyšek et al., 2005; Bhat et al., 2020; Legesse and Negash, 2021; Thakur et al., 2022; Haq et al., 2023a). Understanding the patterns and determinants of species diversity in forest ecosystems are fundamental to our knowledge of ecological processes, biological conservation and forest management (Socolar et al., 2016; Haq et al., 2023b). In the 1960s, an ecologist proposed three scales to measure biological diversity - alpha-diversity, beta-diversity, and gamma-diversity (Whittaker, 1972). Alpha (α) diversity mainly explores species diversity within a community, while beta (β) diversity focuses on species diversity between communities (Socolar et al., 2016; He et al., 2022). Both alpha-diversity and beta-diversity are crucial for understanding what species are composited and how biotic communities are structured (Socolar et al., 2016). Importantly, as a supplement to species richness, understanding the pattern of beta-diversity in different communities plays an important role in guiding conservation strategies, and determining priorities for regional conservation (Bergamin et al., 2017; He et al., 2020). However, most current research only recognizes patterns of alpha-diversity (Pyšek et al., 2005; Bhat et al., 2020), whereas those of beta-diversity has often been overlooked.
In a forest ecosystem, the plant compartment is composed of canopy, substory and understory strata, which are hierarchically structured (Barrufol et al., 2013; Haq et al., 2022; Basham et al., 2023). It is generally well-known that canopy strata can shape the function and structure of understory strata by regulating available resources, including light and nutrients (Barrufol et al., 2013; Araujo et al., 2020). Although exploring the complex the vertical structure in a stable forest community is crucial, especially when linked to the partitioning of beta-diversity, the studies mostly overlooked the variations in the vertical structure (Mori et al., 2013).
It has also been widely reported that interactions between plants and environmental conditions are regulating community spatial patterns of various vegetation types in different climatic regions (Sanaei et al., 2021). Localized environmental conditions may further affect tree growth and distribution, which may determine resource availability for plant growth and survival (Barrufol et al., 2013; Lu et al., 2021). For example, nitrogen is considered as the key nutrient for plant survival and growth in terrestrial ecosystems, particularly in cold temperate soil (Liu et al., 2021; Chang et al., 2022; Chen et al., 2022). Additionally, some studies found that soil pH can directly or indirectly impact plant species diversity and community composition (Ste-Marie and Pareâ, 1999; Ouyang et al., 2022). In summary, changes in soil properties caused by plants would definitely improve the availability of nutrient, thereby affecting plant diversity and performance (Pyšek et al., 2005; Sanaei et al., 2021). Furthermore, some studies have identified topographic variables as key explanatory factors for species richness, highlighting the significance of site-specific habitat factors in driving spatial variation in species richness at the local scale (Irl et al., 2015; Zellweger et al., 2015). Yet the process of how soil factors affect plant growth and community construction is still unclear.
Although some ecologists have studied species diversity and its determinants, most of these were carried out in subtropical and tropical forests (Phillips et al., 1994; Japan et al., 2004; Hill et al., 2011). Despite boreal forests accounting for 11% of the total forested area, and thus represents the largest vegetation type around the world (Gauthier et al., 2015), research on boreal forests remain sparse. It is therefore crucial to study existing patterns of species diversity and its drivers, to help us better understand community assemblies and diversity maintenance under current global environmental changes (Liu et al., 2021). In Kanas, forests are commonly dominated by diverse species, which differ from other forests in central North Asia that are dominated by a single canopy (Liu et al., 2021). Yet the interaction between the plant species and environment in kanas forest is still unclear.
In this study, we aim to explore the potential factors influencing species diversity through the perspective of vertical stratification within forest community. Specifically, we first collected data-relevant variables from a 25-ha permanent forest plot in the Kanas National Nature Reserve (KNNR) within the Xinjiang Uygur Autonomous Region in Northwest China, calculated the alpha-diversity and beta-diversity, and partitioned the local contributions to beta diversity (LCBD). We then tested the linkages between LCBD and environment factor by regressing on related explanatory variables. Our study aims to answer the next four questions: (a) what are the alpha-diversity and beta-diversity patterns of the boreal coniferous forest in KNNR; (b) what is the relationship between environmental variables and plant diversity; (c) do environmental factors affect the alpha-diversity and beta-diversity patterns; and (d) how do soil environmental variables, topographic variables, biological variables and plant diversity indices interact with each other? what is the specific impact path process? By studying the potential impact factors of species diversity from the aspect of vertical stratification of forest communities, this study may present novelty in revealing the mechanism of forest biodiversity conservation and species coexistence.
2 Materials and methods
2.1 Study area
The study area is located in the middle of Altai Mountain (48° 35′-49° 11′ N, 86° 54′-87° 54′ E) at KNNR (Figure 1), which has a temperate continental climate, with temperature extremes between summer and winter. The temperature ranges from −37°C to 29.3°C with an annual average at −0.2°C, and mean annual precipitation at about 1,000 mm. Elevation within the KNNR ranges from 1,241 m to 4,381 m. The Forest cover in the Altai mountains of China is considered typical of boreal forests found regionally, with coverage dominated by over four plant species, including Larix sibirica Ledeb., Picea obovata Ledeb., Pinus sibirica (Loud.) Mayr, and Betula pendula (Loud.) Mayr (Liu et al., 2020).
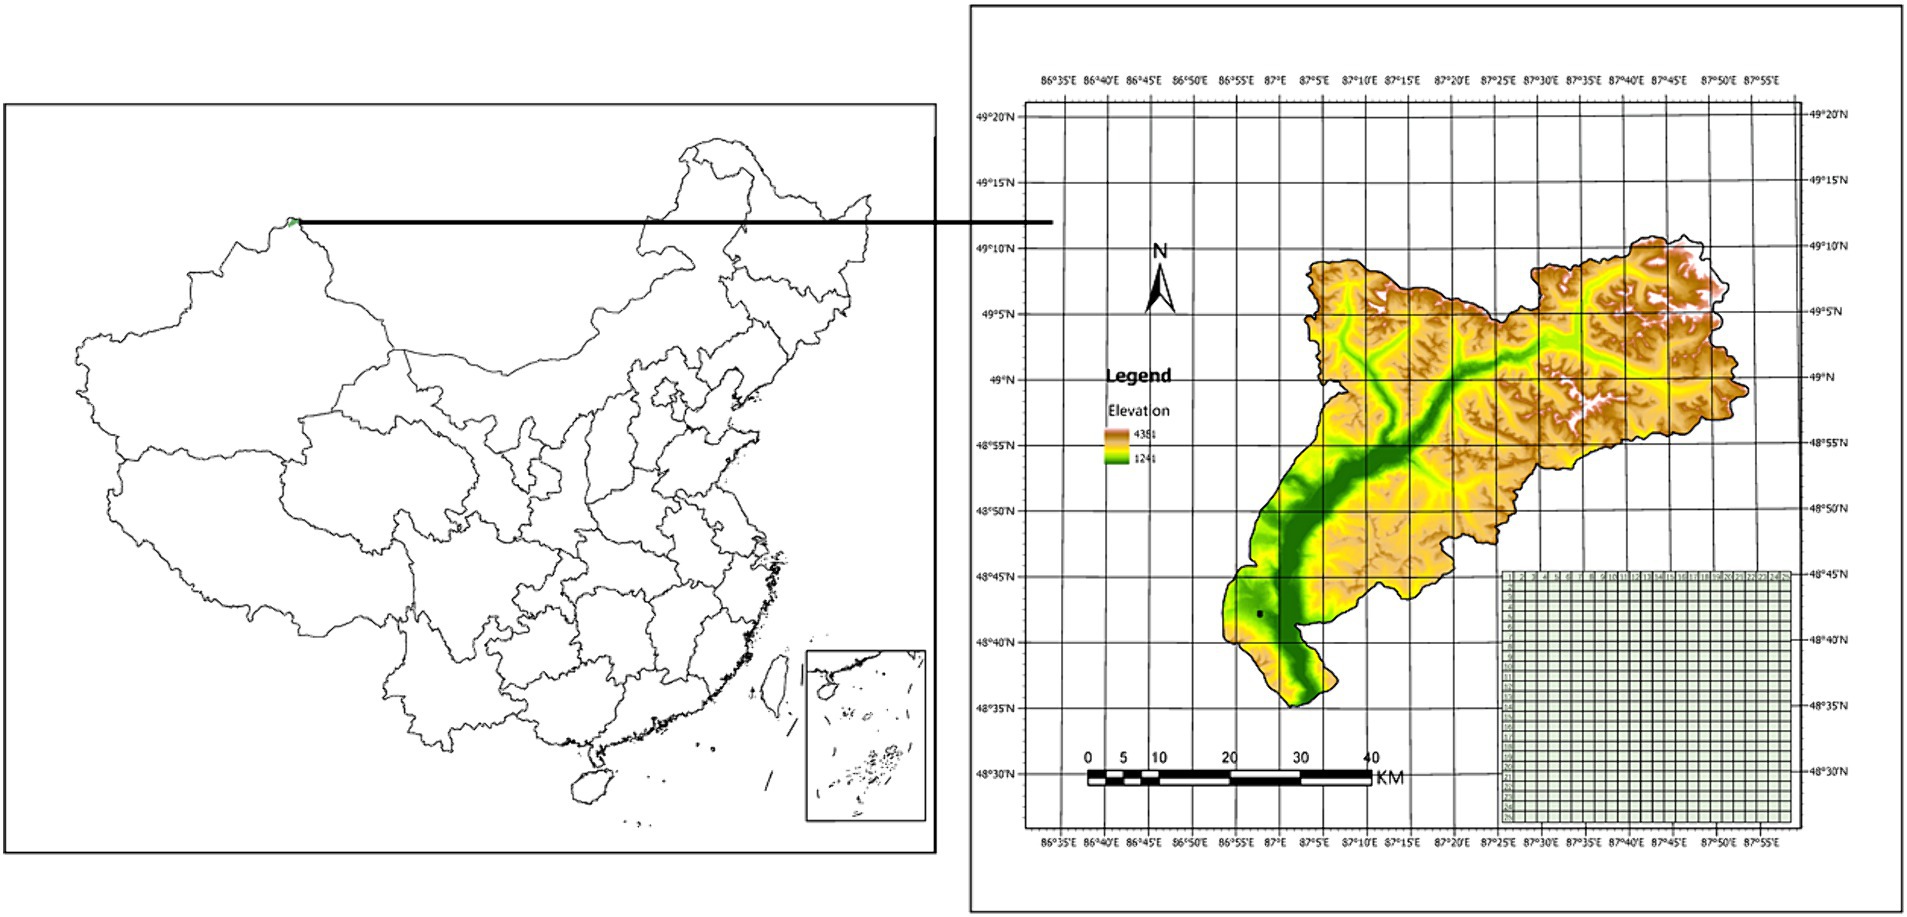
Figure 1. The location and Digital elevation map (DEM) of the study area in the Altay Mountains, north-west China.
2.2 Data collection
In the summer of 2019 and 2020, we collected data from a 25 ha (500 m*500 m) permanent forest plot, established in a coniferous forest of northwest China. We inventoried the plants in our study area according to the standard field protocol of the Center for Tropic Forest Sciences (CTFS; Condit 1998). Marking the southwest corner as the origin of the coordinates, the 25-ha plot was divided into 625 subplots at 20 m*20 m, and each subplot was then subdivided into 16 quadrats at 5 m*5 m. Within each quadrat, we recorded all living species with a diameter at breast height (DBH) ≥ 1 cm (Bagchi et al., 2011).
After removing litter and stones, the top soil (0–15 cm) of these plant species was taken to laboratory and soil characteristics were analyzed. We also measured nine soil environmental factors, which included soil pH value, bulk density, alkaline hydrolysable nitrogen (AHN), soil organic carbon (SOC), total nitrogen (N), total phosphorus (P), C:N ratio, C:P ratio and N:P ratio for each subplot. Soils were sampled both at the center and at the four quadrat corners (Bao, 2000). For each soil property, the mean of all five samples (center and four corners) was calculated. We also calculated four topographic traits for each subplot, including aspect, convexity, elevation and slope (He et al., 2022).
Within the plot at KNNR, the number of species increased rapidly during initial stages when the sampling area was small, and gradually plateaued with further increase in sampling area (Figure 2). This indicated that the 625 subplot is sufficient to explain the species composition in KNNR.
In total, we recorded 28,321 plant individuals for analysis. Based on the 10 cm DBH intervals, the forest vertical stratum was divided into three categories, the understory layer (0-10 cm), substory layer (10-20 cm) and canopy layer (>20 cm) (He et al., 2022).
2.3 Measures of alpha-diversity and beta-diversity
We calculated four alpha-diversity indices in each of the 625 subplots across the KNNR forest plot, including species Richness, Shannon entropy, Simpson index and Pielou evenness indices. The alpha-diversity indices calculations were conducted using the ‘vegan’ R package in R 4.0.3 software (Oksanen et al., 2018). The species 330 richness is the total count of species types within a subplot, while the 331 specific calculations for the other three alpha-diversity indices are as follows Eqs. 1–3:
where Ni represents the abundance of species i, and N0 is the sum of the individual number of all species.
On beta diversity, as the total variance of the Hellinger-transformed community composition, the beta-diversity statistic (BDTotal) was calculated (Eq. 4)We than partitioned Beta-diversity into Local Contribution to Beta Diversity (LCBD, Eq. 5). The beta-diversity calculation was performed using the ‘adespatial’ R package in R 4.0.3 software (Dray et al., 2012).
where SSTotal refers to the total sum of the squared deviations from the column means of the whole YHel matrix, and BDTotal represents the unbiased form of the total variance.
where SSi represents the sum of squares corresponding to the ith subplot (i.e., the contribution of subplot i to the overall beta-diversity). LCBDi is the reflection of the degree of the compositional uniqueness of the subplots which can be compared with each other.
2.4 Data analysis
We first adopted the mantel test to identify whether there a relationship between species diversity indics and environmental factors. Mantel test was carried out using the ‘LinkET’ R package in R 4.0.3 software (Huang, 2021).
We used general linear models (LM) to analyse how soil environment factors affected the species diversity indices. We identified Richness index (model 1), Shannon index (model 2), Simpson index (model 3), Pielou evenness index (model 4), LCBDlayer (model 5), LCBDund (model 6), LCBDsub (model 7) and LCBDcan (model 8) as response variables. In order to assess multicollinearity among the predictor variables in the model, we conducted VIF (Variance Inflation Factor) tests using the ‘car’ package in R (Fox and Weisberg, 2019). The results indicated that all VIF values were below 10, suggesting the absence of severe multicollinearity issues within the model. The model selection process produced 33 and 40 top-ranked models (ΔAIC≤2), respectively, which we averaged into a final model. Model selection was performed using the ‘MuMIn’ R package (Barto, 2023), whereas the LM analysis was conducted using the ‘lme4’ R package in R 4.0.3 software (Bates, 2005).
Furthermore, we used path analysis to explore influences from the constructs of the species diversity. We selected significant variables from the LM models, and subsequently tested for relationships between biological variables, soil environmental variables, alpha diversity indices and LCBD. Path analyses were carried out using the ‘Lavvan’ R package in R 4.0.3 software (Rosseel, 2012).
3 Results
3.1 The patterns of alpha-diversity and beta-diversity
A total of 28,321 woody individuals, representing 4 families, 7 genera, and 7 species, were recorded and analyzed in this study. We mapped the spatial distributions of the alpha-diversity value for each subplot (Figure 3). The range of species richness for each subplot varied between 2 and 6 with a coefficient of variation (CV) at 19.42%, whereas the range of the exponential of Shannon entropy for each subplot varied from 0.229 to 2.152 (CV = 19.18%). The average Simpson and Pielou value for each subplot was 0.604 and 0.779, respectively, (CV = 17.92) (Figure 3).
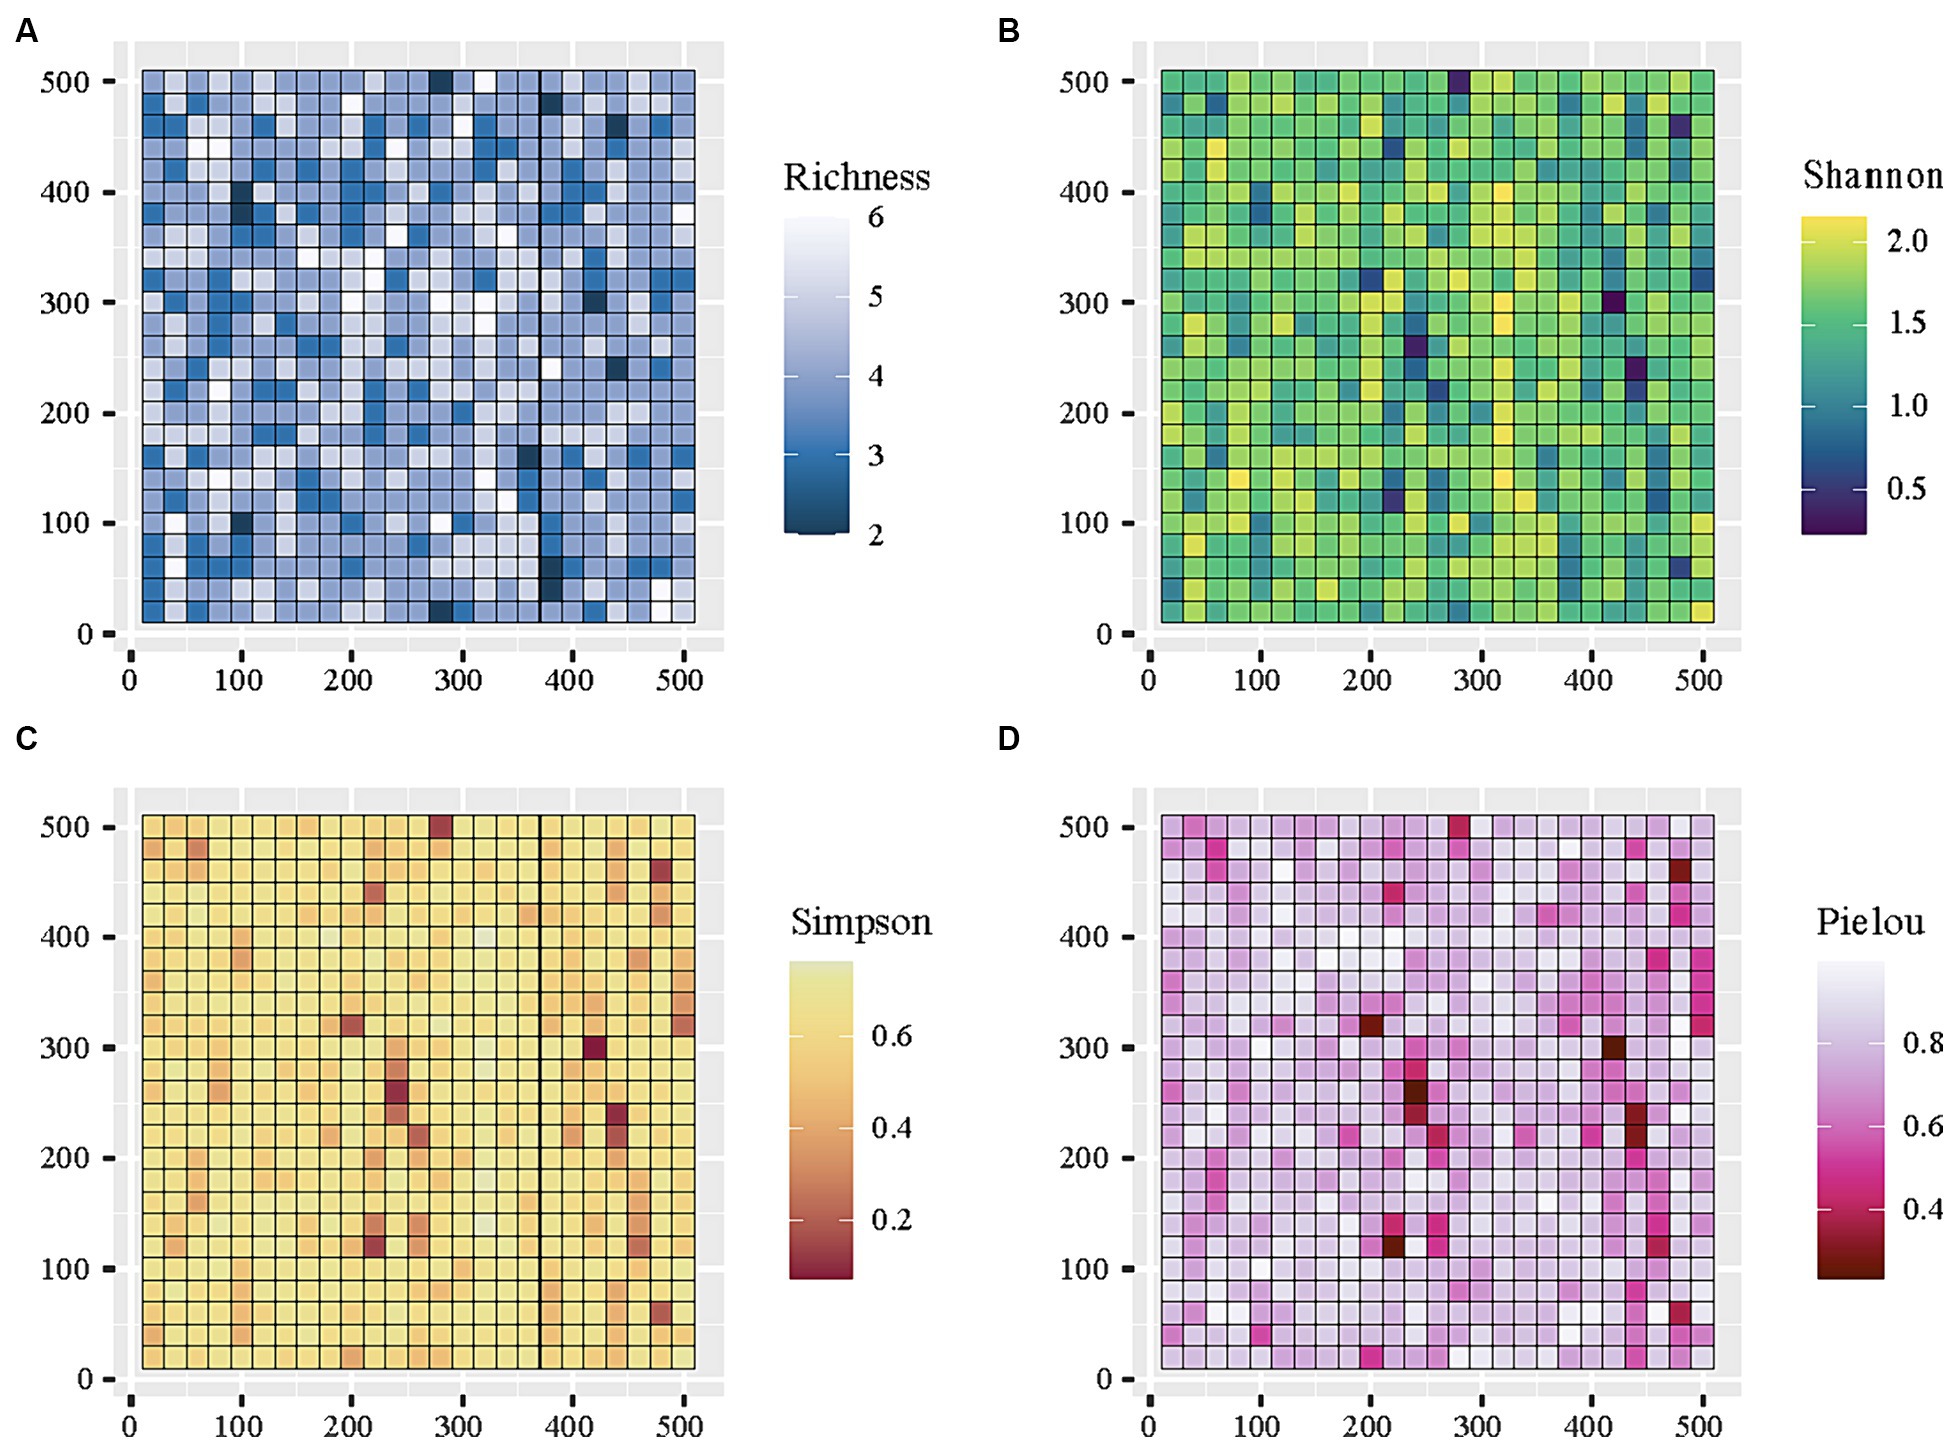
Figure 3. The distribution on alpha-diversity across 625 subplots (20 m*20 m) within the 25 ha forest plot in the KNNR.
Our results showed that there were higher values for species composition in the substory layer than the other two forest layers, which corresponded to the observed higher beta-diversity value in the substory layer (0.221) relative to the canopy (0.161) and understory layers (0.158) (Table 1). We found the highest beta-diversity value for the substory layer, which reflected the greatest compositional dissimilarities between its sampled subplots.
LCBD measures the contribution of local environmental factors to beta diversity, indicating how much species composition differs between neighboring locations within the forest. In our result, we observed the highly predictable pattern of LCBD value. The value of LCBD among three layers were different across the three forest vertical strata, with an average value of 1.77*10−3 in the understory layer, 1.60*10−3 in the substory layer, and 1.76*10−3 in the canopy layer (Figure 4). This highlighted variations in local environmental conditions and species composition across these strata.
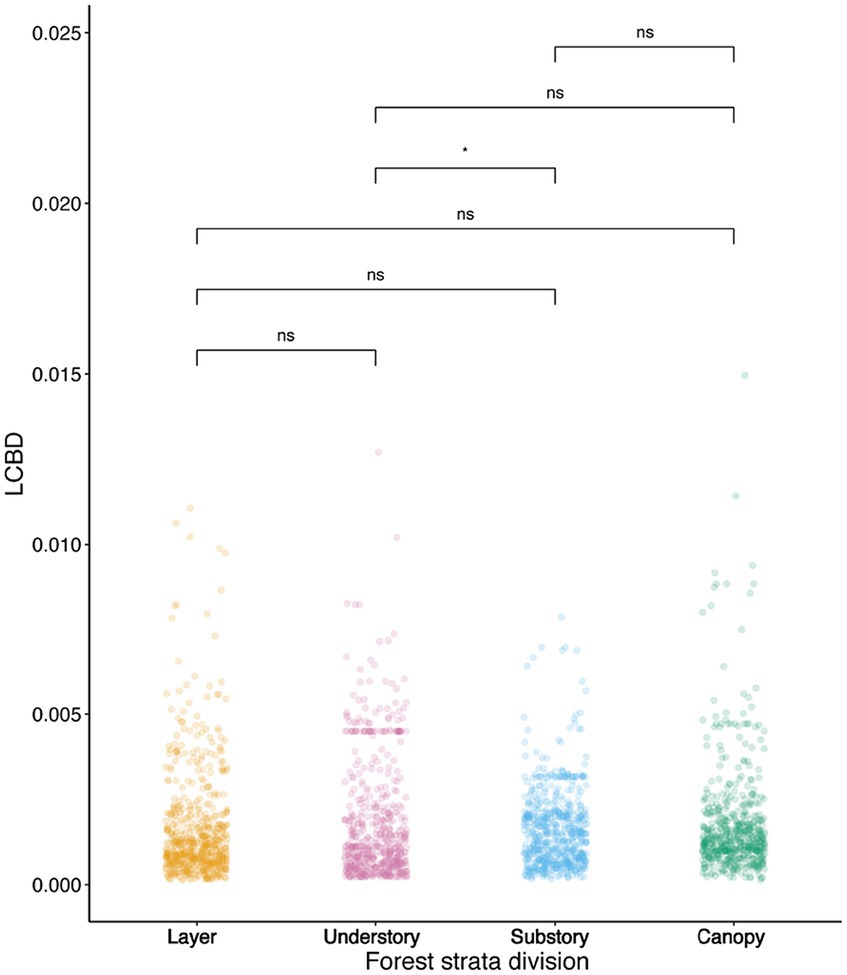
Figure 4. Scatter plots showing variation in LCBD. LCBD represents local contribution to beta-diversity. ***p ≤ 0.001; **p ≤ 0.01; *p ≤ 0.05.
3.2 Relationship between species diversity indices and soil environmental variables
We used the Mantel test to explore the relationship between species diversity indices values and soil environmental factors. The test results showed that the distance matrix on alpha-diversity and beta-diversity in the community had a significant positive correlation with the distance matrix of soil pH, soil SOC, total N, AHN, N:P and C:P (p < 0.001), and also a significant positive correlation between average DBH and average height of tree plants (p < 0.001; Figure 5). In addition, total N, C:N ratio, aspect, convexity, elevation, and slope showed no significant correlation with biodiversity indices. Specifically, soil pH, SOC, total N, AHN, N:P ratio, and C:P ratio were significantly positively correlated with species Richness, Shannon, Simpson, and Pielou indices, while they were significantly negatively correlated with LCBD, LCBDund and LCBDsub; The average DBH were significantly positively correlated with species richness, while they were significantly negatively correlated with LCBDund.
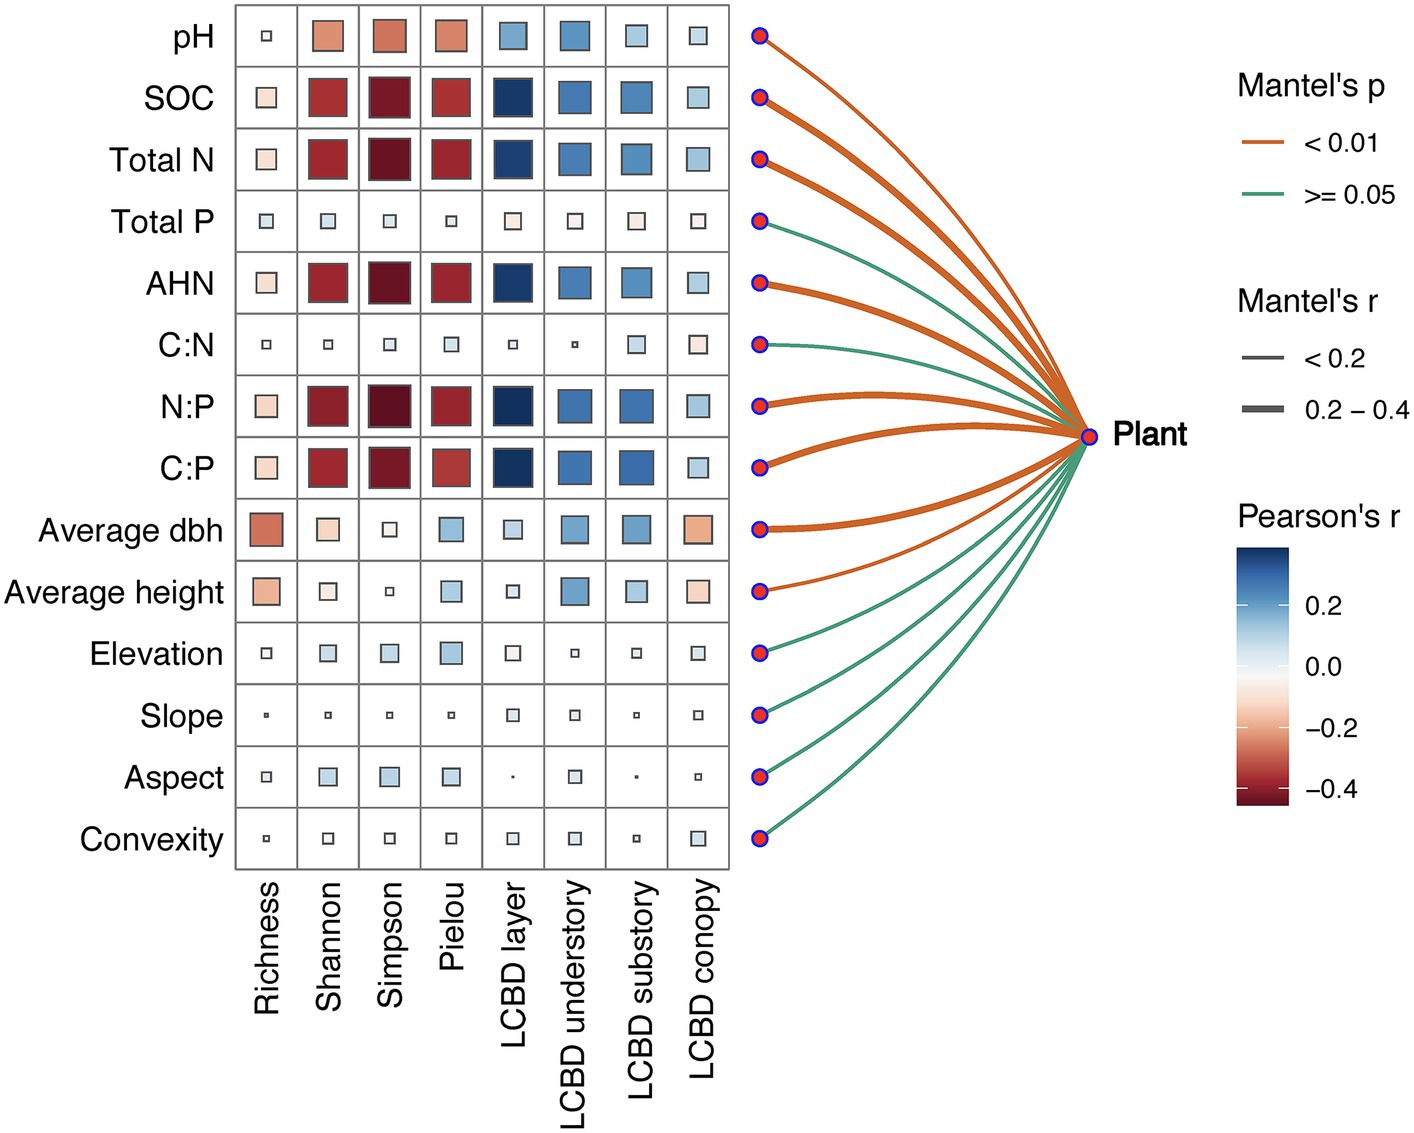
Figure 5. Species abundance related to each environmental factor, as determined by Mantel tests, and the correlation between species diversity and influencing factors. Edge width denotes the Mantel r statistic for the corresponding distance correlations, whereas edge color denotes the statistical significance based on 9,999 permutations. ***p ≤ 0.001; **p ≤ 0.01; *p ≤ 0.05.
3.3 Effects of soil environmental variables on species diversity indices
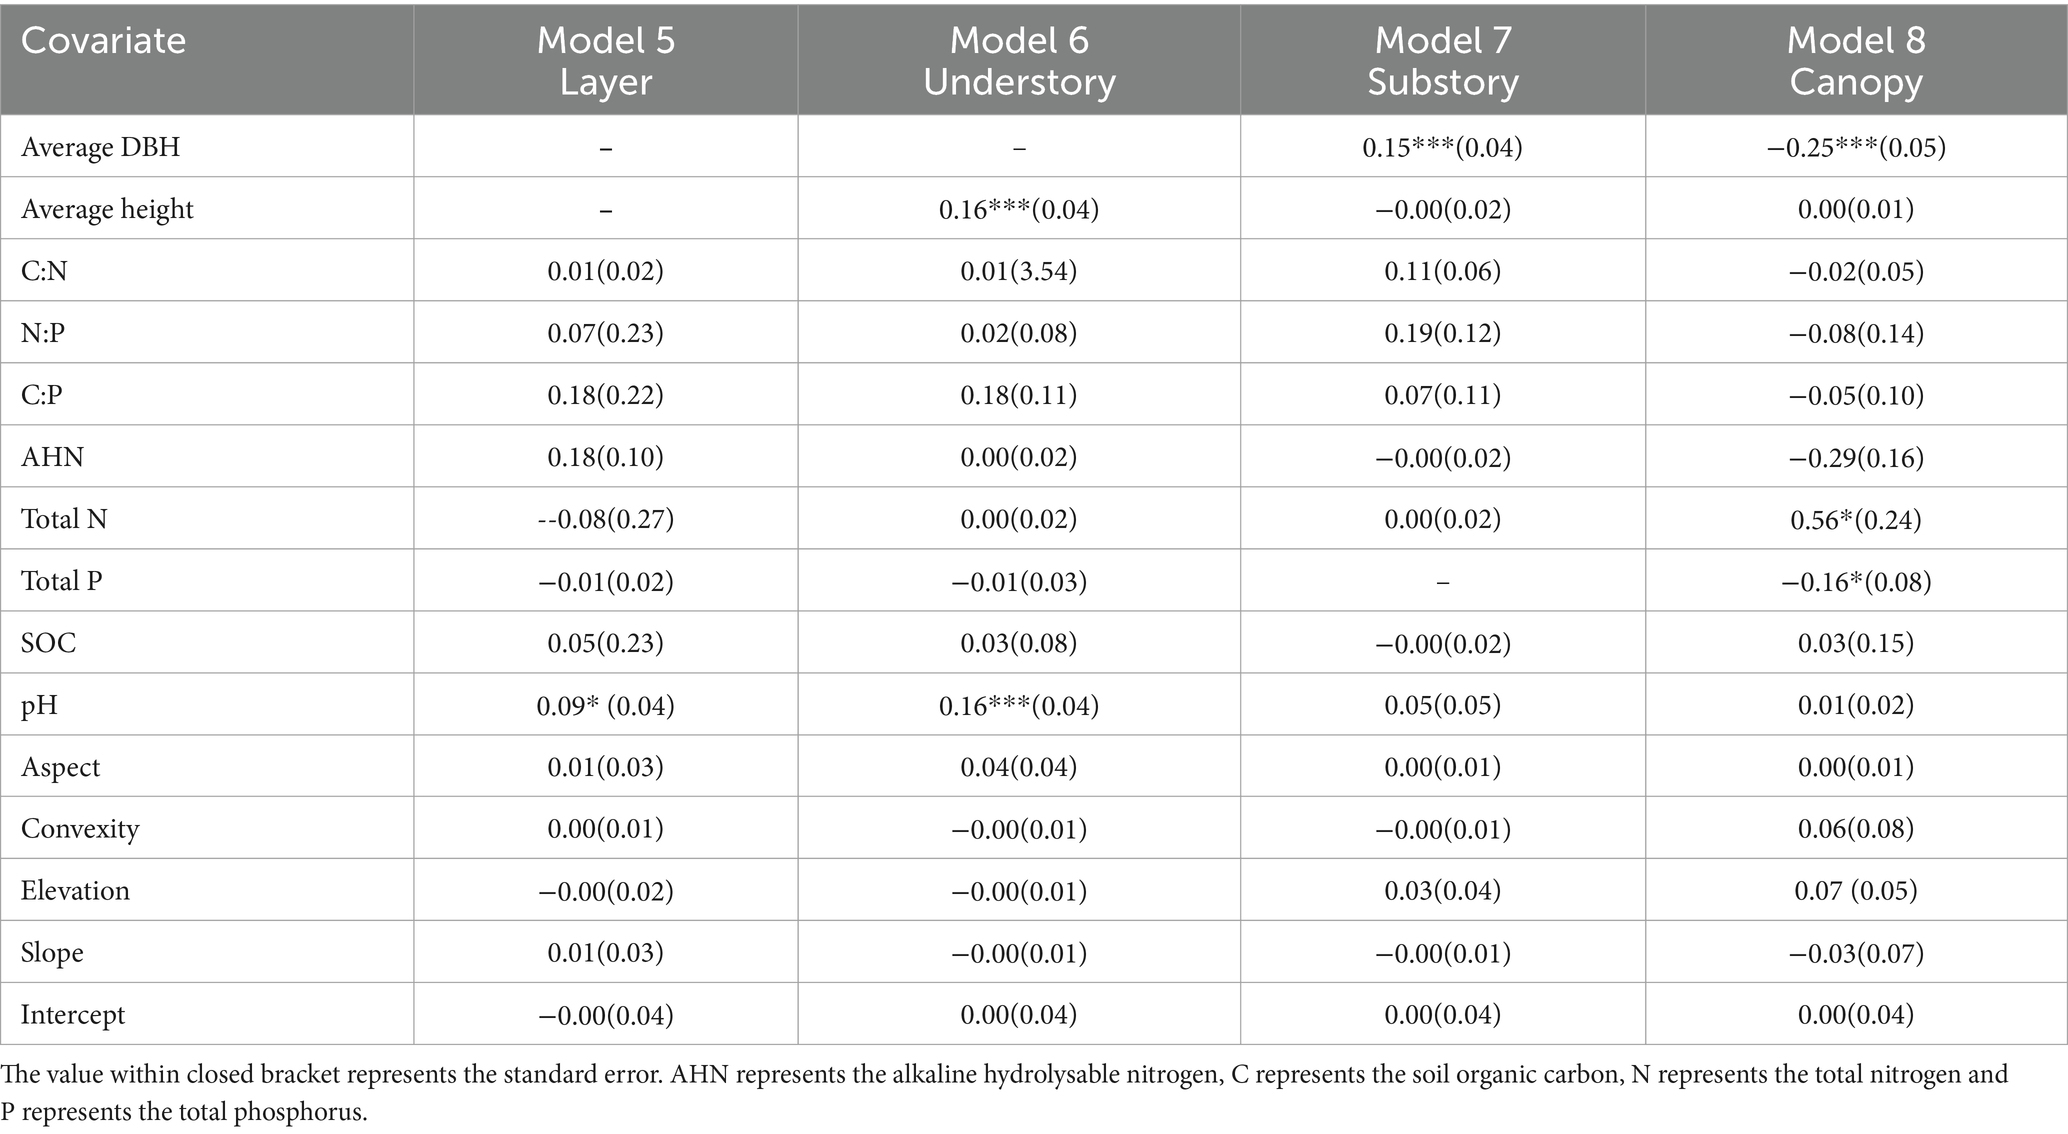
We used LM to further explore whether the soil feature and plant biological factors would directly affect the alpha-diversity indices and LCBD value (Figure 6; Tables 2, 3). Our results showed that average DBH had significant positive impact on the Pielou index, and significant negative impact on the Richness (Figure 6A). Particularly, soil pH values had significant negative impacts on the Shannon, Simpson and Pielou indices values, and soil N:P had significant negative impacts on the Simpson index (Figure 6A). Regarding local contribution to beta-diversity, the average DBH, average height, soil pH, soil total N and soil total p values were found to affect LCBD values (Figure 6B). Specifically, the LCBDund was significantly positively impacted by average height and soil pH. LCBDsub was significantly positively impacted by average DBH, whereas LCBDcan was significantly negatively impacted by average DBH, total N and soil total P (Figure 6B). Our results indicated that topographic variables (aspect, convexity, elevation and slope) and soil factors including SOC, AHN, C:N and C:P did not show any significant influence on the alpha and beta indices.
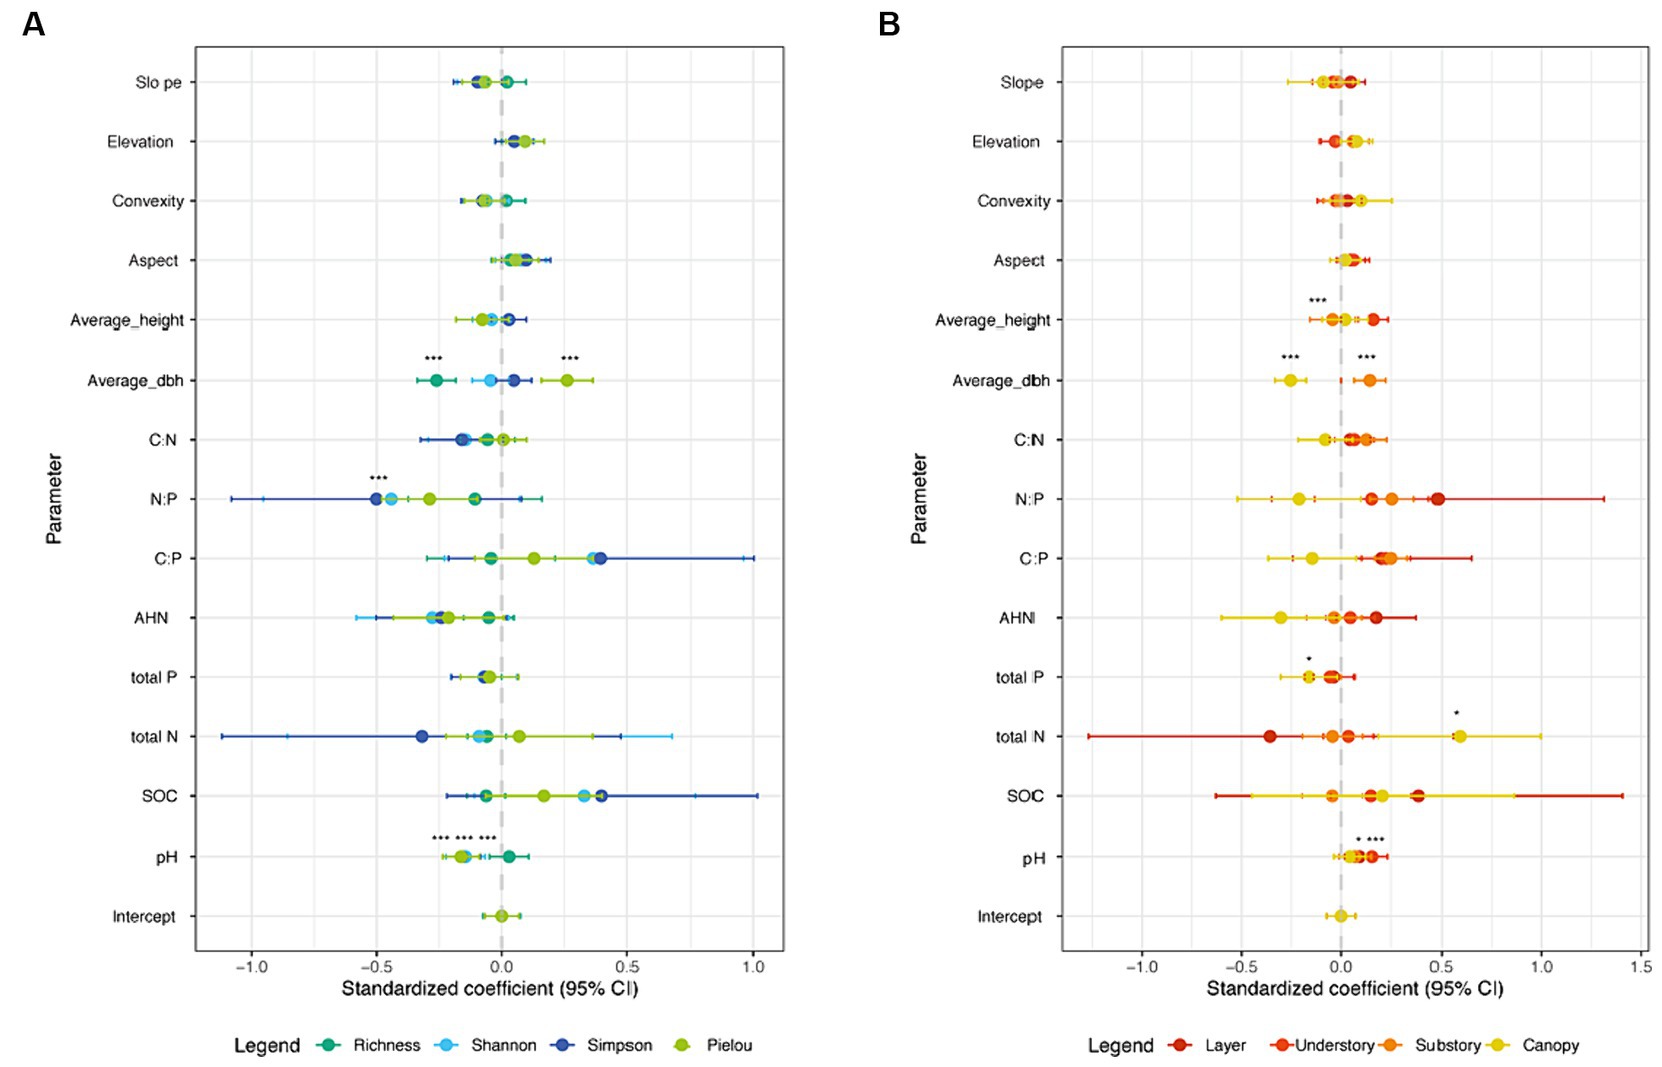
Figure 6. Summary of LM averaged model estimates for (A) alpha-diversity and (B) beta-diversity values, under different forest strata (N = 625). ***p ≤ 0.001; **p ≤ 0.01; *p ≤ 0.05.
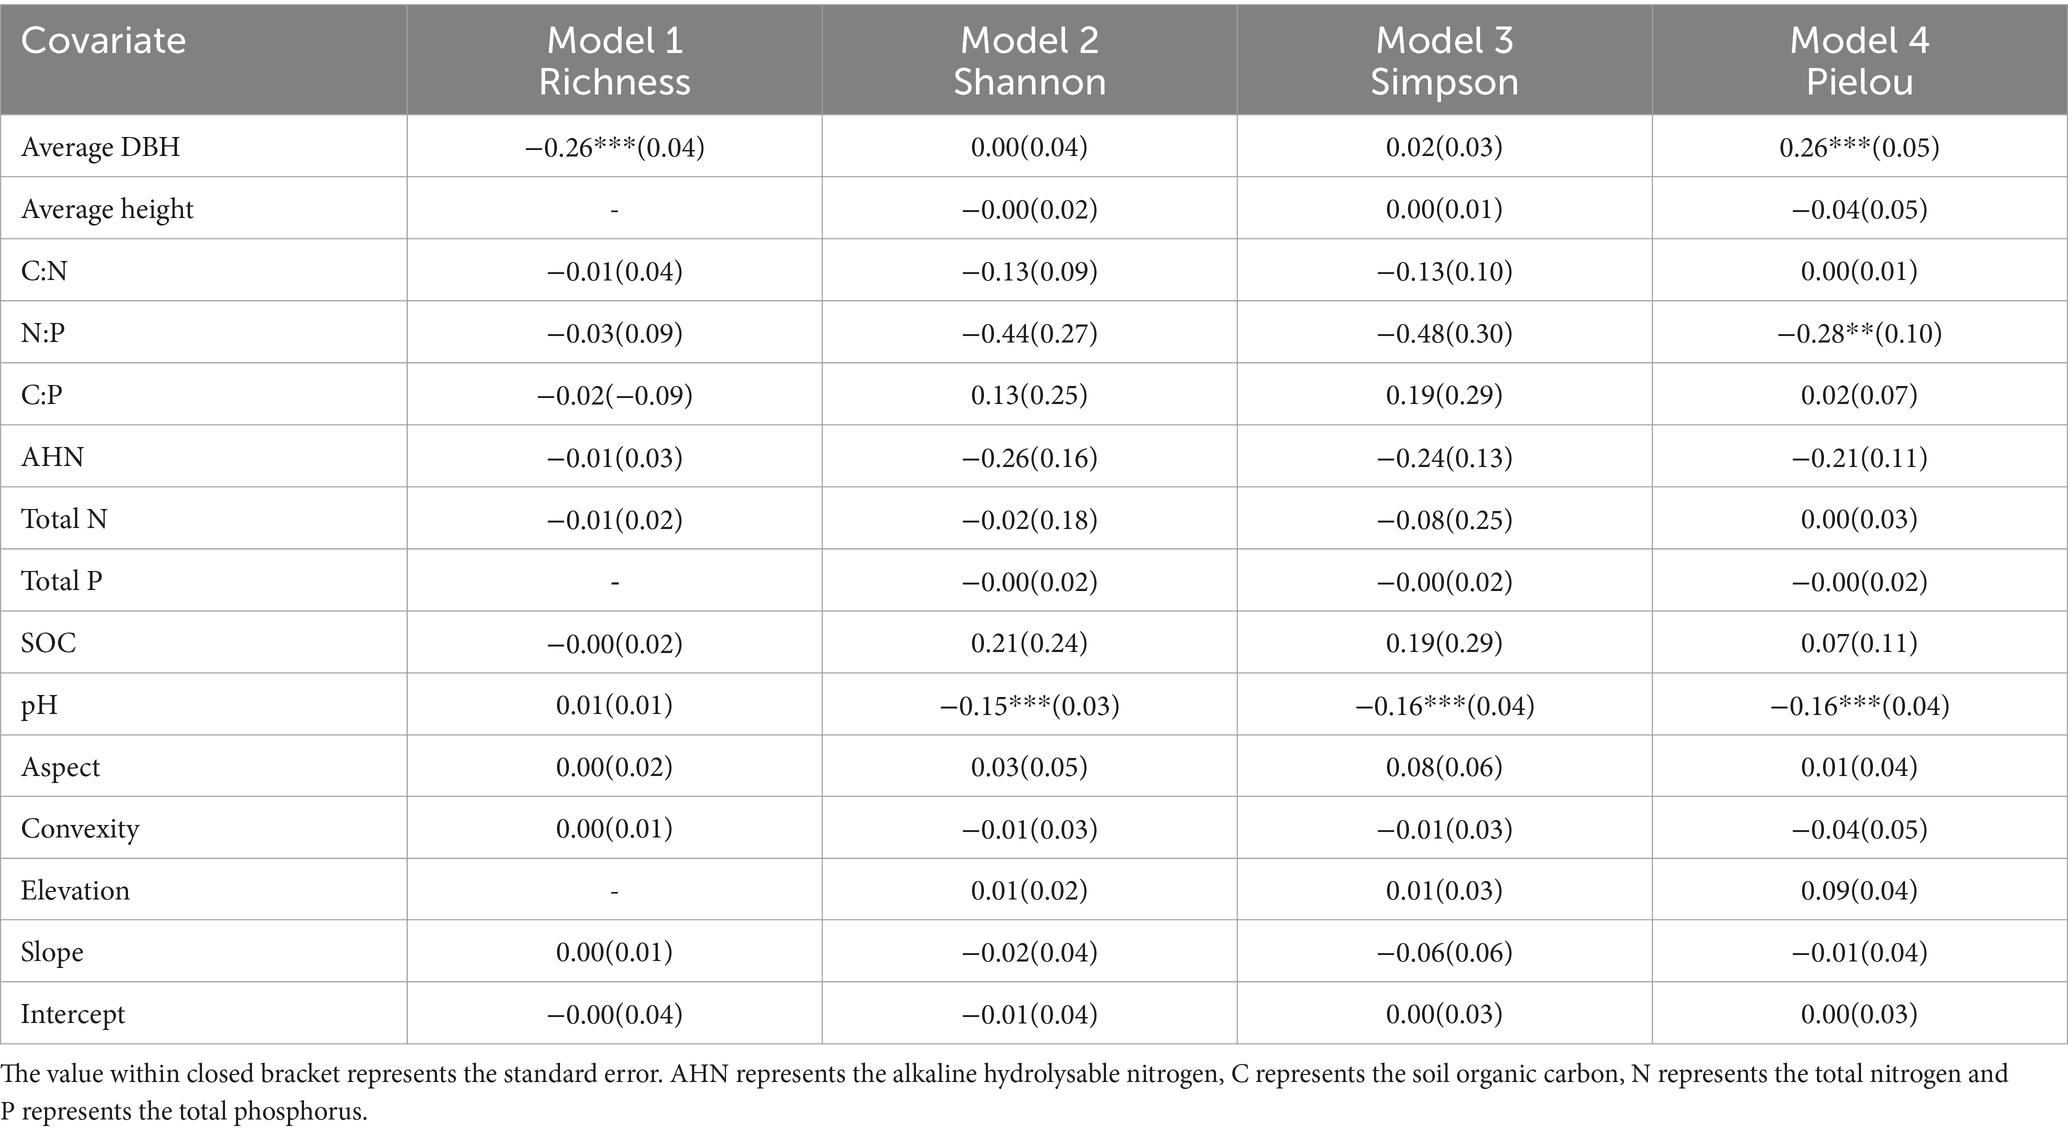
Table 2. Summary of LM averaged model estimates for alpha-diversity. ***p ≤ 0.001; **p ≤ 0.01; *p ≤ 0.05.
3.4 Determinants of the local contribution to beta diversity
We used path analysis to test the determinants that affected the species diversity index. Our path analyses showed that soil pH and N:P ratio had positive direct and indirect effects on the alpha-diversity indices and LCBD (p ≤ 0.001; Figure 7A). Specifically, N:P ratio and pH influenced Richness and Pielou indices by affecting average DBH, ultimately impacting LCBD (Figure 7A). PH directly affected the LCBD, mediating by the Simpson index (Figure 7A).
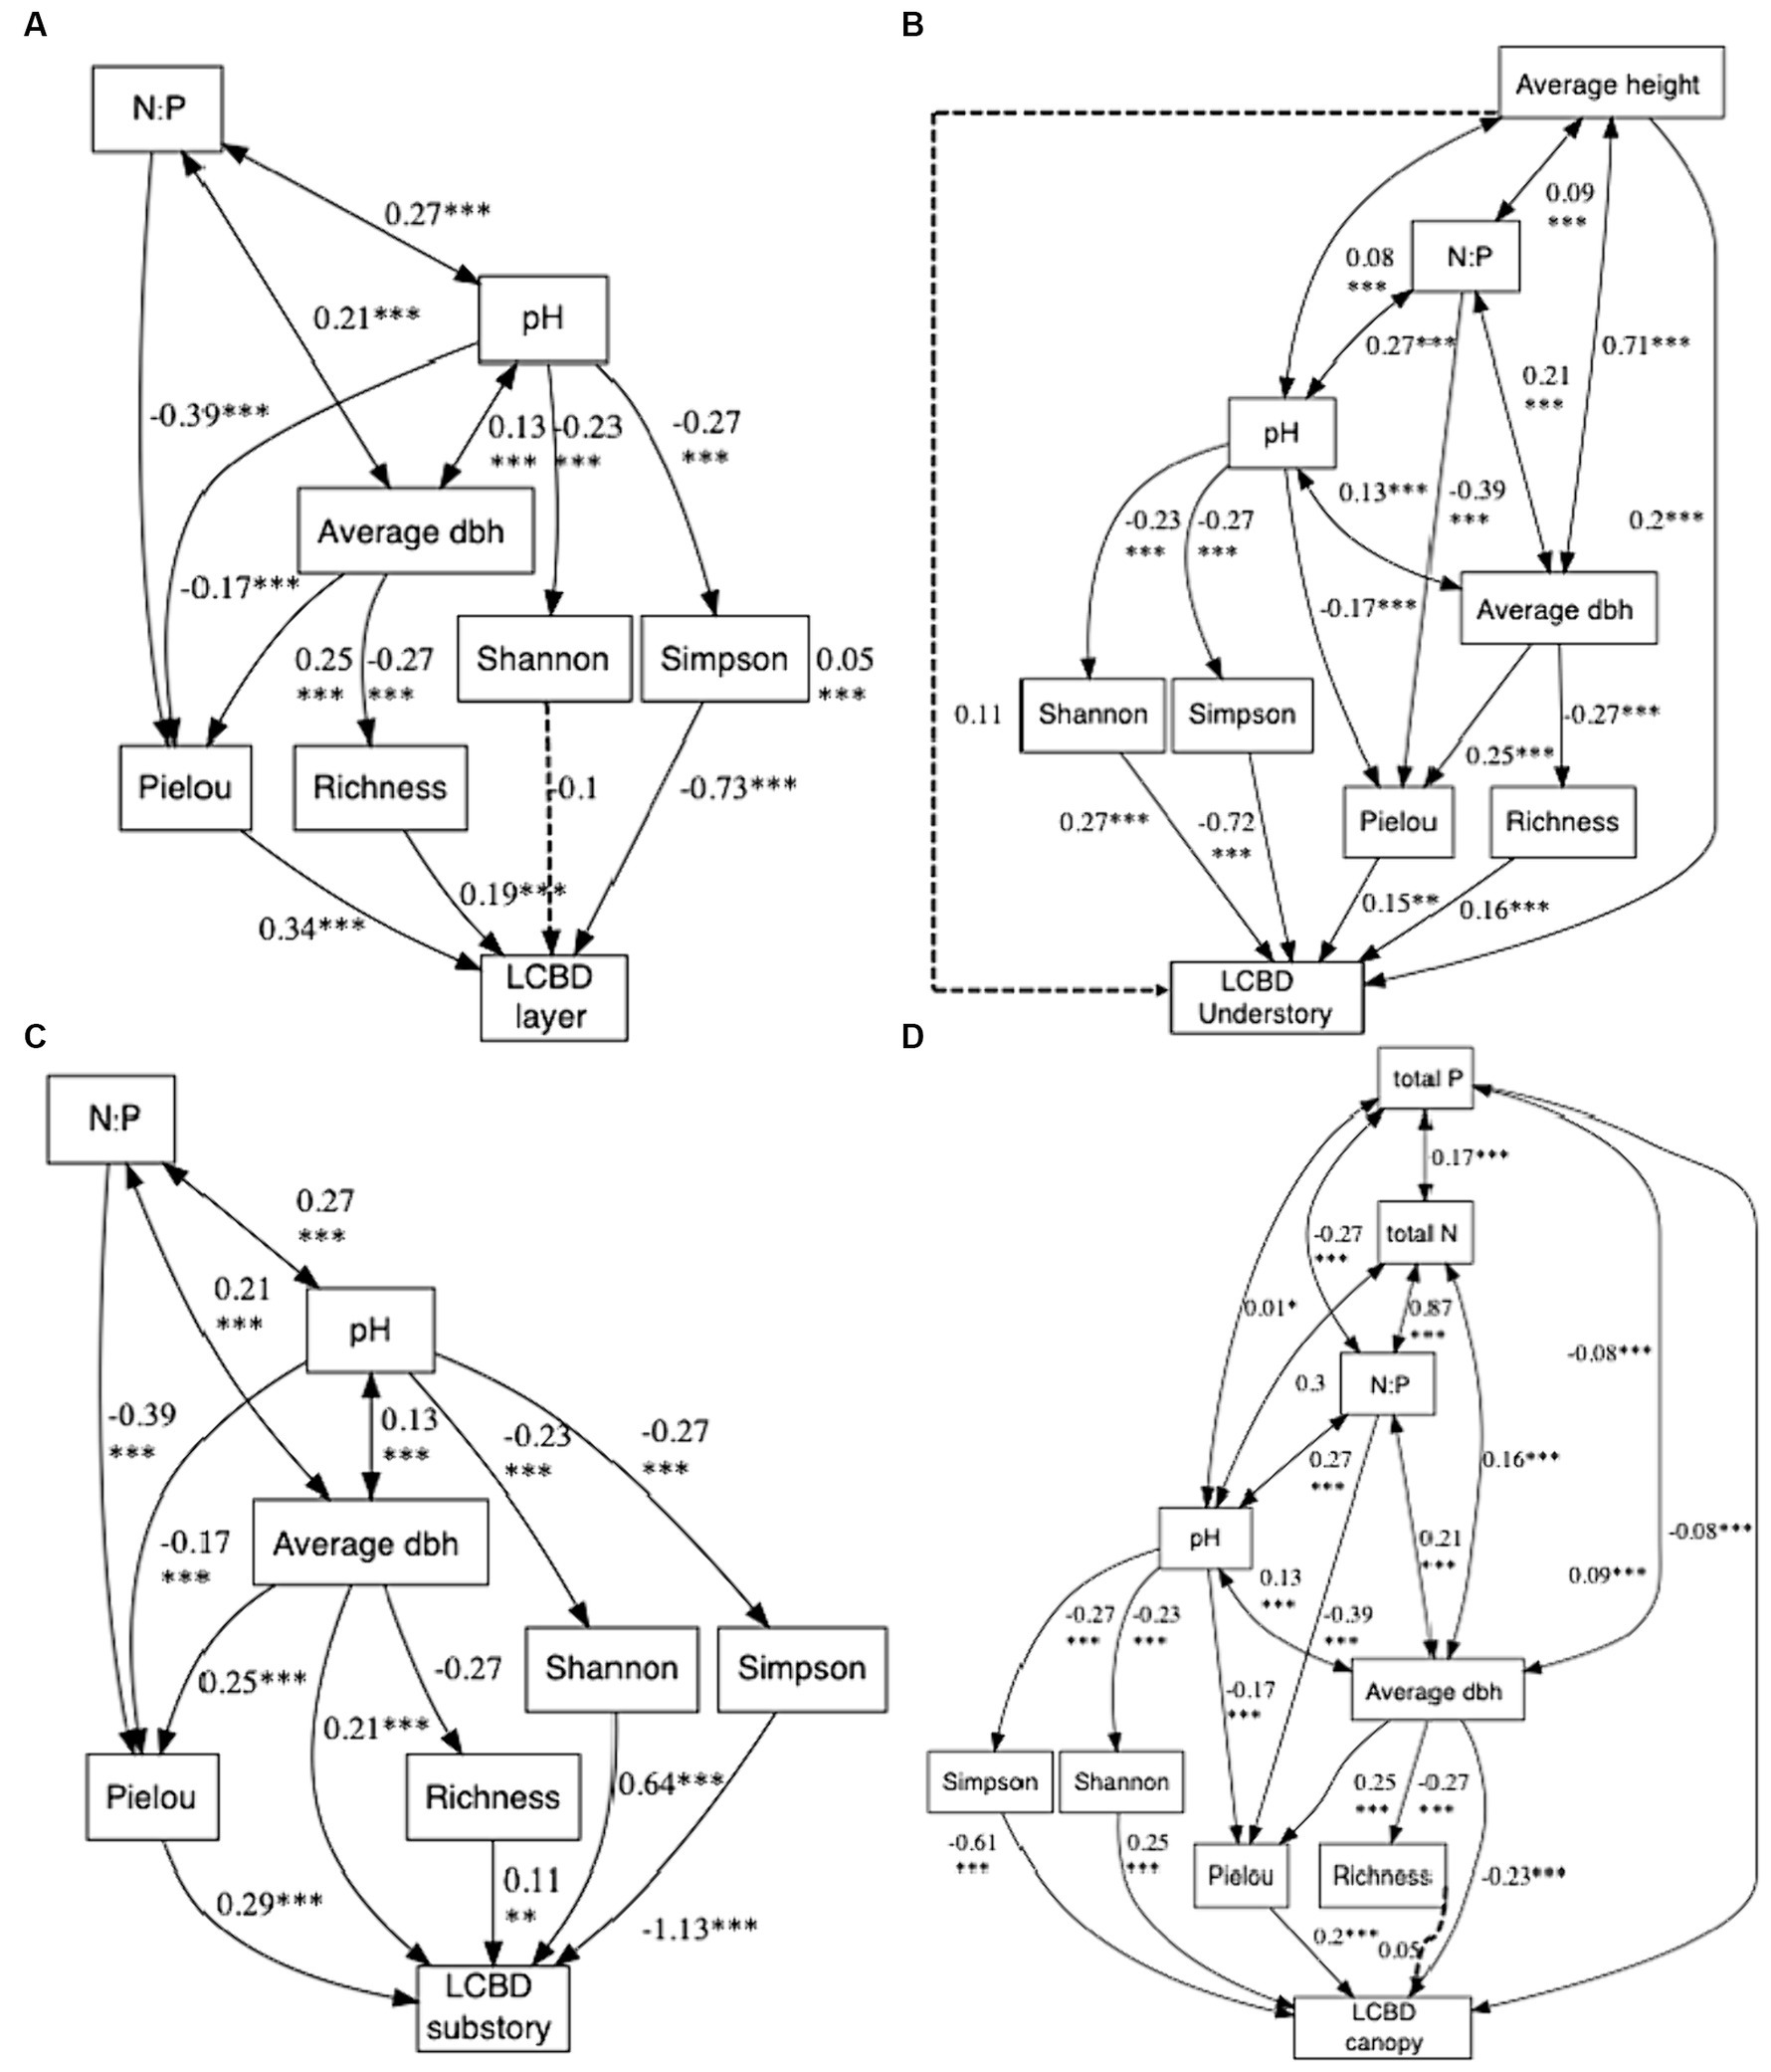
Figure 7. summarizes the results of path analysis on the LCBD (N = 625). Panel A illustrates the path analysis among influencing factors for all layer LCBDs, Panel B is for understory, Panel C is for substory, and Panel D is for canopy. Path estimates are standardized coefficients. The solid line indicates significant relationship between variables, and the dotted line insignificant relationship between variables. ***p ≤ 0.001; **p ≤ 0.01; *p ≤ 0.05.
For LCBDund, N:P ratio and pH influence Richness and Pielou indices by affecting average DBH, ultimately impacting LCBDund. Average height directly affected LCBDund (Figure 7B). For LCBDsub, pH indirectly affected the LCBDsub, mediating by Shannon, Simpson and Pielou indices. While N:P ratio indirectly influenced LCBDsub through the effect of the Pielou index (Figure 7C). LCBDcan was directly influenced by total P, while total P, total N, N:P ratio and pH also indirectly influenced Richness, Shannon, Simpson Pielou and LCBDcan through average DBH (Figure 7D).
4 Discussion
Our results demonstrated that the species distance matric of biological factors and soil environmental factors were significantly correlated with species geographic distance matrices (Figure 5), suggesting that the tree species community in KNNR diverges with environmental conditions and biological features. Previous studies have shown that the colonization and extinction processes of forest communities are mainly determined by environmental heterogeneity and species competition (Lu et al., 2021; He et al., 2022; Thakur et al., 2022). Due to the different sensitivities from species to environmental changes, threatened species are prone to disappearing in habitats with high environmental pressure by selective extinction (Socolar et al., 2016; Legesse and Negash, 2021). In that case, if a species has high tolerance to environmental changes, it can survive in vary habitats (Xie et al., 2019; Liu et al., 2020; He et al., 2022). For the dominant species of Kanas, they show excellent resilience and adaptability to environmental changes. These species can withstand fluctuations in temperature, precipitation and soil conditions, their ability to tolerate a wide range of environmental conditions allows them to occupy various niches and outcompete other species (Liu et al., 2020, 2021).
This study found that among the 625 sub-plots, the highest value of species richness was only 6, and the lowest value was only 2 (Figure 3A), indicating that the species richness in the forest community in this study area is relatively low. The Kanas region is overall a typical boreal forest, with forest cover mostly dominated by a single species (Gauthier et al., 2015; Liu et al., 2021). Although our research in the Kanas region has also found coverage by multiple species, species richness is still at a lower level compared to tropical and subtropical forest regions (Liu et al., 2020). This characteristic is largely attributed to the extreme environmental conditions prevalent in boreal regions, such as cold temperatures, short growing seasons, and nutrient-poor soils, which limit the diversity of plant species (Bonan, 1989; Venier et al., 2014). It suggests that the environmental conditions in the Kanas region may be particularly challenging for supporting a diverse array of species. This can inform targeted conservation strategies should aim at preserving and restoring biodiversity in boreal forest habitats, not only in the Kanas region but also in similar ecosystems globally.
Generally, the values of DBH noted living individuals also infer on the degree of competition between species communities (Yao et al., 2016; Lu et al., 2021). Among the two biological feature factors, average DBH had the highest interpretation power across various species richness and Pielou indices (Figure 5), which implies that tree species in the boreal forest exhibit strong species competition. This aligns with the Janzen-Connell hypothesis, when an individual is surrounded by high-density homogeneous neighbors, or when an individual is proximate to homogeneous neighbors, the strong intraspecific competition of host specific natural enemies for resources and infections will reduce recruitment and survival rate (Janzen, 1970). This provides more recruitment and survival space for other plant species, thereupon then regulating population dynamics and promoting species coexistence in vary plant communities (Janzen, 1970; Volkov et al., 2005; Yao et al., 2016).
Moreover, our study area showed that the value of total beta-diversity in the canopy and understory layers were slightly lower than the substory layer (Table 1), indicating that the species composition in the substory were more unique or distinctive compared to the average species composition of the entire area. The reason is the substory layer has access to abundant resources like light, water, and nutrients, compared to the shaded understory layers and resource-limited canopy layer (Gravel et al., 2010; De Lombaerde et al., 2019). As our results found the value of LCBDund higher than the LCBDcan and LCBDsub (Figure 4), this may be owing to the chosen site itself, compared with other sites, which possibly result in a different species composition from other layers. Because the value of LCBD value express the level of ecological uniqueness of the site relative to other sites within the specific area (Hill et al., 2011; Xia et al., 2022). The distribution of understory species is highly hinging on the niche process. Some studies have proved the strong relationship between biological factors (i.e., DBH and height), and this had a significant effect on LCBD in each vertical stratum of in our study area (He et al., 2022).
Particularly, our results tested that DBH had a significant effect on the variations of LCBD values in the canopy layer and substory layer (Table 3; Figure 6), and that soil pH value captured significant positive variations of LCBDunder. This implies that subplots with complex environmental conditions and acidic soil conditions would increase the uniqueness of the species composition. Additionally, several studies have indicated that low soil P availability was associated with high species diversity, which was consistent with our findings that P had a significant negative correlation with LCBD in the canopy layer (Olde Venterink, 2011; Wu et al., 2019). This might be attributable to the fact that the survival of woody plants in the studied forest is generally nitrogen-phosphorus co-limited (Liu et al., 2021), which is consistent with previous studies reporting that species richness in a plant community under low soil fertility is primarily driven by competition for limited nutrient resources (Gravel et al., 2011; Sanaei et al., 2021; He et al., 2022).
With limited available knowledge, understanding the stability of both ecosystem structure and function is particularly vital for biodiversity conservation (Socolar et al., 2016). However, as the external environment (biotic and abiotic) in which biological communities live and exist in is not static, the spatial composition of biological communities will also change dynamically over time (Zhou et al., 2019; He et al., 2022). Therefore, abiotic factors such as soil environment and topography will inevitably affect biological community results, whether through potential direct or indirect pathways. In this study, we found that soil characteristics would indirectly affect the beta-diversity index of the community by affecting biotic variables, such as average DBH, species richness and evenness (Figure 7). Indeed, plants absorb nutrients from the soil, thus would affect the growth rate of plant species in the community (Chen et al., 2022). Moreover, some studies have reported that soil pH could correlate with plant species richness at both regional and local scales (Ste-Marie and Pareâ, 1999). Being that the soil in our study area was slightly acidic, our study observations on alpha indices values of species diversity showed a significant negative trend with the gradual acidification of soil. This is may be due to low pH in the soil preventing germination or establishment of plants species, by obstructing roots from reaching the soil (Hill et al., 2011). Moreover, we found the SOC and AHN no significant effect on alpha diversity and beta diversity indices. The influence of SOC and AHN on species diversity may vary depending on local site conditions and ecosystem characteristics (Dawud et al., 2016). Our study area may have specific soil and environmental conditions that influence the relative importance of different factors on species diversity, leading to nonsignificant contributions from SOC and AHN. Additionally, our study revealed that the influence of topographical variables on alpha and beta diversity was not statistically significant. This lack of significance could potentially be attributed to the limited spatial extent of our study area and the minimal variability in topographical changes (Japan et al., 2004).
In addition to abiotic factors, the value of LCBD can be also directly related to biotic variables, including average height, average DBH and alpha diversity (Figure 7). Larger DBH and height trees may imply an advantage in resource acquisition and ecological competition (Forrester, 2019). This could lead to their dominance at specific sites, exerting a greater influence on species composition and ecological processes at those locations, thereby increasing the LCBD value (Forrester, 2019). Previous studies have found that the values of LCBD are usually negatively correlated with species richness in broad-leaved forest ecosystem (He et al., 2022). This negative linkage indicates that the trade-off between species richness and ecological uniqueness can be take into account in conservation planning, since even species-poor communities can make great impact on the overall beta-diversity (Xia et al., 2022). Future conservation planning should aim to protect and manage these sites to preserve their distinct biodiversity, even if they have lower species richness.
5 Conclusion
In conclusion, our study sheds light on the patterns of species diversity within the boreal forests of Kanas, Xinjiang, northwest China. Concretely, our findings indicated that the negative linkage between average DBH and species richness, suggesting that areas with smaller DBH tend to harbor greater species richness. Furthermore, our analysis of beta-diversity demonstrated higher values in the substory layer compared to both the canopy and understory layers. Notably, average DBH and soil pH were found to influence alpha diversity indices, while average DBH, soil pH, average height, soil total nitrogen and soil total phosphorous affected beta diversity indices. Soil pH also indirectly influenced LCBD through mediating of alpha diversity indices. These findings provide crucial insights into species diversity patterns in boreal forests and offer valuable guidance for the protection of forest biodiversity in China. By understanding the ecological determinants driving species diversity, policymakers and forest managers can implement targeted conservation strategies to preserve the invaluable ecosystem services provided by boreal forests.
Data availability statement
The raw data supporting the conclusions of this article will be made available by the authors, without undue reservation.
Author contributions
WW: Conceptualization, Data curation, Funding acquisition, Investigation, Project administration, Resources, Software, Validation, Visualization, Writing – original draft, Writing – review & editing. JZ: Conceptualization, Formal analysis, Methodology, Software, Supervision, Writing – original draft, Writing – review & editing. BZ: Data curation, Investigation, Methodology, Writing – review & editing. GD: Data curation, Investigation, Methodology, Writing – review & editing. AM: Data curation, Investigation, Methodology, Writing – review & editing. ZG: Data curation, Investigation, Methodology, Writing – review & editing.
Funding
The author(s) declare financial support was received for the research, authorship, and/or publication of this article. This work was supported by an open research grant from Forest ecosystem observation and research station in Altai Mountain of Xinjiang.
Acknowledgments
We would like to thank Anita Kar Yan Wan at the Sun Yat-Sen university for her editing of the manuscript.
Conflict of interest
The authors declare that the research was conducted in the absence of any commercial or financial relationships that could be construed as a potential conflict of interest.
Publisher’s note
All claims expressed in this article are solely those of the authors and do not necessarily represent those of their affiliated organizations, or those of the publisher, the editors and the reviewers. Any product that may be evaluated in this article, or claim that may be made by its manufacturer, is not guaranteed or endorsed by the publisher.
References
Araujo, R. F., Chambers, J. Q., Celes, C. H. S., Muller-Landau, H. C., dos Santos, A. P. F., Emmert, F., et al. (2020). Integrating high resolution drone imagery and forest inventory to distinguish canopy and understory trees and quantify their contributions to forest structure and dynamics. PLoS One 15:e0243079. doi: 10.1371/journal.pone.0243079
Bagchi, R., Henrys, P. A., Brown, P. E., Burslem, D. F. R. P., Diggle, P. J., Gunatilleke, C. V. S., et al. (2011). Spatial patterns reveal negative density dependence and habitat associations in tropical trees. Ecology 92, 1723–1729. doi: 10.1890/11-0335.1
Barrufol, M., Schmid, B., Bruelheide, H., Chi, X., Hector, A., Ma, K., et al. (2013). Biodiversity promotes tree growth during succession in subtropical forest. PLoS One 8:e0081246. doi: 10.1371/journal.pone.0081246
Basham, E. W., Baecher, J. A., Klinges, D. H., and Scheffers, B. R. (2023). Vertical stratification patterns of tropical forest vertebrates: a meta-analysis. Biol. Rev. 98, 99–114. doi: 10.1111/brv.12896
Bergamin, R. S., Bastazini, V. A. G., Vélez-Martin, E., Debastiani, V., Zanini, K. J., Loyola, R., et al. (2017). Linking beta diversity patterns to protected areas: lessons from the Brazilian Atlantic rainforest. Biodivers. Conserv. 26, 1557–1568. doi: 10.1007/s10531-017-1315-y
Bhat, J. A., Kumar, M., Negi, A. K., Todaria, N. P., Malik, Z. A., Pala, N. A., et al. (2020). Species diversity of woody vegetation along altitudinal gradient of the Western Himalayas. Glob Ecol Conserv 24:e01302. doi: 10.1016/j.gecco.2020.e01302
Bonan, G. B., (1989). Environmental factors and ecological processes controlling vegetation patterns in boreal forests, Landscape Ecology. SPB Academic Publishing, 3, 111–130
Chang, Y., Zhong, Q., Yang, H., Xu, C., Hua, W., and Li, B. (2022). Patterns and driving factors of leaf C, N, and P stoichiometry in two forest types with different stand ages in a mid-subtropical zone. Forest Ecosystem 9:100005. doi: 10.1016/j.fecs.2022.100005
Chen, C., Nelson, A. S., Shaw, T., and Kimsey, M. (2022). Effects of fertilization on the growth dominance of inland northwest forests of the United States. Forest Ecosystem 9:100038. doi: 10.1016/j.fecs.2022.100038
Dawud, S. M., Raulund-Rasmussen, K., Domisch, T., Finér, L., Jaroszewicz, B., and Vesterdal, L. (2016). Is tree species diversity or species identity the more important driver of soil carbon stocks, C/N ratio, and pH? Ecosystems 19, 645–660. doi: 10.1007/s10021-016-9958-1
De Lombaerde, E., Verheyen, K., Van Calster, H., and Baeten, L. (2019). Tree regeneration responds more to shade casting by the overstorey and competition in the understorey than to abundance per se. For. Ecol. Manag. 450:117492. doi: 10.1016/J.FORECO.2019.117492
Dray, S., Pélissier, R., Couteron, P., Fortin, M. J., Legendre, P., Peres-Neto, P. R., et al. (2012). Community ecology in the age of multivariate multiscale spatial analysis. Ecol. Monogr. 82, 257–275. doi: 10.1890/11-1183.1
Forrester, D. I. (2019). Linking forest growth with stand structure: tree size inequality, tree growth or resource partitioning and the asymmetry of competition. For. Ecol. Manag. 447, 139–157. doi: 10.1016/J.FORECO.2019.05.053
Fox, J., and Weisberg, S. (2019). An R companion to applied regression. 3rd Edn. New York, USA: SAGE Publications.
Gauthier, S., Bernier, P., Kuuluvainen, T., Shvidenko, A. Z., and Schepaschenko, D. G. (2015). Boreal forest health and global change. Science 349, 819–822. doi: 10.1126/science.aaa9092
Gravel, D., Canham, C. D., Beaudet, M., and Messier, C. (2010). Shade tolerance, canopy gaps and mechanisms of coexistence of forest trees. Oikos 119, 475–484. doi: 10.1111/j.1600-0706.2009.17441.x
Gravel, D., Guichard, F., and Hochberg, M. E. (2011). Species coexistence in a variable world. Ecol. Lett. 14, 828–839. doi: 10.1111/j.1461-0248.2011.01643.x
He, R., Hu, M., Shi, H., Zhou, Q., Shu, X., Zhang, K., et al. (2022). Patterns of species diversity and its determinants in a temperate deciduous broad-leaved forest. Forest Ecosystem 9:100062.
Haq, S. M., Amjad, M. S., Waheed, M., Bussmann, R. W., and Proćków, J. (2022). The floristic quality assessment index as ecological health indicator for forest vegetation: a case study from Zabarwan Mountain range, Himalayas. Ecol. Indicators 145:109670. doi: 10.1016/j.ecolind.2022.109670
Haq, S. M., Khoja, A. A., Lone, F. A., Waheed, M., Bussmann, R. W., Mahmoud, E. A., et al. (2023a). Floristic composition, life history traits and phytogeographic distribution of forest vegetation in the Western Himalaya. Front. Forests Glob. Change 6:1169085. doi: 10.3389/ffgc.2023.1169085
Haq, S. M., Rashid, I., Waheed, M., and Khuroo, A. A. (2023b). From forest floor to tree top: partitioning of biomass and carbon stock in multiple strata of forest vegetation in Western Himalaya. Environ. Monit. Assess. 195:812. doi: 10.1007/s10661-023-11376-6
Haq, S. M., Waheed, M., Khoja, A. A., Amjad, M. S., Bussmann, R. W., Ali, K., et al. (2023c). Measuring forest health at stand level: a multi-indicator evaluation for use in adaptive management and policy. Ecol. Indic. 150:110225. doi: 10.1016/j.ecolind.2023.110225
He, C., Fang, L., Xiong, X., Fan, F., Li, Y., He, L., et al. (2022). Environmental heterogeneity regulates species-area relationships through the spatial distribution of species. Forest Ecosystem 9:100033. doi: 10.1016/j.fecs.2022.100033
He, R., Hu, M., Shi, H., Zhou, Q., Shu, X., Zhang, K., et al. (2022). Patterns of species diversity and its determinants in a temperate deciduous broad-leaved forest. Forest Ecosystem 9:100062. doi: 10.1016/j.fecs.2022.100062
He, C., Jia, S., Luo, Y., Hao, Z., and Yin, Q. (2022). Spatial distribution and species Association of Dominant Tree Species in Huangguan plot of Qinling Mountains, China. Forests 13:866. doi: 10.3390/f13060866
He, J., Lin, S., Kong, F., Yu, J., Zhu, H., and Jiang, H. (2020). Determinants of the beta diversity of tree species in tropical forests: implications for biodiversity conservation. Sci. Total Environ. 704:135301. doi: 10.1016/j.scitotenv.2019.135301
Hill, J. K., Gray, M. A., Khen, C. V., Benedick, S., Tawatao, N., and Hamer, K. C. (2011). Ecological impacts of tropical forest fragmentation: how consistent are patterns in species richness and nestedness? Phil. Trans. Royal Soc. B 366, 3265–3276. doi: 10.1098/rstb.2011.0050
Irl, S. D. H., Harter, D. E. V., Steinbauer, M. J., Gallego Puyol, D., Fernández-Palacios, J. M., Jentsch, A., et al. (2015). Climate vs. topography - spatial patterns of plant species diversity and endemism on a high-elevation island. J. Ecol. 103, 1621–1633. doi: 10.1111/1365-2745.12463
Janzen, D. H. (1970). Herbivores and the number of tree species in tropical forests. Am. Nat. 104, 501–528. doi: 10.1086/282687
Japan, S., Kubota, Y., Murata, H., and Kikuzawa, K. (2004). Effects of topographic heterogeneity on tree species richness and stand dynamics in a subtropical Forest in Okinawa Island, southern Japan. J. Ecol. 92, 230–240. doi: 10.1111/j.0022-0477.2004.00875.x
Legendre, P., and De Caceres, M., (2013). Beta diversity as the variance of community data: dissimilarity coefficients and partitioning. Ecology Letters 16, 951–963.
Legesse, A., and Negash, M. (2021). Species diversity, composition, structure and management in agroforestry systems: the case of Kachabira district, Southern Ethiopia. Heliyon 7:e06477. doi: 10.1016/j.heliyon.2021.e06477
Levine, J. M., Bascompte, J., Adler, P. B., and Allesina, S. (2017). Beyond pairwise mechanisms of species coexistence in complex communities. Nature 546, 56–64. doi: 10.1038/nature22898
Liu, P., Wang, W., Bai, Z., Guo, Z., Ren, W., Huang, J., et al. (2020). Competition and facilitation co-regulate the spatial patterns of boreal tree species in kanas of Xinjiang, Northwest China. For. Ecol. Manag. 467:118167. doi: 10.1016/j.foreco.2020.118167
Liu, L., Zeng, F., Song, T., Wang, K., and Du, H. (2020). Stand structure and abiotic factors modulate karst forest biomass in Southwest China. Forests 11:443. doi: 10.3390/F11040443
Liu, P., Wang, W., Bai, Z., Guo, Z., Ren, W., Huang, J., et al. (2021). Nutrient loads and ratios both explain the coexistence of dominant tree species in a boreal forest in Xinjiang, Northwest China. Forest Ecol. Manag. 491:119198. doi: 10.1016/j.foreco.2021.119198
Lu, M., Du, H., Song, T., Peng, W., Su, L., Zhang, H., et al. (2021). Effects of density dependence in an evergreen-deciduous broadleaf karst forest in Southwest China. For. Ecol. Manag. 490:119142. doi: 10.1016/j.foreco.2021.119142
Ma, M. A., and Liu, Y. M. (1994). Measurement of biotic community diversity. I. α diversity (Part 2). Chin. Biodivers 2:231–239 (in Chinese).
Mori, A. S., Shiono, T., Koide, D., Kitagawa, R., Ota, A. T., and Mizumachi, E. (2013). Community assembly processes shape an altitudinal gradient of forest biodiversity. Glob. Ecol. Biogeogr. 22, 878–888. doi: 10.1111/geb.12058
Oksanen, J., Blanchet, F. G., and Minchin, P. R., (2018). Vegan: Community ecology package. R package version 2.6.4.
Olde Venterink, H. (2011). Does phosphorus limitation promote species-rich plant communities? Plant Soil 345, 1–9. doi: 10.1007/s11104-011-0796-9
Ouyang, M., Tian, D., Pan, J., Chen, G., Su, H., Yan, Z., et al. (2022). Moso bamboo (Phyllostachys edulis) invasion increases forest soil pH in subtropical China. Catena 215:106339. doi: 10.1016/j.catena.2022.106339
Phillips, L., Hall, P., Gentry, A. H., Sawyer, S. A., and Vasquez, R. (1994). Dynamics and species richness of tropical rain forests. Proc. Natl. Acad. Sci. 91, 2805–2809. doi: 10.1073/pnas.91.7.2805
Pyšek, P., Jarošík, V., Kropáč, Z., Chytrý, M., Wild, J., and Tichý, L. (2005). Effects of abiotic factors on species richness and cover in central European weed communities. Agric. Ecosyst. Environ. 109, 1–8. doi: 10.1016/j.agee.2005.02.018
Rosseel, Y. (2012). Lavaan: an R package for structural equation modeling. J. Stat. Softw. 48, 1–36. doi: 10.18637/jss.v048.i02
Sanaei, A., Yuan, Z., Ali, A., Loreau, M., Mori, A. S., Reich, P. B., et al. (2021). Tree species diversity enhances plant-soil interactions in a temperate forest in Northeast China. For. Ecol. Manag. 491:119160. doi: 10.1016/j.foreco.2021.119160
Shaheen, H., Aziz, S., Nasar, S., Waheed, M., Manzoor, M., Siddiqui, M. H., et al. (2023). Distribution patterns of alpine flora for long-term monitoring of global change along a wide elevational gradient in the Western Himalayas. Glob. Ecol. Conserv. 48:e02702. doi: 10.1016/j.gecco.2023.e02702
Socolar, J. B., Gilroy, J. J., Kunin, W. E., and Edwards, D. P. (2016). How should Beta-diversity inform biodiversity conservation? Trends Ecol. Evol. 31, 67–80. doi: 10.1016/j.tree.2015.11.005
Ste-Marie, C., and Pareâ, D. (1999). Soil, pH and N availability effects on net nitrification in the forest floors of a range of boreal forest stands. Soil Biol. Biochem. 31, 1579–1589. doi: 10.1016/S0038-0717(99)00086-3
Thakur, S., Negi, V. S., Dhyani, R., Bhatt, I. D., and Yadava, A. K. (2022). Influence of environmental factors on tree species diversity and composition in the Indian western Himalaya. For. Ecol. Manag. 503:119746. doi: 10.1016/j.foreco.2021.119746
Venier, L. A., Thompson, I. D., Fleming, R., Malcolm, J., Aubin, I., Trofymow, J. A., et al. (2014). Effects of natural resource development on the terrestrial biodiversity of Canadian boreal forests. Environ. Rev. 22, 457–490. doi: 10.1139/er-2013-0075
Volkov, I., Banavar, J. R., He, F., Hubbell, S. P., and Maritan, A. (2005). Density dependence explains tree species abundance and diversity in tropical forests. Nature 438, 658–661. doi: 10.1038/nature04030
Whittaker, R. H., (1960). Vegetation of the Siskiyou Mountains, Ecological Monographs, 30, 279–338. doi: 10.2307/1943563
Whittaker, R. H. (1972). Evolution and measurement of species diversity. Taxon 21, 213–251. doi: 10.2307/1218190
Wu, H., Xiang, W., Ouyang, S., Forrester, D. I., Zhou, B., Chen, L., et al. (2019). Linkage between tree species richness and soil microbial diversity improves phosphorus bioavailability. Funct. Ecol. 33, 1549–1560. doi: 10.1111/1365-2435.13355
Xia, Z., Heino, J., Yu, F., He, Y., Liu, F., and Wang, J. (2022). Spatial patterns of site and species contributions to β diversity in riverine fish assemblages. Ecol. Indic. 145:109728. doi: 10.1016/j.ecolind.2022.109728
Xie, F., Zhou, Q., Shi, H., Shu, X., Zhang, K., Li, T., et al. (2019). Species composition and community characteristics of a 25 ha forest dynamics plot in deciduous broad-leaved forest, Qinling mountains, north-Central China. Biodivers. Sci. 27, 439–448. doi: 10.17520/biods.2018326
Yao, J., Zhang, X., Zhang, C., Zhao, X., and Von Gadow, K. (2016). Effects of density dependence in a temperate forest in northeastern China. Scientific Report 6:32944. doi: 10.1038/srep32844
Zellweger, F., Braunisch, V., Morsdorf, F., Baltensweiler, A., Abegg, M., Roth, T., et al. (2015). Disentangling the effects of climate, topography, soil and vegetation on stand-scale species richness in temperate forests. For. Ecol. Manag. 349, 36–44. doi: 10.1016/j.foreco.2015.04.008
Keywords: β diversity, vertical strata, species composition, community structure, boreal forest
Citation: Wang W, Zhao J, Zhang B, Deng G, Maimaiti A and Guo Z (2024) Patterns and drivers of tree species diversity in a coniferous forest of northwest China. Front. For. Glob. Change. 7:1333232. doi: 10.3389/ffgc.2024.1333232
Edited by:
Lucian Dinca, Retired, Brasov, RomaniaReviewed by:
Muhammad Waheed, University of Okara, PakistanKanda Naveen Babu, Pondicherry University, India
Copyright © 2024 Wang, Zhao, Zhang, Deng, Maimaiti and Guo. This is an open-access article distributed under the terms of the Creative Commons Attribution License (CC BY). The use, distribution or reproduction in other forums is permitted, provided the original author(s) and the copyright owner(s) are credited and that the original publication in this journal is cited, in accordance with accepted academic practice. No use, distribution or reproduction is permitted which does not comply with these terms.
*Correspondence: Jingjing Zhao, emhhb2pqMzdAbWFpbDIuc3lzdS5lZHUuY24=
 Wendong Wang1
 Jingjing Zhao

