 Jared A. Balik1*
 Jonathan D. Coop1
 Meg A. Krawchuk2
 Cameron E. Naficy2,3Marc-André Parisien4
 Sean A. Parks5
 Camille S. Stevens-Rumann6Ellen Whitman4
- 1Clark School of Environment and Sustainability, Western Colorado University, Gunnison, CO, United States
- 2Department of Forest Ecosystems and Society, Oregon State University, Corvallis, OR, United States
- 3Ecology Program and Forest Health Protection, Pacific Northwest Region, USDA Forest Service, Baker City, OR, United States
- 4Northern Forestry Centre, Canadian Forest Service, Natural Resources Canada, Edmonton, AB, Canada
- 5Aldo Leopold Wilderness Research Institute, Rocky Mountain Research Station, USDA Forest Service, Missoula, MT, United States
- 6Forest and Rangeland Stewardship and Colorado Forest Restoration Institute, Colorado State University, Fort Collins, CO, United States
Introduction: Climate change is predicted to increase the frequency of extreme single-day fire spread events, with major ecological and social implications. In contrast with well-documented spatio-temporal patterns of wildfire ignitions and perimeters, daily progression remains poorly understood across continental spatial scales, particularly for extreme single-day events (“blow ups”). Here, we characterize daily wildfire spread across North America, including occurrence of extreme single-day events, duration and seasonality of fire and extremes, and ecoregional climatic niches of fire in terms of Actual Evapotranspiration (AET) and Climatic Water Deficit (CWD) annual climate normals.
Methods: Remotely sensed daily progression of 9,636 wildfires ≥400 ha was used to characterize ecoregional patterns of fire growth, extreme single-day events, duration, and seasonality. To explore occurrence, extent, and impacts of single-day extremes among ecoregions, we considered complementary ecoregional and continental extreme thresholds (Ecoregional or Continental Mean Daily Area Burned + 2SD). Ecoregional spread rates were regressed against AET and CWD to explore climatic influence on spread.
Results: We found three-fold differences in mean Daily Area Burned among 10 North American ecoregions, ranging from 260 ha day−1 in the Marine West Coast Forests to 751 ha day−1 in Mediterranean California. Ecoregional extreme thresholds ranged from 3,829 ha day−1 to 16,626 ha day−1, relative to a continental threshold of 7,173 ha day−1. The ~3% of events classified as extreme cumulatively account for 16–55% of total area burned among ecoregions. We observed four-fold differences in mean fire duration, ranging from 2.7 days in the Great Plains to 10.5 days in Northwestern Forested Mountains. Regions with shorter fire durations also had greater daily area burned, suggesting a paradigm of fast-growing short-duration fires in some regions and slow-growing long-duration fires elsewhere. CWD had a weak positive relationship with spread rate and extreme thresholds, and there was no pattern for AET.
Discussion: Regions with shorter fire durations had greater daily area burned, suggesting a paradigm of fast-growing short-duration fires in some regions and slow-growing long-duration fires elsewhere. Although climatic conditions can set the stage for ignition and influence vegetation and fuels, finer-scale mechanisms likely drive variation in daily spread. Daily fire progression offers valuable insights into the regional and seasonal distributions of extreme single-day spread events, and how these events shape net fire effects.
Introduction
Increasing global wildfire activity is associated with a growing occurrence of extreme wildfire events that pose substantial threats to human communities and natural systems due to their rapid and uncontrollable growth (Duane et al., 2021). Extreme fire events often exhibit exceptional fire behavior, including “blow-ups,” pyrocumulonimbus formation, high net fire radiative power (FRP), and even unusual phenomena such as fire whirls (Castellnou et al., 2022; Cova et al., 2023; Darwish Ahmad et al., 2023). Extreme events exert overwhelming demands on suppression resources and operational capacity, and can result in significant costs, loss of life, as well as unique and enduring ecosystem effects (Bowman et al., 2017; Tedim et al., 2020). Defining extreme wildfire events can be challenging due to inconsistencies between different metrics of fire activity and the socio-ecological impacts of wildfire (Tedim et al., 2018). Further, patterns of fire activity vary across gradients of climate and human influence, and what constitutes an extreme event in one location might represent normal fire activity elsewhere (Hantson et al., 2015). However, regardless of how they are defined or measured, a focus on extreme events casts light on the consequential fact that a relatively small subset of short-duration events is disproportionately responsible for overall wildfire impacts (Wang et al., 2021).
The daily rate of fire spread is an important aspect of extreme wildfire behavior that has received little attention until recently but is of growing interest. In the western US, many recent fire years have been marked by conspicuously large, single-day fire spread events. For example, during the record-setting 2020 fire season, 21 fires in California, Oregon, and Colorado achieved 46 single-day blow-ups that exceeded 10,000 ha/d. Such extreme single-day spread events can account for a very large proportion of cumulative area burned; for example, across fire-prone regions of the western US between 2002 and 2020, the largest 10% of single-day fire spread events accounted for 58% of overall area burned, and the top 1% of events accounted for 20% (Coop et al., 2022). Given the positive relationship between fire size and duration (Wang et al., 2020), large, single-day fire spread events can also disproportionately lengthen fire duration and attendant demands on incident management and affected communities. Therefore, using daily fire progression alongside occurrence of single-day extremes to understand patterns of fire duration could reveal valuable insights towards effective incident management.
Recent advances in our understanding of daily wildfire progression across large landscapes are supported by the widespread availability of satellite-based fire detections coupled with methodological advances for their utilization (Parks et al., 2014; Andela et al., 2019). For example, remote sensing and geospatial approaches have linked various aspects of daily fire progression to climate, weather conditions, and fuel (vegetation) types (Veraverbeke et al., 2014; Holsinger et al., 2016; Hart and Preston, 2020; Wang et al., 2023). However, the extent to which these relationships hold across broader continental scales or vary across narrower geographic regions remains uncertain.
Ecoregions provide a useful framework to assess geographic patterns of variation in ecosystems and biophysical processes such as daily fire progression at the subcontinental scale. By integrating a broad suite of climate and vegetation factors that influence fire, ecoregions offer a useful grouping scheme for evaluation of different components of fire regimes and extreme behaviors (Syphard and Keeley, 2020; Park et al., 2021; Pausas, 2022). For instance, climate variation along two axes, average actual evapotranspiration (AET) and climate water deficit (CWD), shapes vegetation distributions and segregates ecoregions across North America (Stephenson, 1998). AET, which measures both energy and water availability, predicts net primary productivity (Rosenzweig, 1968). Ecoregions with short-statured and sparse vegetation display lower AET on average compared to more productive conifer and broadleaf forests. Similarly, plant species distributions are influenced by CWD, which measures drought or evaporative demand exceeding moisture availability (Lutz et al., 2010). Warm desert ecoregions have high annual deficits, whereas cool or mesic forests and tundra have lower deficits. Because of these relationships to productivity and fuel moisture, gradients of AET and CWD also predict components of fire regimes across ecoregions, such as annual area burned and burn severity (Parks et al., 2014). For example, fuel availability increases and fuel type shifts from herbaceous to woody and from conifer to broadleaf as a function of AET. Similarly, fuel moisture declines and flammability increases with CWD. Given these mechanisms, we would also expect ecoregional AET and CWD climate normals to influence aspects of daily fire progression. For example, low fuel availability could limit daily fire spread in ecoregions with high CWD, whereas herbaceous and woody fuel types can promote very high rates of spread in regions with lower CWD. Conversely, where AET is high and fuels are plentiful, high fuel moisture and less flammable fuel types (e.g., broadleaf forests) may generally constrain daily fire spread.
In addition to ecoregional differences in climate and vegetation distributions, ecoregions vary in a suite of other ecological and human factors that could also lead to differing patterns of extreme single-day events and daily fire progression. For example, ecoregional differences in standing fuel biomass may influence occurrence of extreme single-day events and fire durations moreso than annual productivity inferred from AET climate normals. Ecoregions also face different pressures of environmental change that are relevant to daily fire progression, including patterns of invasion by highly flammable annual grasses (Fusco et al., 2019), vegetation responses to climate change (Hossain and Li, 2021), and climate change velocity (e.g., rate of climatic warming; Loarie et al., 2009). Such climatic changes are broadly expected to promote extreme single-day events and modulate fire seasons (Wang et al., 2015; Kirchmeier-Young et al., 2019; Halofsky et al., 2020; Coop et al., 2022). Consequently, occurrence of single-day blow-ups and their realized impacts are likely to differ among ecoregions, along with associated differences in characteristic fire duration and seasonality.
The increasing availability of gridded climate data (Abatzoglou et al., 2018) and improved consistency of high-resolution fire perimeter maps between the United States and Canada provide new opportunities to gain insights into extreme single-day events and daily fire progression at continental and sub-continental scales. The purpose of this study was to quantify extreme single-day spread events and assess their relative influence in shaping patterns of net fire effects across northern North America, defined here as Canada and the United States. Our primary objective was to characterize North American daily fire progression and extreme single-day events at the continental and ecoregional scales. Our secondary objective was to explore how ecoregions differ in other aspects of daily fire progression, namely total fire duration (number of days of burning), duration of consecutive daily extreme spread, and fire season (timing of fire spread and extreme events within the year), as well as trends in annual occurrence of extreme single-day events over time. Our third objective was to contextualize average and extreme single-day spread along ecoregional annual AET and CWD climate normals, which may directly influence daily fire spread rates and contribute to any differences observed among ecoregions. By exploring the geography and climate space of extreme single-day wildfire spread events, we aim to help identify where and when blow-ups occur most frequently and are most consequential in terms of proportion of area burned. Our findings are particularly relevant to fire management agencies and communities that are increasingly threatened by rapidly spreading fires and changing fire seasonality, as well as land managers tasked with managing novel fire activity and landscape-scale impacts.
Methods
Study area
Our study area spans the continental United States, Alaska, and Canada (c. 2 × 10⁷ km2; Figure 1A). To examine fire activity across northern North America, we utilized North American Level 1 Ecoregions (Commission for Environmental Cooperation, 2006), which integrate the continent’s diverse climate, geology, vegetation, and human land use patterns into ecologically similar geographic regions. To simplify our analyses, we merged three smaller ecoregions, each with a relatively low number of fires, into larger neighboring ecoregions with relatively similar vegetative and climatic conditions. Specifically, we merged Tropical Wet Forests with Eastern Temperate Forests, Southern Semi-arid Highlands with Temperate Sierras, and Hudson Plain with Taiga.
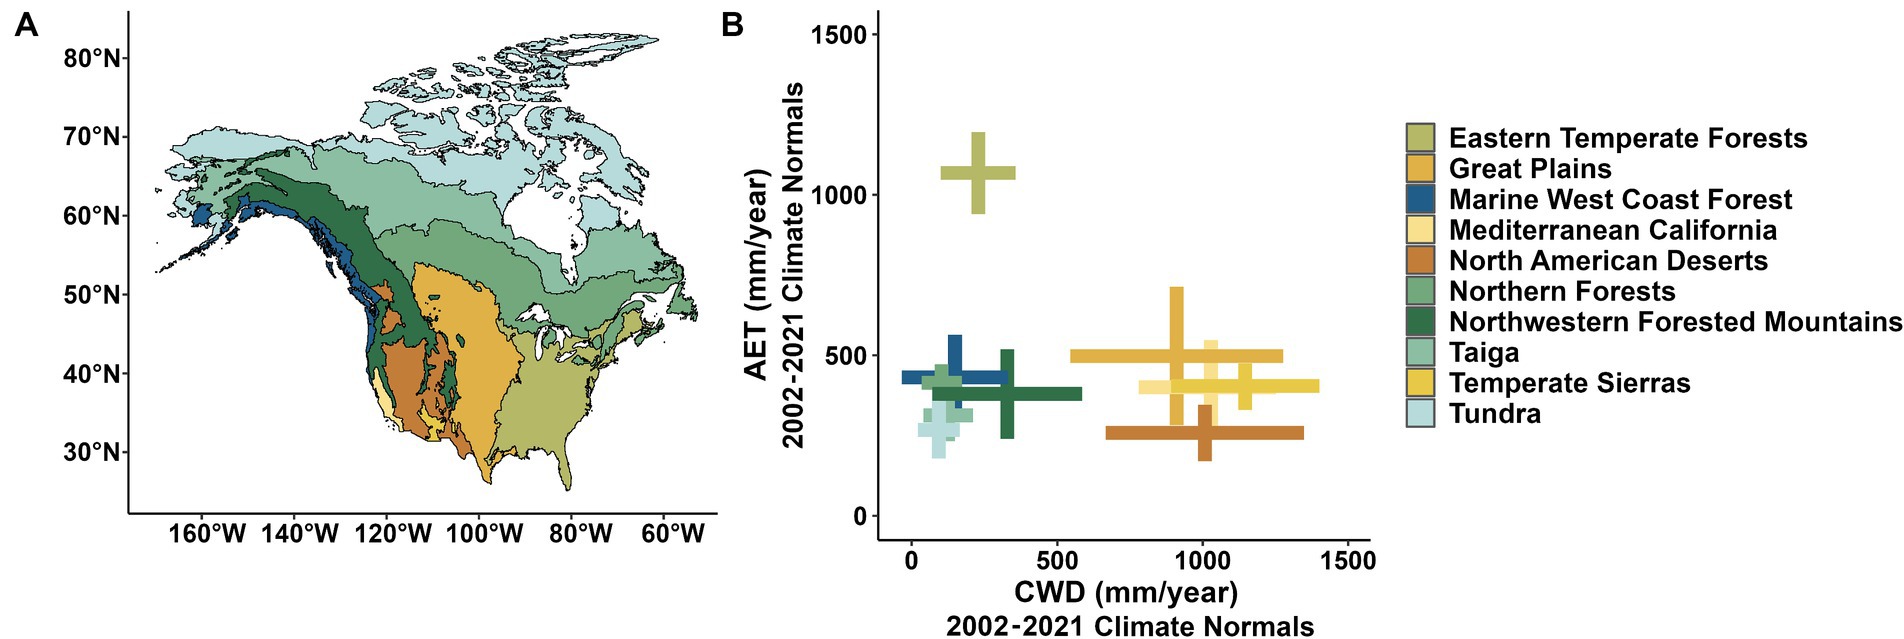
Figure 1. North American ecoregions’ (A) geographic locations and their (B) average annual actual evapotranspiration (AET) and climatic water deficit (CWD) within ecoregional burned areas during the 2002–2021 climate reference period. Ecoregion is denoted by color, with cross center points indicating ecoregions’ burned areas’ average annual CWD and AET. Error bars (crosses) give +/− 1 SD of AET or CWD across burned pixels.
Following these modifications, our study area comprises 10 ecoregions with distinct climate and vegetation characteristics (Figure 1A). Briefly, “North American Deserts” consist of arid and semi-arid regions, characterized by sparse vegetation such as cacti, shrubs, and drought-tolerant grasses with occasional desert-adapted trees (Commission for Environmental Cooperation, 2006). Climatologically, the deserts are characterized by drought conditions with low evapotranspiration (e.g., Figure 1B). Next, “Mediterranean California” is named for its Mediterranean climate, characterized by hot, dry summers and mild, wet winters. The vegetation includes a mix of shrubs, chaparral, grasses, and oak woodlands. The “Temperate Sierras” comprises mountainous regions including sky-islands from the “Southern Semi-arid Highlands.” Its diverse vegetation includes meadows as well as coniferous and mixed forests. Elevational gradients in these systems lead to variation in climatic conditions similar to those experienced by the deserts and Mediterranean California. In contrast, the “Tundra” is characterized by low temperatures and drought, permafrost, and a short summer growing season with vegetation mainly consisting of mosses, lichens, dwarf shrubs, and grasses. Bordering the tundra to the south is the “Taiga,” a more productive ecoregion dominated by conifers, including spruce, fir, and pine trees. The floor of these dense boreal forests typically has a thick layer of organic matter, including needles, leaves, and woody debris. However, the Taiga also includes some minerotrophic peatlands with varying degrees of canopy cover from the “Hudson Plain” ecoregion that is combined here. To the south of the Taiga are “Northern Forests,” typified by a mix of coniferous and deciduous forests. Fuels in this ecoregion vary by dominant tree species and forest composition – for example, woody debris and fine needles accumulate in predominantly coniferous forests, whereas deciduous forests also accumulate coarse leaf litter. The mountainous regions of the Pacific Northwest are summarized as the “Northwestern Forested Mountains,” characterized by a wetter climate that creates diverse temperate rainforests and mixed conifer forests that extends into the Sierra Nevada and the Rocky Mountains. Towards the Pacific coast, the “Marine West Coast Forest” encompasses coastal regions with mild, moist climates and a mix of coniferous and broadleaf trees. Spanning the southeast of our study area, the “Eastern Temperate Forests” covers a broad area and includes deciduous, mixed, and coniferous forests with a generally wet and productive climate. Like the northern forests, the diverse array of tree species found in eastern temperate forests begets heterogeneity in understory fuel conditions. Our decision to merge “Tropical Wet Forests,” found exclusively at the southernmost tip of Florida, further contributes to the diversity of conditions in this region. Finally, the “Great Plains” ecoregion spanning the central USA and southern Canada is predominantly characterized by grasslands and shrublands, and often forest corridors along streams. The region experiences a range of climatic conditions from low to moderate drought.
Daily fire progression and identification of extreme events
We measured daily area burned (ha d−1) for individual wildfires by interpolating spatially continuous daily progression maps following methods developed by Parks (2014; Supplementary Figure S1). This technique interpolates VIIRS and MODIS hotspot detections to map the most likely day of burning at 30-m resolution within final wildfire perimeters obtained from national repositories. Previous studies have successfully utilized this technique to study various aspects of fire activity, including daily area burned (Hart and Preston, 2020), spread (Holsinger et al., 2016; Wang et al., 2017), and refugia (Meigs et al., 2020; Downing et al., 2021). We constrained all daily progression interpolations to final fire perimeters obtained from the Monitoring Trends in Burn Severity (MTBS, USA; USDA Forest Service and USGS, 2023) and National Burned Area Composite (NBAC, Canada; Hall et al., 2020) national repositories. Centroids of final fire perimeters were used to identify within which ecoregion individual fires occurred. Fires <400 ha were removed from the NBAC dataset to be consistent with the MTBS dataset, and because the interpolation method is inappropriate for smaller fires due to the coarse spatial resolution of MODIS and VIIRS pixels. Similarly, fires with <10 hotspot detections were excluded from our analyses due to reduced accuracies in daily progression maps interpolated from few detections. All detections that occurred between midnight and 0600 h local time were assigned to the previous day under the assumption that those locations likely burned during the previous day with lingering heat signatures. In total, we interpolated daily fire progression for 9,636 fires and 66,318 unique daily fire spread events, which ranged in size from 25 to 224,565 ha. Daily spread events followed a skewed log-normal distribution, so we performed all statistical analyses and calculations on log10 transformed values and back-transformed to native values for presentation. One-way analysis of variance (ANOVA) and Tukey’s Honestly Significant Difference (HSD) were used to compare daily areas burned, fire duration, and fire season among ecoregions. All geospatial data processing and statistical analyses were completed in R 4.2.2 (R Core Team, 2022).
Next, we developed two complementary definitions of extreme single-day fire spread thresholds to explore how occurrence, extent, and impacts of single day blow-ups vary among ecoregions. Specifically, following a distributional definition inspired by Coop et al. (2022), we identified the top 2SD of events across northern North America as “continental extreme spread events,” as well as by ecoregion, or “ecoregional extreme spread events”:
Similarly, we calculated continental and ecoregional “large” event thresholds (e.g., mean + 1SD) to identify single-day events that are substantially larger than common spread days, but not as massive as extreme spread days. By presenting both tiers of continental and ecoregion-specific spread events, we aim to provide (1) a common continental definition of extremes that facilitates intuitive comparison of occurrence, extent, and impacts among ecoregions and (2) regionally contextualized estimates that may more accurately characterize realized differences in extreme fire activity among ecoregions.
Duration of fire spread, duration of extreme activity, fire season, and interannual trends in extremes’ occurrence
Day of burning information from daily fire progression maps provides insight towards several temporal aspects of fire activity. First, we calculated each fire’s duration as the difference between its maximum and minimum day of burning, plus one day so that the final day of burning was effectively counted (e.g., a fire that began and ended on the same day would have a calculated duration of 1 day). To determine how fire duration is related to average and maximum daily spread, we regressed fires’ duration against their average and maximum daily areas burned. We included a model term for ecoregion to allow different intercepts and trends among regions (e.g., linear regression: Average or Maximum Daily Area Burned ~ Duration*Ecoregion). Second, we characterized duration of single-day extreme fire activity by counting consecutively occurring days of ecoregional and continental extremes within each fire. Third, we examined differences in ecoregional fire seasons by modeling day-of-year of burning among ecoregions (e.g., ANOVA: day-of-year of burning ~ Ecoregion) and by plotting ecoregional frequency histograms of common, large, and extreme events’ occurrences across a year. Finally, we used Sen’s slopes calculated with the “trend” package (Pohlert, 2023) to analyze temporal trends in ecoregional annual counts of both continental and ecoregion-specific large and extreme single-day spread events between 2002 and 2021.
Daily fire spread and the climate space of fire
We characterized ecoregions’ average climatic conditions in terms of AET and CWD by sampling TerraClimate 2002–2021 annual climate normal reference climatology rasters within the cumulative area burned by all fires that occurred within each ecoregion. These climate normal values were summarized as the ecoregional average AET or CWD ± 1SD. To explore broad-scale patterns between daily fire spread and these key climatic gradients, we regressed ecoregional average daily spread rates as well as large and extreme fire spread thresholds against ecoregional burned areas’ annual average AET and CWD conditions (e.g., linear model; common, large, or extreme daily fire spread threshold ~ Ecoregion*[AET or CWD]).
Results
Occurrence and impacts of single-day extreme fire spread
Between 2002 and 2021, 9,636 wildfires >400 ha occurred in North America, ranging from 75 to 2,388 fires or 3.7×10⁻⁵ to 3.2×10⁻³ fires/km2 among ecoregions (Table 1; Figure 1A). Consequently, counts of daily spread events also varied greatly by ecoregion (493 to 24,133 spread days; 66,318 total), with the fewest in Marine West Coast Forest and the most in the Northwestern Forested Mountains. There were 2.9-fold differences among ecoregions in mean daily area burned, ranging from 260 ha day−1 in the Marine West Coast Forests to 751 ha day−1 in Mediterranean California. The largest mean fire sizes were in the Taiga and Northern Forests ecoregions (3546–3,880 ha) and the smallest mean fire size was in the Eastern Temperate Forests (1,330 ha).
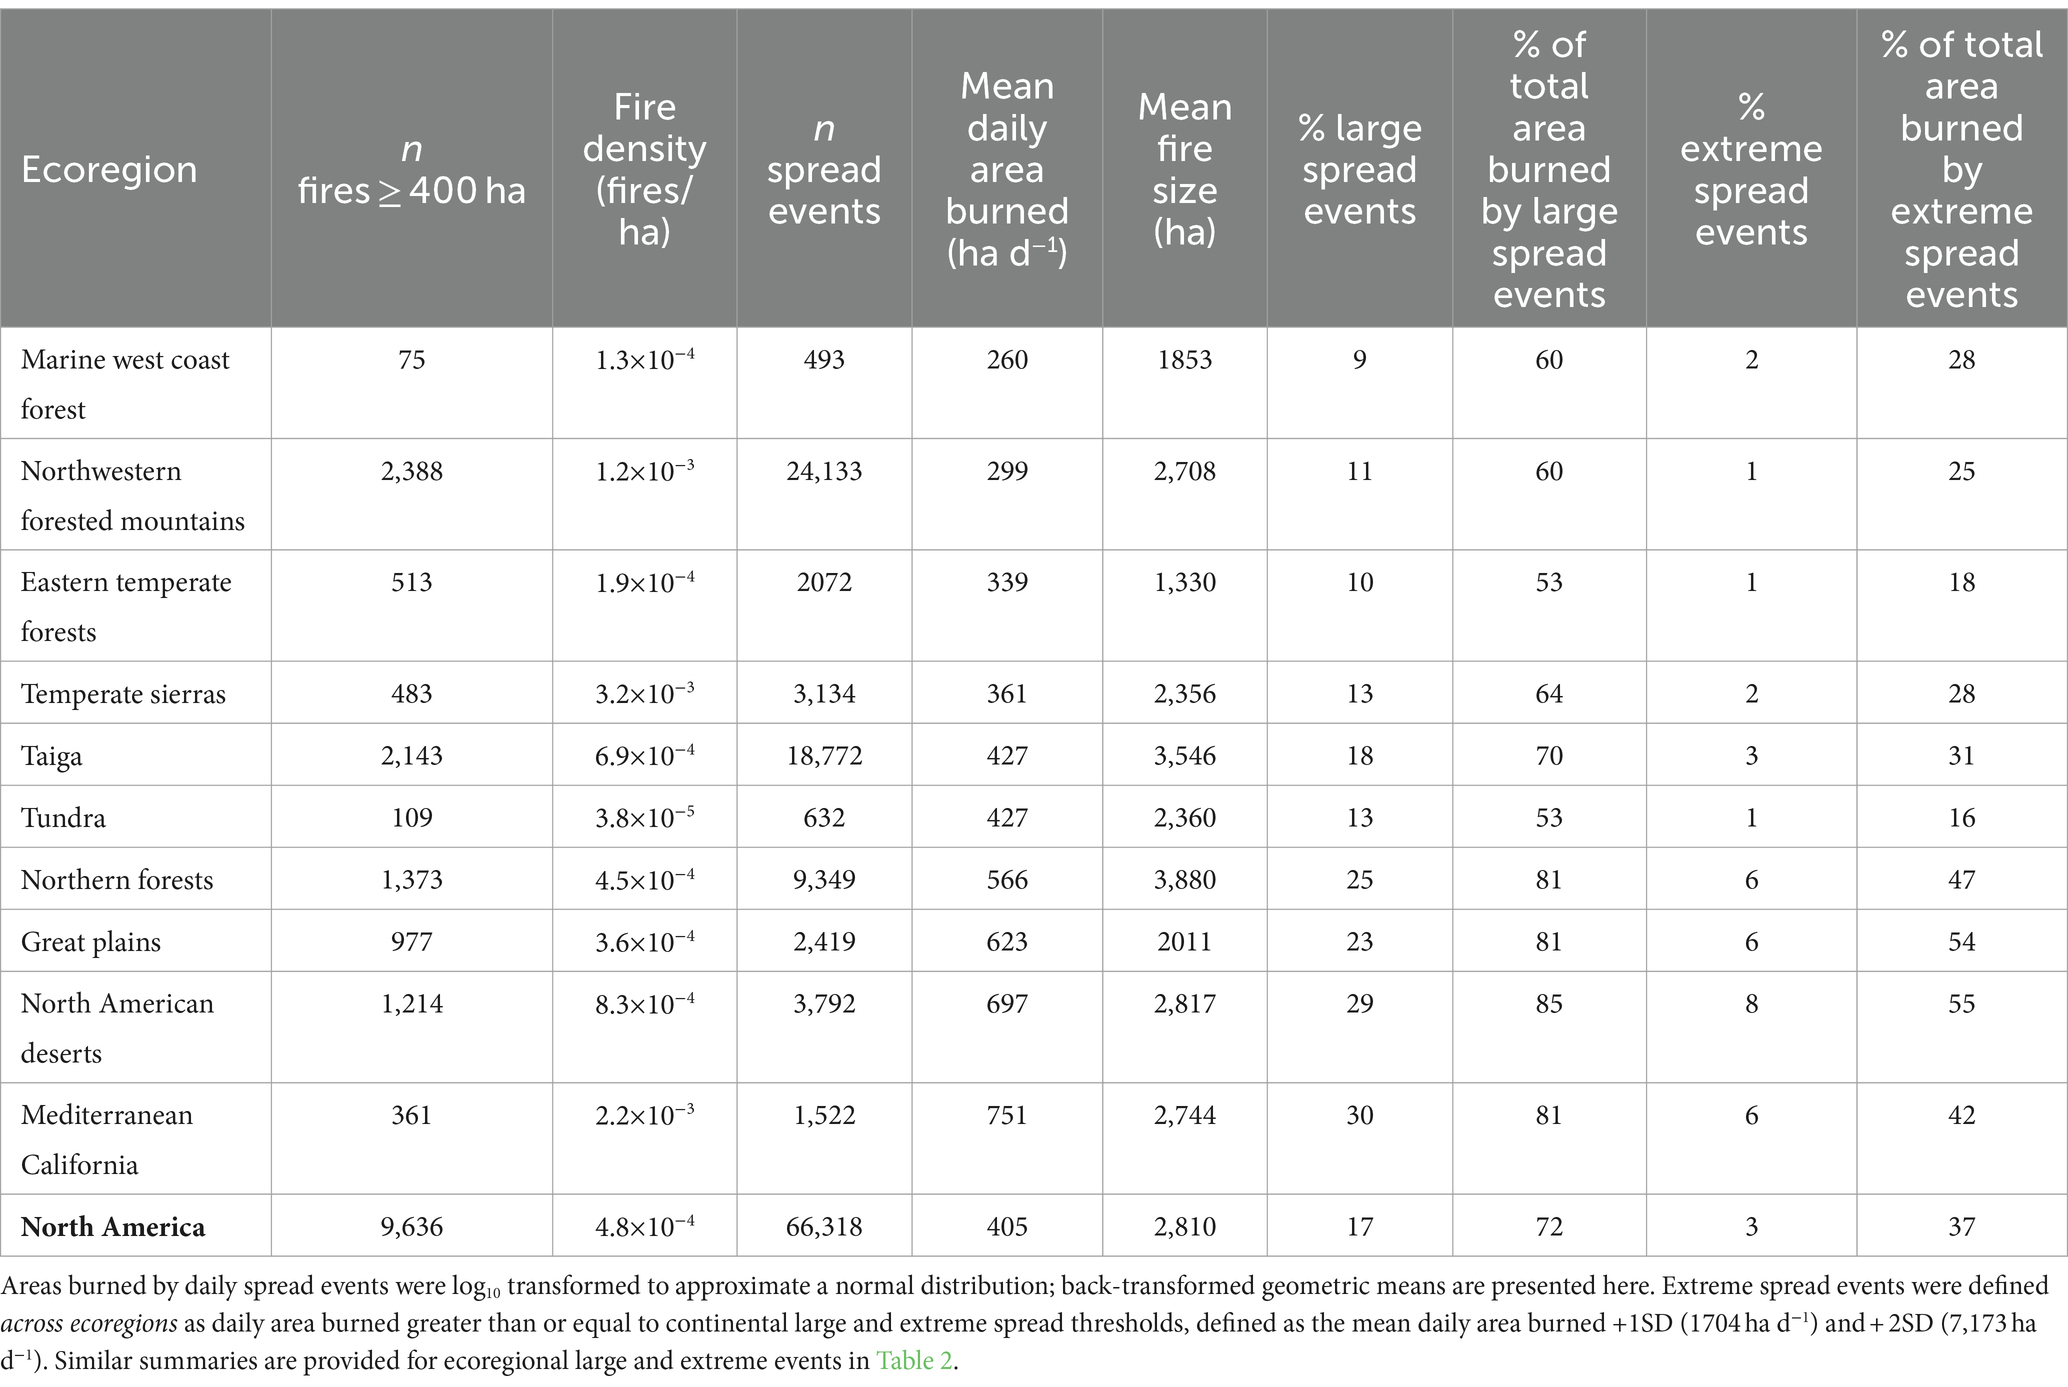
Table 1. Summary of wildfire, daily spread, continental large and extreme events, and impacts in North American Ecoregions (EPA, level 1 classification) from 2002–2021.
Extreme single-day fire events made an outsized contribution to the total area burned in North America over the past two decades (Figure 2). Daily areas burned by continental large single-day spread events cumulatively account for 72% of total area burned, and continental extreme single-day spread events account for more than 37% of the total area burned (Table 1; Figure 2). Continental large and extreme thresholds varied greatly from the ecoregional thresholds (Table 1 vs. Table 2). Specifically, there was 3.5-fold variation among ecoregional thresholds, with ecoregional large spread thresholds ranging from 997 ha day−1 to 3,403 ha day−1, whereas the continental large threshold was 1704 ha day−1 (Figure 3A). Similarly, ecoregional extreme thresholds ranged from 3,829 ha day−1 to 16,626 ha day−1, relative to a continental extreme threshold of 7,173 ha day−1. When using the continental thresholds, the percentage of fire spread events identified as large ranged widely among ecoregions (9–30%), as did the percentage of events identified as extreme (1–8%; Table 1). By these continental definitions of single-day blow-ups, the North American Deserts, Great Plains, Mediterranean California, and Northern Forests experienced the most extreme spread days, whereas the Tundra, Northwestern Forested Mountains, and Eastern Temperate Forests experienced the fewest extreme spread days. In contrast, when ecoregional definitions were used, similar proportions of single-day spread events were identified as large and extreme among ecoregions (15–17% for large; 2–3% for extreme). Nonetheless, proportions of total area burned by single-day events range widely among ecoregions and overlap between continental and ecoregional definitions (Tables 1, 2). Specifically, continental large events spanned 53–85% of total area burned, relative to 58–73% for ecoregion-specific large events. Likewise, continental extreme events spanned 16–55%, and 20–41% for ecoregion-specific.
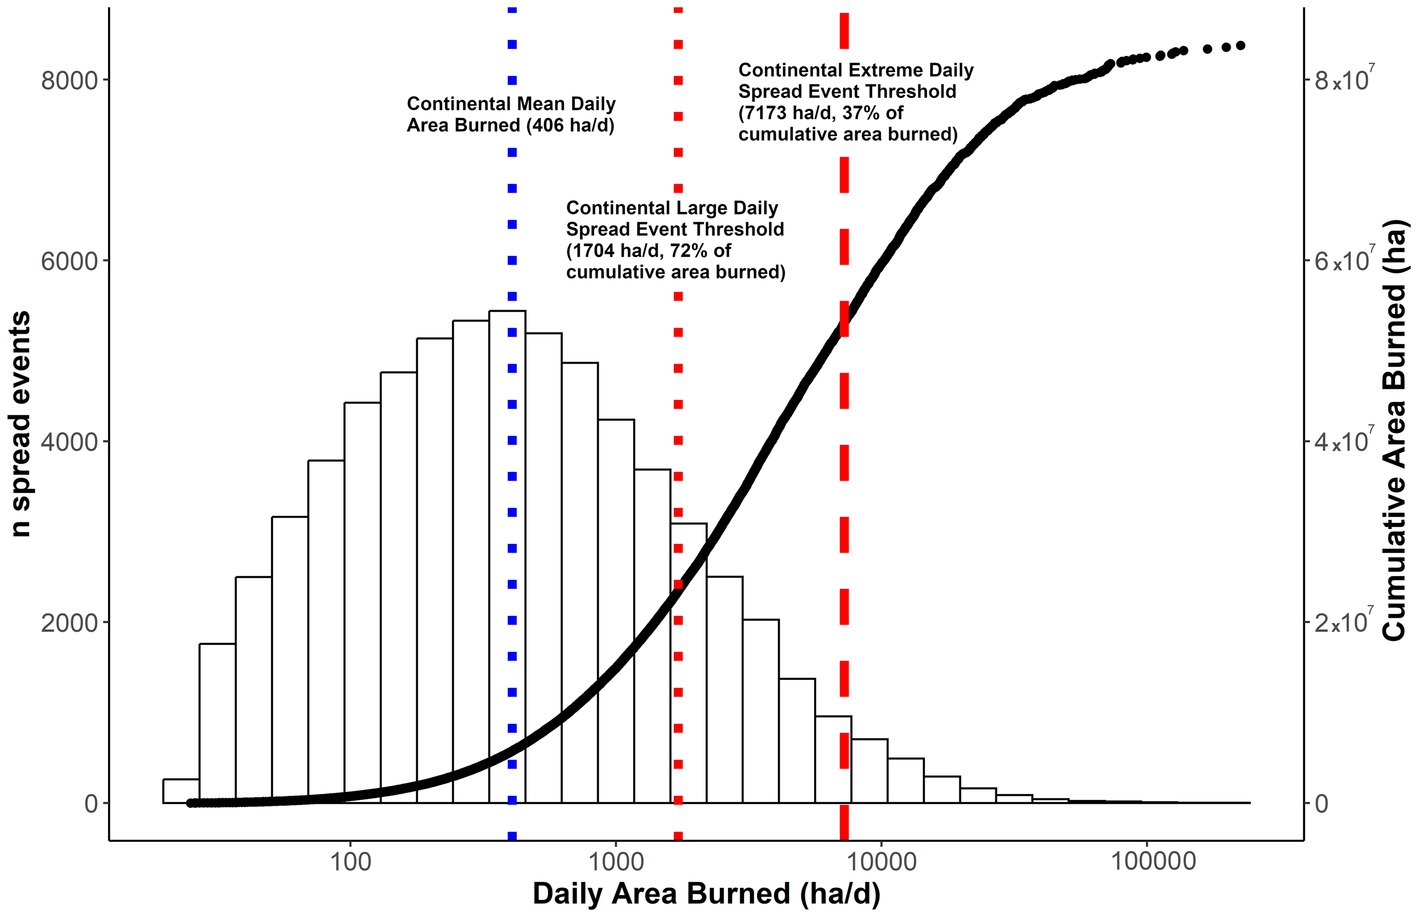
Figure 2. Distribution of daily fire spread events area burned (histogram bars, left Y axis) and their cumulative area burned across North America during the 2002–2021 study period (black points, right Y axis; n = 66,318 total spread events). The dotted blue vertical line indicates the continental mean daily area burned (406 ha/d), whereas the dotted red line indicates large single-day events identified as exceeding a threshold of the continental mean daily area burned +1SD (1704 ha d-1), while the dashed red line indicates extreme single-day events identified as exceeding the continental mean daily area burned +2SD (7,173 ha d-1). The top 1SD and 2SD single-day spread events account for 72 and 37% of cumulative area burned, respectively.
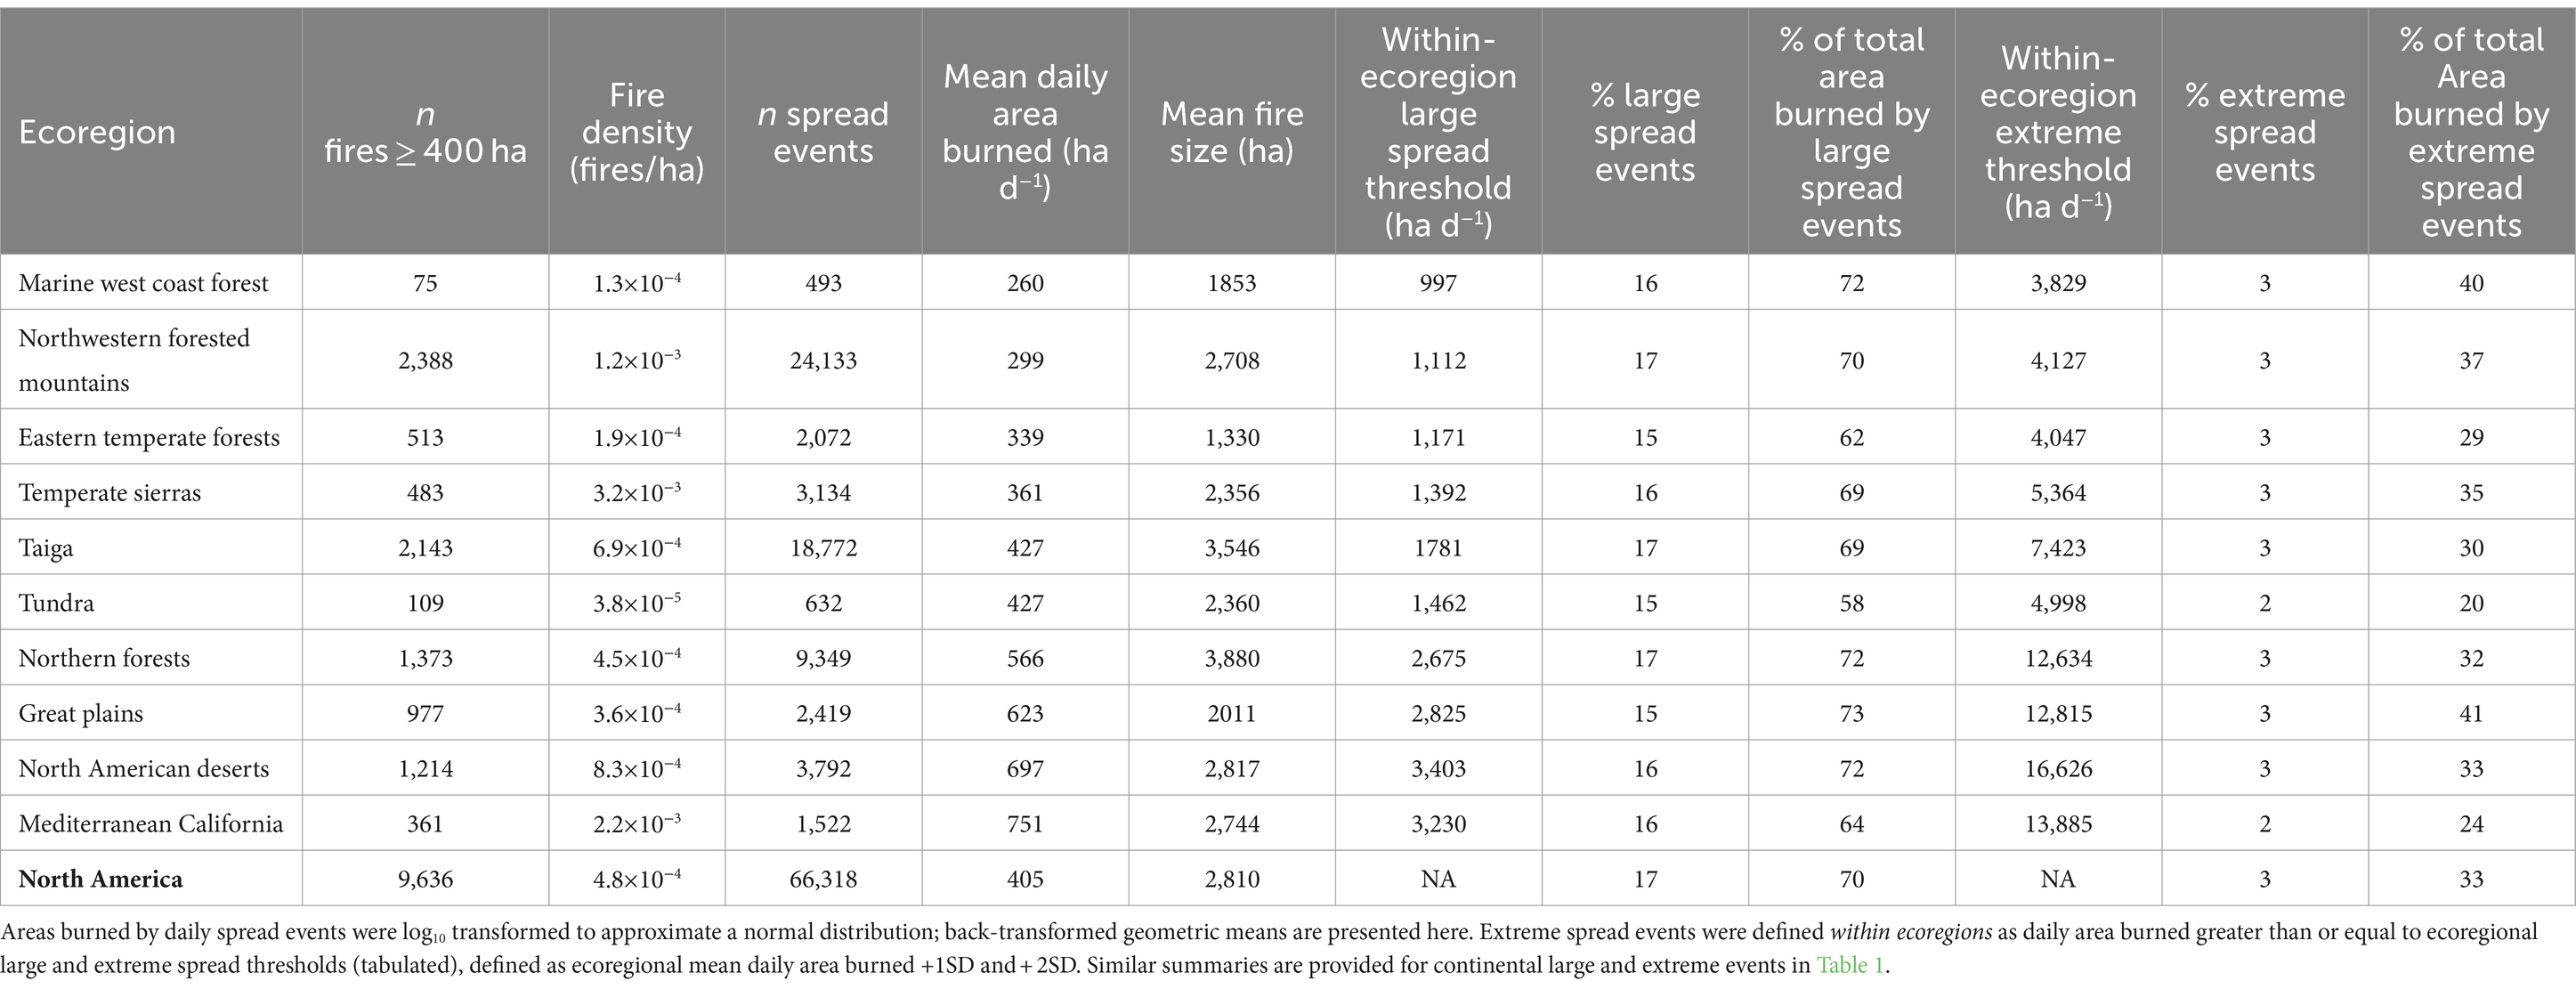
Table 2. Summary of wildfire, daily spread, ecoregional large and extreme events, and impacts in North American Ecoregions (EPA, level 1 classification) from 2002–2021.
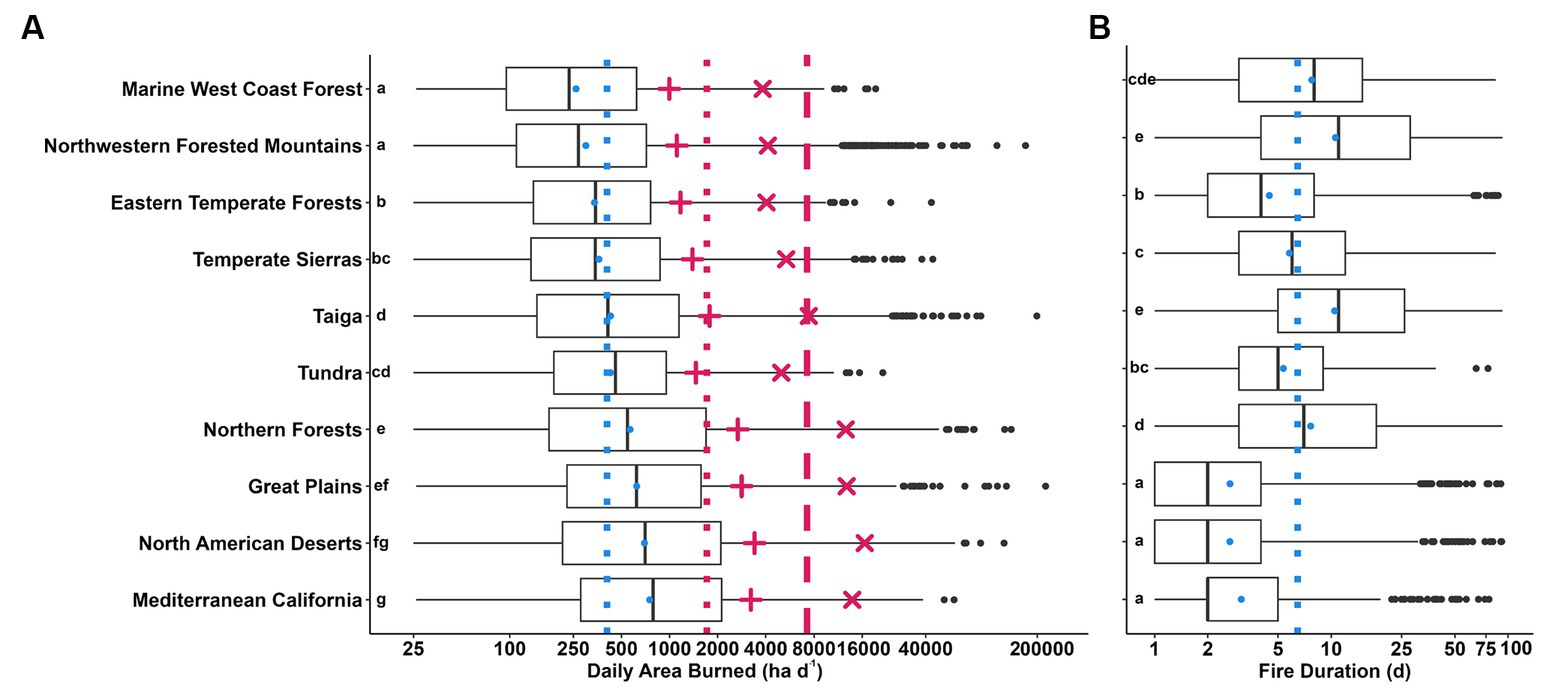
Figure 3. (A) Ecoregional daily area burned (ha day−1) by fire spread events, and (B) fire duration (days). In both panels, values were log10 transformed and axis labels were backtransformed to original scale. Boxplot hinges correspond to the first and third quartiles, bolded center lines represent medians, whiskers represent 1.5 x interquartile range, and black circular points indicate outlier spread events. Blue circular points represent ecoregional geometric mean daily area burned or fire duration. Blue dotted vertical lines indicate continental geometric mean daily area burned (406 ha d−1) and continental mean fire duration (6.5 days). Black letters in plot spaces to the immediate right of Y axis indicate Tukey’s HSD groupings (e.g., Marine West Coast Forest and Northwestern Forested Mountains have the same mean daily area burned; from one-way ANOVA test of Daily Area Burned: F (9, 66,308) = 317.6, p < 0.001; Fire Duration one-way ANOVA: F (9, 9,626) = 290.8, p < 0.001). In (A), red “+” points represent ecoregional “large” fire spread thresholds (i.e., ecoregional geometric mean + 1SD; Table 2), and red dotted vertical line indicates continental “large” spread threshold (i.e., continental geometric mean + 1SD; 1,704 ha d−1). Red “X” points represent ecoregional “extreme” spread thresholds (i.e., ecoregional geometric mean + 2SD; Table 2), and red dashed vertical line indicates continental “extreme” spread threshold (i.e., continental geometric mean + 1SD; 7,173 ha d−1).
Fire duration and duration of extremes
Similar to daily area burned, fire duration varied greatly by ecoregion. Ecoregions had a 4-fold difference in average fire duration, ranging from 2.7 days in the Great Plains to 10.5 days in Northwestern Forested Mountains (Figure 3B). Regions with shorter duration fires also tend to have greater average daily areas burned, like Mediterranean California, North American Deserts, and the Great Plains (Figure 4). Whereas, regions with longer-duration fires tend to have lower average daily areas burned, such as the Marine West Coast Forest and Northwestern Forested Mountains. Taiga and Northern Forests also had some of the longest fire durations with moderate average daily area burned. Further, within-ecoregion variability in fire duration was high, especially in areas with longer average durations (e.g., Figure 3). A similar negative relationship between average daily spread rate and fire duration was apparent on a by-fire basis; only the Tundra and Taiga were exceptions, with no significant change in average daily spread over the range of observed fire durations (Figure 5A). Whereas, ecoregional maximum spread rates generally increased with fire duration (Figure 5B). Although average fire duration is generally less than one week (continental mean = 6.5 days), all regions experienced fires that exceeded 50 days.
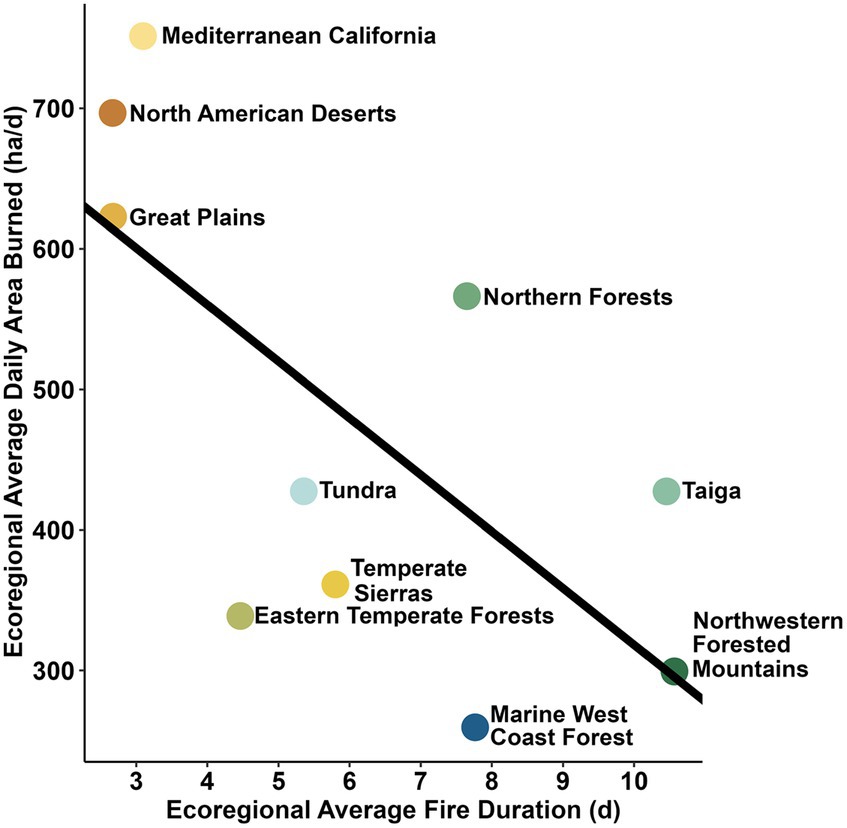
Figure 4. Ecoregional average fire duration versus average daily area burned (linear model: average daily area burned ~ average duration; F (1, 8) = 5.86, p = 0.042, adj. R2 = 0.35). Points colored by ecoregion; black line represents linear model fit.
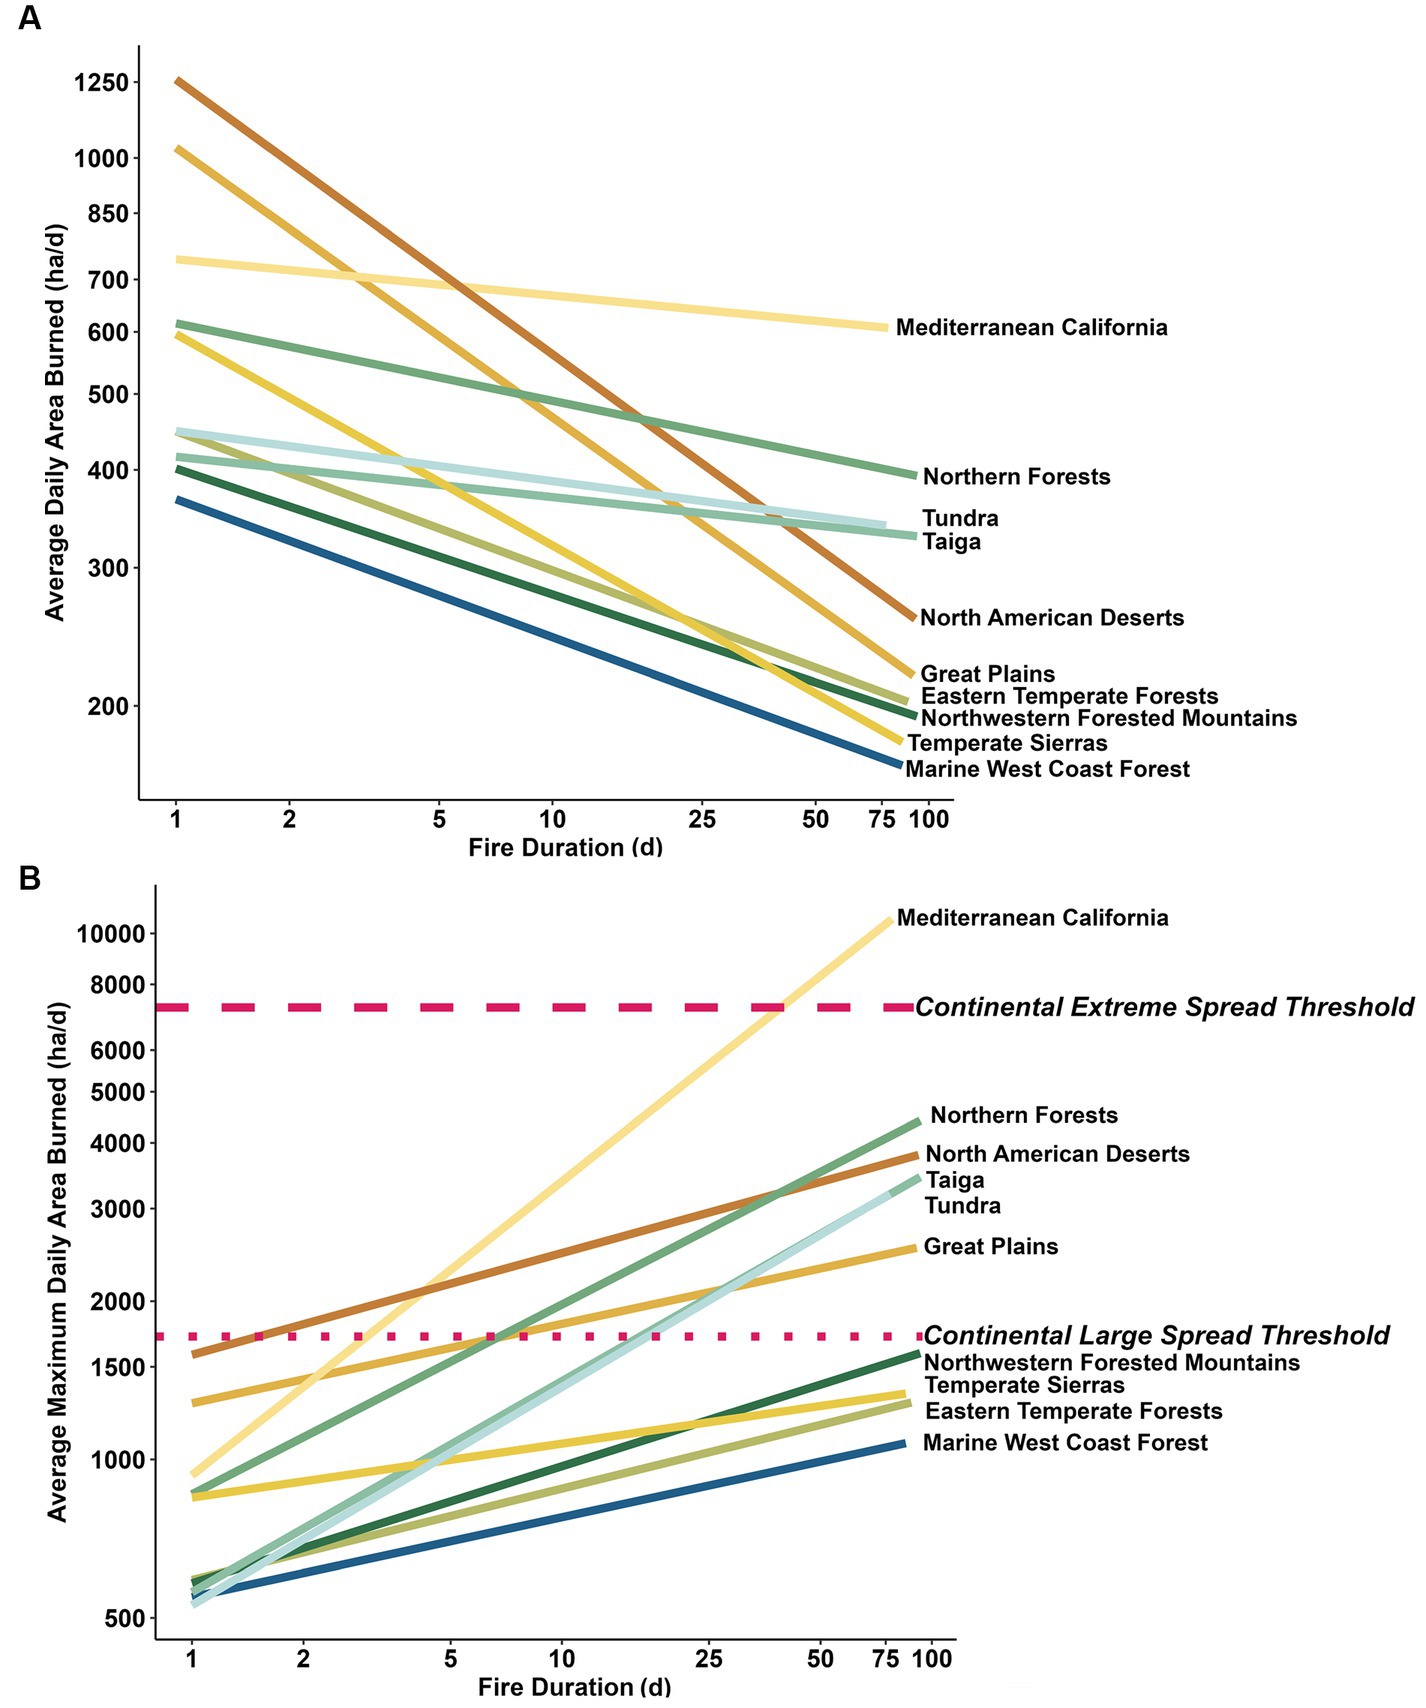
Figure 5. Ecoregional relationship between fire duration and by-fire average daily area burned (A) and with by-fire maximum daily area burned (B). Axes were back-transformed from log10 scale for presentation. Lines denote ecoregional trendlines, colored by ecoregion with labels at right of plotspace (Linear models; Daily Area Burned ~ Fire Duration * Ecoregion; F (19, 9,616) = 138.3, p < 0.001, adj. R2 = 0.21; Maximum Daily Area Burned ~ Fire Duration * Ecoregion; F (19, 9,616) = 79.08, p < 0.001, adj. R2 = 0.13).
Extreme fire spread generally has a single-day duration, as very few fires achieved consecutive days of extreme spread whether they were identified by continental or ecoregional thresholds (Supplementary Figures S2A,B). For example, although nearly 10% of fires experienced at least one day of continental extreme spread, only 3.5% achieved any consecutive days, with only 1.5% achieving more than 2 consecutive days. One fire in the Northern Forests achieved a 12-day streak of continental extreme spread. Similarly, 8% of fires experienced at least one day of ecoregional extreme spread, but only 3.2% achieved any consecutive days, with only 1.3% achieving more than 2 consecutive days. One fire in the Northwestern Forested Mountains achieved an 18-day streak of ecoregional extreme spread. In contrast, a larger proportion of fires exhibit consecutive streaks of extreme and/or large spread, ranging from 17–18% of fires by either definition. Nonetheless, these extreme and/or large spread streaks tend to be short duration, as only 9% of fires achieved more than 2 consecutive days (Supplementary Figures S2C,D). However, some exceptional fires achieved multiple short and intermediate duration streaks of extreme spread (e.g., 1× 2-day, 1× 5-day, 2× 7-day, and 1×9 day in Supplementary Figure S1).
Fire season and seasonality of extremes
Fire spread days in North America occur in every month of the year but are concentrated in summer months (June–September) with the end of July and beginning of August having the highest prevalence of fire spread events (Figure 6; Supplementary Figure S3A). Several ecoregions have an earlier vernal start to their fire seasons, predominantly Eastern Temperate Forests and the Great Plains, but these two ecoregions also have the broadest and most bimodal distributional spread of fire days. Apparent bimodality in the seasonal distribution of fire days is also evident to a lesser degree in Mediterranean California and the Marine West Coast Forest. Northern Forests, Taiga, and Tundra have an abrupt start to the fire season in mid-April through mid-May, with later fire season starts in the most northern ecoregions. The Northwestern Forested Mountains and Mediterranean California have longer fire seasons into the fall, mostly burning in August–October.
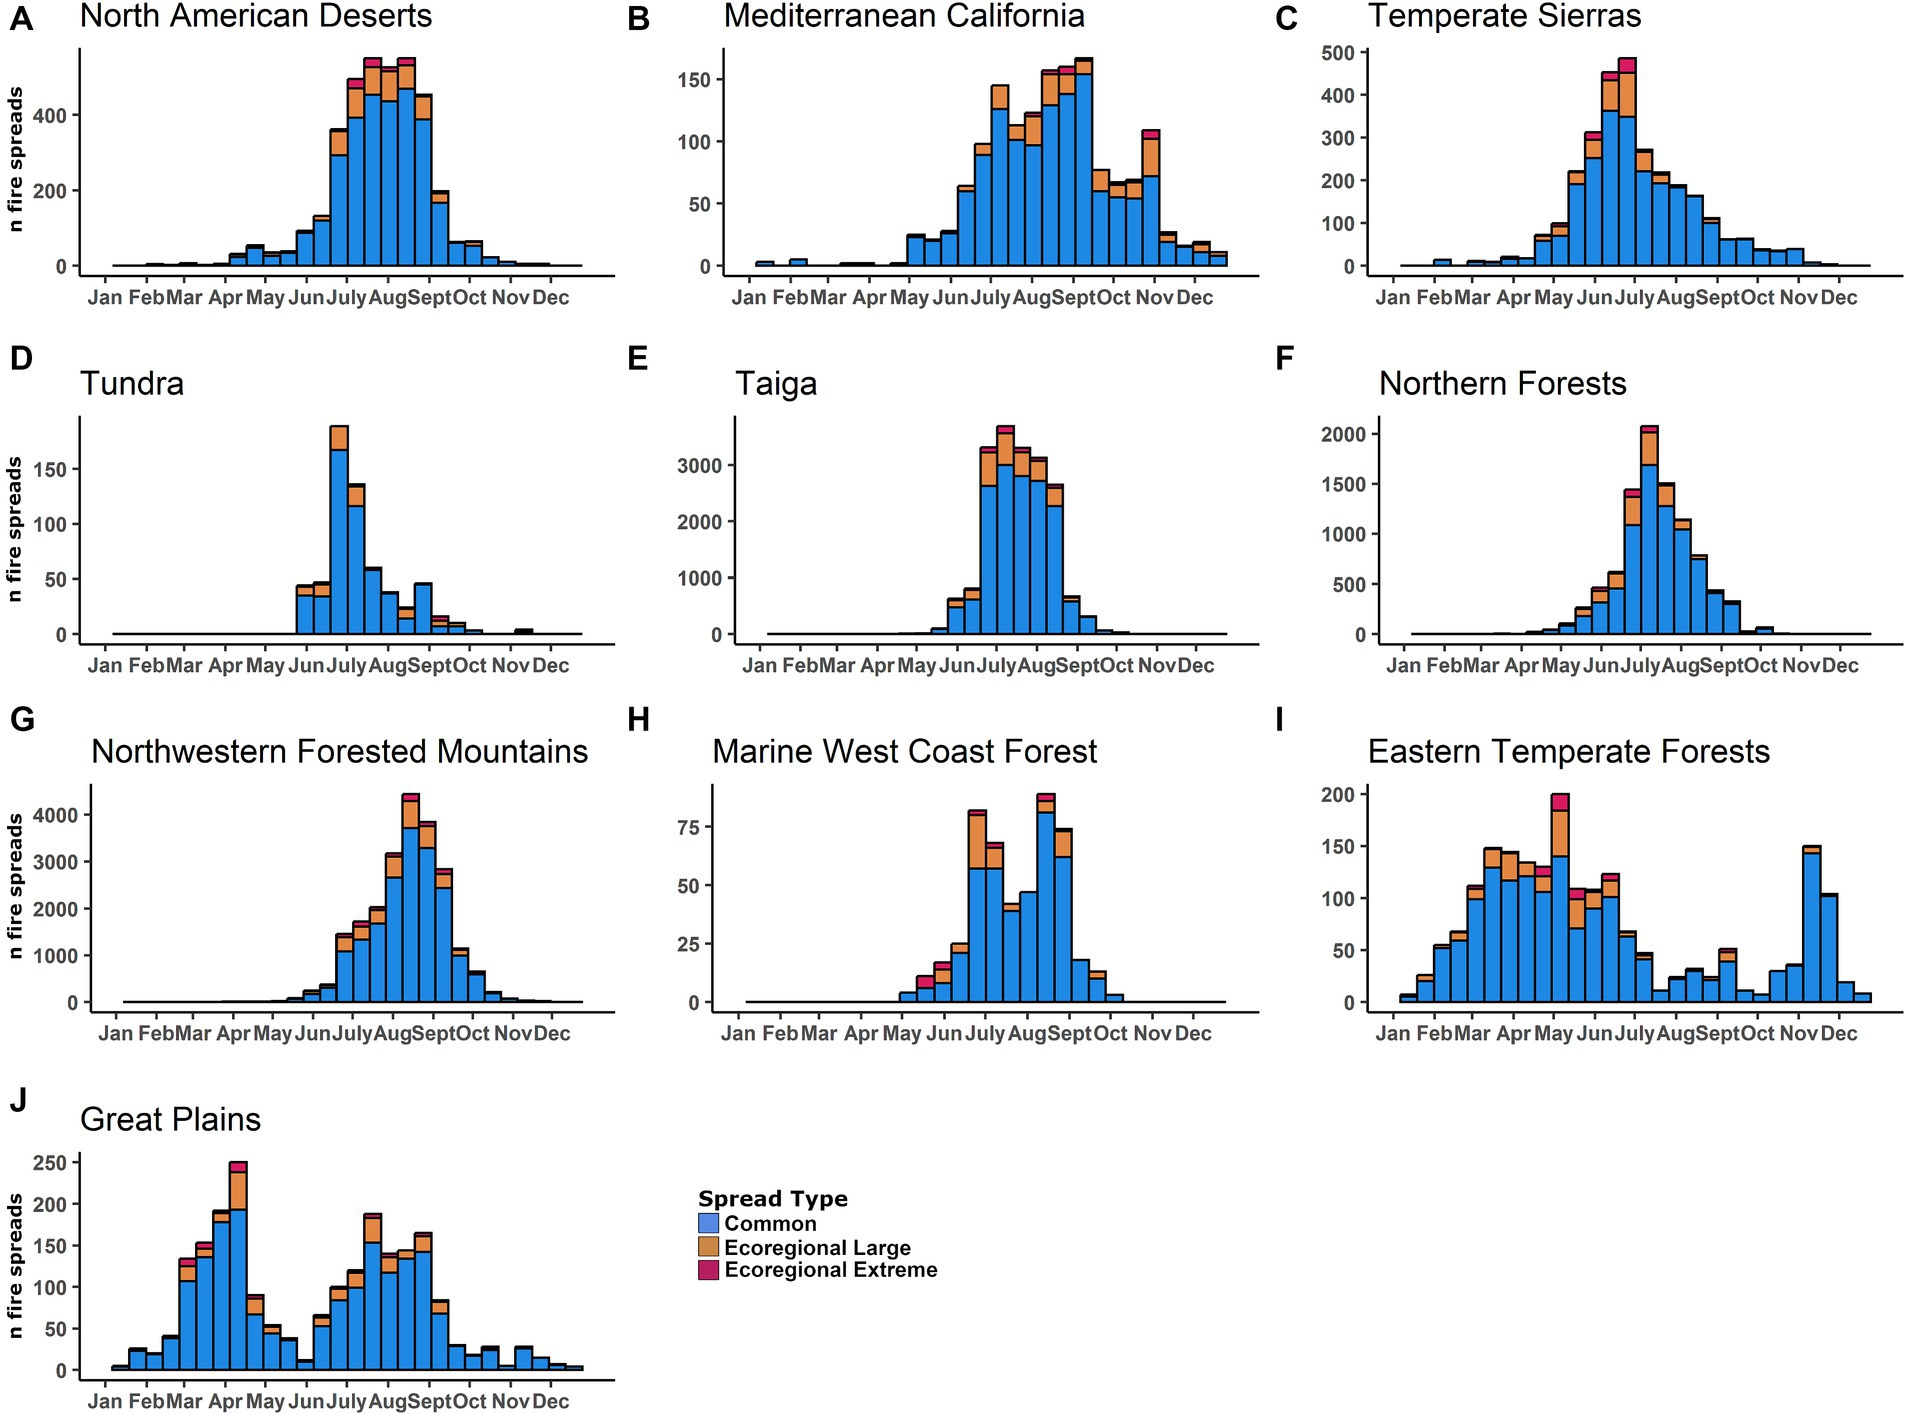
Figure 6. Seasonal distribution of fire spread events (day of burning) by ecoregion (panels A-J, region given above plotspace), using ecoregional definitions of large and extreme events. Fill color of stacked histogram bars indicates spread type, with blue fill for nonextreme spread days, orange fill for ecoregional large single-day events, and red fill for ecoregional extreme single-day events.
The seasonal timing of ecoregional and continental large and extreme single day spread events generally follow similar patterns (ecoregional = Figure 6; continental = Supplementary Figure S4). However, the average dates of large and extreme single-day events occur earlier than that of common events in several ecoregions with unimodal fire seasons, specifically Marine West Coast Forests, Temperate Sierras, and Northern Forests (Supplementary Figure S3B). Whereas, in Mediterranean California, large and extreme single-day events generally occur later than common events.
Trends in occurrence of extremes between 2002–2021
Annual occurrence of continental and ecoregional extreme single-day events has increased since 2002 in the Northwestern Forested Mountains (Supplementary Figure S5G: p = 0.025; Supplementary Figure S6G: p = 0.025). However, there are no temporal trends in the annual number of events for either tier of ecoregion-specific or continental single-day events in any other ecoregion, or across all of North America (Supplementary Figures S5, S6).
Linking daily fire spread to ecoregional climate
Ecoregional burned areas’ annual normal AET did not have a strong relationship with ecoregional daily fire spread metrics as average area burned per day, or as ecoregional thresholds of large or extreme single-day spread events (Figure 7A). Conversely, there were positive, but weak, relationships between ecoregional burned areas’ annual normal CWD and their fire spread metrics (Figure 7B). Specifically, all three fire spread metrics increased with ecoregions’ CWD annual normal, indicating greater daily spread in droughtier conditions, with the large exception of the Temperate Sierras.
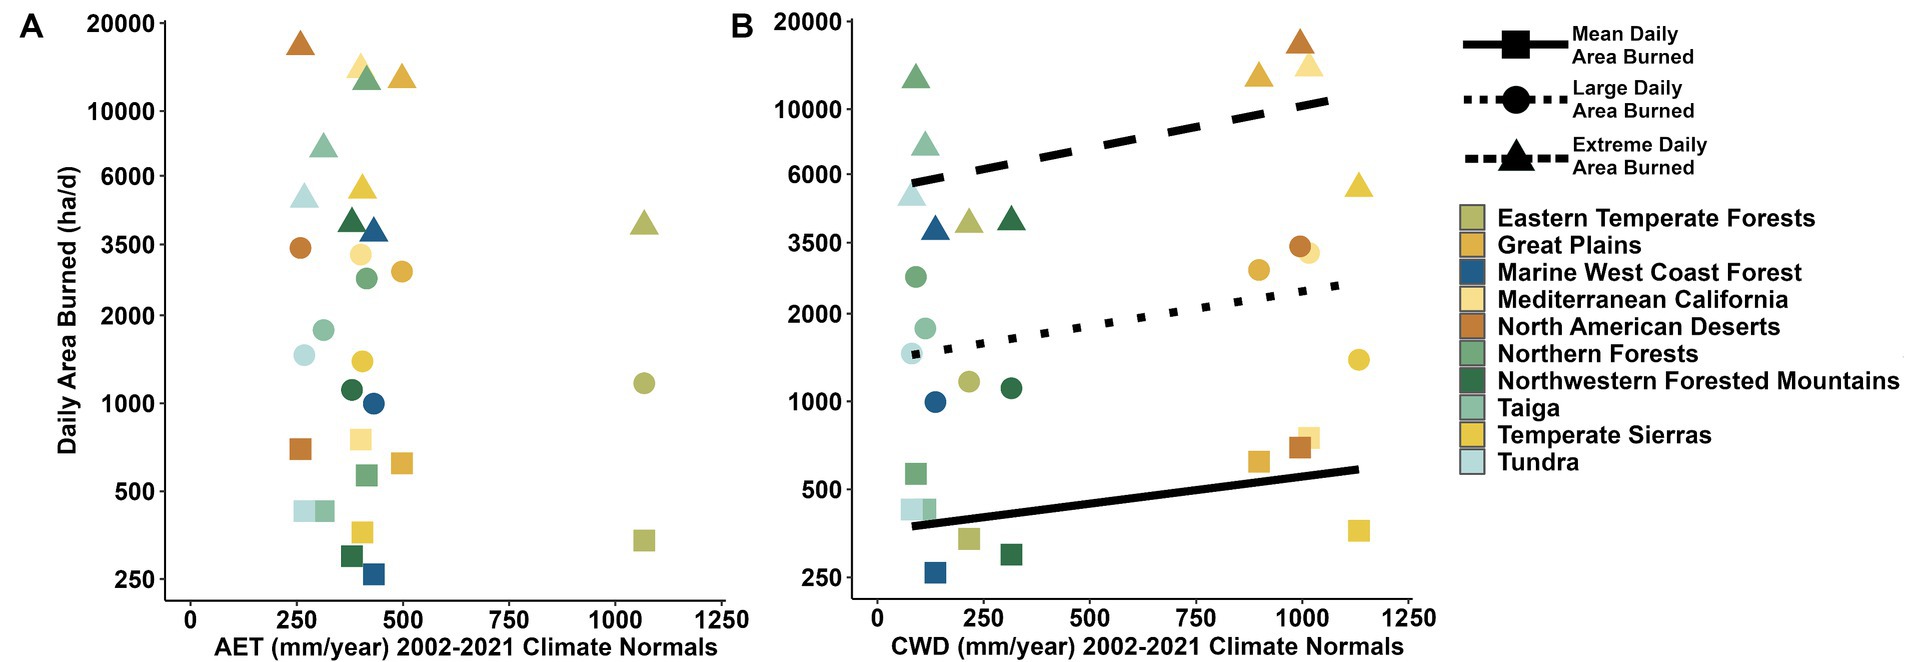
Figure 7. Three tiers of ecoregional fire spread regressed against burned areas’ average annual AET (A) and CWD (B). Point shape indicates fire spread type, with squares representing ecoregional mean daily area burned (linear models, AET: F (1,8) = 0.663, p = 0.439, adj R2 = 0.03; CWD: F (1,8) = 3.612, p = 0.094, adj R2 = 0.225), circles for large fire spread thresholds (linear models, AET: F (1,8) = 0.81, p = 0.394, adj R2 = 0.022; CWD: F (1,8) = 3.48, p = 0.099, adj R2 = 0.216), and triangles for extreme spread thresholds (linear models, AET: F (1,8) = 0.868, p = 0.379, adj R2 = 0.014; CWD: F (1,8) = 3.161, p = 0.113, adj R2 = 0.194). For CWD (B), the solid line represents the marginally significant trendline for mean daily area burned, dotted for large, and dashed for extreme.
There is substantial overlap among ecoregions’ annual normal climate conditions in a 2D space of AET and CWD (Figure 1B). The ecoregions with the highest daily area burned and some of the largest single-day spread events were Mediterranean California, North American Deserts, and the Great Plains (Figure 3A). These ecoregions are characterized by high CWD and low AET (Figures 1B, 7), and thus are highly arid places dominated by light, flashy fuel loads. Those ecoregions that were more moderate in their daily area burned and single-day spread event thresholds were the northern ecoregions of Tundra, Taiga, and Northern Forests. These ecoregions have low CWD but also relatively low AET. Finally, ecoregions with the lowest daily area burned and single-day event thresholds had the highest AET and generally low CWD and are predominantly forested ecoregions, such as Northwestern Forested Mountains, Marine West Coast Forest, and Eastern Temperate Forests.
Discussion
As human and ecological communities are increasingly threatened by fires burning under novel fuels and weather conditions (Parisien et al., 2020; Higuera et al., 2023), it is imperative to understand how patterns of daily fire spread vary across North America to provide context for these events and to monitor outcomes and trends. Here, we characterized daily fire progression and extreme single-day fire spread or blow-up events across northern North America and at the ecoregional scale. In doing so, we found substantial ecoregional variation in the typical size of large and extreme single-day blow-up events (i.e., daily area burned thresholds), the prevalence of these single-day events, and how they contribute to overall area burned. This ecoregional variation is likely a result of the spatially and temporally varying factors that control fire spread, such as fuel type, fuel amount and contiguity, and prevalence of fire-conducive weather (Krawchuk and Moritz, 2011; Parisien et al., 2014). We also show that fire duration and fire seasons vary across ecoregions, which is likely a reflection of the specific fire regime characteristics and their controlling factors (Archibald et al., 2013; Jain et al., 2017; Cattau et al., 2020).
Single-day extreme fire spread events are disproportionately shaping North American landscapes (Wang et al., 2021). For example, daily fire spread exceeding 1,704 ha/day (continental large single-day events) burned an average of 2.3 million ha/year in the US between 2002–2021, or 2.2x more area than US public lands treated through mechanical means and prescribed fire annually on average between fiscal years 2002–2021 (USDA Forest Service FACTS, 2023). Furthermore, the low proportions of single-day spread events classified as large or extreme under our ecoregional and continental definitions emphasize that relatively few spread days are responsible for substantial proportions of total area burned, with their cumulative area burned exceeding 80% (large & extreme single-day events) and 50% (extreme single-day events) of the total area burned in some ecoregions. These events have meaningful ecological outcomes. For example, Naficy et al. (2021) found that daily fire spread rates of spatially disjoint day of burning patches was one of the top predictors of fire severity and refugia probability in forests of the Pacific Northwest, with spread rates around the continental or Northwestern Forested Mountains large thresholds (~1,500–2000 ha day−1) associated with higher probabilities of high-severity burn and reduced refugia. Given that the extent and severity of their landscape impacts inherently occur within brief timeframes, extreme single-day events pose substantial challenges to land managers and considerable risks to the safety of affected communities and firefighters (Coen et al., 2020). Our analysis revealing their differential prevalence, extent, and outcomes among ecoregions points to the need to better understand the confluence of top-down and bottom-up factors that lead to extreme single and multi-day spread events, as well as their consequences.
Even though average fire spread rates are greater in some ecoregions (e.g., Great Plains, North American Deserts), it is important to contextualize this finding with the duration of fires (Figure 4). For example, those ecoregions with the highest daily spread rates also tend to experience lower duration fires, as previously reported by Andela et al. (2019), resulting in a smaller mean final fire size relative to other ecoregions with lower fire spread rates and longer duration fires. Longer duration fires in the Northern Forests, Northwestern Forested Mountains, and Taiga ecoregions are likely a result of larger woody fuels and thick surface fuels (e.g., pine duff, peat) that can retain burning embers even under variable weather conditions, which then contribute to fire spread when weather becomes more fire conducive (Krawchuk and Moritz, 2011; Prichard et al., 2017). Furthermore, these regions’ rugged terrain can complicate suppression efforts, and their lower population densities may lead to patterns of fire management that allow fires to continue burning when less infrastructure and fewer lives are at risk (Park et al., 2021).
Our analyses also indicate that longer fires are generally associated with greater maximum daily spread rates. This suggests that large or extreme spread days may be more likely to occur the longer a fire burns, or that their occurrence extends fire duration by rapidly expanding the area of active burning. Alternatively, the same top-down and/or bottom-up conditions that promote rapid fire spread may also be conducive to longer fire durations. Regardless of the directions of causality and mechanisms linking maximum daily spread rate and duration, these patterns may be expected to produce the exponential relationship between final fire size and duration in many ecoregions (Xi et al., 2019; Wang et al., 2020). Furthermore, even if relatively few fires achieve consecutive extreme spread days, longer duration fires inherently have greater opportunity for consecutive extreme behavior, particularly given the potential for greater daily spread with each additional day of burning. Such feedbacks between daily spread and fire duration raise the possibility of a self-reinforcing loop wherein extended fire duration amplifies the potential for large or extreme spread days, further extending the lifespan of a fire and likelihood of subsequent extreme behavior, drastically expanding the final fire size.
In addition to differential spread and fire duration, fire seasons and seasonality of extreme single-day events also varied among ecoregions. Although some ecoregions have more confined fire seasons (e.g., Tundra, Taiga, Northern Forests, Northwestern Forested Mountains, Marine West Coast Forest), fire occurs nearly year-round in some ecoregions (e.g., Great Plains, Eastern Temperate Forests), with extreme single-day events typically distributed across nine of the twelve months of the year. Interestingly, a bimodal fire season was observed in the Mediterranean California, Marine West Coast Forests, Eastern Temperate Forests, and Great Plains ecoregions, a phenomenon also reported by Benali et al. (2017) in the central and southwest regions of the continent. In some locations like Mediterranean California, the November peak is likely associated with Santa Ana winds (Westerling et al., 2004). Santa Ana winds are also likely responsible for the later average seasonal timing of extreme single-day events in the region. Elsewhere, particularly in broadleaf forests, the phenological stage of vegetation may influence fire season timing (Parisien et al., 2023) or that of extreme single-day spread. For example, in some ecoregions with bimodal fire seasons such as the Eastern Temperate Forests, Great Plains, and Marine West Coast Forests, early season fires and extreme single-day events may occur before vegetation green-up; then fire activity diminishes until late summer and early fall when fuels again become sufficiently dry to carry fire. The abrupt truncation of the fire season in the Northern Forests, Taiga, and Tundra ecoregions is likely due to rapid onset of weather that is prohibitive to fire spread (i.e., snow) compared to more southerly ecoregions. Similar to our spread rate and fire duration findings, ecoregional differences in vegetation, fuel loads, and climate likely contribute to the observed variability in fire season and seasonality of extreme single-day events.
However, there are several key caveats to interpreting our fire seasonality results. First, our analyses only considered wildfires ≥400 ha; the inclusion of spread days from smaller wildfires, as well as those from prescribed and cultural burning practices would likely result in greater fire season heterogeneity and pyrodiversity. Second, we used relatively broad EPA Level 1 Ecoregions to group fires across the continent. This choice of spatial grouping unit could influence our results, with finer-scale spatial groupings likely to reveal greater heterogeneity in regional fire regimes. Because of this finer-scale heterogeneity, grouping fires across broader spatial scales may also contribute to some of the bimodal fire seasons we observed. For example, we merged the Eastern Temperate Forests ecoregion with the relatively small but pyroregionally unique Tropical Wet Forests region, which comprises southern Florida. Fires may occur throughout most of the year in Florida, in contrast to the Appalachians where fire generally occurs in the fall when precipitation and relative humidity are low following the seasonal accumulation of fine fuels in the form of falling leaves. Thus, ecoregions do not necessarily coincide with pyroregions (Galizia et al., 2021), and pyroregional diversity within larger ecoregions creates further nuance in interpreting the patterns of fire seasonality presented here.
Although understanding ecoregional variation in the seasonal timing of large and extreme single-day events throughout a year is valuable for management considerations, it is also crucial to examine how the prevalence of these events has changed over time, particularly given expectations that they will occur more frequently in a warmer and drier future (Wang et al., 2015; Kirchmeier-Young et al., 2019; Halofsky et al., 2020). At the time of our analysis, annual frequencies have not increased since 2002 in most ecoregions or across the continent; however, extreme events are occurring more frequently in the Northwestern Forested Mountains (Supplementary Figure S5). Notably, the Northwestern Forested Mountains are the most fire-prone ecoregion in our dataset in terms of having the greatest number of fires larger than 400 ha and the most fire spread days (e.g., Tables 1, 2). Therefore, although the occurrence of extremes is broadly projected to increase due to climate change, our analysis of a short timeseries demonstrates that outlier extreme events are already occurring more frequently in the most fire-prone ecoregion of North America despite its comparatively low average daily spread rate. However, it is important to recognize that our ability to detect temporal trends in the frequency of extreme single-day events may be limited by the relatively short duration of the time period over which we are able to interpolate daily fire progression.
Anticipating extreme single-day events is critical yet challenging given the wide range of conditions under which fire occurs across the continent (Figure 1B; Parisien et al., 2016). As such, understanding ecoregional prevalence and extent of extreme single-day events will be important to improve resource deployment and community protection, particularly given the substantial differences among ecoregional extreme thresholds (e.g., 3,829 ha to 16,626 ha). This vast difference in extreme thresholds coupled with the variability in human populations and development patterns across the continent result in differential risk to communities and infrastructure (Nagy et al., 2018; Park et al., 2021). For example, in Mediterranean California, extreme single-day events exceeding 13,885 ha/d are particularly concerning given the high human population density and geography of the area. Understanding this risk can help identify communities that should be preemptively evacuated, and strategically plan points of engagement that may be more effective given the likelihood of the large single-day spread events (Thompson et al., 2018). In contrast, the exceptionally high extreme threshold in the North American Deserts (16,626 ha/day) may potentially be mitigated by growing the invasive species management programs within the region and by creating effective fuel breaks. However, response options will inevitably vary elsewhere, such as the Northern Forests ecoregion that is characterized by high fuel loads, low human population density, and extreme event sizes exceeding 12,634 ha/day with the largest mean fire size of any ecoregion. While population density is fairly low, this ecoregion has many rural, remote, and dispersed communities that often include First Nations Indigenous people who are disproportionately impacted by these extreme events (Davies et al., 2018; McGee, 2021). Furthermore, evacuations are complicated by having few or indirect roads to these remote communities (Tepley et al., 2022). Human impacts due to fire duration are also important to consider for those communities that are experiencing long evacuations (Stidham et al., 2011) and the strain on fire fighters who have extended deployments on these long-duration incidents (Vincent et al., 2016; Jeklin et al., 2020). Ecoregional links to climate and ecoregional fire spread rates provide useful information for tailoring management efforts to specific regions and for anticipating future fires and extreme single-day events.
Ecoregional variability of fire spread rates (mean daily area burned, large and extreme single-day events) suggests that broad-scale vegetation and climatic factors captured in ecoregional delineations have bottom-up and top-down effects on fire spread rates. For example, the ecoregions with the highest average daily spread rates and most large and extreme single-day events, calculated either by frequency or percent of area burned, were the Great Plains and Mediterranean California, which are generally characterized as drier ecoregions largely comprised of grasslands and shrubland fuel types which tend to drive rapid fire spread (Cheney et al., 1993; Cruz et al., 2022). The high daily fire spread rates in the North American Deserts ecoregion could be linked to invasive annual grasses that promote rapid fire spread [e.g., Bromus tectorum (cheatgrass); Balch et al., 2013]. Conversely, ecoregions with lower daily spread rates including the Marine West Coast Forests, Eastern Temperate Forests, and Northwestern Forested Mountains generally have higher biomass and lower CWD, though the Northern Forests ecoregion does not follow this pattern. Greater average spread in the Northern Forests despite low CWD may be a function of bottom-up factors, such as landscapes of highly contiguous fuels.
Fire spread rates (daily, large, extreme) generally increase with CWD annual climate normals. The Temperate Sierras ecoregion may deviate from this overall relationship between fire spread and climate due to specific landscape patterns unique to this region. Specifically, fires in isolated and relatively small mountain ranges (i.e., sky islands) are likely limited in size and spread rates by the lack of large, contiguous areas of fuel (Wardle et al., 1997). Nonetheless, this general relationship between fire spread and CWD broadly agrees with other studies showing that metrics of fire activity (fire frequency, area burned, fire severity) can vary along climatic gradients (Krawchuk and Moritz, 2011; Parks et al., 2014). However, the lack of a strong relationship is not completely unexpected, as Archibald et al. (2013) demonstrated a weak relationship between fire regime and climate. For example, the lack of correlation between fire spread rates and AET in our dataset may be attributed to the relatively low variability among ecoregions’ 30-year AET annual climate normals. Eastern Temperate Forests are a clear outlier with high AET, but they also had the lowest mean fire size and a low-moderate number of spread events. Consequently, annual normal AET and CWD may help set the stage for fire by influencing vegetation distributions and fuel conditions, but daily spread may be more strongly influenced by other finer-scale vegetation or fire weather drivers (Potter and McEvoy, 2021; Jain et al., 2022) or internal self-reinforcing weather dynamics (i.e., winds) that drive extreme blow-up behavior (Coen et al., 2018).
Conclusion
Here, we define ‘extreme’ based entirely on daily fire spread area. We do not account for other fire characteristics that may be considered extreme in other contexts, such as community impacts (evacuations, smoke, loss of life and property), firefighting resources needed, ecological consequences of fire (fire severity, carbon emissions), or physical and hydrological impacts (debris flows, erosion, landslides, flooding). As such, extreme in this context may not always have negative impacts on human or natural communities, and conversely many events not labeled as “extreme” here may have wide-ranging human and ecological impacts. Consequently, more research is needed to understand how large single-day events correspond to community, ecological, physical, and hydrologic impacts.
Extreme single-day spread clearly poses a threat to communities in fire-prone regions of North America, as experienced by communities such as Paradise, California (2018), Detroit, Oregon (2020), Fort McMurray, Alberta (2016), among many others. As we continue to navigate novel climate conditions that are resulting in more wildfires and shifting fire regimes, understanding extreme single-day fire spread events is critical for planning and conservation of our landscapes and communities. Our approach of studying daily fire progression complements past geographic characterizations of wildfire regimes, which primarily relied on ignition points, dates, and final fire sizes. By providing detailed spatio-temporal fire spread information, mapping daily fire progression can facilitate the fine-scale analyses that are needed to identify the top-down and bottom-up mechanisms that create blow-ups and their consequences to ecosystems and society.
Data availability statement
The datasets presented in this study can be found in online repositories. The names of the repository/repositories and accession number(s) can be found at: https://doi.org/10.5061/dryad.2jm63xswg.
Author contributions
JB: Conceptualization, Data curation, Formal analysis, Investigation, Methodology, Project administration, Visualization, Writing – original draft, Writing – review & editing. JC: Conceptualization, Funding acquisition, Project administration, Supervision, Writing – original draft, Writing – review & editing. MK: Funding acquisition, Writing – review & editing. CN: Funding acquisition, Writing – review & editing. M-AP: Funding acquisition, Writing – review & editing. SP: Conceptualization, Funding acquisition, Investigation, Writing – original draft, Writing – review & editing. CS-R: Conceptualization, Funding acquisition, Writing – original draft, Writing – review & editing. EW: Conceptualization, Funding acquisition, Writing – review & editing.
Funding
The author(s) declare financial support was received for the research, authorship, and/or publication of this article. Research funding was provided by the USGS Southwest Climate Adaptation Science Center (SW CASC) and the USDA Forest Service Western Wildland Environmental Threat Assessment Center (WWETAC).
Conflict of interest
The authors declare that the research was conducted in the absence of any commercial or financial relationships that could be construed as a potential conflict of interest.
Publisher’s note
All claims expressed in this article are solely those of the authors and do not necessarily represent those of their affiliated organizations, or those of the publisher, the editors and the reviewers. Any product that may be evaluated in this article, or claim that may be made by its manufacturer, is not guaranteed or endorsed by the publisher.
Supplementary material
The Supplementary material for this article can be found online at: https://www.frontiersin.org/articles/10.3389/ffgc.2024.1355361/full#supplementary-material
References
Abatzoglou, J. T., Dobrowski, S. Z., Parks, S. A., and Hegewisch, K. C. (2018). TerraClimate, a high-resolution global dataset of monthly climate and climatic water balance from 1958–2015. Sci. Data 5, 1–12. doi: 10.1038/sdata.2017.191
Andela, N., Morton, D. C., Giglio, L., Paugam, R., Chen, Y., Hantson, S., et al. (2019). The global fire atlas of individual fire size, duration, speed and direction. Earth Syst. Sci. Data 11, 529–552. doi: 10.5194/essd-11-529-2019
Archibald, S., Lehmann, C. E., Gómez-Dans, J. L., and Bradstock, R. A. (2013). Defining pyromes and global syndromes of fire regimes. Proc. Natl. Acad. Sci. 110, 6442–6447. doi: 10.1073/pnas.1211466110
Balch, J. K., Bradley, B. A., D’Antonio, C. M., and Gómez-Dans, J. (2013). Introduced annual grass increases regional fire activity across the arid western USA (1980-2009). Glob. Chang. Biol. 19, 173–183. doi: 10.1111/gcb.12046
Benali, A., Mota, B., Carvalhais, N., Oom, D., Miller, L. M., Campagnolo, M. L., et al. (2017). Bimodal fire regimes unveil a global-scale anthropogenic fingerprint. Glob. Ecol. Biogeogr. 26, 799–811. doi: 10.1111/geb.12586
Bowman, D. M., Williamson, G. J., Abatzoglou, J. T., Kolden, C. A., Cochrane, M. A., and Smith, A. M. (2017). Human exposure and sensitivity to globally extreme wildfire events. Nat. Ecol. Evol. 1:0058. doi: 10.1038/s41559-016-0058
Castellnou, M., Bachfischer, M., Miralles, M., Ruiz, B., Stoof, C. R., and Vilà-Guerau de Arellano, J. (2022). Pyroconvection classification based on atmospheric vertical profiling correlation with extreme fire spread observations. J. Geophys. Res. Atmos. 127:e2022JD036920. doi: 10.1029/2022JD036920
Cattau, M. E., Wessman, C., Mahood, A., and Balch, J. K. (2020). Anthropogenic and lightning-started fires are becoming larger and more frequent over a longer season length in the USA. Glob. Ecol. Biogeogr. 29, 668–681. doi: 10.1111/geb.13058
Cheney, N., Gould, J., and Catchpole, W. (1993). The influence of fuel, weather and fire shape variables on fire-spread in grasslands. Int. J. Wildland Fire 3, 31–44. doi: 10.1071/WF9930031
Coen, J. L., Schroeder, W., Conway, S., and Tarnay, L. (2020). Computational modeling of extreme wildland fire events: a synthesis of scientific understanding with applications to forecasting, land management, and firefighter safety. J. Comput. Sci. 45:101152. doi: 10.1016/j.jocs.2020.101152
Coen, J. L., Stavros, E. N., and Fites-Kaufman, J. A. (2018). Deconstructing the king megafire. Ecol. Appl. 28, 1565–1580. doi: 10.1002/eap.1752
Commission for Environmental Cooperation (2006). Ecological regions of North America: toward a common perspective. Montréal, Québec: Commision for Environmental Cooperation.
Coop, J. D., Parks, S. A., Stevens-Rumann, C. S., Ritter, S. M., and Hoffman, C. M. (2022). Extreme fire spread events and area burned under recent and future climate in the western USA. Glob. Ecol. Biogeogr. 31, 1949–1959. doi: 10.1111/geb.13496
Cova, G., Kane, V. R., Prichard, S., North, M., and Cansler, C. A. (2023). The outsized role of California’s largest wildfires in changing forest burn patterns and coarsening ecosystem scale. For. Ecol. Manag. 528:120620. doi: 10.1016/j.foreco.2022.120620
Cruz, M. G., Alexander, M. E., and Fernandes, P. M. (2022). Evidence for lack of a fuel effect on forest and shrubland fire rates of spread under elevated fire danger conditions: implications for modelling and management. Int. J. Wildland Fire 31, 471–479. doi: 10.1071/WF21171
Darwish Ahmad, A., Akafuah, N. K., Forthofer, J., Fuchihata, M., Hirasawa, T., Kuwana, K., et al. (2023). Large-scale fire whirl and forest fire disasters: awareness, implications, and the need for developing preventative methods. Front. Mech. Eng. 9:1045542. doi: 10.3389/fmech.2023.1045542
Davies, I. P., Haugo, R. D., Robertson, J. C., and Levin, P. S. (2018). The unequal vulnerability of communities of color to wildfire. PLoS One 13:e0205825.
Downing, W. M., Meigs, G. W., Gregory, M. J., and Krawchuk, M. A. (2021). Where and why do conifer forests persist in refugia through multiple fire events? Glob. Chang. Biol. 27, 3642–3656. doi: 10.1111/gcb.15655
Duane, A., Castellnou, M., and Brotons, L. (2021). Towards a comprehensive look at global drivers of novel extreme wildfire events. Clim. Chang. 165, 1–21. doi: 10.1007/s10584-021-03066-4
Fusco, E. J., Finn, J. T., Balch, J. K., Nagy, R. C., and Bradley, B. A. (2019). Invasive grasses increase fire occurrence and frequency across US ecoregions. Proc. Natl. Acad. Sci. 116, 23594–23599. doi: 10.1073/pnas.1908253116
Galizia, L. F., Curt, T., Barbero, R., and Rodrigues, M. (2021). Understanding fire regimes in Europe. Int. J. Wildland Fire 31, 56–66. doi: 10.1071/WF21081
Hall, R., Skakun, R., Metsaranta, J., Landry, R., Fraser, R., Raymond, D., et al. (2020). Generating annual estimates of forest fire disturbance in Canada: the National Burned Area Composite. Int. J. Wildland Fire 29, 878–891. doi: 10.1071/WF19201
Halofsky, J. E., Peterson, D. L., and Harvey, B. J. (2020). Changing wildfire, changing forests: the effects of climate change on fire regimes and vegetation in the Pacific northwest, USA. Fire Ecol. 16, 1–26. doi: 10.1186/s42408-019-0062-8
Hantson, S., Pueyo, S., and Chuvieco, E. (2015). Global fire size distribution is driven by human impact and climate. Global Ecology and Biogeography 24:77–86.
Hart, S., and Preston, D. (2020). Fire weather drives daily area burned and observations of fire behavior in mountain pine beetle affected landscapes. Environ. Res. Lett. 15:054007. doi: 10.1088/1748-9326/ab7953
Higuera, P. E., Cook, M. C., Balch, J. K., Stavros, E. N., Mahood, A. L., St, L. A., et al. (2023). Shifting social-ecological fire regimes explain increasing structure loss from Western wildfires. PNAS Nexus 2:pgad005. doi: 10.1093/pnasnexus/pgad005
Holsinger, L., Parks, S. A., and Miller, C. (2016). Weather, fuels, and topography impede wildland fire spread in western US landscapes. For. Ecol. Manag. 380, 59–69. doi: 10.1016/j.foreco.2016.08.035
Hossain, M. L., and Li, J. (2021). NDVI-based vegetation dynamics and its resistance and resilience to different intensities of climatic events. Glob. Ecol. Conserv. 30:e01768. doi: 10.1016/j.gecco.2021.e01768
Jain, P., Castellanos-Acuna, D., Coogan, S. C., Abatzoglou, J. T., and Flannigan, M. D. (2022). Observed increases in extreme fire weather driven by atmospheric humidity and temperature. Nat. Clim. Chang. 12, 63–70. doi: 10.1038/s41558-021-01224-1
Jain, P., Wang, X., and Flannigan, M. D. (2017). Trend analysis of fire season length and extreme fire weather in North America between 1979 and 2015. Int. J. Wildland Fire 26, 1009–1020. doi: 10.1071/WF17008
Jeklin, A. T., Davies, H. W., Bredin, S. S., Hives, B. A., Meanwell, L. E., Perrotta, A. S., et al. (2020). Fatigue and sleep patterns among Canadian wildland firefighters during a 17-day fire line deployment. J. Occup. Environ. Hyg. 17, 364–371. doi: 10.1080/15459624.2020.1759809
Kirchmeier-Young, M., Gillett, N., Zwiers, F., Cannon, A., and Anslow, F. (2019). Attribution of the influence of human-induced climate change on an extreme fire season. Earth's Future 7, 2–10. doi: 10.1029/2018EF001050
Krawchuk, M. A., and Moritz, M. A. (2011). Constraints on global fire activity vary across a resource gradient. Ecology 92, 121–132. doi: 10.1890/09-1843.1
Loarie, S. R., Duffy, P. B., Hamilton, H., Asner, G. P., Field, C. B., and Ackerly, D. D. (2009). The velocity of climate change. Nature 462, 1052–1055. doi: 10.1038/nature08649
Lutz, J. A., Van Wagtendonk, J. W., and Franklin, J. F. (2010). Climatic water deficit, tree species ranges, and climate change in Yosemite National Park. J. Biogeogr. 37, 936–950. doi: 10.1111/j.1365-2699.2009.02268.x
McGee, T. K. (2021). Evacuating first nations during wildfires in Canada. Fire Safety Journal 120:103120.
Meigs, G. W., Dunn, C. J., Parks, S. A., and Krawchuk, M. A. (2020). Influence of topography and fuels on fire refugia probability under varying fire weather conditions in forests of the Pacific northwest, USA. Can. J. For. Res. 50, 636–647. doi: 10.1139/cjfr-2019-0406
Naficy, C. E., Meigs, G. W., Gregory, M. J., Davis, R., Bell, D. M., Dugger, K., et al. (2021). Fire refugia in old-growth forests—Final report to the USGS northwest climate adaptation center. Available at: https://firerefugia.forestry.oregonstate.edu/export/fire_refugia_casc_final_report_fsp_approved.pdf
Nagy, R. C., Fusco, E., Bradley, B., Abatzoglou, J. T., and Balch, J. (2018). Human-related ignitions increase the number of large wildfires across US ecoregions. Fire 1:4. doi: 10.3390/fire1010004
Parisien, M. A., Barber, Q. E., Flannigan, M. D., and Jain, P. (2023). Broadleaf tree phenology and springtime wildfire occurrence in boreal Canada. Glob. Chang. Biol. 29, 6106–6119. doi: 10.1111/gcb.16820
Parisien, M.-A., Barber, Q. E., Hirsch, K. G., Stockdale, C. A., Erni, S., Wang, X., et al. (2020). Fire deficit increases wildfire risk for many communities in the Canadian boreal forest. Nat. Commun. 11:2121. doi: 10.1038/s41467-020-15961-y
Parisien, M.-A., Miller, C., Parks, S. A., DeLancey, E. R., Robinne, F.-N., and Flannigan, M. D. (2016). The spatially varying influence of humans on fire probability in North America. Environ. Res. Lett. 11:075005. doi: 10.1088/1748-9326/11/7/075005
Parisien, M.-A., Parks, S. A., Krawchuk, M. A., Little, J. M., Flannigan, M. D., Gowman, L. M., et al. (2014). An analysis of controls on fire activity in boreal Canada: comparing models built with different temporal resolutions. Ecol. Appl. 24, 1341–1356. doi: 10.1890/13-1477.1
Park, I. W., Mann, M. L., Flint, L. E., Flint, A. L., and Moritz, M. (2021). Relationships of climate, human activity, and fire history to spatiotemporal variation in annual fire probability across California. PLoS One 16:e0254723. doi: 10.1371/journal.pone.0254723
Parks, S. A. (2014). Mapping day-of-burning with coarse-resolution satellite fire-detection data. Int. J. Wildland Fire 23, 215–223. doi: 10.1071/WF13138
Parks, S. A., Parisien, M.-A., Miller, C., and Dobrowski, S. Z. (2014). Fire activity and severity in the western US vary along proxy gradients representing fuel amount and fuel moisture. PLoS One 9:e99699. doi: 10.1371/journal.pone.0099699
Pausas, J. G. (2022). Pyrogeography across the western Palaearctic: A diversity of fire regimes. Global Ecology and Biogeography 31:1923–1932.
Pohlert, T. (2023). Trend: non-parametric trend tests and change-point detection. CC BY-ND, 4, 1-18.
Potter, B. E., and McEvoy, D. (2021). Weather factors associated with extremely large fires and fire growth days. Earth Interact. 25, 160–176. doi: 10.1175/EI-D-21-0008.1
Prichard, S. J., Stevens-Rumann, C. S., and Hessburg, P. F. (2017). Tamm review: shifting global fire regimes: lessons from reburns and research needs. For. Ecol. Manag. 396, 217–233. doi: 10.1016/j.foreco.2017.03.035
R Core Team (2022). R: a language and environment for statistical computing. R Foundation for Statistical Computing, Vienna.
Rosenzweig, M. L. (1968). Net primary productivity of terrestrial communities: prediction from climatological data. Am. Nat. 102, 67–74. doi: 10.1086/282523
Stephenson, N. (1998). Actual evapotranspiration and deficit: biologically meaningful correlates of vegetation distribution across spatial scales. J. Biogeogr. 25, 855–870. doi: 10.1046/j.1365-2699.1998.00233.x
Stidham, M., Toman, E., McCaffrey, S., and Shindler, B. (2011). Improving an inherently stressful situation: the role of communication during wildfire evacuations. Pages 96-103 in proceedings of the second conference on the human dimensions of wildland fire. Gen. Tech. Rep. NRS-P-84.
Syphard, A. D., and Keeley, J. E. (2020). Mapping fire regime ecoregions in California. International Journal of Wildland Fire 29:595–601.
Tedim, F., Leone, V., Amraoui, M., and Bouillon, C., Coughlan, M. R., Delogu, G. M., et al. (2018). Defining extreme wildfire events: Difficulties, challenges, and impacts. Fire 1:9.
Tedim, F., McCaffrey, S., Leone, V., Delogu, G. M., Castelnou, M., McGee, T. K., et al. (2020). “What can we do differently about the extreme wildfire problem: an overview” in Extreme Wildfire Events and Disasters. eds. F. Tedim, V. Leone and T. K. McGee 233–263.
Tepley, A. J., Parisien, M. A., Wang, X., Oliver, J. A., and Flannigan, M. D. (2022). Wildfire evacuation patterns and syndromes across Canada's forested regions. Ecosphere 13:e4255. doi: 10.1002/ecs2.4255
Thompson, M. P., MacGregor, D. G., Dunn, C. J., Calkin, D. E., and Phipps, J. (2018). Rethinking the wildland fire management system. J. For. 116, 382–390. doi: 10.1093/jofore/fvy020
USDA Forest Service FACTS. (2023). Hazardous Fuel Treatment Reduction: Polygon (Feature Layer) [Dataset]. In USDA Forest Service FACTS (Version 6.2 (Build 9200)). USDA U.S. Forest Service. Available at: https://data-usfs.hub.arcgis.com/datasets/f89c9d566f204df899835b2737621458_15/about
Veraverbeke, S., Sedano, F., Hook, S. J., Randerson, J. T., Jin, Y., and Rogers, B. M. (2014). Mapping the daily progression of large wildland fires using MODIS active fire data. International Journal of Wildland Fire 23:655–667.
Vincent, G. E., Aisbett, B., Hall, S. J., and Ferguson, S. A. (2016). Fighting fire and fatigue: sleep quantity and quality during multi-day wildfire suppression. Ergonomics 59, 932–940. doi: 10.1080/00140139.2015.1105389
Wang, X., Oliver, J., Swystun, T., Hanes, C. C., Erni, S., and Flannigan, M. D. (2023). Critical fire weather conditions during active fire spread days in Canada. Science of The Total Environment 869:161831.
Wang, X., Parisien, M.-A., Taylor, S. W., Candau, J.-N., Stralberg, D., Marshall, G. A., et al. (2017). Projected changes in daily fire spread across Canada over the next century. Environ. Res. Lett. 12:025005. doi: 10.1088/1748-9326/aa5835
Wang, X., Studens, K., Parisien, M.-A., Taylor, S. W., Candau, J.-N., Boulanger, Y., et al. (2020). Projected changes in fire size from daily spread potential in Canada over the 21st century. Environ. Res. Lett. 15:104048. doi: 10.1088/1748-9326/aba101
Wang, X., Swystun, T., Oliver, J., and Flannigan, M. D. (2021). One extreme fire weather event determines the extent and frequency of wildland fires. Environ. Res. Lett. 16:114031. doi: 10.1088/1748-9326/ac2f64
Wang, X., Thompson, D. K., Marshall, G. A., Tymstra, C., Carr, R., and Flannigan, M. D. (2015). Increasing frequency of extreme fire weather in Canada with climate change. Clim. Chang. 130, 573–586. doi: 10.1007/s10584-015-1375-5
Wardle, D. A., Zackrisson, O., Hornberg, G., and Gallet, C. (1997). The influence of island area on ecosystem properties. Science 277:1296–1299.
Westerling, A. L., Cayan, D. R., Brown, T. J., Hall, B. L., and Riddle, L. G. (2004). Climate, Santa Ana winds and autumn wildfires in southern California. EOS Trans. Am. Geophys. Union 85, 289–296. doi: 10.1029/2004EO310001
Keywords: wildfire, extreme events, daily fire progression, fire spread, fire growth, fire duration, fire seasonality
Citation: Balik JA, Coop JD, Krawchuk MA, Naficy CE, Parisien M-A, Parks SA, Stevens-Rumann CS and Whitman E (2024) Biogeographic patterns of daily wildfire spread and extremes across North America. Front. For. Glob. Change. 7:1355361. doi: 10.3389/ffgc.2024.1355361
Edited by:
Marcos Rodrigues, University of Zaragoza, SpainReviewed by:
Renaud Barbero, Institut National de recherche pour l’agriculture, l’alimentation et l’environnement (INRAE), FranceAdrián Jiménez Ruano, Independent Researcher, León, Spain
Copyright © 2024 Balik, Coop, Krawchuk, Naficy, Parisien, Parks, Stevens-Rumann and Whitman. This is an open-access article distributed under the terms of the Creative Commons Attribution License (CC BY). The use, distribution or reproduction in other forums is permitted, provided the original author(s) and the copyright owner(s) are credited and that the original publication in this journal is cited, in accordance with accepted academic practice. No use, distribution or reproduction is permitted which does not comply with these terms.
*Correspondence: Jared A. Balik, QmFsaWtqM0BnbWFpbC5jb20=