 Dong Dai
 Sen Wang
 Jiaze Li3†
 Yu Zhao
- 1Department of Nuclear Medicine, Tianjin Cancer Hospital Airport Hospital, National Clinical Research Center for Cancer, Institute of Radiation Medicine, Chinese Academy of Medical Sciences and Peking Union Medical College, Tianjin, China
- 2Department of Molecular Imaging and Nuclear Medicine, Tianjin Medical University Cancer Institute and Hospital, National Clinical Research Center for Cancer, Key Laboratory of Cancer Prevention and Therapy, Tianjin’s Clinical Research Center for China, Tianjin, China
- 3Tianjin Key Laboratory of Radiation Medicine and Molecular Nuclear Medicine, Institute of Radiation Medicine, Chinese Academy of Medical Sciences and Peking Union Medical College, Tianjin, China
Background: Pancreatic cancer is a highly lethal disease with increasing incidence worldwide. Despite surgical resection being the main curative option, only a small percentage of patients are eligible for surgery. Radiotherapy, often combined with chemotherapy, remains a critical treatment, especially for locally advanced cases. However, pancreatic cancer’s aggressiveness and partial radio resistance lead to frequent local recurrence. Understanding the mechanisms of radiotherapy resistance is crucial to improving patient outcomes.
Methods: Pancreatic cancer related gene microarray data were downloaded from GEO database to analyze differentially expressed genes before and after radiotherapy using GEO2R online tool. The obtained differentially expressed genes were enriched by GO and KEGG to reveal their biological functions. Key genes were screened by univariate and multivariate Cox regression analysis, and a risk scoring model was constructed, and patients were divided into high-risk group and low-risk group. Subsequently, Kaplan-Meier survival analysis was used to compare the survival differences between the two groups of patients, further analyze the differential genes of the two groups of patients, and evaluate their sensitivity to different drugs.
Results: Our model identified 10 genes associated with overall survival (OS) in pancreatic cancer. Based on risk scores, patients were categorized into high- and low-risk groups, with significantly different survival outcomes and immune profile characteristics. High-risk patients showed increased expression of pro-inflammatory immune markers and increased sensitivity to specific chemotherapy agents, while low-risk patients had higher expression of immune checkpoints (CD274 and CTLA4), indicating potential sensitivity to targeted immunotherapies. Cross-dataset validation yielded consistent AUC values above 0.77, confirming model stability and predictive accuracy.
Conclusion: This study provides a scoring model to predict radiotherapy resistance and prognosis in pancreatic cancer, with potential clinical application for patient stratification. The identified immune profiles and drug sensitivity variations between risk groups highlight opportunities for personalized treatment strategies, contributing to improved management and survival outcomes in pancreatic cancer.
Introduction
Pancreatic cancer is a particularly aggressive cancer, with its incidence and mortality rates steadily increasing globally (1, 2). According to the statistics of China’s National Cancer Center in 2021, pancreatic cancer ranks 7th in the incidence of malignant tumors in men and 11th in women in China, and accounts for 6th in the malignancy related mortality (3). According to the 2023 Cancer Statistics Report, the death rate of pancreatic cancer will rank second only to lung cancer by 2030 (4).
PAAD (pancreatic adenocarcinoma) accounts for the vast majority (85-90%) of all pancreatic cancers, and TCGA’s PAAD program is almost entirely PDAC (pancreatic ductal adenocarcinoma) cases. Despite advances in therapeutic strategies, PAAD remains challenging to treat, primarily due to its late diagnosis, limited resect ability, and high resistance to conventional treatments such as radiotherapy (RT) (5). Surgical resection is the main method for pancreatic cancer patients to obtain cure and prolong survival time. Unfortunately, only a minority (15-20%) of patients can be surgically removed (6).
RT is an important treatment for pancreatic cancer, especially in combination with chemotherapy, which is the preferred treatment for locally advanced pancreatic cancer (7). Yet, PAAD’s intrinsic resistance to radiation and tendency for local recurrence limit the overall effectiveness of RT in improving patient outcomes (8, 9). This resistance, often coupled with a pro-inflammatory tumor microenvironment, facilitates tumor progression and immune escape, ultimately making PAAD more challenging to treat (10). Therefore, understanding the mechanisms of RT resistance and the dynamics of the immune microenvironment is essential for developing more targeted therapies.
To address these challenges, recent studies have focused on identifying specific gene expression profiles and immune cell infiltration patterns associated with RT resistance and immune evasion in PAAD. Through these investigations, researchers aim to stratify patients into high- and low-risk groups, thereby enabling more personalized treatment approaches. Genes that exhibit differential expression in response to RT have shown promise as predictive markers, offering insight into patient prognosis and potential therapeutic targets.
In this study, we utilized two independent GEO datasets (GSE179351 and GSE225767) to identify genes associated with RT resistance in PAAD and constructed a prognostic scoring model validated across multiple datasets. Additionally, we explored the differences in drug sensitivity between these risk groups, offering valuable insights for individualized treatment strategies. This study provides a comprehensive framework for understanding the immune and molecular landscape of PAAD, contributing to the broader goal of personalized therapy. By integrating gene expression, immune cell profiles, and drug response data, our findings support the development of more targeted, effective treatments for PAAD, ultimately aiming to improve patient survival and quality of life. Future research should focus on validating these biomarkers in larger cohorts and exploring immune-related predictive markers to further refine therapeutic strategies in PAAD.
Materials and methods
Data collection
To obtain the data needed for this study, we used Gene Expression Omnibus (GEO), a public functional genome database. We used two words “pancreatic cancer” and “radiation” as the keywords to obtain the required items, and finally selected the series GSE179351 and GSE225767 as the data set for our main analysis.
To obtain patient gene expression and clinical data, we included cases from The Cancer Genome Atlas (TCGA) project. We collected gene expression data from PAAD cases, including 179 tumor samples and 4 normal samples. All TCGA data, mRNA expression and clinical details were manually downloaded from the website and collated by R software.
Analysis of differentially expressed genes
GEO2R was used to identify differentially expressed genes in the geo data sets GSE179351 and GSE225767 after RT compared to before RT. The differentially expressed genes (DEGs) in PAAD samples in TCGA database were identified by R package “edgeR”. Using |log2FC| ≥1 and p-value <0.05 as selection criteria, the range of DEGs was determined for further analysis. Volcano mapping using R software packages “limma” and “ggplot2”. Using gene annotation and analysis resources website “Metscape” (https://www.metascape.org/) for gene function analysis of enrichment.
Cox regression analysis and prognostic model construction
After obtaining 121 co-up-regulated genes and 27 co-down-regulated genes between GSE179351 and GSE225767 as candidate genes for constructing radiation-resistant gene plates, we used univariate Cox regression to select the gene that was most correlated with OS (overall survival) in PAAD patients, and the p-value was set at 0.05.
Then, using the results of univariate Cox regression, we performed proportional risk regression analysis (multivariate Cox model) by the following formula.
Where, the risk score is the product of the mRNA expression of each key predictor gene (xi) and coefficient, which is derived from multivariate Cox regression analysis. Using the survival and survminer packages in R, 178 TCGA-PAAD patients were divided into high-risk group and low-risk group. On the basis of this grouping routine, survival differences between OS and risk scores were observed between the two groups. Logistic regression model was established by using R software package “glmnet”.
Parameter setting and data set partitioning of random forest model
Random forest model was performed by R package ggRandomForests (v2.2.1). Regarding the allocation of the training and testing sets, 148 (83%) of samples to the training set and 30 (27%) to the testing set. In the parameter, there are 183 nodes and 454 edges contained inside this representation. Number of trees was set to 1000 and minimum size of terminal node was set to 10. Other parameters were default settings.
Cell culture
PANC-1 cells were purchased from Wuhan Promoter Life Science & Technology Co., Ltd. (China). All cell lines were cultured at 37°C in an atmosphere of 5% CO2 using DMEM medium containing 10% fetal bovine serum (FBS) (Gibco) and 1% penicillin/streptomycin. When cell confluence reached 70%-80%, they were subjected to ionizing radiation treatment.
Real-time qPCR
Trizol was used to extract RNA from cells. After RNA extraction, the quantity and quality of the RNA were analyzed using the Qnano spectrophotometry method from Yeasen. A reverse transcription reaction was performed using 1 μg of total RNA with Takara’s reverse transcription kit (RR047A). The resulting cDNA was subjected to qPCR analysis using Hieff UNICON® Universal Blue qPCR SYBR Green Master Mix (Yeasen, Cat #11184ES08), and quantification was performed using Yeasen 80520ES03. In all experimental replicates, all expression levels were normalized to GAPDH. The primers used were as follows:
ADAMTS12 Forward (5′-CTTTGAAGGCGGCAACAGCAGA-3′)
ADAMTS12 Reverse (5′-TCTCACAGTCTGGCAGGAAGAG-3′)
AKR1C2 Forward (5′-CCGAAGCAAGATTGCAGATGGC-3′)
AKR1C2 Reverse (5′-TTTCAGTGACCTTTCCAAGGCTG-3′)
ATP8B2 Forward (5′-CGGCTATTCCTGCAAGATGCTG- 3′)
ATP8B2 Reverse (5′-GTCCTGATAGGTGAAGCCGTTG-3′)
CCN4 Forward (5′-AAGAGAGCCGCCTCTGCAACTT-3′)
CCN4 Reverse (5′-TCATGGATGCCTCTGGCTGGTA-3′)
CTHRC1 Forward (5′-CAGGACCTCTTCCCATTGAAGC-3′)
CTHRC1 Reverse (5′-GCAACATCCACTAATCCAGCACC-3′)
GREM1 Forward (5′-TCATCAACCGCTTCTGTTACGGC- 3′)
GREM1 Reverse (5′-CAGAAGGAGCAGGACTGAAAGG-3′)
P3H3 Forward (5′-CTGAGTGTCCTGCTCTTCTACC-3′)
P3H3 Reverse (5′-ATCGGAGGATGAAGCGCTGGAT-3′)
PAPPA Forward (5′-GGAACTGAAGAGAGTGAGCCATC-3′)
PAPPA Reverse (5′-CGTCGCATTGTTCACCTTGGTC-3′)
POSTN Forward (5′-CAGCAAACCACCTTCACGGATC- 3′)
POSTN Reverse (5′-TTAAGGAGGCGCTGAACCATGC-3′)
TAFA2 Forward (5′-GATCGGAAAGGATGGAGCTGTTC-3′)
TAFA2 Reverse (5′-GCGCATGTTCAATGTCATCAGCC-3′)
GAPDH Forward (5′-GGAGCGAGATCCCTCCAAAAT- 3′)
GAPDH Reverse (5′-GGCTGTTGTCATACTTCTCATGG-3′)
Analysis of tumor microenvironment
Single sample gene set enrichment analysis (ssGSEA) was performed using R package “GSVA” to calculate the infiltration level of 28 immune cells. The immune gene sets were sourced from Charoentong’s study (11). Finally, we compared the expression levels of immune checkpoint molecules (CD274 and CTLA4) between the two groups of patients. TIDE was used to predict immunotherapy.
Drug sensitivity
In this study, we explored the predictive value of risk score for immunotherapy and chemotherapy efficacy. Tumor immune dysfunction and rejection (TIDE) score (http://tide.dfci.harvard.edu/) is a kind of used to evaluate tumor immune escape mechanism in the immune microenvironment of tools. TIDE scores predict a patient’s response to immunotherapy, such as immune checkpoint inhibitors, by taking into account the ability of tumor cells to escape immune and the role of tumor-related immunosuppression. The drug was estimated using the “oncopredict” package in R to predict chemotherapy drug sensitivity in each patient.
Statistical analysis
All statistical analysis and graphical visualizations were performed in R (version 4.3.2). Continuous variables were compared between groups using student t test or Wilcoxon rank sum test. P<0.05 was considered statistically significant (bilateral).
Result
Screening and functional analysis of genes related to RT resistance
To identify genes that play a key role in RT resistance, we selected two datasets, GSE179351 and GSE225767, as study objects. In these two datasets, we obtained differential genes (DEGs) in cancer tissues after RT compared with those before RT through GEO2R online analysis (Figures 1A, B). In the GSE179351 data set, there were 594 up-regulated genes and 480 down-regulated genes in the cancer tissues after RT compared with those before RT (Supplementary Table S1). In GSE225767 data, 1033 up-regulated genes and 637 down-regulated genes were found in cancer tissues after RT compared with those before RT (Supplementary Table S2). In DEGs analysis, the cutoff value was set as |log2FC| ≥1, and p-value <0.05. We screened 148 genes with identical expression changes in both datasets as candidate genes (Figures 1C, D, Table 1). To clarify the function of these genes, we used the Metascape tool website to conduct a republic KEGG enrichment analysis of this group of genes, which are mainly involved in the regulation of cell behavior, the development and regeneration of tissues and organs. These changes may affect cancer cell survival, invasion, and response to treatment, providing important clues to understanding the mechanism of action of RT in PAAD (Figure 1E).
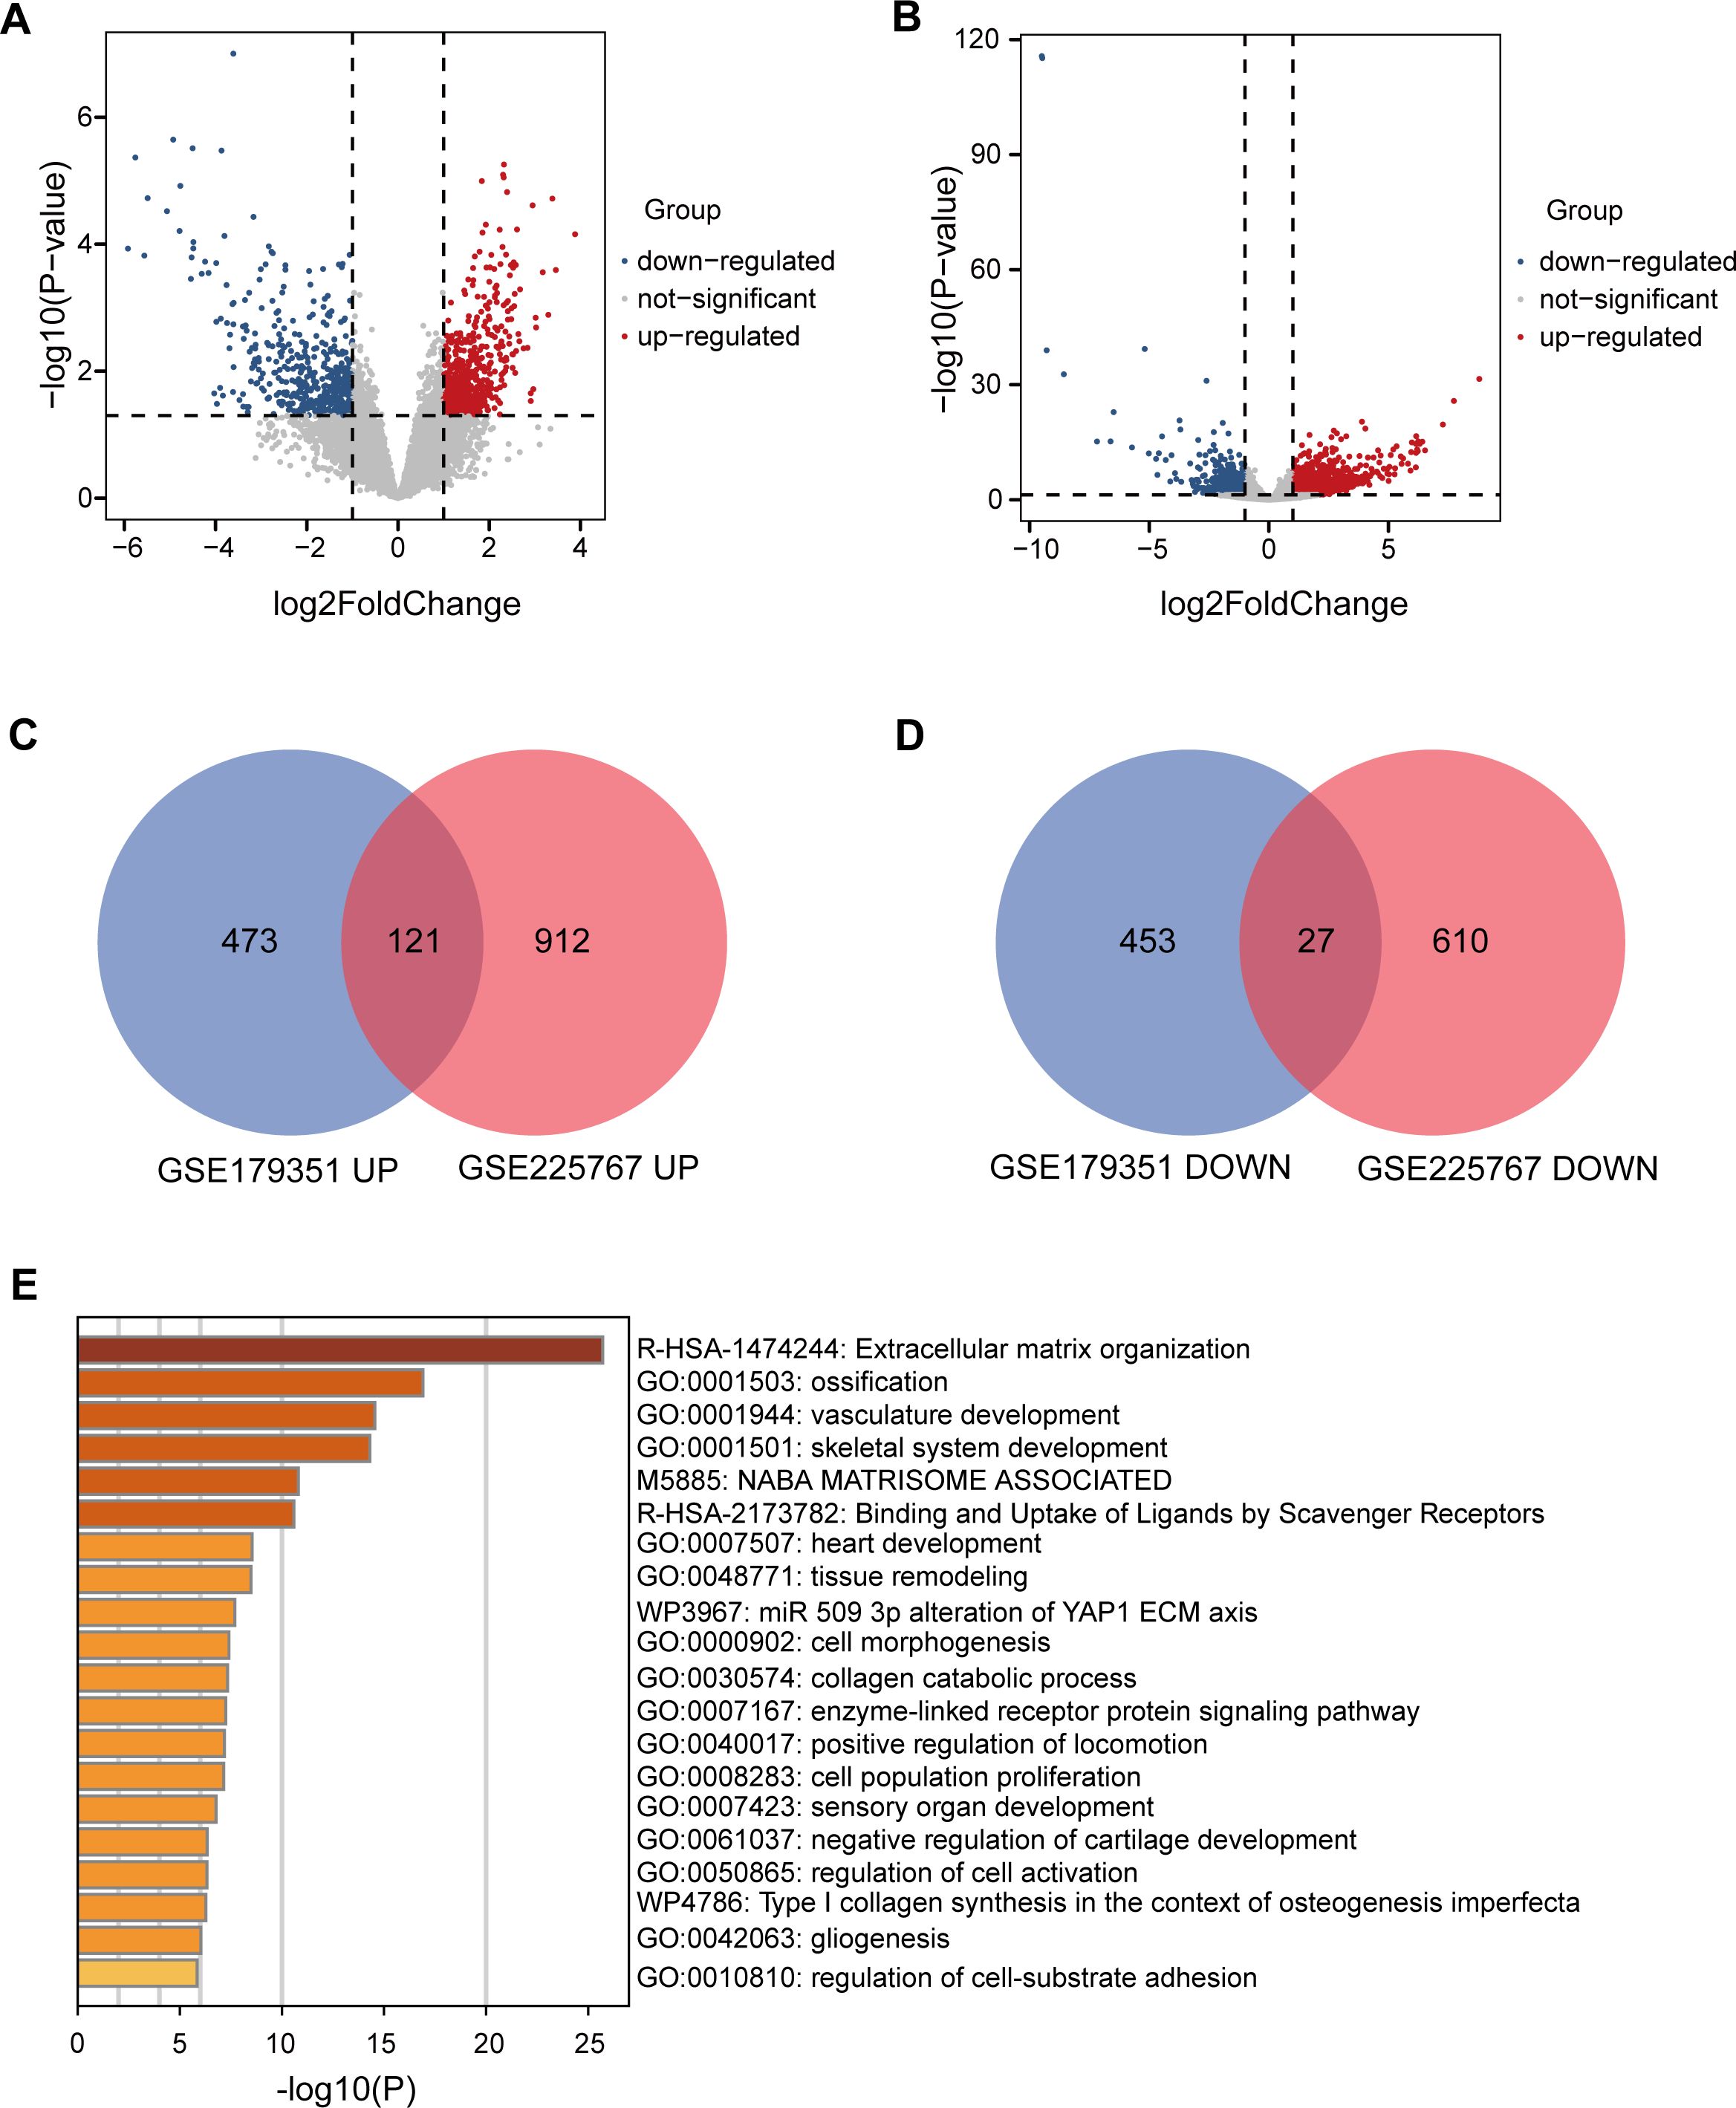
Figure 1. Identification and functional analysis of DEGs related to RT resistance in PAAD. (A) Volcano plots showing gene expression changes in PAAD tissues after RT compared to before RT in the GSE179351 datasets, with |log2FC| ≥1 and p < 0.05 set as cutoff values. In the DEGs analysis, red dots represent upregulated genes, and blue dots represent downregulated genes. (B) Volcano plots showing gene expression changes in PAAD tissues after RT compared to before RT in the GSE225767 datasets, with |log2FC| ≥1 and p < 0.05 set as cutoff values. In the DEGs analysis, red dots represent upregulated genes, and blue dots represent downregulated genes. (C) Venn diagram of upregulated genes in GSE179351 and GSE225767. (D) Venn diagram of downregulated genes in GSE179351 and GSE225767. (E) Enrichment analysis of 121 co-upregulated genes and 27 co-downregulated genes performed using the Metascape website.

Table 1. Candidate genes with consistent expression changes across both datasets.
Effect of radiation resistance gene on prognosis of patients with PAAD
In order to investigate the effect of radiation-resistant genes on the prognosis of pancreatic cancer patients, we selected PAAD patients from the TCGA database and established univariate and multivariate Cox proportional risk regression models. Among the 148 candidate genes mentioned above, a total of 37 genes were considered to be related to patients’ overall survival (OS) by single-factor Cox regression model analysis. Of these, 26 genes are considered risk factors and 11 genes are considered protective factors. Therefore, we further included these 37 genes in multivariate Cox analysis to construct the genome associated with radiation resistance. According to the analysis results, 10 genes were screened out (p<0.05). Then, multivariate Cox regression coefficient and mRNA expression levels of key genes were used to establish a risk scoring formula: risk score = (-ADAMTS12*0.05286 + AKR1C2* 0.0163542-ATP8B2 *0.04237 + CCN4*0.032409 -CTHRC1*0.00454 + GREM1* 0.008157-P3H3 *0.03781 + PAPPA* 0.129872-POSTN * 0.00178-TAFA2 *1.80003). A hazard ratio greater than 1 indicates that patients with high gene expression are more likely to develop tumor progression after RT, while a hazard ratio less than 1 indicates that the gene is a protective factor (Figure 2A).
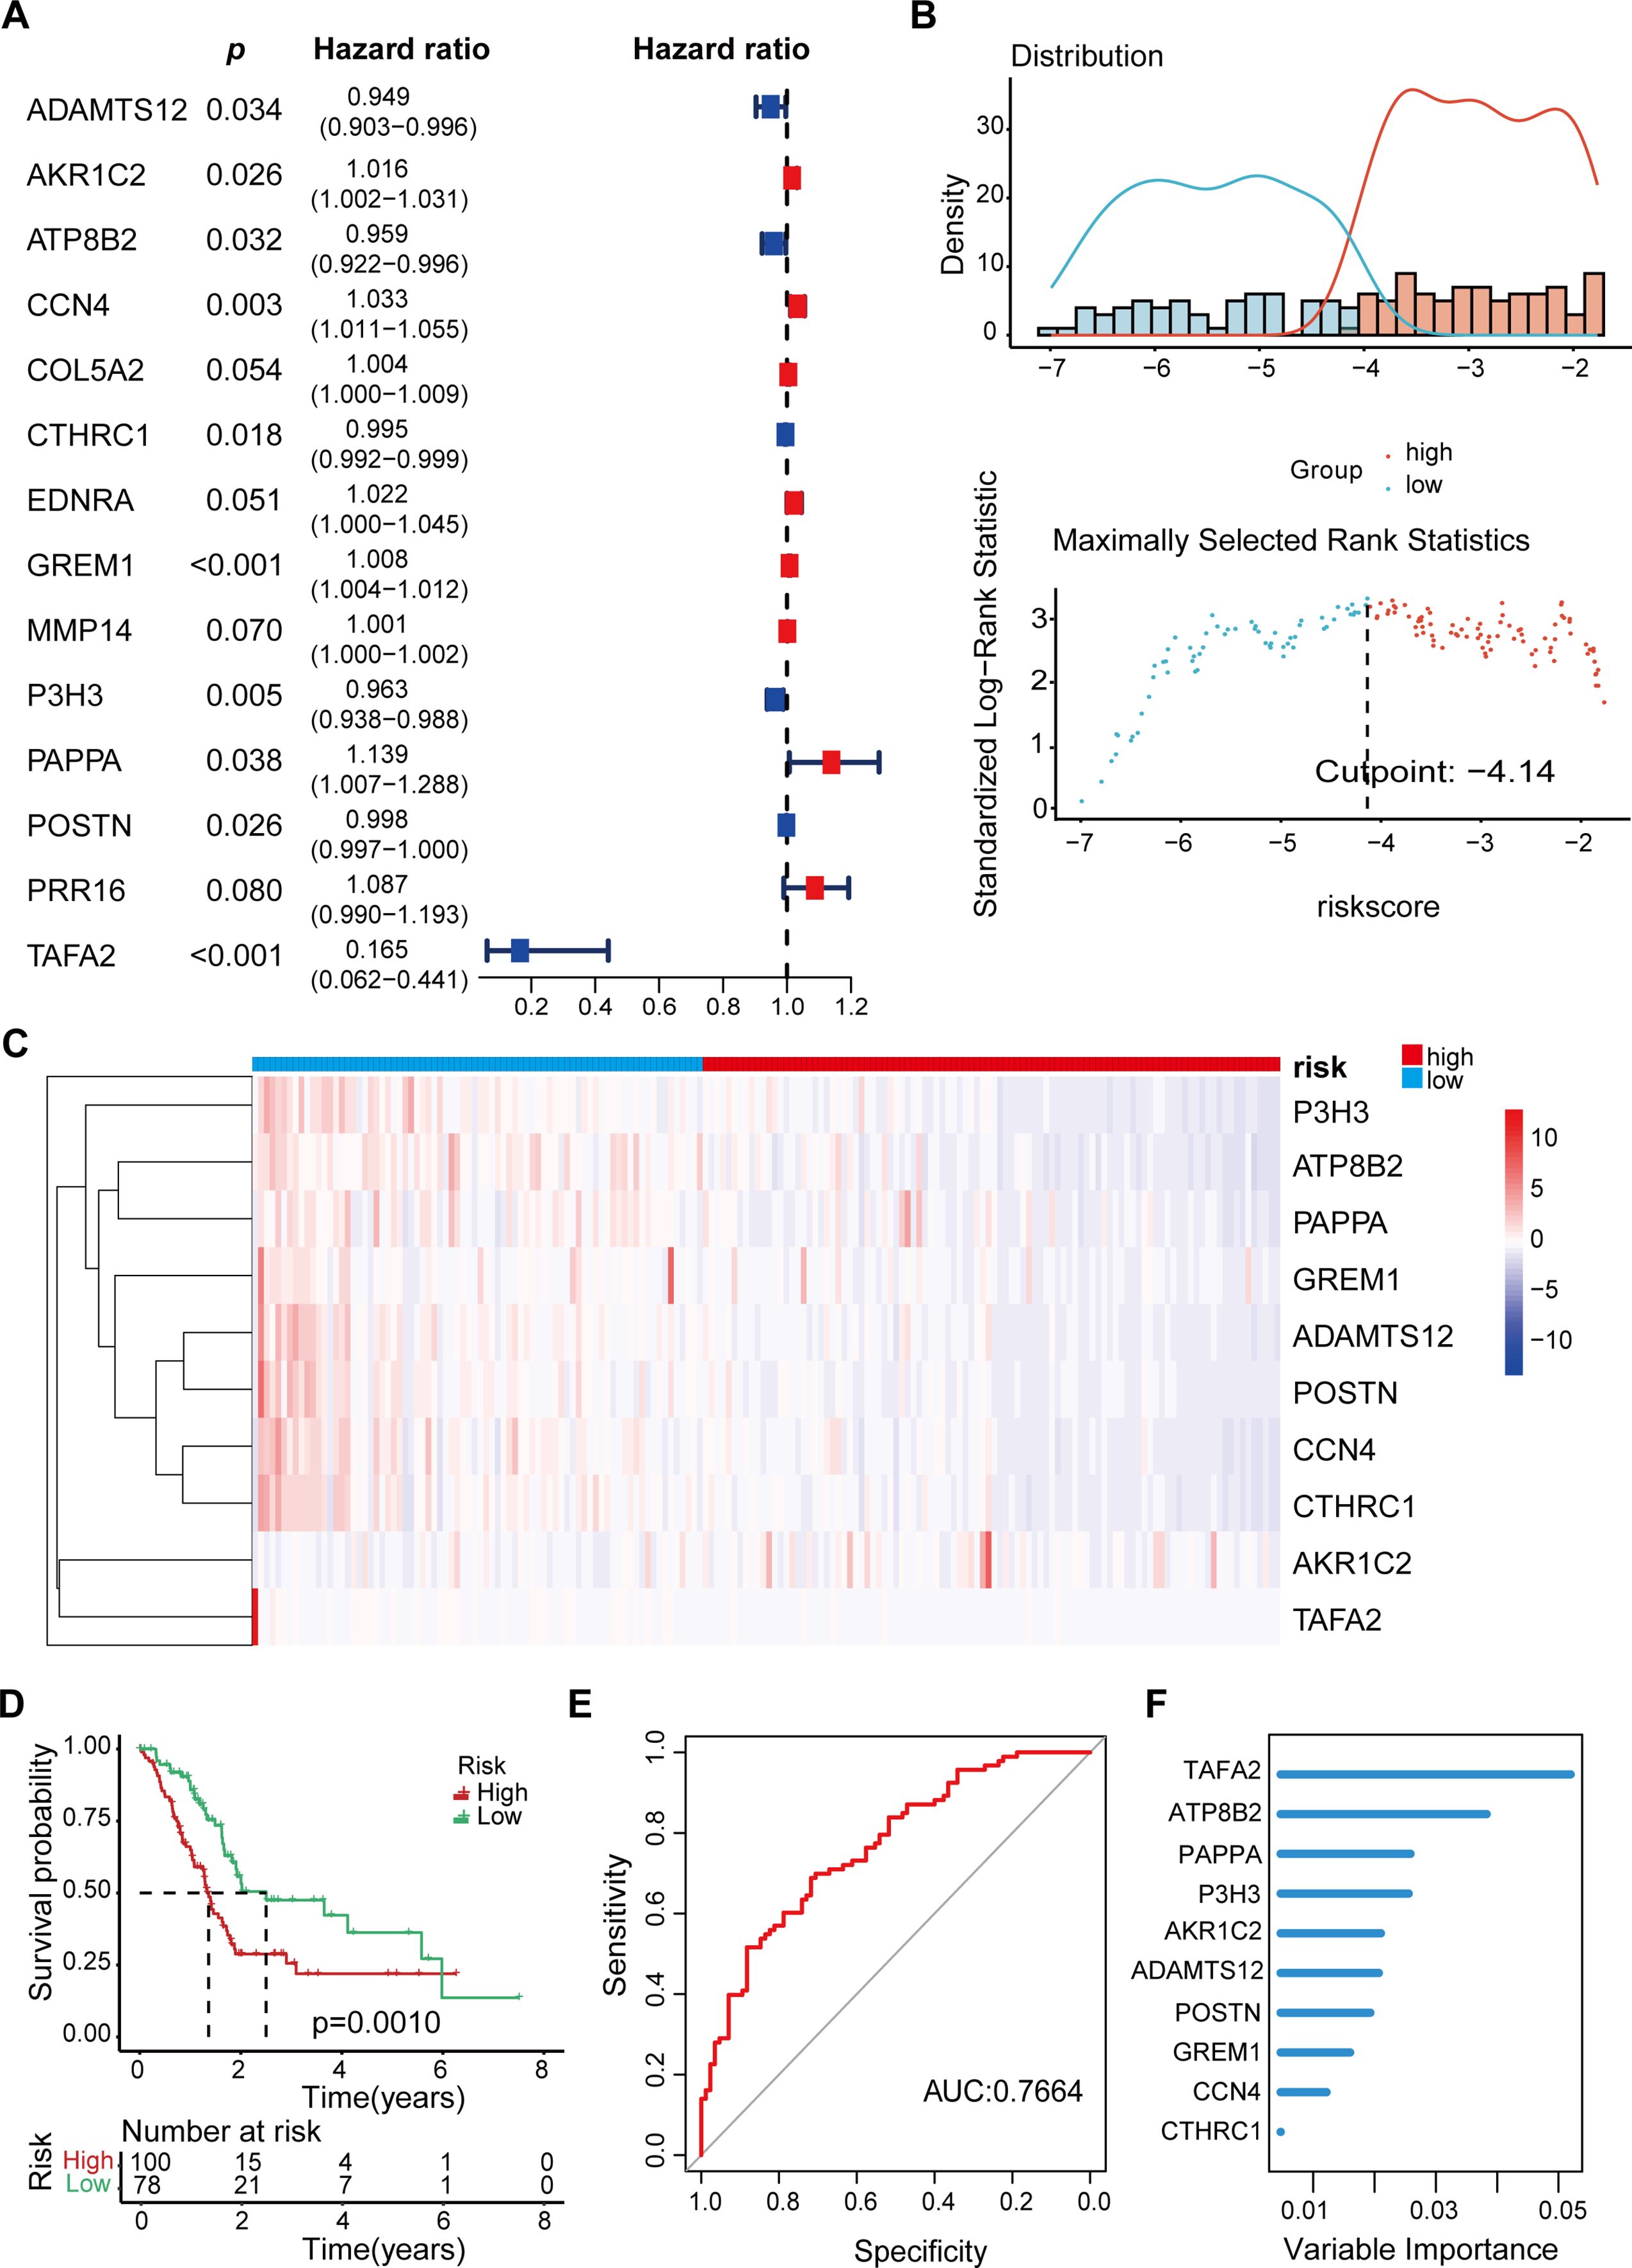
Figure 2. Prognostic model for PAAD Patients based on radiation-resistant genes. (A) Multivariate Cox regression analysis identified 10 genes associated with OS in patients with PAAD. (B) Optimal cutoff value of risk score determined by the “surv_cutpoint” function. 178 PAAD patients were divided into high-risk and low-risk groups. (C) Heat map displaying the expression levels of the 10 key genes in individual patients. (D) The Kaplan-Meier OS curve shows the survival differences among patients in different risk groups. (E) The AUC values corresponding to these gene combinations were calculated by multiple logistic regression model. The AUC value is 0.7664. (F) Bar plot showing the variable significance of 10 filtered genes in random forest model.
According to the risk score formula, 178 patients with PAAD were divided into high-risk and low-risk groups using the optimal cutoff value determined by the “surv_cutpoint” function (Figure 2B). The heat map identified the expression levels of 10 genes in a single patient, 100 in the high-risk group and 78 in the low-risk group (Figure 2C, Table 2). As shown in Figure 2D, patients with higher risk scores after RT are more likely to develop tumor progression and have a relatively shorter median survival. Specifically, when we constructed survival curves based on the expression of a single key gene, only ATP8B2, GREM1, and TAFA2 genes could obtain statistically significant results (p< 0.05, Supplementary Figure S1). However, when patients were grouped according to risk scores, the high-risk group had significantly lower survival rates at 3 and 5 years, and even beyond, compared to the low-risk group (p = 0.001) (Figure 2D). This suggests that the prognosis model is effective in distinguishing between high-risk and low-risk patients, and that high-risk patients have poorer survival outcomes. To further verify the reliability, we established a multivariate logistic regression analysis to evaluate its effectiveness in predicting tumor progression. The validated AUC value of 0.7664 indicates that the model performs well in differentiating between samples with different risk of tumor progression (Figure 2E). In addition, we applied machine learning methods for patient risk prediction, but on our dataset, the machine learning model had a low AUC value (Supplementary Figure S2). Using the random forest model, we further analyzed the contribution of the above 10 genes to the risk scoring model. The results showed that among the 148 gene candidates, TAFA2 contributed the most to the prediction model, followed by ATP8B2 (Figure 2F).
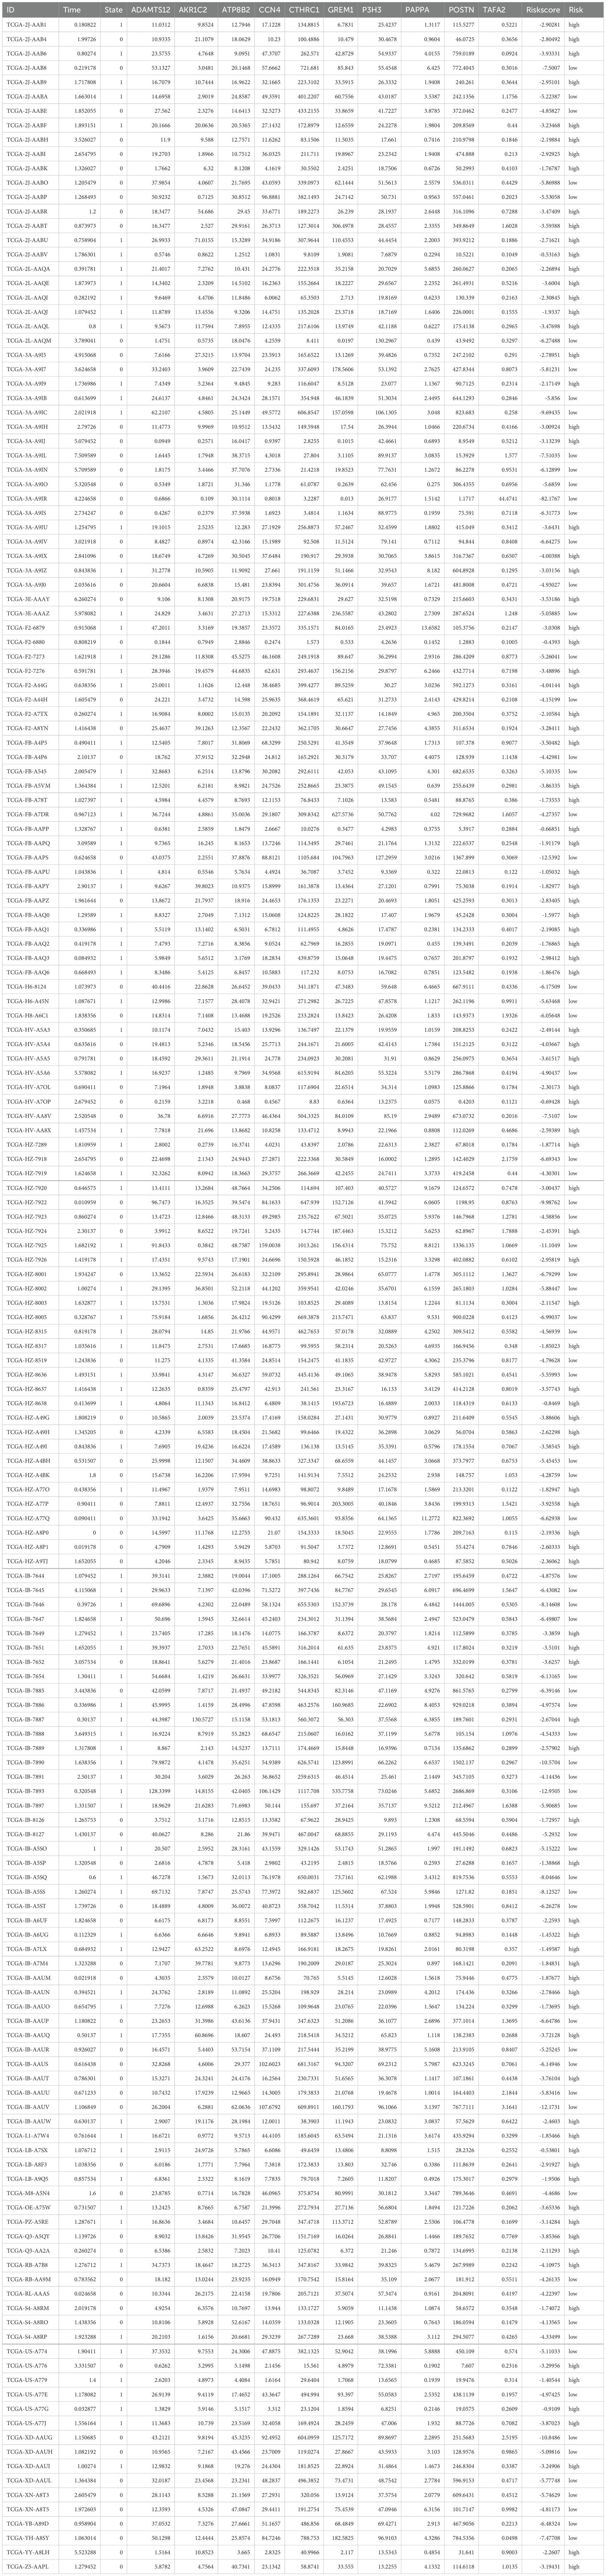
Table 2. Expression levels of ten key genes and risk classification in pancreatic cancer patients.
Next, we verified the 10 genes selected above to verify their relationship with radiation resistance in pancreatic cancer. The results showed that TAFA2 and POSTN were significantly elevated in IR-resistant pancreatic cancer cells (Supplementary Figure S3), suggesting that TAFA2 may play an important role in radiotherapy resistance of pancreatic cancer.
Cross-dataset validation and clinical association analysis of PAAD score models
To more fully validate the predictive power of the scoring model, we downloaded and analyzed three publicly available pancreatic cancer GEO datasets (GSE28735, GSE62452, and GSE57495). In each dataset, we calculated the AUC value via the ROC curve to assess the accuracy of the model’s prediction of patient risk. The results showed that all datasets had AUC values higher than 0.77, with the GSE28735 dataset having the highest AUC value of 0.8886, indicating that the scoring model has stable and high predictive performance across multiple datasets (Figure 3A), supporting its potential to be widely used in diverse pancreatic cancer patient populations.
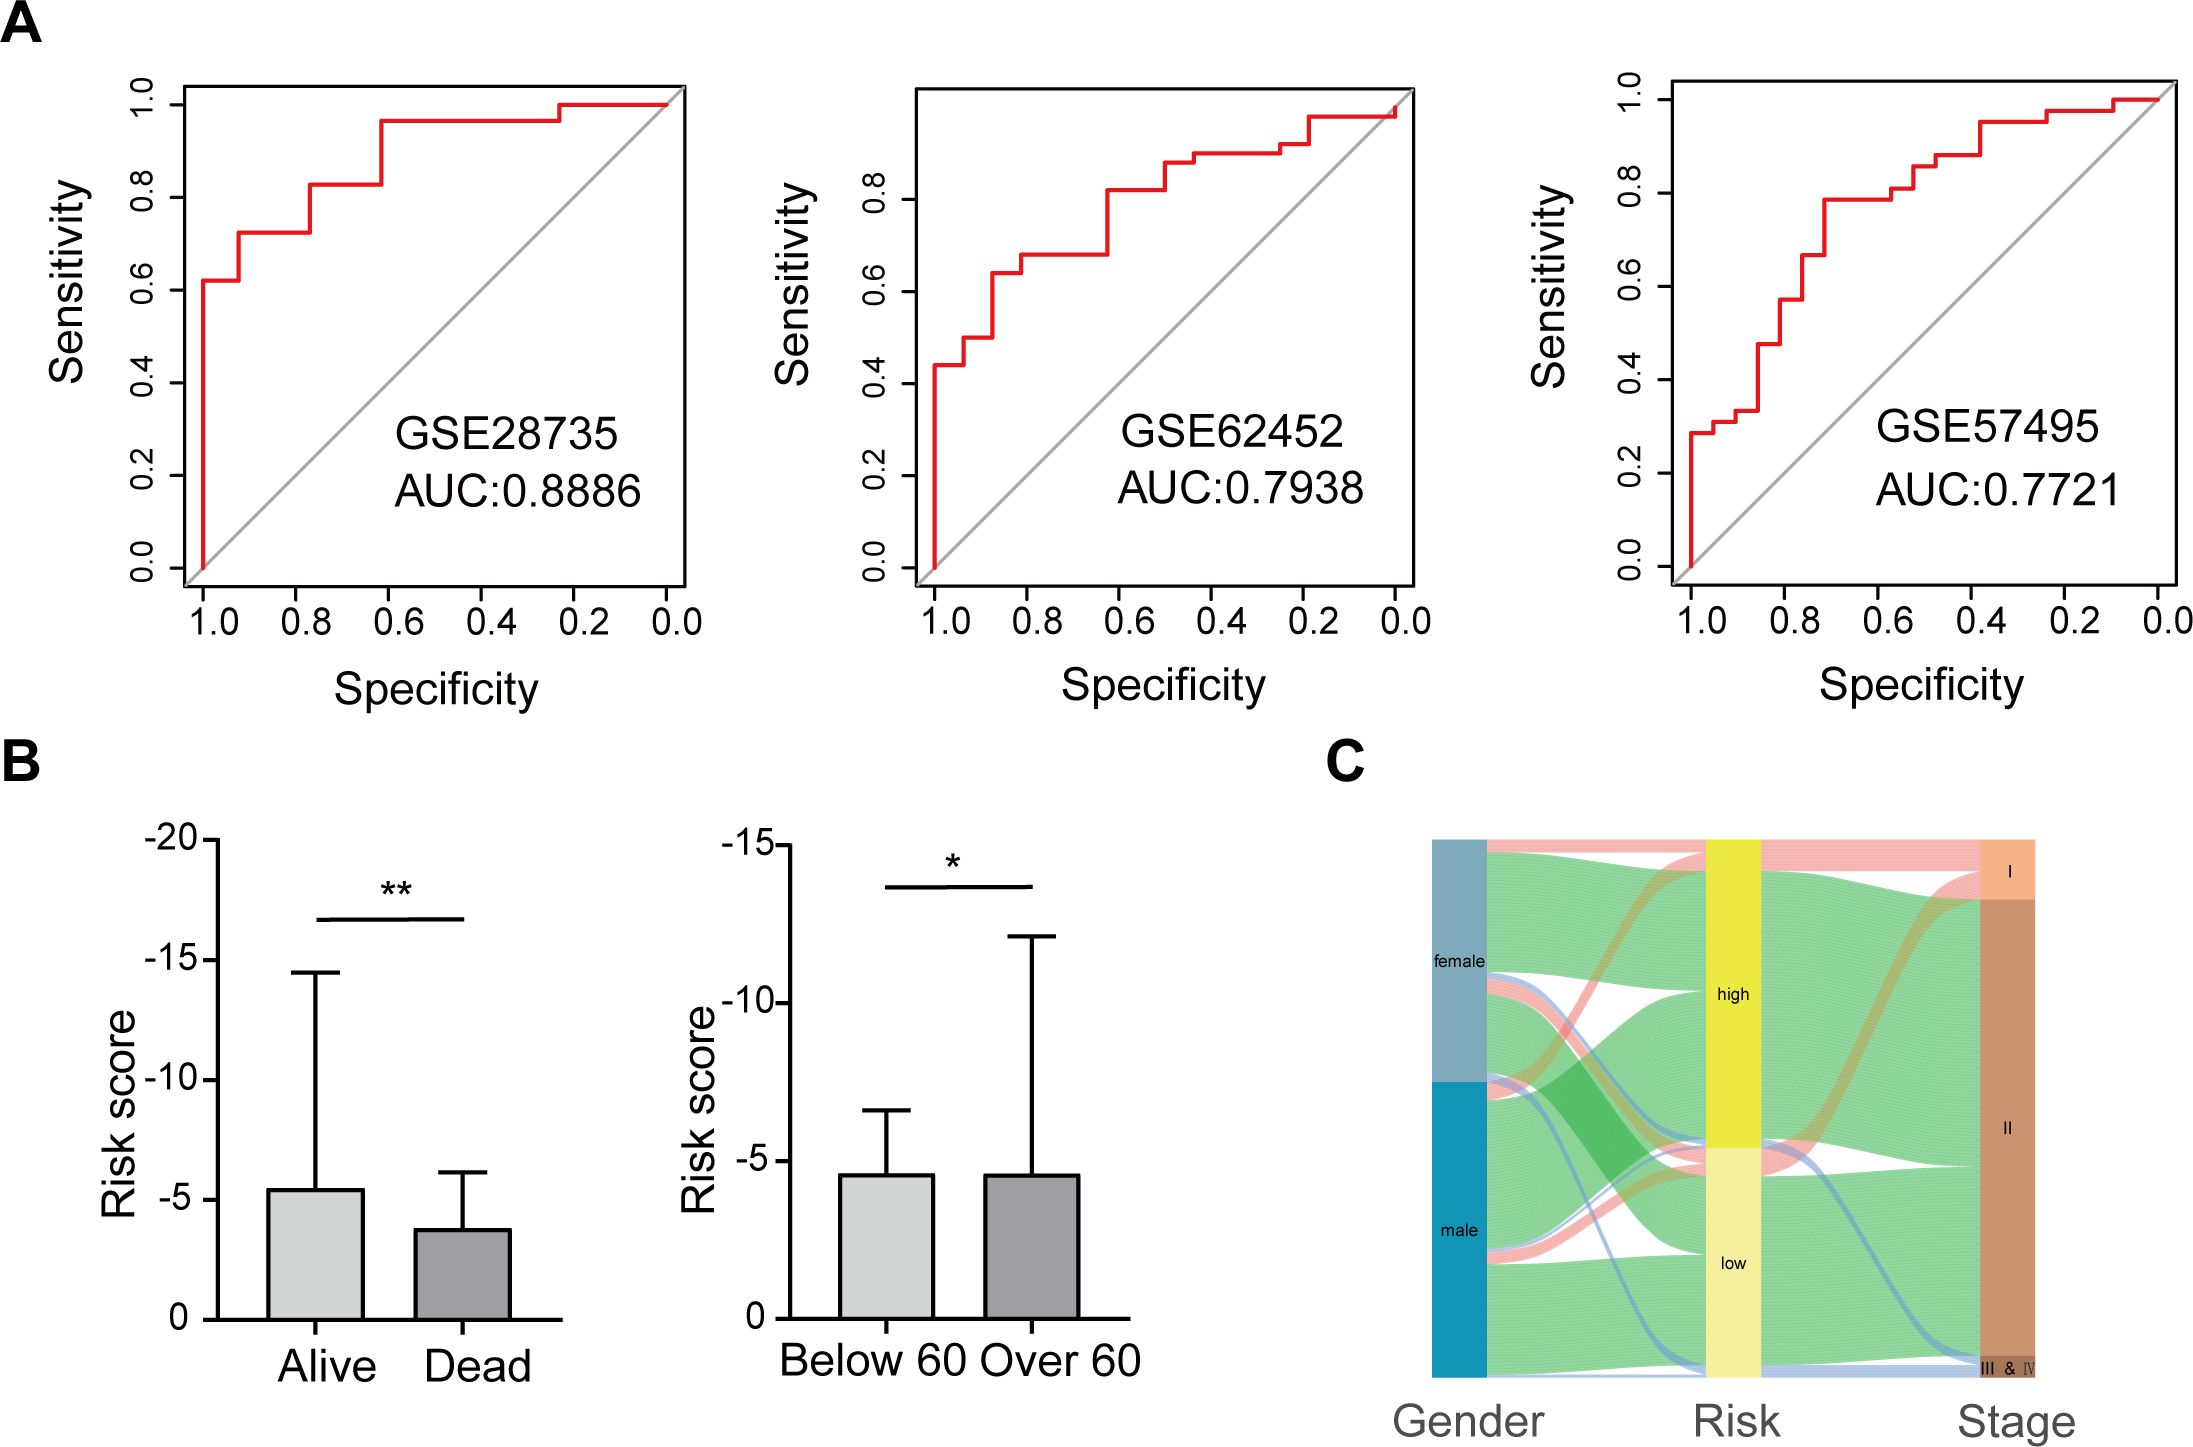
Figure 3. Validation of the scoring model’s predictive performance and clinical relevance. (A) ROC curves for three GEO datasets. (B) Risk scores compared by survival status and age group. (C) Sankey diagram depicting relationships among gender, risk group, and cancer stage. *p < 0.05; **p < 0.01.
Further, we explored the association between the risk score of the scoring model and the clinical characteristics of patients, aiming to analyze the clinical significance of the score. The study found that the risk score was not significantly associated with gender or pathological stage, suggesting consistent applicability of the score to patients of different genders and stages (Supplementary Figure S4). However, there was a significant correlation between risk scores and patients’ survival status and age. Specifically, patients whose survival status was death had a significantly higher risk score than those who survived, suggesting that this score may be a powerful indicator of prognosis. In addition, patients older than 60 years had significantly higher risk scores than those younger than 60 years, a finding that may reflect a more aggressive or progressive course of disease in older patients (Figure 3B).
We also mapped the relationship between gender, high-low risk groups, and cancer stage to visualize the interaction patterns between these variables (Figure 3C). In Figure 3C, the distribution of patients of different genders in high and low risk groups and cancer stages is shown in the form of Sankey charts. Although there was no significant association between gender and risk score, we could observe differences in disease stage among patients in different risk groups. Such visualization not only helps to understand the relationship between variables, but also provides a reference for the development of further individualized treatment strategies.
In summary, this study confirmed the strong predictive ability of the scoring model in pancreatic cancer patients through external validation of multiple GEO datasets, and supported the clinical application potential of the model through correlation analysis with clinical characteristics. This validation method based on multiple data sets not only enhances the robustness of the model, but also lays a foundation for its popularization in clinical practice.
Enrichment analysis of DEGs in high and low-risk group
Based on the matched tumor RNA-seq data from PAAD patients, we identified 933 DEGs (p.adj < 0.05 and |log2FC| ≥ 1) between the high-risk and low-risk groups, including 348 up-regulated genes and 585 down-regulated genes (Figure 4A). Next, we performed GO and KEGG enrichment analysis for these differential genes.
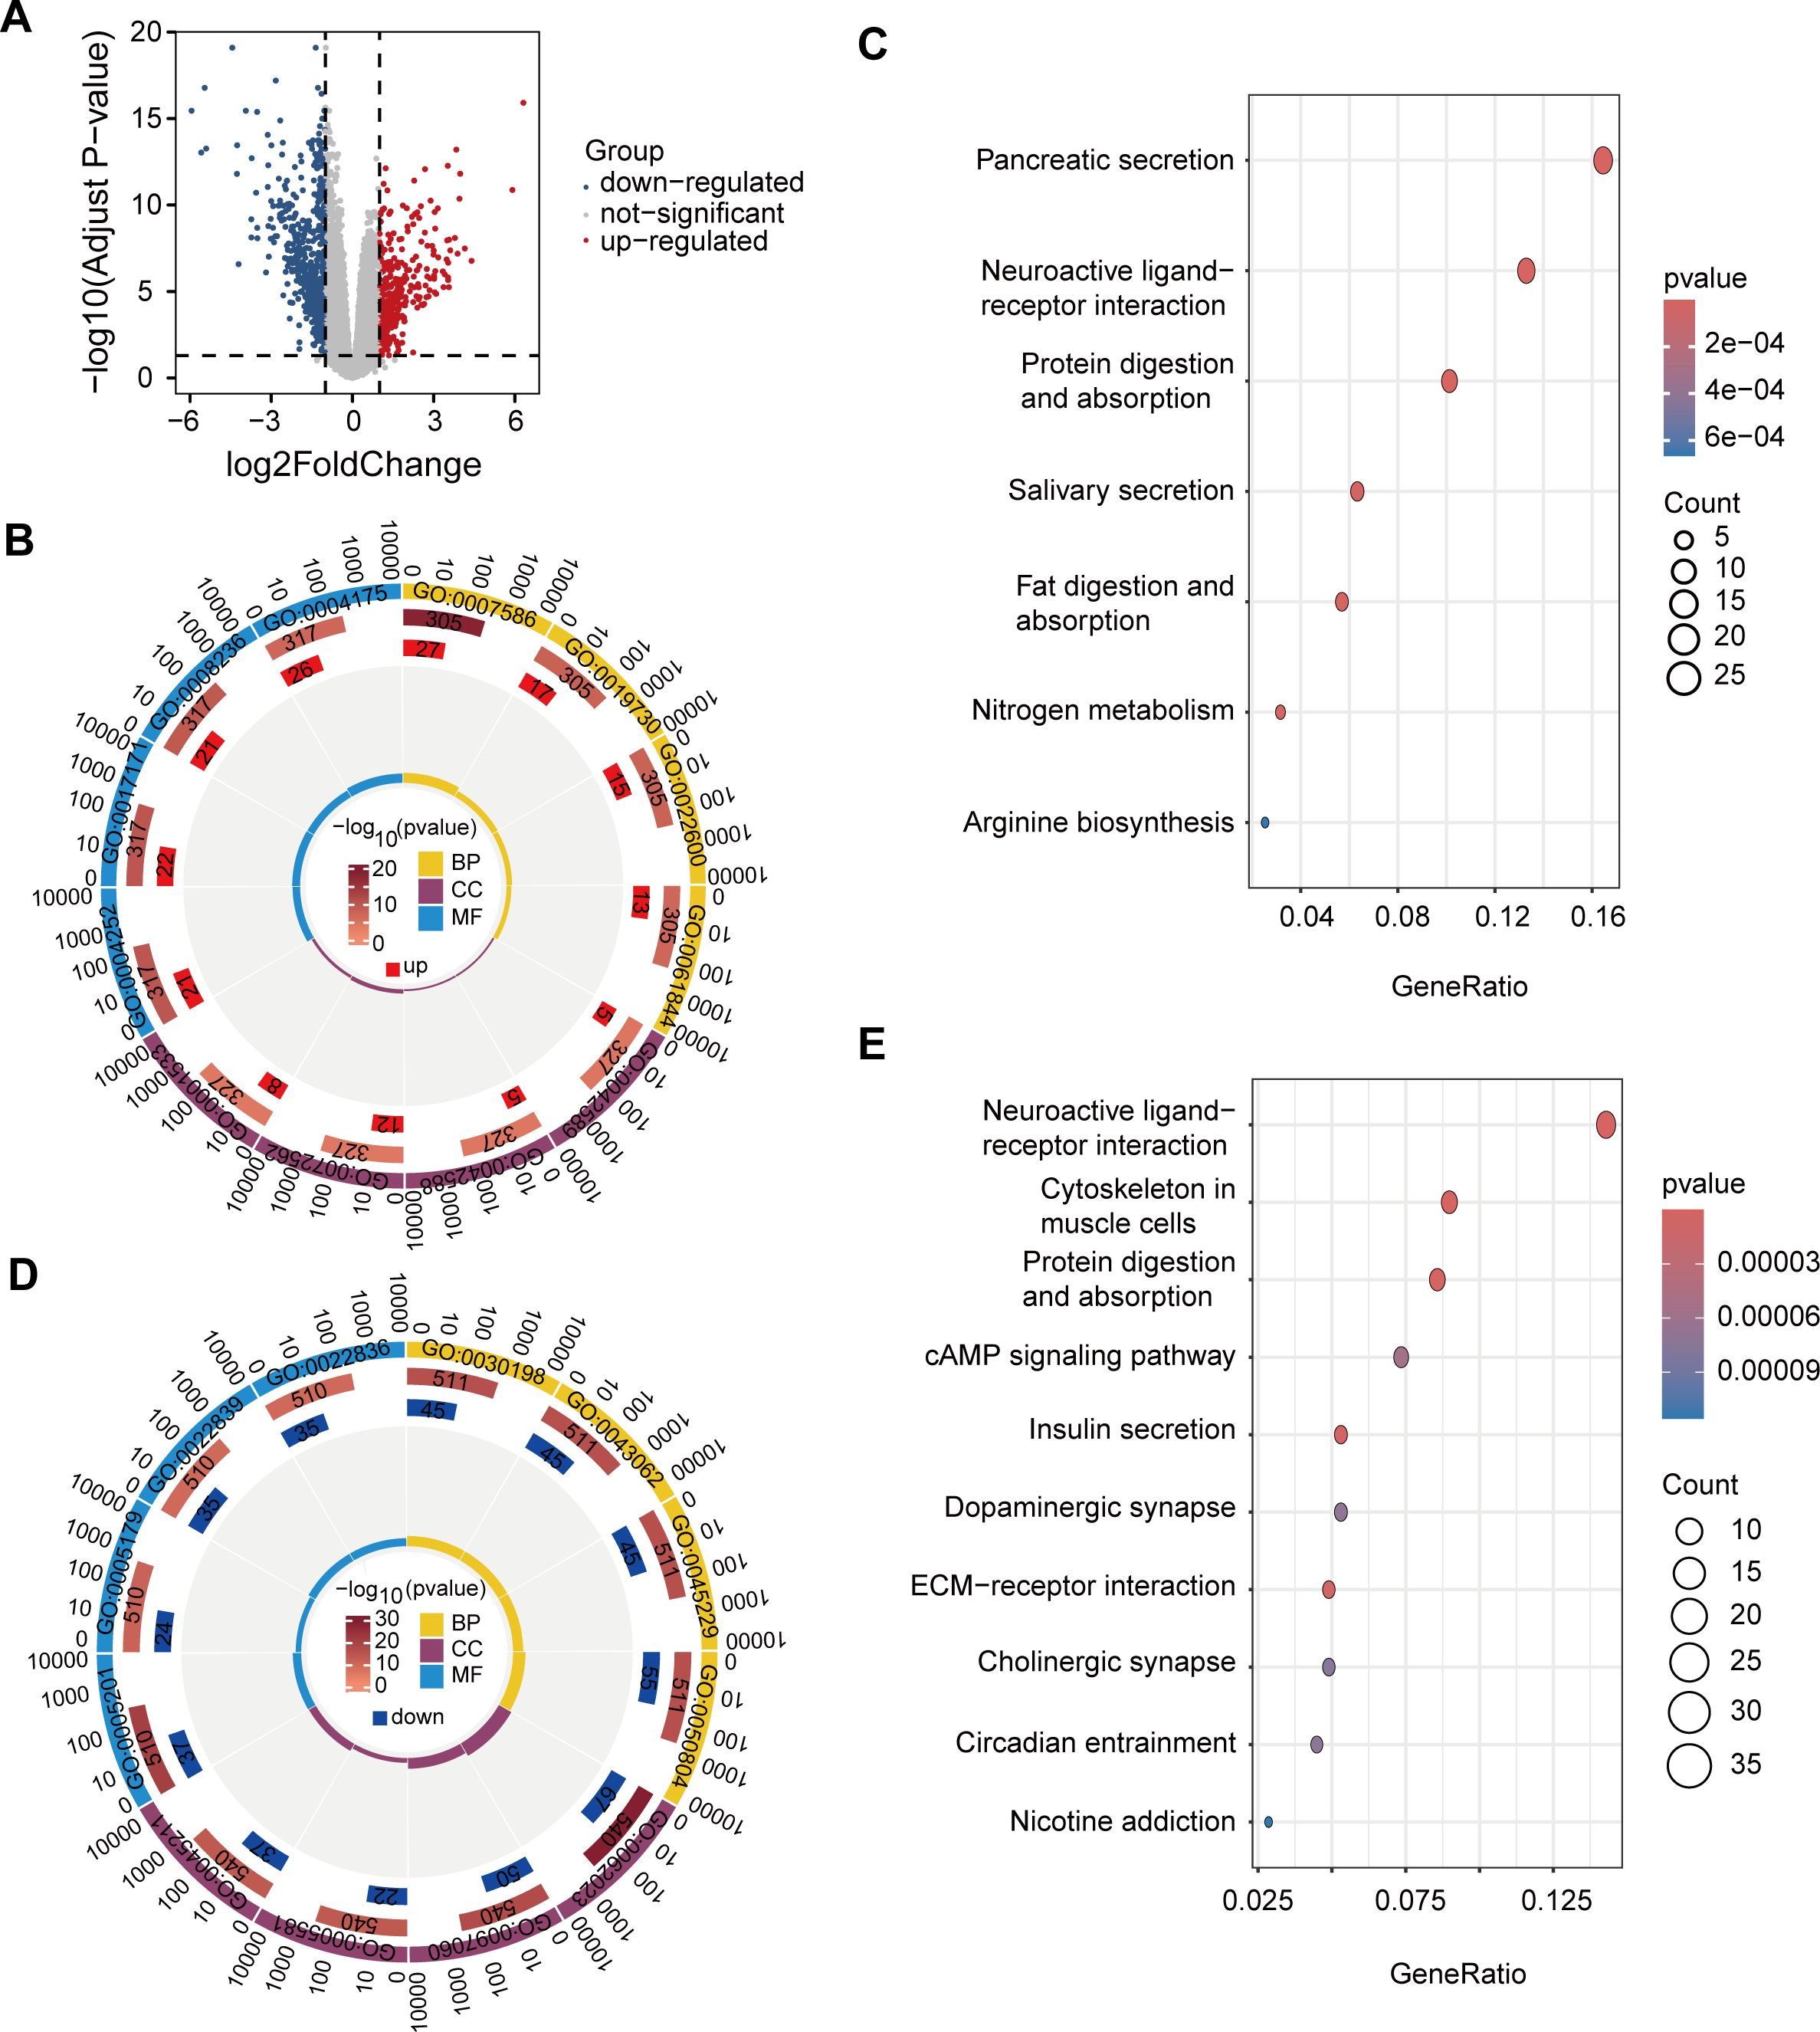
Figure 4. DEGs and functional enrichment analysis in high- and low-risk groups. (A) Volcano plot of 933 DEGs with 348 upregulated (red) and 585 downregulated (blue) genes. (B) GO enrichment of upregulated genes. (C) KEGG enrichment of upregulated genes in pathways such as pancreatic secretion, neuroactive ligand-receptor interaction, and protein digestion, supporting tumor growth and metabolic demands in high-risk patients. (D) GO enrichment of downregulated genes. (E) KEGG enrichment of downregulated genes in pathways like neuroactive signaling, cytoskeletal organization, and metabolism, indicating reduced proliferation and migration potential in low-risk patients.
The results of GO enrichment analysis showed that the up-regulated genes were mainly enriched in GO terms associated with immune response, cell differentiation, and digestion, processes that may be involved in tumor development and changes in the immune microenvironment of PAAD (Figure 4B). GO enrichment results of down-regulated genes showed that these genes were mainly related to the tissue and structural components of the extracellular matrix, basic enzyme activity, and molecular binding activity, suggesting that tumor progression may be slower in low-risk patients, and tissue remodeling and signaling activities may be less active (Figure 4D).
The results of KEGG enrichment analysis showed that up-regulated genes were mainly enriched in pancreatic secretion, neuroactive ligand-receptor interactions, and protein digestion and absorption pathways (Figure 4C). The enrichment of these pathways suggests that patients at high risk of PAAD exhibit active biological characteristics in digestion, metabolism and nerve signaling, providing support for the growth, metabolic needs and microenvironment regulation of PAAD cells, thereby promoting the invasion and metastasis of cancer cells.
In contrast, KEGG enrichment of down-regulated genes showed that these genes were mainly concentrated in pathways such as neuroactive ligand-receptor interactions, cytoskeleton of muscle cells, protein digestion and absorption, and insulin secretion (Figure 4E). These pathways show lower activity in low-risk PAAD patients, particularly in pathways related to nerve signaling, cytoskeleton, metabolism, and extracellular matrix. Downregulation of these pathways may limit tumor cell proliferation, migration, and nutrient acquisition, thereby slowing tumor aggressiveness and progression.
Immune and tumor microenvironment differences in high- and low-risk PAAD patients
After enrichment analysis of differentially expressed genes in high and low risk groups of PAAD, we found that up-regulated genes were significantly enriched in immune response, cell differentiation and digestion. Among them, GO terms related to immune response stand out, suggesting that there may be important molecular and cellular changes in the immune microenvironment in high-risk PAAD patients. Given that the immune system plays a key role in the occurrence, development and prognosis of tumors, it is necessary to further explore the clinical significance and biological characteristics of these immune-related genes. Therefore, our next step is to focus on screening for immune-related genes in these differential genes and performing survival analyses on them to assess their impact on the prognosis of patients with PAAD.
Based on the ImmPort database, we identified 113 immune-related DEGs among the differentially expressed genes in the high-low risk group. Through univariate Cox regression analysis and Kaplan-Meier survival analysis, we further screened 11 immune-associated DEGs that were significantly associated with OS in PAAD patients. Among them, CST4, GREM1 and SLURP1 were favorable factors, while PENK, INSL5, KL, PRLR, SCG2, SLC22A17, TAFA2 and VGF were risk factors (Figure 5A).
In addition, to fully understand the role of immunity in PAAD progression, we also analyzed differences in immune function and immune infiltration between high and low risk groups. Immune function analysis showed that in the low-risk group, APC co-inhibition, APC co-stimulation, immune checkpoint, and T cell co-inhibition were highly active (Figure 5B). The high activity of these immune functions may indicate that the immune system of patients in the low-risk group achieves a balance between anti-tumor response and autoimmune protection. Enhanced APC and T cell inhibitory signaling, as well as regulation of immune checkpoints, help maintain the homeostasis of the immune microenvironment, thereby inhibiting tumor progression.
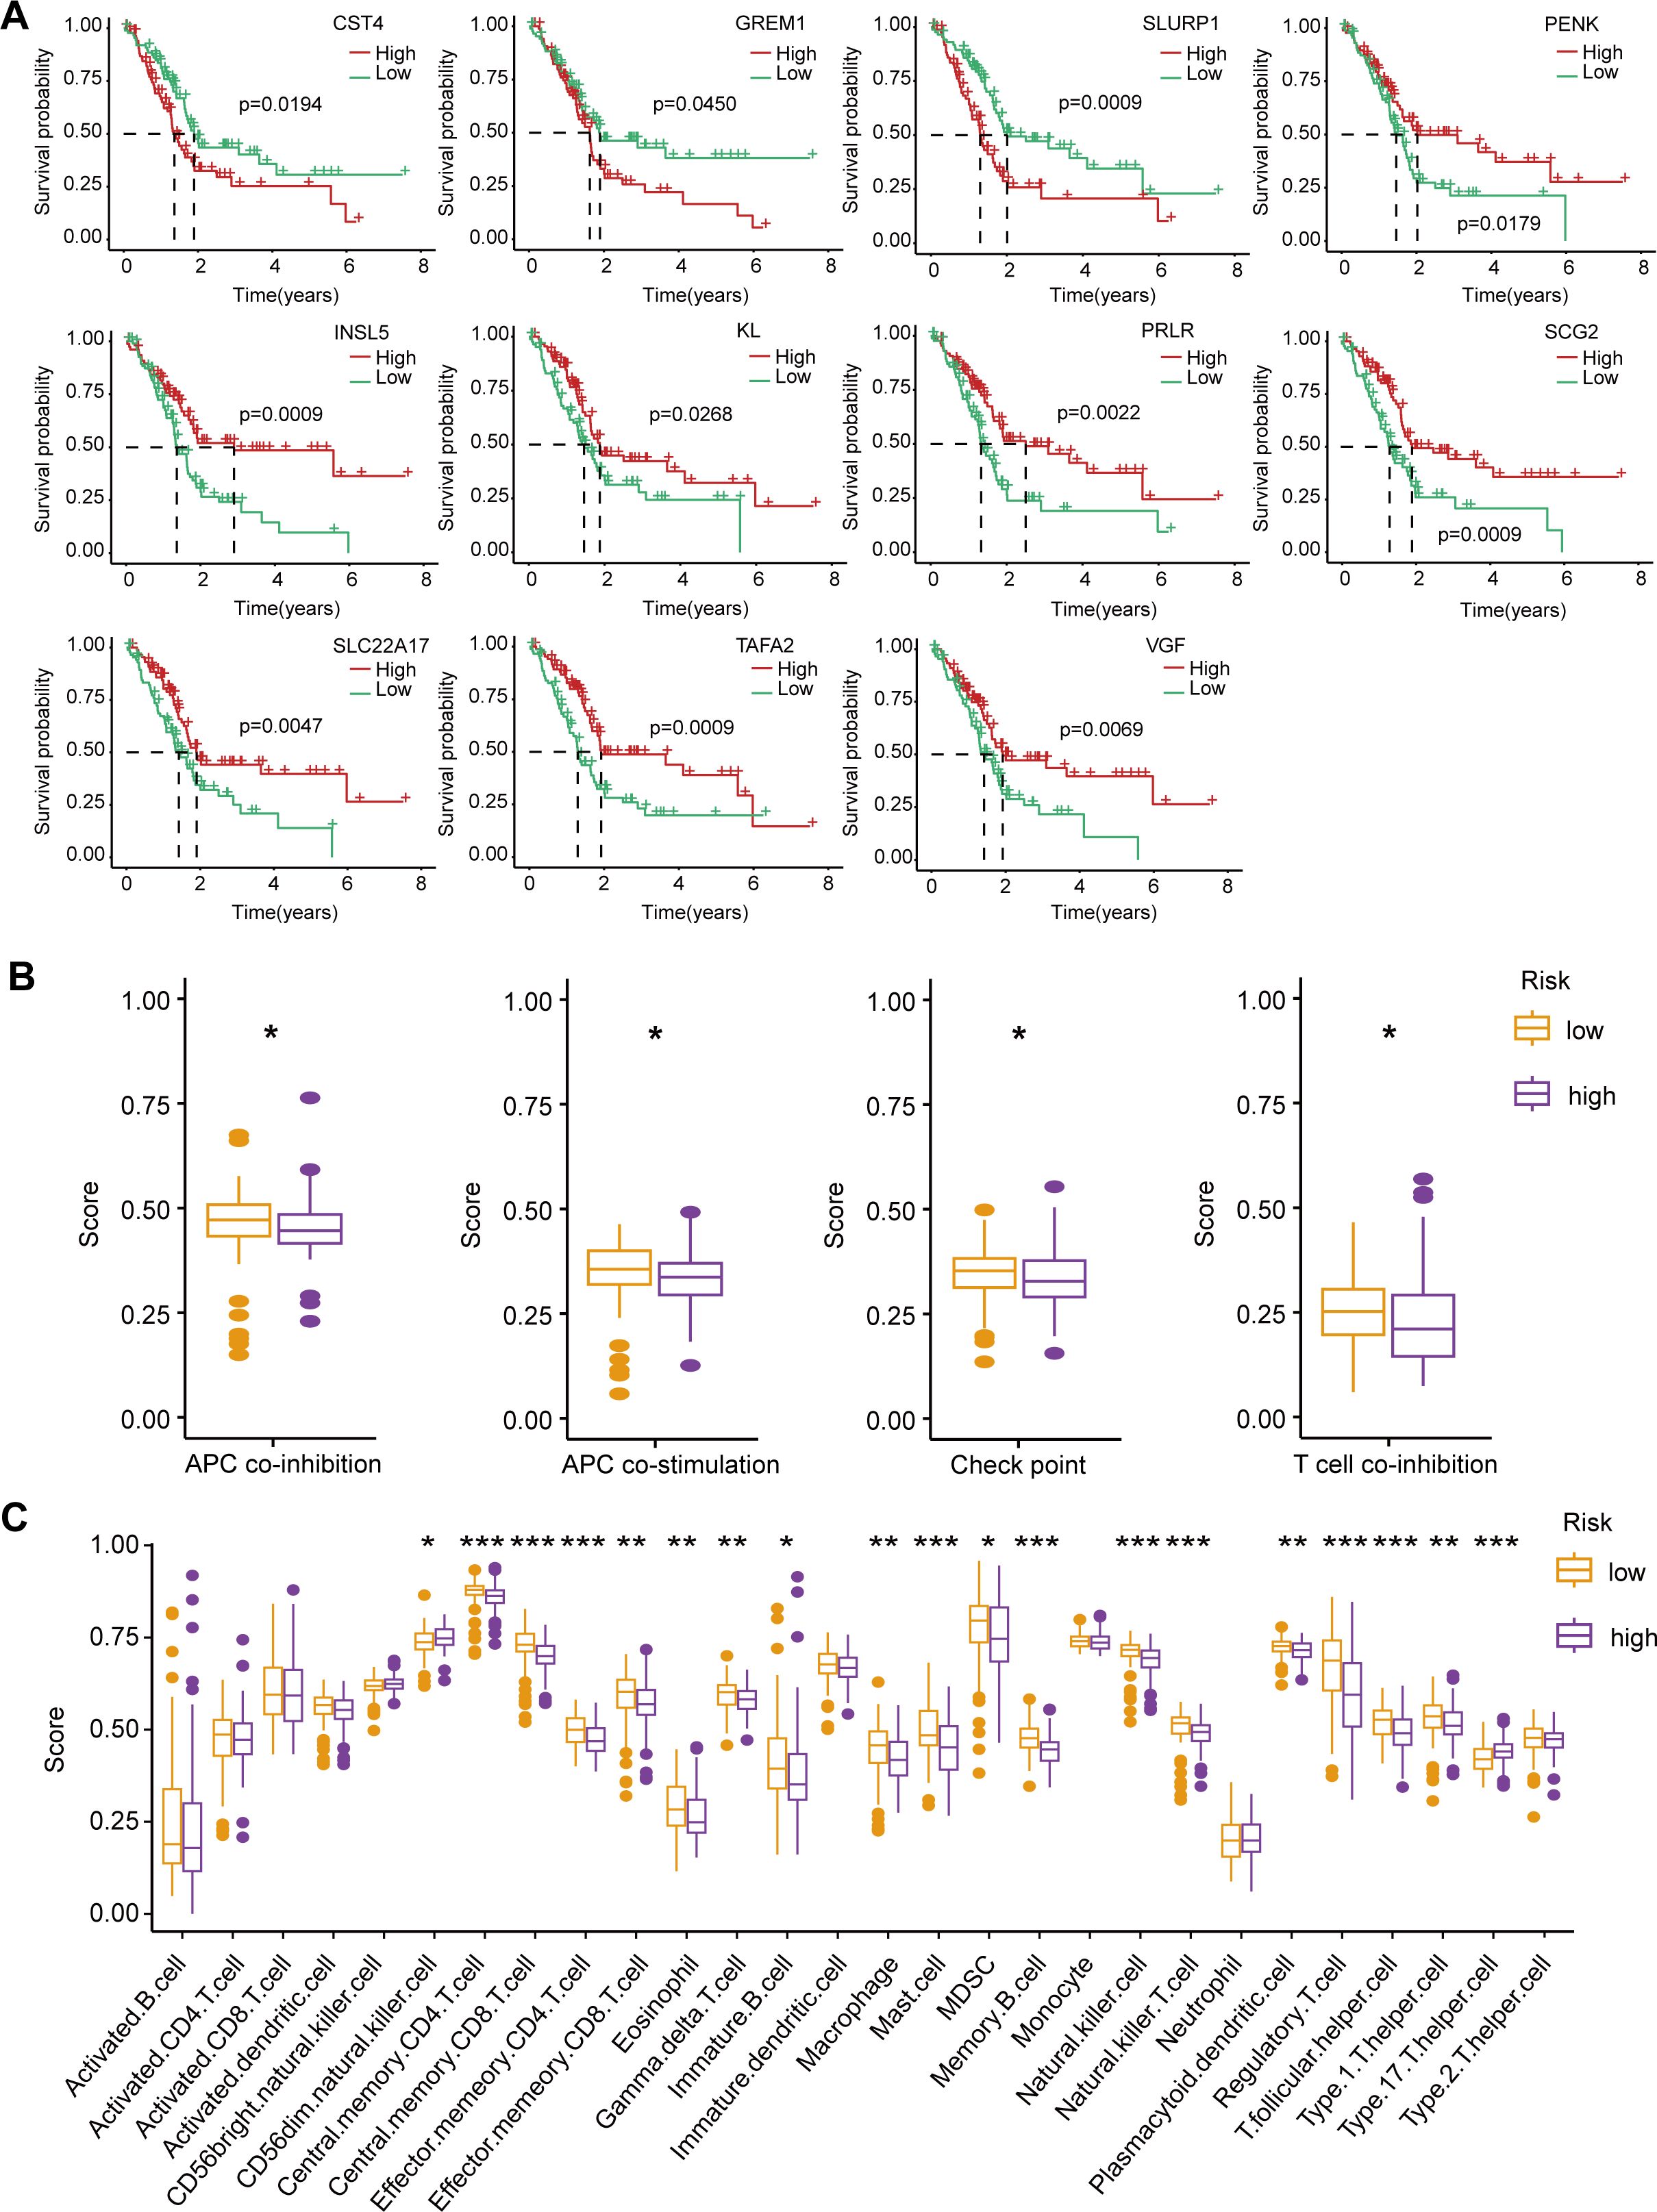
Figure 5. Survival analysis of immune-related DEGs, immune function, and immune infiltration differences between high-risk and low-risk PAAD patients. (A) Kaplan-Meier survival curves for 11 immune-related DEGs significantly associated with OS in PAAD patients. (B) Comparison of immune function scores between high-risk (purple) and low-risk (orange) groups. (C) Immune cell infiltration scores comparing high-risk and low-risk groups. *p < 0.05; **p < 0.01; ***p < 0.001.
Immune infiltration analysis revealed a significant increase in CD56 dim natural killer cells and type 17 T helper cells in the high-risk group, potentially leading to a stronger pro-inflammatory response and an immune escape environment that accelerates malignant progression of tumors. In contrast, in the low-risk group, central memory CD4/CD8 T cells, effector memory CD4/CD8 T cells, eosinophils, gamma delta T cells, immature B cells, macrophages, mast cells, myeloid suppressor cells (MDSC), memory B cells, natural killer cells, natural killer T cells, plasmacytoid dendritic cells, regulatory T cells, and T follicular helpers) cell and type 1 T helper cells were more infiltrated (Figure 5C). These enhanced infiltrations of memory and effector immune cells, along with moderate immunomodulatory mechanisms, help suppress tumor progression and maintain anti-tumor immune surveillance.
Overall, the high and low risk groups showed significant differences in immune function and immune cell infiltration. In the high-risk group, an increase in pro-inflammatory immune cells may lead to a more aggressive tumor microenvironment; In the low-risk group, moderate immune balance and diversified immune cell infiltration may contribute to tumor suppression. These results provide important clues for understanding the immune microenvironment of PAAD and its impact on patient prognosis, and may provide a basis for personalized immunotherapy for PAAD patients.
Analysis of individualized treatment for PAAD
Many studies have shown that patients with high expression levels of CD274 or CTLA4 may benefit more from immunotherapy (12, 13). Based on the above analysis of immune characteristics and tumor microenvironment in the high and low risk group of PAAD patients, we further investigated the differences of CD274 and CTLA4, two important immune checkpoint molecules, between the high and low risk groups. We observed significant differences in the expression of CD274 and CTLA4 in the high-low risk group, and the expression of CD274 and CTLA4 in the low-risk group was higher than that in the high-risk group (Figures 6A, B). This suggests that the low-risk group may have a relatively mild immune microenvironment compared to the high-risk group, rather than an overactivated pro-inflammatory environment. The high expression of CD274 and CTLA4 can reduce the overreaction of the immune system, thereby inhibiting the release of pro-inflammatory cytokines, and may help delay the malignant progression of tumors. At the same time, we also made TIDE predictions. The results showed that TIDE scores were higher in the low-risk group than in the high-risk group, with higher TIDE scores generally indicating a stronger immune escape capacity and a poorer response to immunotherapy (Figure 6C). However, the high TIDE score in patients in the low-risk group may be mainly caused by high expression of CD274 and CTLA4, and the expression of this immune checkpoint is targetable. Therefore, a high TIDE score in the low-risk group is not necessarily a marker of a malignant prognosis, but may instead mean that these patients are more sensitive to CD274 or CTLA4 inhibitors.
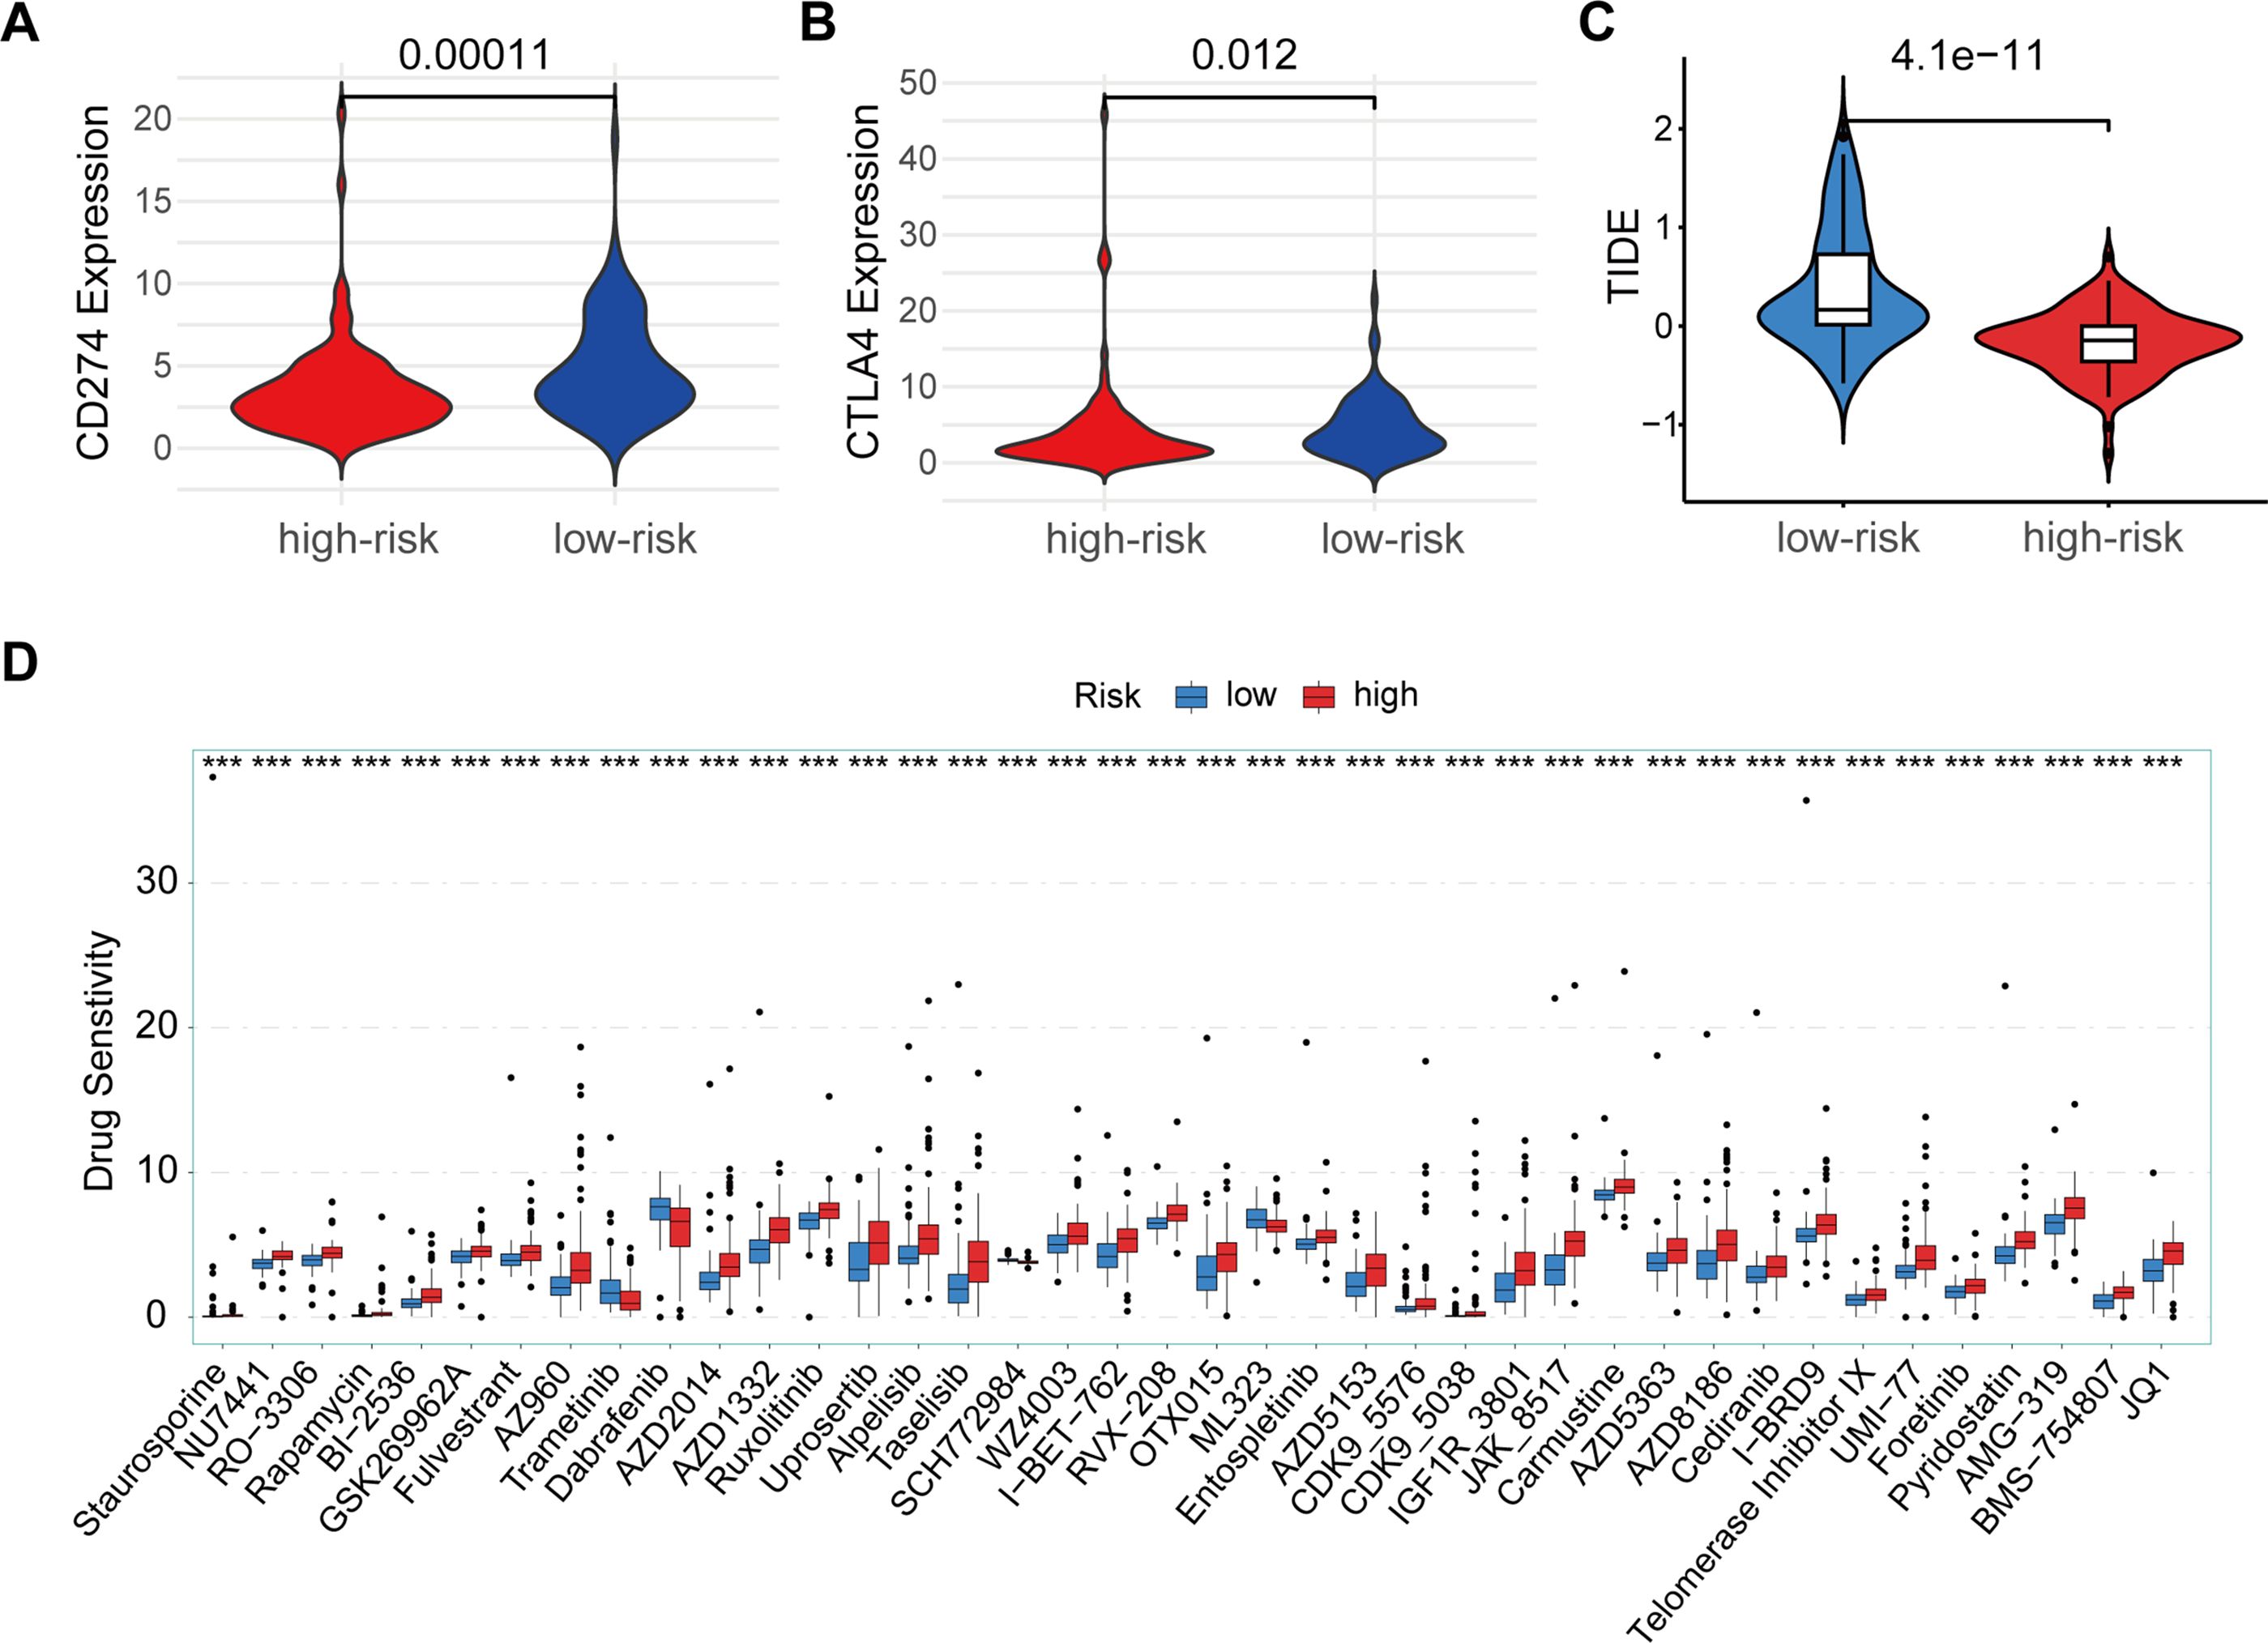
Figure 6. Immune checkpoint and drug sensitivity analysis. (A) Comparison of CD274 expression between high-risk (red) and low-risk (blue) groups. (B) Comparison of CTLA4 expression between high-risk (red) and low-risk (blue) groups. (C) TIDE scores between low-risk (blue) and high-risk (red) groups. (D) Drug sensitivity analysis between high-risk (red) and low-risk (blue) groups across multiple anti-cancer drugs. ***p < 0.001.
In addition, we assessed differences in sensitivity to multiple antineoplastic drugs in high-low risk groups (Figure 6D). The results showed that patients in the high-risk group had a high sensitivity to Trametinib, Dabrafenib, SCH772984, ML323, indicating that patients in the high-risk group were more sensitive to these chemotherapy agents, suggesting that PAAD patients in the high-risk group may benefit more from these drugs. In contrast, high-risk patients were insensitive to drugs such as Staurosporine, NU7441, O-3306, Rapamycin, BI-2536, GSK269962A, Fuverastine, AZ960, AZD2014, AZD1332, Rusolitinib, Uprosertib, Alpelisib, Taselisib, WA4003, I-BET-762, RVX-208, OTX015, Entospletinib, AZD5153, CDK9-5576, CDK9-5038, IGF1R-3801, JAK-8517, Carmustine, AZD5363, AZD8186, Cediranib, I-BRD9, telomerase Inhibitor IX, Uni-77, Foretinib, Pyridostatin, AMG-319, BMS-754807, and JQ1. The difference in sensitivity between different drugs further highlights the significant differences in tumor microenvironment and biology between the high and low risk groups, and also suggests potential directions in individualized treatment options.
Overall, there were significant differences in immune checkpoint gene expression, immune escape ability, drug sensitivity, and immune function and infiltrating cells in the high and low risk groups for PAAD. These differences not only deepen our understanding of the immune microenvironment of PAAD, but also provide a valuable basis for personalized immunotherapy. Future studies should further explore the practical application value of these immune features in patients with PAAD, with a view to optimizing the treatment of patients and improving the treatment effect and survival rate of PAAD.
Discussion
This study offers valuable insights into the mechanisms underlying RT resistance and the immune microenvironment of PAAD, as well as the implications of these factors for personalized treatment strategies. By constructing a robust prognostic scoring model, validated across multiple GEO datasets, we identified a clear distinction in survival outcomes between high-risk and low-risk PAAD patients. The risk model, developed based on differential gene expression profiles in response to RT, effectively stratifies patients and demonstrates strong predictive performance, with higher risk scores correlating with poorer survival outcomes.
Pancreatic cancer is not the most common type of cancer, but it is of great concern because of its high fatality rate (14, 15). To improve prognostic survival for pancreatic cancer, there is an urgent need to find strong biomarkers for patients. In this study, we constructed a reliable RT prognosis scoring model based on a publicly available GEO dataset. In the TCGA training session, we confirmed the clinical value of this model. In addition, our RT prognosis scoring model was demonstrated to have reliable predictive power in three separate datasets (GEO28735, GEO62452, and GEO57495). To confirm the association between RT and genes associated with RT prognosis, we are conducting further functional studies. PAAD patients were grouped by a scoring model, and this combination of genes helps predict patients’ RT outcomes and may serve as an indicator for assessing RT response.
In clinical applications, RT is the primary treatment for PAAD, but its efficacy is limited by the heterogeneity of patient response. By dividing patients into those who respond well to RT and those who do not, side effects can be reduced and the recurrence of surviving cancer cells can be inhibited, a promising treatment strategy. However, RT showed a heterogeneous response in different PAAD patients, suggesting that patients’ immune microenvironment may influence their sensitivity to RT. Our findings highlight the significant heterogeneity in tumor biology and immune response between high- and low-risk PAAD groups. In high-risk patients, the up-regulation of genes associated with immune response and cell differentiation suggests an immune microenvironment that may facilitate tumor progression and immune escape. This pro-inflammatory environment, indicated by increased infiltration of CD56 dim natural killer cells and type 17 T helper cells. The increase of NK cells and Th17 cells in tumor tissue tends to release more pro-inflammatory factors, further promoting the inflammatory response (16, 17). This inflammatory state may make tumors more aggressive, as inflammation plays an important role in cancer progression, often associated with cancer cell proliferation, invasion, angiogenesis, and so on (18, 19). This pro-inflammatory environment is consistent with the aggressive nature of pancreatic cancer, which is often resistant to conventional treatments, including radiation (20, 21). Conversely, low-risk patients showed enriched immune functions such as APC co-stimulation, immune checkpoint, and T-cell co-inhibition. High score of co-stimulation and co-inhibitory in APC indicates increased activity in antigen presentation and immune response regulation (22). This means that the immune system of these patients is more inclined to engage in anti-tumor activity and may be more likely to recognize and respond to tumor antigens. High immune checkpoint score is often part of immune escape, but in the low-risk group of patients, this may be because the immune system is still effectively trying to regulate and attack tumor cells, and this regulation can be maintained with a low disease burden (23). The high score of T cell co-inhibition may indicate that although T cells are activated, their activity is suppressed to a certain extent due to the existence of regulatory mechanisms (22, 24). This may be the case in the low-risk group to balance the anti-tumor immune response and prevent an excessive immune response that leads to tissue damage. This suggesting a more balanced immune microenvironment capable of anti-tumor response without excessive inflammation (21, 25).
The differences in immune cell infiltration and immune checkpoint gene expression between high- and low-risk groups underscore the need for tailored immunotherapy strategies. CD274, also known as PD-L1 (Programmed Death-Ligand 1), is an important immune checkpoint molecule in immune system regulation (26). It plays a key role in the immune escape mechanism of tumors. CD274/PD-L1 is expressed in many types of tumors and inhibits T cell activity through interaction with its receptor, PD-1, thereby helping tumor cells evade host immune surveillance (27, 28). Tumor cells often overexpress PD-L1 to evade attack by the immune system (29). This immune escape mechanism helps tumor cells survive and spread in the body, making PD-L1 expression levels associated with poorer prognosis in many tumor types (30). PD-L1 expression is generally not limited to tumor cells, but can also be expressed in some immune cells in the tumor microenvironment, such as macrophages and dendritic cells (31–33). This expression plays an auxiliary role in regulating the immunosuppressive state of the tumor microenvironment, thereby reducing the immune attack of the entire microenvironment on tumor cells (34). CTLA4 is another key immune checkpoint molecule. CTLA4 is mainly expressed in activated T cells and regulatory T cells (35–38). When T cells are activated by antigen stimulation, CTLA4 binds to its ligands B7-1 (CD80) and B7-2 (CD86) to transmit inhibitory signals, thereby reducing T cell activation and proliferation (39). This process helps prevent the immune system from overreacting and protects the body’s tissues from excessive inflammation and autoimmune damage (40).
The higher expression of CD274 and CTLA4 in low-risk patients suggests that they may benefit more from immune checkpoint inhibitors, as these molecules help regulate immune response and prevent the release of excessive pro-inflammatory cytokines, thereby potentially limiting tumor progression. Interestingly, the TIDE score analysis further supports this possibility, indicating that while low-risk patients show a higher immune escape potential, their immune profile could still be targeted with CD274 or CTLA4 inhibitors.
Additionally, our analysis of drug sensitivity differences across risk groups provides practical implications for chemotherapy choices. High-risk PAAD patients demonstrated higher sensitivity to drugs like Trametinib, Dabrafenib, SCH772984, and ML323, suggesting that these agents could be prioritized in treatment plans for these patients. On the other hand, the insensitivity of high-risk patients to a range of other drugs further underscores the need for more effective, targeted therapies that consider the unique tumor microenvironmental features of each risk group.
This study presents a framework for personalized treatment in PAAD, with specific emphasis on understanding immune and biological characteristics to guide therapy. By integrating gene expression data, immune characteristics, and drug response profiles, this study not only provides a basis for tailored therapy but also contributes to the broader goal of improving outcomes for PAAD patients. Future research should aim to validate these findings in larger, prospective cohorts and further investigate the potential of using immune-related biomarkers to predict responses to immunotherapy, with the ultimate objective of optimizing treatment and improving survival rates in PAAD.
Data availability statement
The original contributions presented in the study are included in the article/Supplementary Material. Further inquiries can be directed to the corresponding authors.
Ethics statement
Ethical approval was not required for the studies involving humans because The study used publicly available TCGA and GEO databases, so no additional ethical approval was required. The studies were conducted in accordance with the local legislation and institutional requirements. Written informed consent for participation was not required from the participants or the participants’ legal guardians/next of kin in accordance with the national legislation and institutional requirements because The study used publicly available TCGA and GEO databases, so no additional informed consent was required.
Author contributions
DD: Writing – review & editing. SW: Data curation, Writing – original draft. JL: Writing – review & editing, Data curation, Methodology. YZ: Writing – review & editing.
Funding
The author(s) declare that no financial support was received for the research, authorship, and/or publication of this article.
Conflict of interest
The authors declare that the research was conducted in the absence of any commercial or financial relationships that could be construed as a potential conflict of interest.
Generative AI statement
The author(s) declare that no Generative AI was used in the creation of this manuscript.
Publisher’s note
All claims expressed in this article are solely those of the authors and do not necessarily represent those of their affiliated organizations, or those of the publisher, the editors and the reviewers. Any product that may be evaluated in this article, or claim that may be made by its manufacturer, is not guaranteed or endorsed by the publisher.
Supplementary material
The Supplementary Material for this article can be found online at: https://www.frontiersin.org/articles/10.3389/fimmu.2025.1524798/full#supplementary-material
Supplementary Figure 1 | Kaplan-Meier survival curves for PAAD patients based on the expression of key genes. (A) Survival probability for patients stratified by ATP8B2 expression. Patients in the high-risk group (red line) showed significantly lower survival probability compared to those in the low-risk group (green line), with a p-value of 0.0069. (B) Survival probability for patients stratified by GREM1 expression. High-risk patients (red line) exhibited lower survival probability than low-risk patients (green line), with a p-value of 0.0450. (C) Survival probability for patients stratified by TAFA2 expression. The high-risk group (red line) demonstrated a significantly reduced survival probability relative to the low-risk group (green line), with a p-value of 0.0009.
Supplementary Figure 2 | Comparison of risk scores in PAAD patients based on gender and tumor stage. (A) Distribution of risk scores between male and female patients. There was no significant difference in risk scores between genders (ns indicates non-significant). (B) Distribution of risk scores between patients with early-stage (T1 & T2) and advanced-stage (T3 & T4) tumors. No significant difference in risk scores was observed between these stages (ns indicates non-significant).
Supplementary Figure 3 | Expression of 10 risk genes in radiation-resistant pancreatic cancer cells. (A) The relative expression of POSTN. (B) The relative expression of TAFA2. (C) The relative expression of ADAMTS12. (D) The relative expression of AKR1C2. (E) The relative expression of ATP8B2. (F) The relative expression of CCN4. (G) The relative expression of CTHRC1. (H) The relative expression of GREM1. (I) The relative expression of P3H3. (J) The relative expression of PAPPA. IR: Ionizing radiation. *p < 0.05; **p < 0.01.
Supplementary Figure 4 | Comparison of risk scores in PAAD patients based on gender and tumor stage. (A) Distribution of risk scores between male and female patients. There was no significant difference in risk scores between genders (ns indicates non-significant). (B) Distribution of risk scores between patients with early-stage (T1 & T2) and advanced-stage (T3 & T4) tumors. No significant difference in risk scores was observed between these stages (ns indicates non-significant).
Supplementary Table 1 | Differential expression of GSE179351 gene before and after radiotherapy.
Supplementary Table 2 | Differential expression of GSE179351 gene before and after radiotherapy.
References
1. Hu JX, Zhao CF, Chen WB, Liu QC, Li QW, Lin YY, et al. Pancreatic cancer: A review of epidemiology, trend, and risk factors. World J gastroenterol. (2021) 27:4298–321. doi: 10.3748/wjg.v27.i27.4298
2. Partyka O, Pajewska M, Kwaśniewska D, Czerw A, Deptała A, Budzik M, et al. Overview of pancreatic cancer epidemiology in europe and recommendations for screening in high-risk populations. Cancers. (2023) 15(14):3634. doi: 10.3390/cancers15143634
3. Health Commission Of The People’s Republic Of China N. National guidelines for diagnosis and treatment of pancreatic cancer 2022 in China (English version). Chin J Cancer Res = Chung-kuo yen cheng yen chiu. (2022) 34:238–55. doi: 10.21147/j.issn.1000-9604.2022.03.05
4. Siegel RL, Miller KD, Wagle NS, Jemal A. Cancer statistics, 2023. CA: Cancer J Clin. (2023) 73:17–48. doi: 10.3322/caac.21763
5. Schepis T, De Lucia SS, Pellegrino A, Del Gaudio A, Maresca R, Coppola G, et al. State-of-the-art and upcoming innovations in pancreatic cancer care: A step forward to precision medicine. Cancers. (2023) 15(13):3423. doi: 10.3390/cancers15133423
6. Garajová I, Peroni M, Gelsomino F, Leonardi F. A simple overview of pancreatic cancer treatment for clinical oncologists. Curr Oncol (Toronto Ont). (2023) 30:9587–601. doi: 10.3390/curroncol30110694
7. Falco M, Masojć B, Sulikowski T. Radiotherapy in pancreatic cancer: to whom, when, and how? Cancers. (2023) 15(13):3382. doi: 10.3390/cancers15133382
8. Bazeed AY, Day CM, Garg S. Pancreatic cancer: challenges and opportunities in locoregional therapies. Cancers. (2022) 14(17):4257. doi: 10.3390/cancers14174257
9. Fiore M, Coppola A, Petrianni GM, Trecca P, D’Ercole G, Cimini P, et al. Advances in pre-treatment evaluation of pancreatic ductal adenocarcinoma: a narrative review. J gastrointestinal Oncol. (2023) 14:1114–30. doi: 10.21037/jgo-22-1034
10. Wang Q, Shao X, Zhang Y, Zhu M, Wang FXC, Mu J, et al. Role of tumor microenvironment in cancer progression and therapeutic strategy. Cancer Med. (2023) 12:11149–65. doi: 10.1002/cam4.v12.10
11. Charoentong P, Finotello F, Angelova M, Mayer C, Efremova M, Rieder D, et al. Pan-cancer immunogenomic analyses reveal genotype-immunophenotype relationships and predictors of response to checkpoint blockade. Cell Rep. (2017) 18:248–62. doi: 10.1016/j.celrep.2016.12.019
12. Krishnamurthy N, Nishizaki D, Lippman SM, Miyashita H, Nesline MK, Pabla S, et al. High CTLA-4 transcriptomic expression correlates with high expression of other checkpoints and with immunotherapy outcome. Ther Adv Med Oncol. (2024) 16:17588359231220510. doi: 10.1177/17588359231220510
13. Feng GS, Hanley KL, Liang Y, Lin X. Improving the efficacy of liver cancer immunotherapy: the power of combined preclinical and clinical studies. Hepatol (Baltimore Md). (2021) 73 Suppl 1:104–14. doi: 10.1002/hep.31479
14. Stoffel EM, Brand RE, Goggins M. Pancreatic cancer: changing epidemiology and new approaches to risk assessment, early detection, and prevention. Gastroenterology. (2023) 164:752–65. doi: 10.1053/j.gastro.2023.02.012
15. Lin L, Li Z, Yan L, Liu Y, Yang H, Li H. Global, regional, and national cancer incidence and death for 29 cancer groups in 2019 and trends analysis of the global cancer burden, 1990-2019. J Hematol Oncol. (2021) 14:197. doi: 10.1186/s13045-021-01213-z
16. Marques HS, de Brito BB, da Silva FAF, Santos MLC, de Souza JCB, Correia TML, et al. Relationship between Th17 immune response and cancer. World J Clin Oncol. (2021) 12:845–67. doi: 10.5306/wjco.v12.i10.845
17. Zhao H, Wu L, Yan G, Chen Y, Zhou M, Wu Y, et al. Inflammation and tumor progression: signaling pathways and targeted intervention. Signal transduction targeted Ther. (2021) 6:263. doi: 10.1038/s41392-021-00658-5
18. Coussens LM, Werb Z. Inflammation and cancer. Nature. (2002) 420:860–7. doi: 10.1038/nature01322
19. Caronni N, La Terza F, Vittoria FM, Barbiera G, Mezzanzanica L, Cuzzola V, et al. IL-1β(+) macrophages fuel pathogenic inflammation in pancreatic cancer. Nature. (2023) 623:415–22. doi: 10.1038/s41586-023-06685-2
20. Walle T, Kraske JA, Liao B, Lenoir B, Timke C, von Bohlen Und Halbach E, et al. Radiotherapy orchestrates natural killer cell dependent antitumor immune responses through CXCL8. Sci Adv. (2022) 8:eabh4050. doi: 10.1126/sciadv.abh4050
21. Fincham REA, Delvecchio FR, Goulart MR, Yeong JPS, Kocher HM. Natural killer cells in pancreatic cancer stroma. World J gastroenterol. (2021) 27:3483–501. doi: 10.3748/wjg.v27.i24.3483
22. Zhang Q, Vignali DA. Co-stimulatory and co-inhibitory pathways in autoimmunity. Immunity. (2016) 44:1034–51. doi: 10.1016/j.immuni.2016.04.017
23. Lao Y, Shen D, Zhang W, He R, Jiang M. Immune checkpoint inhibitors in cancer therapy-how to overcome drug resistance? Cancers. (2022) 14(15):3575. doi: 10.3390/cancers14153575
24. Goronzy JJ, Weyand CM. T-cell co-stimulatory pathways in autoimmunity. Arthritis Res Ther. (2008) 10 Suppl 1:S3. doi: 10.1186/ar2414
25. Dammeijer F, Lau SP, van Eijck CHJ, van der Burg SH, Aerts J. Rationally combining immunotherapies to improve efficacy of immune checkpoint blockade in solid tumors. Cytokine Growth factor Rev. (2017) 36:5–15. doi: 10.1016/j.cytogfr.2017.06.011
26. Herbst RS, Soria JC, Kowanetz M, Fine GD, Hamid O, Gordon MS, et al. Predictive correlates of response to the anti-PD-L1 antibody MPDL3280A in cancer patients. Nature. (2014) 515:563–7. doi: 10.1038/nature14011
27. Cha JH, Chan LC, Li CW, Hsu JL, Hung MC. Mechanisms controlling PD-L1 expression in cancer. Mol Cell. (2019) 76:359–70. doi: 10.1016/j.molcel.2019.09.030
28. Cui JW, Li Y, Yang Y, Yang HK, Dong JM, Xiao ZH, et al. Tumor immunotherapy resistance: Revealing the mechanism of PD-1/PD-L1-mediated tumor immune escape. Biomedicine pharmacotherapy = Biomedecine pharmacotherapie. (2024) 171:116203. doi: 10.1016/j.biopha.2024.116203
29. Tao B, Shi J, Shuai S, Zhou H, Zhang H, Li B, et al. CYB561D2 up-regulation activates STAT3 to induce immunosuppression and aggression in gliomas. J Trans Med. (2021) 19:338. doi: 10.1186/s12967-021-02987-z
30. Yi M, Zheng X, Niu M, Zhu S, Ge H, Wu K. Combination strategies with PD-1/PD-L1 blockade: current advances and future directions. Mol cancer. (2022) 21:28. doi: 10.1186/s12943-021-01489-2
31. Mulder K, Patel AA, Kong WT, Piot C, Halitzki E, Dunsmore G, et al. Cross-tissue single-cell landscape of human monocytes and macrophages in health and disease. Immunity. (2021) 54:1883–900.e5. doi: 10.1016/j.immuni.2021.07.007
32. Tumeh PC, Harview CL, Yearley JH, Shintaku IP, Taylor EJ, Robert L, et al. PD-1 blockade induces responses by inhibiting adaptive immune resistance. Nature. (2014) 515:568–71. doi: 10.1038/nature13954
33. Hou J, Zhao R, Xia W, Chang CW, You Y, Hsu JM, et al. PD-L1-mediated gasdermin C expression switches apoptosis to pyroptosis in cancer cells and facilitates tumor necrosis. Nat Cell Biol. (2020) 22:1264–75. doi: 10.1038/s41556-020-0575-z
34. Chu X, Tian W, Ning J, Xiao G, Zhou Y, Wang Z, et al. Cancer stem cells: advances in knowledge and implications for cancer therapy. Signal transduction targeted Ther. (2024) 9:170. doi: 10.1038/s41392-024-01851-y
35. Kamada T, Togashi Y, Tay C, Ha D, Sasaki A, Nakamura Y, et al. PD-1(+) regulatory T cells amplified by PD-1 blockade promote hyperprogression of cancer. Proc Natl Acad Sci United States America. (2019) 116:9999–10008. doi: 10.1073/pnas.1822001116
36. Ahmed A, Joseph AM, Zhou J, Horn V, Uddin J, Lyu M, et al. CTLA-4-expressing ILC3s restrain interleukin-23-mediated inflammation. Nature. (2024) 630(8018):976–83. doi: 10.1038/s41586-024-07537-3
37. Tekguc M, Wing JB, Osaki M, Long J, Sakaguchi S. Treg-expressed CTLA-4 depletes CD80/CD86 by trogocytosis, releasing free PD-L1 on antigen-presenting cells. Proc Natl Acad Sci United States America. (2021) 118(30):e2023739118. doi: 10.1073/pnas.2023739118
38. Liu Z, Zheng N, Li J, Li C, Zheng D, Jiang X, et al. N6-methyladenosine-modified circular RNA QSOX1 promotes colorectal cancer resistance to anti-CTLA-4 therapy through induction of intratumoral regulatory T cells. Drug resistance updates: Rev commentaries antimicrobial Anticancer chemotherapy. (2022) 65:100886. doi: 10.1016/j.drup.2022.100886
39. Babamohamadi M, Mohammadi N, Faryadi E, Haddadi M, Merati A, Ghobadinezhad F, et al. Anti-CTLA-4 nanobody as a promising approach in cancer immunotherapy. Cell Death disease. (2024) 15:17. doi: 10.1038/s41419-023-06391-x
Keywords: pancreatic cancer, radiotherapy resistance, prognostic scoring model, immune microenvironment, personalized immunotherapy
Citation: Dai D, Wang S, Li J and Zhao Y (2025) Exploring radiation resistance-related genes in pancreatic cancer and their impact on patient prognosis and treatment. Front. Immunol. 16:1524798. doi: 10.3389/fimmu.2025.1524798
Received: 08 November 2024; Accepted: 10 February 2025;
Published: 03 March 2025.
Edited by:
Zodwa Dlamini, Pan African Cancer Research Institute (PACRI), South AfricaReviewed by:
Yong Zhang, The Second Affiliated Hospital of Xi’an Jiaotong University, ChinaXin Yu, Baylor College of Medicine, United States
Copyright © 2025 Dai, Wang, Li and Zhao. This is an open-access article distributed under the terms of the Creative Commons Attribution License (CC BY). The use, distribution or reproduction in other forums is permitted, provided the original author(s) and the copyright owner(s) are credited and that the original publication in this journal is cited, in accordance with accepted academic practice. No use, distribution or reproduction is permitted which does not comply with these terms.
*Correspondence: Yu Zhao, emhhb3l1QGlybS1jYW1zLmFjLmNu; Sen Wang, d2FuZ3NlbkBpcm0tY2Ftcy5hYy5jbg==
†These authors have contributed equally to this work and share first authorship