 Janis Lungevics
 Ernests Jansons1
 Igor Velkavrh
- 1Department of Mechanical Engineering and Mechatronic, Riga Technical University, Riga, Latvia
- 2V-Research GmbH, Dornbirn, Austria
A surface texture can be subdivided into three categories based on the magnitude of its wavelengths, i.e., macro-geometrical form, waviness, and roughness (from largest to smallest). Together, these components define how a surface will interact with the opposing surface. In most ice tribology studies, <2% of the entire sample surface is topographically analyzed. Although such a small percentage of the entire surface area generally provides statistically relevant information, the missing information about the texture complexity on a larger scale might reduce the possibility of accurately explaining the resulting tribological behavior. The purpose of this study was to review the existing surface measurement methods related to ice tribology and to present a holistic approach towards surface topography measurements for ice tribology applications. With the holistic surface measurement approach, the entire sample surfaces are scanned, and the measured data is analyzed on different magnitude levels. The discussed approach was applied to sandblasted steel samples which were afterward tested on two different ice tribometers. The experimental results showed that additional information about the sample surface topography enabled a better understanding of the ice friction mechanisms and allowed for a more straightforward correlation between the sample surface topography and its ice friction response.
Introduction
Motion between solid objects and ice is one of the most complex tribological systems. This is due to the many influencing factors, which define the properties of the liquid-like layer (LLL) on ice such as ambient temperature and humidity, sliding velocity, the contact area between the sliding object and ice, the roughness and wettability of the sliding object, the texture, and hardness of ice, etc. Scientists are continuously seeking a better understanding of this highly unstable process, but the various mutually related variables and demanding experimental execution make it a very challenging task.
Among the most influencing and at the same time least understood factors are the properties of the LLL. Its thickness is still largely unknown even for static systems, while for dynamic systems it is additionally influenced by the motion dynamics and sliding surface texture and thus even more difficult to estimate. Despite the mentioned obstacles, effective experimental work with various types of laboratory equipment has already been performed over a wide range of sliding velocities (Bäurle et al., 2007; Rohm et al., 2015; Hasler et al., 2016; Scherge et al., 2018; Ripamonti et al., 2020; Liefferink et al., 2021), as well as variations applied loads (Scherge et al., 2013).
To improve our understanding of ice friction, reliable information about the interactions between the sample, ice and LLL are necessary. There is a general agreement among scientists that the topography of sliding body and ice play a significant role in the ice friction process (Ducret et al., 2005; Bäurle et al., 2007; Kietzig et al., 2009; Kietzig et al., 2010b; Sukhorukov and Marchenko, 2014; Rohm et al., 2015; Spagni et al., 2016; Liefferink et al., 2021). This was already described in different experimental studies (Ducret et al., 2005; Rohm et al., 2015; Jansons et al., 2016; Spagni et al., 2016; Jansons et al., 2018; Liefferink et al., 2021). However, it is still not clear how the surface topography influences the ice friction process, especially if different loads are applied. In some studies, for simplification purposes, the surface is considered perfectly smooth, which distracts from the true process essence. In some cases, the surface topography is analyzed using a measurement from a tiny fraction (<1%) of the whole sample surface. Typically, surface topography measurements are followed by several filtration operations that extract roughness components from the primarily measured texture. Of course, even the measurement of a small fraction of the entire surface provides valuable information, but the whole texture complexity cannot be evaluated if not measured correspondingly. To analyze the interactions between object surfaces and ice in more detail, the geometrical form and waviness of the sliding object should be considered as well, because only a combination of these three components can provide reliable information about the true contact area.
Another issue in topography analysis is the selection of the most appropriate topography parameters. For example, it can be easily pictured how the surface asperities will penetrate the ice surface (Figure 1A) if a rough surface is put on ice or that small dimples on a flat surface might work as reservoirs for melted water (Figure 1B). Such principally different surfaces might have the same Arithmetical mean height parameter values (Sa or Ra), although the actual texture and its functionality are significantly different. This means that additional information is necessary to explain how such textures will perform in tribological contacts.
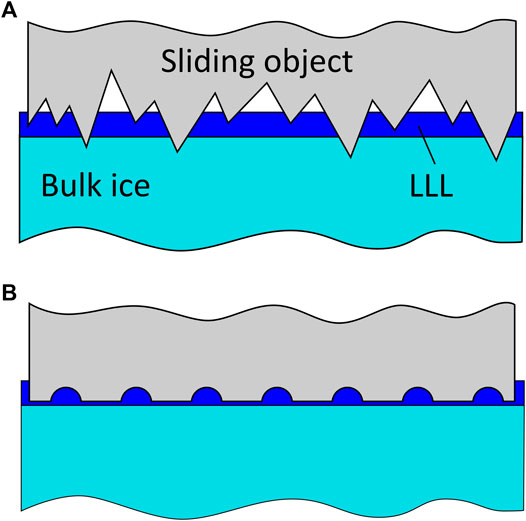
FIGURE 1. Schematic representation of an interaction between a sliding object and ice: (A) object has sharp asperities; (B) object has small dimples. For both cases, the common surface roughness parameters such as Sa or Ra might have the same value, but on ice these surfaces will perform very different.
The purpose of this paper is to review the existing surface characterization methods, analyzed parameters, and equipment, used in the field of ice tribology. Along with this review, the authors provide some ideas on how ice tribology surfaces could be characterized in further research for more detailed information about surface topography and texture. The proposed measurement approach could help towards a better understanding of the complex ice friction process—not only in the specific experimental setups used in the present study but also in other applications related to ice and snow tribology.
Literature Review
Previously Used Surface Texture Measurement Methods in the Field of Ice Tribology
The existing ice and snow friction studies provide different approaches to surface texture measurements and analyses. The most common are non-contact profilometry (Bäurle et al., 2007; Kietzig et al., 2009; Kietzig et al., 2010b; Rohm et al., 2015; Scherge et al., 2018; Ripamonti et al., 2020; Liefferink et al., 2021), contact profilometry (Sukhorukov and Marchenko, 2014; Jansons et al., 2016; Spagni et al., 2016), scanning electron microscopy, SEM (Ducret et al., 2005; Bäurle et al., 2007; Kietzig et al., 2009; Kietzig et al., 2011; Ling et al., 2016; Ripamonti et al., 2020), optical microscopy (Rohm et al., 2015; Ling et al., 2016) and atomic force microscopy, AFM (Scherge et al., 2013). All these methods provide useful information about the surface topography, for example, SEM provides a high depth-of-field image of small surface details, such as asperity tips, scratch mark pileups, laser-texturing quality, surface polishing, etc. Optical images offer a time-efficient overview of the surface quality, while non-contact profilometry provides detailed 3D information, but at the same time has its limitations, for example with reflective surfaces or sharp-angled asperities due to the artefacts produced by such surfaces. Contact type profilometry does not possess the limitations of non-contact profilometry but is on the other hand limited by the size of the profilometer tip—e.g., for measurements on a submicron scale. Hybrid type contact profilometer (contour measurement + roughness) can be used for measurements of macro geometry and topography on the same device, i.e., without relocating the analyzed part. Besides the mentioned methods, coordinate measurement machines (CMM) can be used for the measurement of sample macro geometry and X-ray computer tomography for the determination of contact area of various materials, e.g., snow and polymer (Bäurle et al., 2007). All measuring methods have their advantages and disadvantages (Gross et al., 2018), and the limitations of the common surface topography measurement tools are summarized in Table 1.
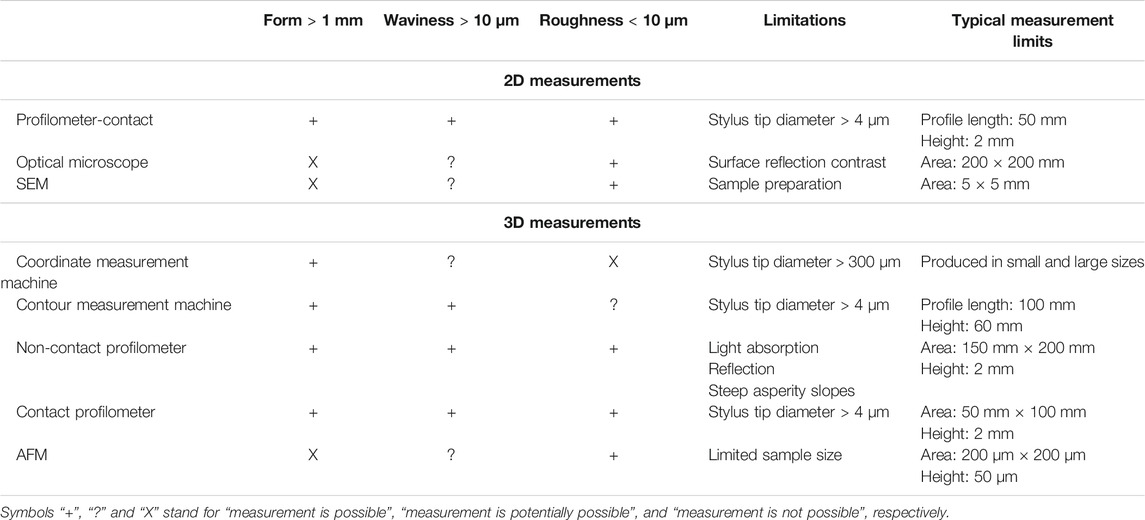
TABLE 1. Limitations of the common surface topography measurement tools.
Examined Surface Areas in the Existing Literature
Depending on the used instrument and data post-processing method, examined sample surface areas can be widely different, from 50 μm × 50 µm (Scherge et al., 2013) and up to 11 mm × 11 mm (Rohm et al., 2015). The sample sizes and geometries vary in a broad range as well: from pins, rings, rectangular blocks, to sledges, spheres, etc. Typically, in the studies, some information about the sample texture and/or macro geometry is given, but information about the full surface geometry and topography is rarely provided. In computational studies, the sample macro geometry is considered, and for simplicity reasons roughness is ignored, while in experimental studies roughness is typically measured, and the macro geometry is only roughly described.
Roughness Analysis of Previous Studies
In some studies, only 2D profile data are used (Kietzig et al., 2010a; Sukhorukov and Marchenko, 2014; Scherge et al., 2018), but in most of the research 3D surface measurements or combination of both are considered (Bäurle et al., 2007; Rohm et al., 2015; Jansons et al., 2016; Spagni et al., 2016; Lungevics et al., 2018; Scherge et al., 2018; Ripamonti et al., 2020; Liefferink et al., 2021). The problem with 2D profile measurements is that 2D profiles often provide misleading information about the surface texture, especially when anisotropic surfaces are used. For example (Rohm et al., 2015), reported that for the same sample the value of the Ra parameter could change up to six times if a different measurement trajectory is used on anisotropic surfaces.
ISO 2D and 3D texture standards contain more than 30 different parameters from which only a few are ever used ice friction research (see Table 2).
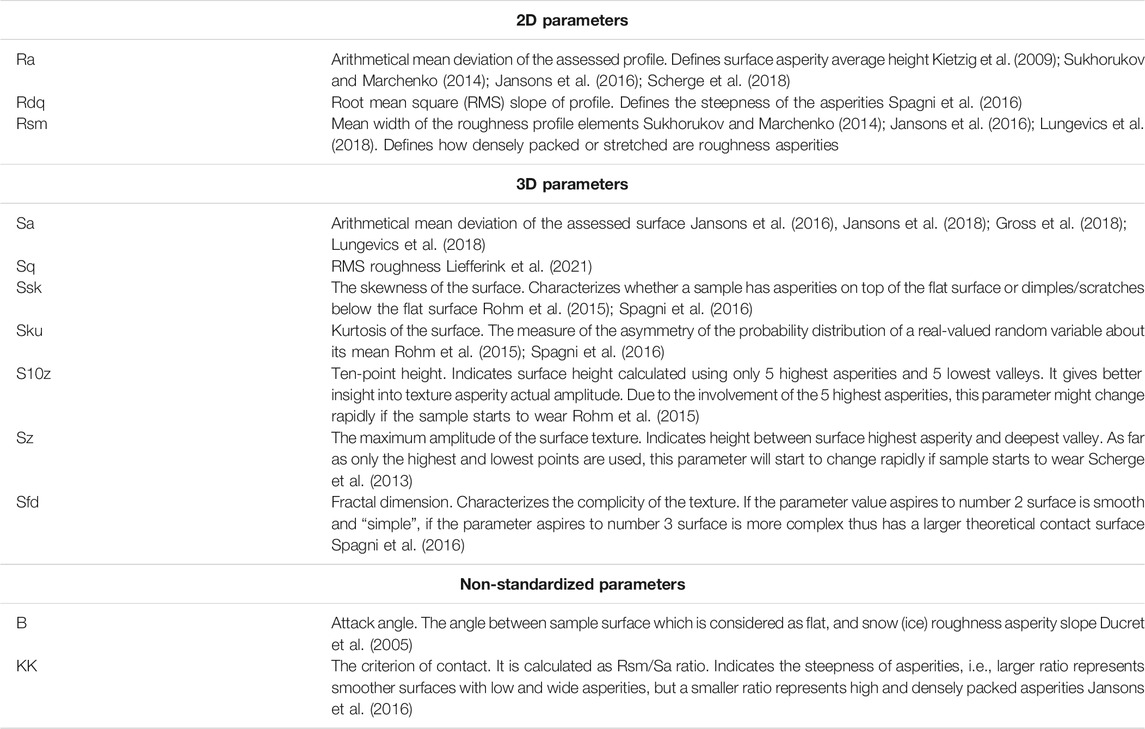
TABLE 2. Texture parameters used in the existing ice tribology studies.
Besides the described parameters in Table 2, the bearing ratio curve is used in ice tribology as well (Bäurle et al., 2007; Scherge et al., 2018; Jansons et al., 2021). It describes the cumulative probability density function of the surface profile height. It is useful for surface lubrication possibility analysis and can provide information about the sample contact with the opposing surface as well.
The final issue related to surface roughness measurements is texture filtration. In most studies, approaches described in ISO 4287 and ISO 2517 standards are used for the roughness measurements and post-processing. This leads to the filtration/neglection of the geometrical form and waviness from the measured surface profiles, thus changing the texture appearance and the calculated parameter values. For the calculation of the actual contact area, this approach might not be the most reliable since the filtered roughness profiles only provide a part of the information about the contact (Lou et al., 2013a; Lou et al., 2013b), see Figure 2.
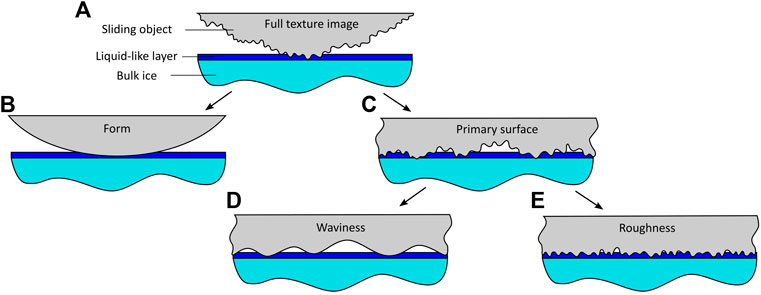
FIGURE 2. Schematic representation of an interaction between a solid surface and ice: (A) full texture, (B) form, (C) primary surface, (D) waviness, (E) roughness.
Table 3 summarizes some examples of previously used samples, their surface measurement approach, and considered texture parameters.
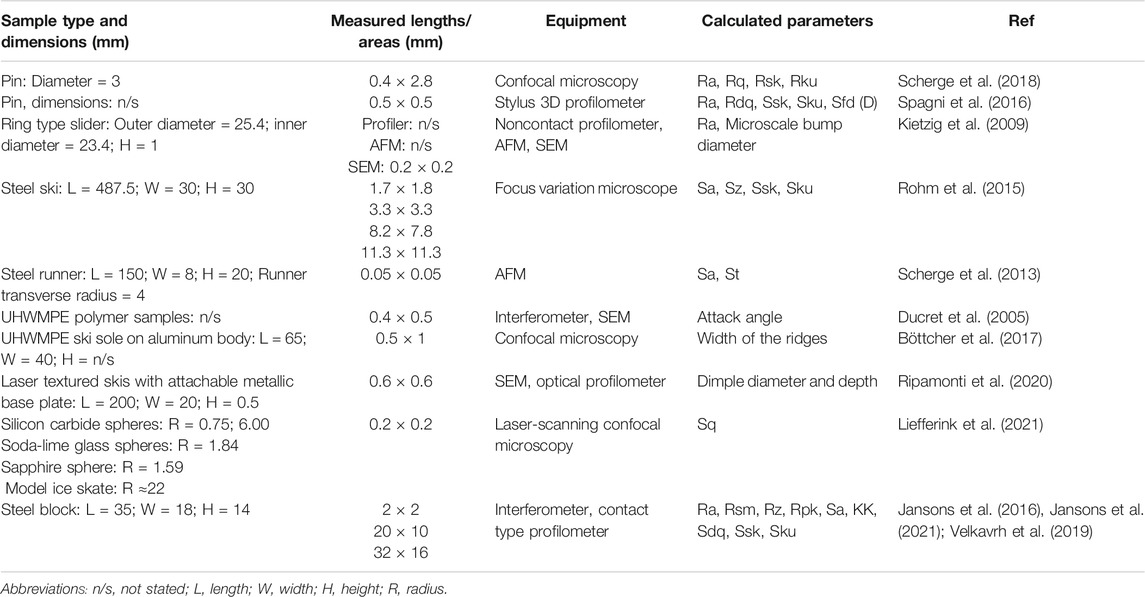
TABLE 3. Examples of ice friction research texture measurements.
In the existing literature on ice friction, very different topography measurement methods and approaches have been applied, and no standard methodology exists yet. The common trend is to analyze a small fraction of the full surface and neglect the waviness and geometrical form of the sliding surfaces. One might ask why a larger surface area should be measured at all. For example, let us imagine that a cylindrical pin with a flat tip is used on a tribometer test rig similarly as in studies (Spagni et al., 2016; Scherge et al., 2018). The pin tip is first polished and afterward post-processed to achieve the desired surface texture/roughness. After polishing and post-processing, the pin tip is most likely no longer flat but slightly cambered. In Figure 2 a schematic representation of the influence of the macro geometry and waviness on the contact area between the pin tip and the ice is presented. In such a case, the macro geometry of the sample has a more significant effect on the contact area than the surface roughness. However, in the existing studies, typically, only a tiny fraction of the sample surface is measured (the waviness is filtered out) and used as a measure for the contact area, while the macro geometry of the contact surface is neglected. By neglecting the macro geometry and waviness, the real contact pressures between the sample and ice can be misjudged. To avoid this, a simple and practical method for obtaining information about the sample micro-, and macro-geometrical properties should be developed.
In the present research, the authors investigate how full surface measurements of sliding samples can benefit the understanding of experimental data in the field of ice tribology. For this, samples with anisotropic surfaces were prepared and analyzed by using non-contact and contact 3D surface measurement equipment. The measured topography values were compared, and a method for sample contact area measurements was proposed. Furthermore, surface measurement data are compared to tribological results obtained on two different test rigs to verify whether more detailed topographical data can provide a better understanding of the ice friction process.
Materials and Methods
Experimental Sample Preparation
All samples were manufactured from the Uddeholm Ramax HH steel, which is a chromium alloyed, corrosion-resistant steel supplied in a high pre-hardened condition. Samples were cut as rectangular blocks with dimensions of 35 mm × 18 mm × 14 mm. All sides of the blocks were grounded simultaneously side by side in one batch to obtain as similar initial geometry as possible. Afterward, sample test surfaces were sandblasted to get isotropic texture. Sandblasting was followed by polishing to achieve three different surface roughness levels. Polishing times were set to 30, 150, and 240 s. Figure 3 shows a small section (500 μm × 500 µm) of the sample surfaces. In Figure 3, polishing reduced the height of the asperities, which formed during sandblasting. The height of asperities was initially around 20 μm, after polishing for 30 s it reduced to 15 μm, after polishing for 150–10 μm, and after polishing for 240–5 µm. Furthermore, with the reduction of asperity height, polishing increased the smooth surface area on the sample surfaces. The smooth area defines the contact surface with ice because it is the first to interact with the ice. A larger smooth area reduces the contact pressure between the sample and ice. On the other hand, the texture valleys that remained unpolished can act as reservoirs for the LLL and thus provide improved lubrication of the ice surface, which also is the reason for the selection of this specific surface preparation procedure.
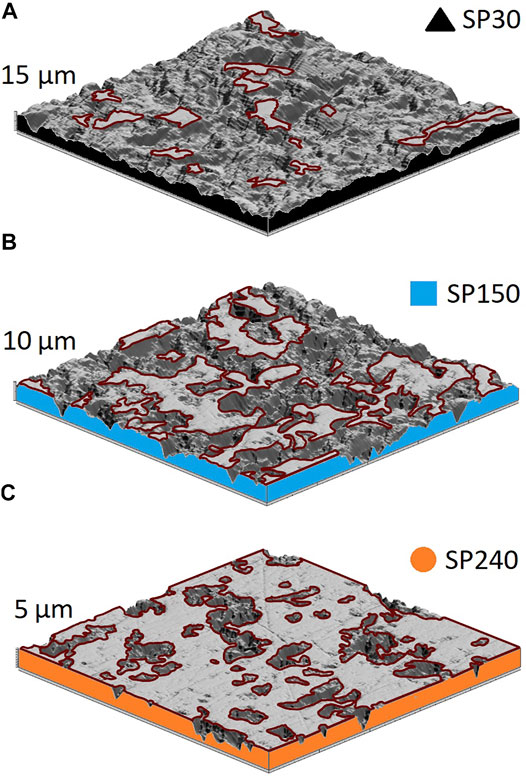
FIGURE 3. Closeup (500 μm × 500 µm) of sample surface 3D photo simulation obtained with contact type profilometer: (A) sample SP30 was polished for 30 s; (B) sample SP150 was polished for 150 s; (C) sample SP240 was polished for 240 s. Polishing reduces the total asperity height and increases the percentage of the smooth areas on top of the surface. The contour of the polished area is marked with a red outline. This smooth area of the texture will be the first to interact with the opposing ice surface. A larger and smoother surface area reduces contact pressure between the sample and ice. Lower contact pressure reduces sample penetration in soft ice, thus improving surface ability to slide at higher air temperatures, but at very low temperatures larger contact area might have a negative influence, i.e., a smooth surface might freeze together with ice thus slowing or even stopping the sample.
Sample Texture Measurements
Contact Profilometry
Form Talysurf Intra 50 profilometer with 112/2009 stylus (Taylor Hobson, United Kingdom) was used to measure 84% of the full sample surface, covering 32 mm × 16.5 mm area. This measurement includes information about sample form, waviness, and roughness. The profilometer was set to measure 600 profiles parallel to the shorter sample side, resulting in 10,000 measuring points per profile. In total, 6 million measuring points were taken on the surface, which results in 11363 points/mm2. Due to low point density, this can be considered a low resolution (LR) measurement. Afterward, 2 mm × 2 mm area was measured in the center of the same sample, using the same number of parallel profiles and points per profile, resulting in 1.5 million points/mm2. This is considered a high-resolution (HR) measurement. The measurement of the 2 mm × 2 mm area provided a 136-times higher measured point density compared to the 32 mm × 16.5 mm area, thus providing smaller details about the sample surfaces. All noise filters were neglected for the measurements to avoid any texture measurement manipulations. An example of full surface and small section measurement is shown in Figure 4.
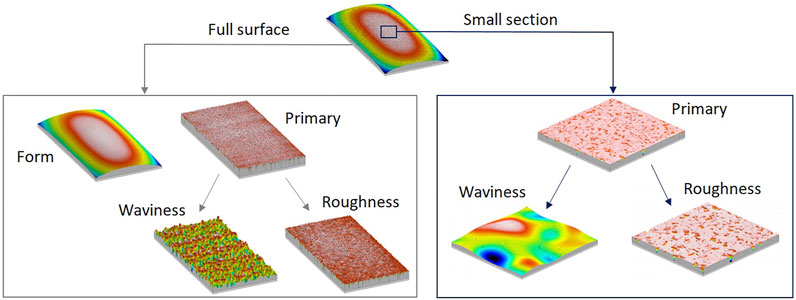
FIGURE 4. Sample texture measurement—full surface and small section measurement. Full surface measurements provide essential information about the geometrical form of the sample. Small section measurements have a higher measured point density, thus providing more details about the surfaces, e.g., asperity height, dimple size, pileup, and polished surface area. In both approaches, all surface parameters were calculated for the primary surface and for the filtered roughness profiles to evaluate the changes in the parameter values.
Non-contact Profilometry
To compare contact and non-contact profilometry data, surface topography measurements were performed using a laser confocal microscope (VK-X250/260, Keyence International NV/SA, Belgium). Measurements were performed in the center of the sample surfaces, identically as in contact type small section measurements. The laser confocal microscope works on the principle of combined laser light and white light microscopy using a violet semiconductor laser with a 408 nm wavelength. It contains a 16-bit PMT (photomultiplier tube) color CCD (charge-coupled device) image sensor, the recording resolution is 3,072 × 2,304 pixels, i.e., there are more than 3 million measuring points in each scanning plane. Due to the high measurement point density, these measurements are also considered as high resolution (HR) measurements.
Post-Processing of Topography Data
Contact type profilometry measurement post-processing was performed in TalyMap Expert software. The obtained surface texture data were analyzed in three ways:
A. Only roughness was considered for full surface and small section measurements.
B. The primary surface (roughness and waviness) was considered for full surface and small section measurements.
C. All surface levels (geometrical form, waviness, and roughness) were considered. Only full surface measurement was used without any applied filters.
During the first approach, geometrical form and waviness were filtered out according to ISO 2517 requirements for surface roughness characterization. This included the use of Gaussian filter, cut-off, and low pass filter according to Taylor Hobson Form Talysurf Intra 50 user manual and ISO 2517 guidelines. During the second approach, only the geometrical form was filtered out, while waviness was left unfiltered. In the third approach, no information was filtered out, i.e., the sample geometrical form, waviness, and roughness were left unmodified after the measurement.
For the evaluation of the influence of contact area between the sample and ice, a virtual sample slicing method was applied. Here, the highest peak on the surface was used as a reference point from which the sample surface was sliced with a virtual slicing plane at various depths between 1 and 12 µm below the highest peak. Figure 5A shows the principle of sample surface slicing, and in Figure 5B, contours of sliced surface areas are presented for different slicing depths. At a certain slicing depth, the whole curvature of the surface would be virtually sliced off, resulting in the nominal contact area of the sample.
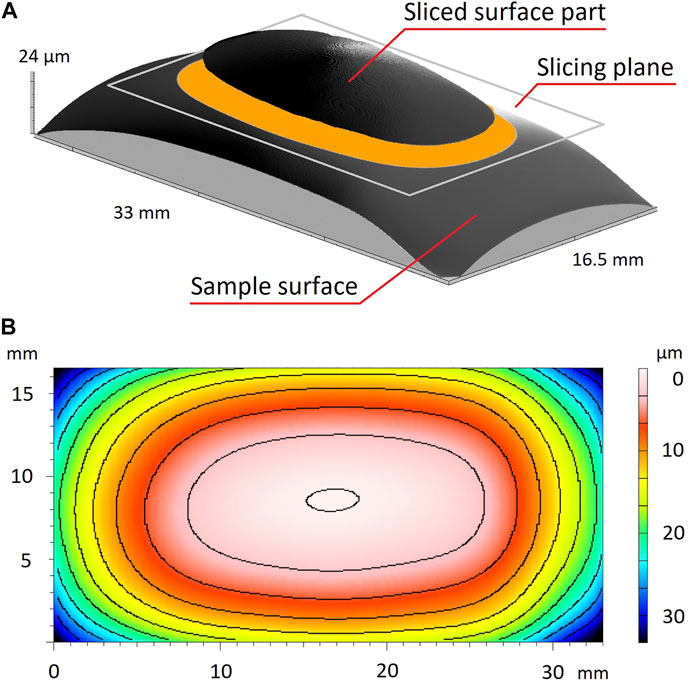
FIGURE 5. (A) Representation of the sample slicing method. Virtual slicing plane separates the sliced surface from the full surface, and the contact area is then calculated for the sliced part. (B) Contour map examples of a sliced sample surface. Slicing in the presented image was performed in 3 µm steps from the highest surface peak. The obtained contours demonstrate which part of the surface would be in contact with ice at various depths. Due to the surface curvature, the real contact area is significantly smaller than the nominal surface area. If the full surface measurements would not be performed, the curvature of the sample surfaces could not be observed and could cause misinterpretation of texture.
The samples used in the present study have a noticeably curved shape, thus the contact area with ice will depend on how deep the curved surface will penetrate the ice during sliding. Figure 6 shows the surfaces of test samples sliced at 4 µm depth under the highest surface peak. On the left side, 3D representations of the sliced surfaces are shown, and for comparison, on the right-side top view of the contact area, images at the same slicing-depth are shown.
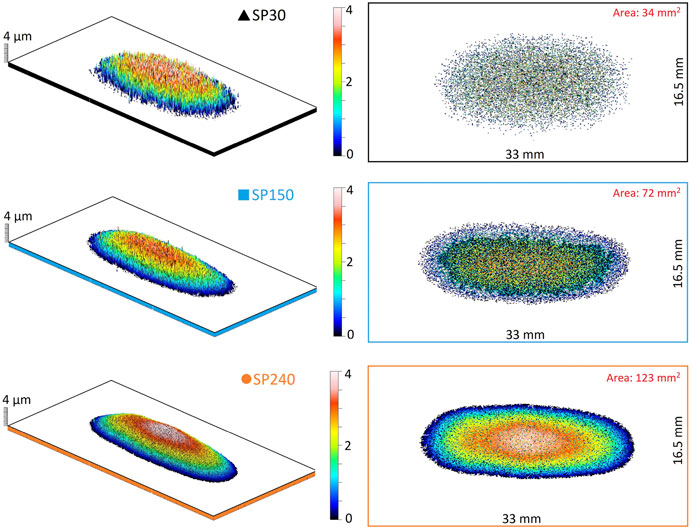
FIGURE 6. Surfaces of test samples sliced at 4 µm depth under the highest surface peak. On the left side, 3D representations of the sliced surfaces are shown, and for comparison, on the right-side top view of contact area, images at the same slicing-depth are shown. Sample with the highest surface roughness (SP30) has the smallest contact area, which consists of fewer asperities than for other samples. Under loading conditions, fewer asperities can more easily penetrate the ice surface. Generally, the contact area of samples increased with polishing time since during polishing surfaces become smoother, and at the same time, the height of asperities is reduced.
Contact areas of the sliced surfaces were calculated using TalyMap Expert software built-in functions and were used for calculations of the contact pressures in tribological tests. The measurement topography parameters were then compared with the results from tribological tests by evaluating the correlation between the surface parameters and the tribological values (coefficient of friction and achieved sliding velocity of the samples), and by calculating the proportion of variance between the mentioned parameters.
Tribological Tests
Two different tribological test setups were used for the testing of the same samples. A schematic representation of both test setups is shown in Figure 7: inclined ice surface where the sliding velocity of the steel sample blocks were determined (Figure 7A); oscillating tribometer where the coefficient of friction was assessed for the same samples (Figure 7B). In the first test setup, no additional normal force was applied to the steel samples (weighing 68 g); while in the second test setup an additional normal force of 52 N was applied to the steel samples. The test setups are described in more detail elsewhere (Velkavrh et al., 2019).
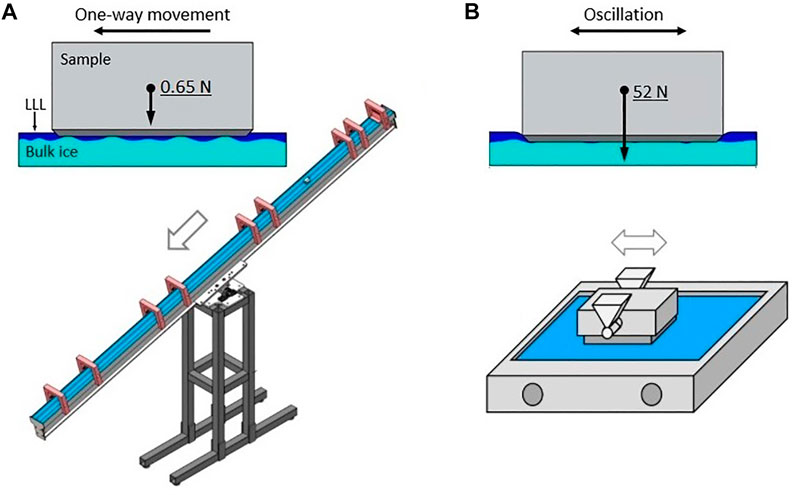
FIGURE 7. A schematic representation of the test setups used: (A) inclined plane tribometer that ensures sample sliding in one direction down the plane without any additional load on the samples. The velocity of freely sliding samples was measured using eight optical sensors. Higher measured sample velocity indicates better sliding ability, (B) oscillating tribometer. The sample oscillates on the ice surface with an additional applied normal load of 52 N. Since the sample oscillates with high frequency on the same ice surface, the ice surface is slightly melted, allowing the sample to penetrate deeper into the ice surface. Additionally, the melted ice may work as a lubricant. More information about the test setups can be found elsewhere (Velkavrh et al., 2019).
Velocity Measurements on the Inclined Plane Tribometer
For velocity measurements, a 3 m long inclined plane tribometer was used (Figure 7A). The plane was tilted at 16 ± 0.5°. The start gate ensures that the experimental samples start the movement from the same position and in a steady state. The sliding velocity was measured using eight optical sensors at defined positions resulting in four velocities sections: V1, V2, V3, and V4. Additionally, average sliding velocity Vavg was calculated for the sliding distance between the first and the last optical sensor. Sliding velocity was used to describe the sliding ability: the faster the sample accelerates, the better its sliding performance. No additional weight was placed on the samples during the tests; thus, the contact pressure between the sample and the ice was relatively low, ca. 0.001 N/mm2 of nominal contact pressure, i.e., assuming that the sample surface is perfectly flat and in full contact with ice.
The tribometer was located in a climate simulation chamber, which enables ambient temperature regulation in the range of +30°C down to −20°C and is equipped with an ice plane cooling system, allowing precise regulation of the ice temperature. Humidity and air temperature in the climate simulation chamber were measured using a P330 Temp thermometer (Dostmann electronic, Germany), while the ice temperature was measured with thermocouple TP-122-100-MT-K (Czaki, Poland) plugged into infrared thermometer Proscan 520 (Dostmann, Germany). Temperature and relative humidity measurements were documented after every 10th sliding test, and the final value was calculated as the average of all measurements of a single experimental session.
Before the sliding tests, the ice surface was leveled flat, and a small groove was embedded in ice in the movement direction to keep the samples in a straight trajectory during sliding. During the tests, the samples were slid down the ice track in a random order to prevent the eventual influence of fluctuation of ambient conditions on the experimental results of specific samples. The average sliding velocity for each sample was calculated from 40 individual sliding velocity measurements. During data post-processing five fastest and five slowest measurements were excluded from the calculation.
Tests on an Oscillating Tribometer
In oscillating tribometer tests, an ice rink with dimensions of 20 mm width, 80 mm length, and 5 mm depth was used. Before each test series, a new ice surface was prepared. For ice formation, 18 ml of distilled water was used to which 0.5 ml of tap water was added to accelerate the ice crystallization. In all tests, the ice temperature at the bottom of the ice bath was −10°C (at the surface, it was estimated to around −8°C under the applied ambient conditions).
Before tribology tests specially developed aluminum leveling tool with a contact area of 45 mm × 28 mm was inserted in the sample holder and rubbed against the ice surface to create an ice surface as flat and smooth as possible. The smoothing was performed at a normal force of 692 N and an average sliding velocity of 0.08 m/s until the height difference between the left and right sides of the ice surface was lower than 100 µm. The flatness of the ice surface was measured with a built-in tribometer dial gauge. After leveling, the leveling tool was replaced by an experimental sample, and the tribological test was conducted.
Experiments were carried out at a constant normal load of 52 N and a stroke of 24 mm. The contact pressure between the sample and the ice was ca. 0.084 N/mm2 if it assumed that the sample surface is perfectly flat and in full contact with ice. For each test, a run-in period of 60 s at 0.10 m/s was first performed to adjust the sample temperature to the ice temperature. Afterwards, experiments were carried out at 7 velocity levels (average sliding velocities of 0.02, 0.05, 0.10, 0.14, 0.19, 0.29, and 0.38 m/s). During each experiment, friction measurements at all velocity levels were performed twice—once at increasing and once at decreasing velocity. The change of sliding velocities during each experiment performed on the oscillating tribometer is shown in Figure 8.
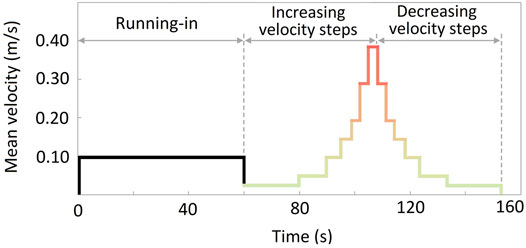
FIGURE 8. Change of sliding velocities during each experiment performed on the oscillating tribometer. Tests were carried out at different velocities, first at increasing and afterward at decreasing velocity, to analyze the influence of both types of motion dynamics.
Results
Surface Texture Measurements
In Table 4 values measured using contact and non-contact profilometer and post-processed according to the procedure described in section of post-processing of topography data. are listed. In Table 4, other roughness parameters are not included because they showed similar relative trends as the parameter Sa.
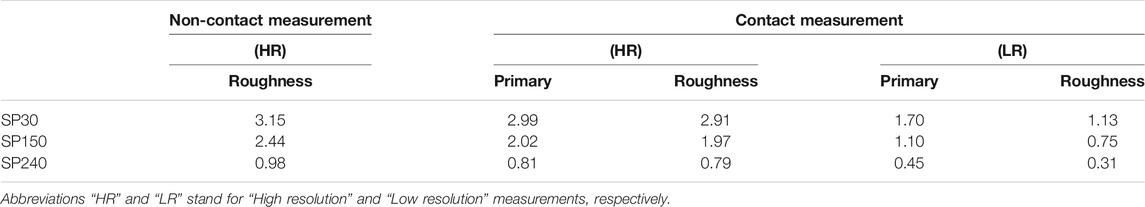
TABLE 4. Surface roughness parameter Sa [µm] measured using contact and non-contact profilometers and processed according to the procedure described in Section of non-contact profilometry.
The comparison of the Sa parameter shows that a higher measured point density on the surface (HR measurements) results in a higher Sa value. The highest Sa values were obtained with the non-contact laser confocal microscope, followed by small surface measurements with the contact type profilometer, while the lowest Sa values were obtained in large area roughness measurements with the contact type profilometer. Higher Sa values obtained with the non-contact method can be explained by its ability to measure deeper and narrower surface valleys than the contact type profilometer. This is because the 2 µm tip radius of the contact profilometer cannot reach small dimples or bores. It should also be pointed out that the cone-shaped profilometer tip tends to describe narrow and/or sharp edges as rounded ones.
Also, it was noticed that the unfiltered primary surface has a higher Sa value than the filtered roughness profile, which is because waviness enhances the overall amplitude, thus increasing the Sa value. Typically, in ice tribology studies, waviness is not considered, but it might play an important role. Therefore, for analyses of sample interactions with ice, the authors propose the use of the unfiltered primary surface instead of filtered roughness profiles.
The observations about the influence of point density and waviness on the measured Sa values are logical and do not provide any groundbreaking discoveries, but do provide a useful guideline: the question of which method for measurement and calculation of roughness parameters is the best and/or more accurate is very complex and difficult to answer, however, the roughness parameter values of different surfaces can be effectively compared as long as they are measured in the same way and by using the same device. This conclusion is supported by the data in Table 4: regardless of the profilometer used or the measuring area size, the relative proportion between the roughness parameters was very similar—only the absolute values of the roughness parameters are different.
Contact Area and Contact Pressure
Virtual slicing of the sample surfaces was performed in 1 µm steps from the highest surface peak to 12 µm below it, as explained in “Non-contact Profilometry” section. The contact area values for sliced surfaces of all samples are shown in Figure 9A.
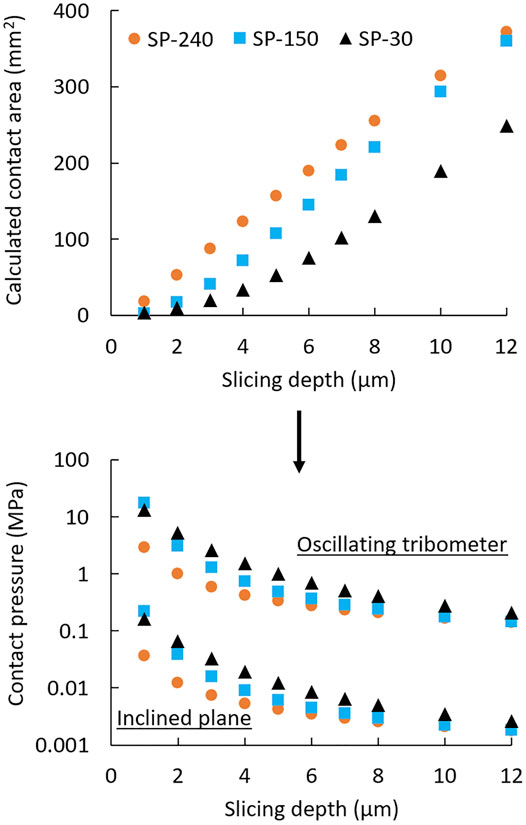
FIGURE 9. (A) Calculated sample contact area values at different slicing depths. Due to the curved sample surface, the contact area increases at a higher slicing depth. The smoothest sample (SP240) has the largest contact area and thus the lowest contact pressure. (B) Calculated contact pressure (shown in logarithmic scale) at various slicing depths for both experimental setups. The largest differences in contact pressure between the samples occur at smaller slicing depths, where surface asperities play a larger role. If the sample surface were sliced at 12 µm below the highest surface peak, the contact pressure would be nearly identical for all samples. The contact pressure on the inclined plane tribometer was almost 100-times lower than on the oscillating tribometer because no additional load was added to the sample during the tests.
In Figure 9, the contact area increases with increasing slicing depth for all samples. The smallest contact area was observed for sample SP30, which after sandblasting was polished for the shortest time and has the highest roughness, while the largest contact area was observed for sample SP240, which after sandblasting was polished for the longest time and had the lowest roughness. At the virtual slicing depth of 12 μm, the size of contact surfaces of samples SP240 and SP150 become similar. By increasing the slicing depth further, samples reach the nominal contact area, i.e., the actual curvature of the sample is fully sliced off, and the ideal flat surface remains, which is same for all samples.
Considering the calculated contact areas at the respective slicing depths, in Figure 9B, the contact pressure for each sample was calculated for both experimental setups—oscillating tribometer and inclined plane tribometer. The contact pressure values of the oscillating tribometer experiments are noticeably higher due to the additional applied force (52 N) in these tests. The relationships in both cases are practically identical, only the absolute values change. As the slicing depth increases, the contact pressure decreases for all samples, since if the sample is sliced at a lower depth (0–3 µm), only a portion of the surface asperities is in contact resulting in higher contact pressure, but as the sample is sliced at higher slicing depths, the contact area increases, thus decreasing the contact pressure. The highest contact pressure was obtained for sample SP30 (the roughest surface), and the lowest for sample SP240 (the smoothest surface).
Inclined Plane Tests
Inclined plane tests were conducted under the following conditions: ice temperature −7 ± 0.5°; air temperature −4 ± 0.5° and relative humidity 60 ± 3%. Sliding velocities were obtained at 4 different positions, and the final values shown in Figure 10 were calculated from 40 individual measurements for each sample. The magnifications for each measurement section were made to better highlight differences between samples. In all cases, Y-axis represents the sliding velocity while X-axis represents the distance from the movement starting position.
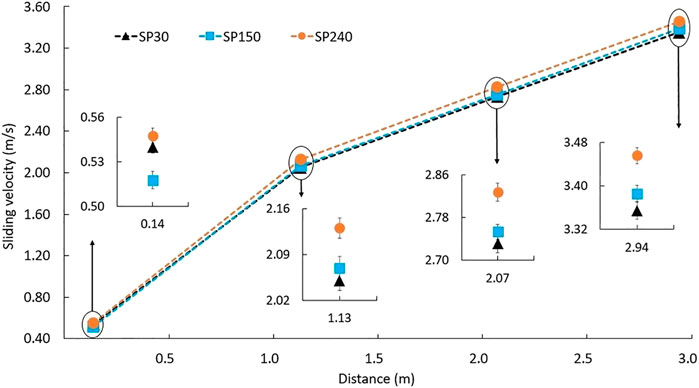
FIGURE 10. Sliding velocities measured on the inclined plane tribometer. Sample velocity increases due to accelerated movement down the inclined plane. In the magnified closeups, the smoothest sample SP240 is faster than samples SP30 and SP150, which show similar velocities. Slightly different behavior between the latter is observed only in the first measurement point, where the roughest sample SP30 is faster than the intermediately rough sample SP150.
In Figure 10, sample SP240 (the lowest contact pressure) reached the highest sliding velocity in all four measurement positions. On the other hand, sample SP30 (the highest contact pressure) is the slowest one.
In measuring position V1, the sample behavior appears to be random, which is most likely because the samples start their movement from a steady state where an eventual stick-slip movement may randomly affect the samples’ ability to start sliding. In the steady state, the rougher sample has the advantage of a smaller contact area on which adhesive forces can work, possibly resulting in lower static friction. However, under higher applied loads this effect might not be observed because the asperities of the rough surface would penetrate the ice resulting in higher deformative friction, ploughing and/or mechanically interlocking with the ice surface.
As the samples move down the inclined plane, their velocity increases. When the samples have gained some inertia, i.e., in measuring positions V2, V3, and V4, the difference between the velocities of samples SP30 and SP150 decreased to approximately 1%, while the difference between the velocities of the slowest and the fastest sample, SP30 and SP240, respectively, were around 3–4%. Such difference may not seem much, but for winter sport athletes it could provide a major benefit.
Oscillating Tribometer Tests
Oscillating tribometer tests were conducted under the following conditions: ice temperature –8 ± 0.5°; air temperature 7 ± 1° and relative humidity 55 ± 2%. The measurements were conducted at various velocities as shown in Figure 8. In Figure 11, the coefficient of friction values measured on the oscillating tribometer are presented.
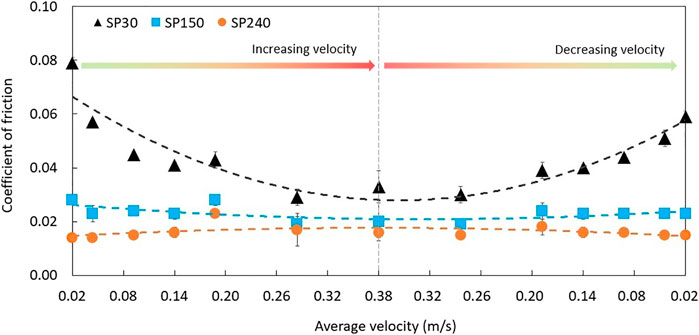
FIGURE 11. Coefficients of friction measured on the oscillating tribometer. The obtained friction curves show that samples with higher contact area (smoother ones) yield lower coefficient of friction values. At the same time, the influence of velocity on the coefficient of friction is noticeably higher for the roughest sample SP30 than for the smother samples SP150 and SP240.
In Figure 11, the lowest coefficient of friction (0.015) was observed for sample SP240. A slightly higher coefficient of friction was obtained for sample SP150 (0.025). For both samples, the effect of velocity on the coefficient of friction in the observed range was negligible. The roughest sample SP30 showed the highest coefficient of friction values, which varied in the range from 0.04 to 0.08 depending on velocity. As velocity increased, the coefficient of friction reduced by a factor of 2, and at the same time, the coefficient of friction values during the decreasing velocity steps was slightly lower compared to the increasing velocity steps. This could be due to the LLL which formed during the test as the sample was oscillating over the same ice surface. It is presumed that the thickness of LLL increased during the test, thus reducing the coefficient of friction in the second part of the test, i.e., during the decreasing velocity steps.
The obtained coefficient of friction values and the general sample behavior correlate well with the data reported by (Spagni et al., 2016). In the mentioned study, sandblasted surfaces were used but having different magnitudes of asperities, and the asperity tips were not polished as in the present study. In the mentioned study, a pin-on-disc type tribometer was used, and the samples were prepared as pins. Similarities in the results from different test setups indicate that the observed trends are representative and can be used as a reference for future studies with similar surface textures.
Texture Parameter Correlation With Tribology Experiments
In Supplementary Figures 1 and 2, correlation analysis for the contact pressures and roughness parameters of specific samples and their velocities and coefficients of friction from tribometer tests is presented. Values in colored fields show the calculated proportion of variance (RSQ) between the measured roughness parameters and the results from tribological tests. The closer the value gets to number 1, the higher the correlation between the compared parameters is. For a graphic representation, RSQ values are colored in a color scale, reaching from red (value 0) to yellow (value 0.5) and green (value 1). Red shades represent areas with low correlation, while green shades represent areas with high correlation.
In Supplementary Figure 1, contact pressure/surface roughness show and good correlation with sliding velocity for all measuring positions except for the first one. This is because on the inclined plane tribometer the initial velocity V1 is highly influenced by static friction, as explained in section of inclined plane tests.
The highest correlation between the contact pressure and the sliding velocity was observed at a slicing depth of 1–3 µm. This is because, at low contact pressure applied in the inclined plane tribometer tests (only sample’s weight), the samples did not penetrate deeply into the ice surface.
All analyzed surface texture parameters show a very high correlation (above 0.8) with the sliding velocity and indicate they can be used for the evaluation of sliding ability in ice tribology studies. The high correlation between the surface texture parameters and the sliding velocity may also be due to the low contact pressure applied in these tests. Since only the tip of the curved sample surface is in contact with the ice surface, texture roughness on the tip has a stronger influence on its sliding ability than at high contact pressures, where a higher proportion of the sample surface is in contact with ice and, therefore, the waviness and the geometrical form of the sample additionally influence its sliding ability.
For the oscillating tribometer setup where higher contact pressure was applied, the correlation results (Supplementary Figure 2) are quite different from for the inclined plane tribometer (Supplementary Figure 1).
In Supplementary Figure 2 the highest correlation between the contact pressure and coefficient of friction is observed at a slicing depth of 4–6 µm. This is due to the higher contact pressure and oscillating movement on the same ice surface, where the sample surface asperities penetrate deeper into the ice surface than in the inclined plane tests. Consequently, the waviness and the geometrical form (curvature) of the sample play a more significant role. Therefore, the correlation between the surface roughness parameters and the coefficient of friction values is lower than for sliding velocity; however, the Sa parameter of the unfiltered primary surface shows a better correlation with the coefficient of friction values than the Sa parameter of the filtered roughness profile—due to the included waviness of the sample. It is also interesting to note that for lower velocities better correlation between the contact pressure and coefficient of friction was observed at higher slicing depths (6–8 µm), while for higher velocities, a better correlation was observed at lower slicing depths (4–6 µm)—possibly due to the hydrodynamic effects at the higher velocities which separate the sample from the ice surface more efficiently at higher velocities than at the lower ones.
Discussion
The present study shows that currently, researchers in the field of ice tribology measure surfaces in very different ways: by using different surface roughness parameters to describe the surfaces and post-processing the data differently. All these methods are efficient and provide a lot of useful information; however, for a better understanding of interactions between solid surfaces and ice, a unified surface measurement methodology is recommended so that in terms of surface characterization, all researchers in the field would “speak the same language.”
This specific study was conducted to highlight the importance of understanding the full surface geometry instead of focusing only on the micro-or nanoscale of the surface texture. The proposed surface analysis method is not in its final stage yet, however, it will be further developed and validated using different sample textures in future research. Since for theoretical calculations of coefficient of friction, information about the contact area is required as well, possible collaborations in this regard will be established to see if the proposed methodology can enable a more accurate match between experiments and theory. In this sense, applying data science and data mining methodologies (Bitrus et al., 2021) will be considered as well.
Conclusion
The present research brings out several conclusions:
A. The current surface measurement trends in ice tribology are focused on small surface area investigation, while the information about the sample macro geometry is rarely considered. This indicates that researchers may lack crucial information that could help them understand the sample behavior in contact with ice.
B. The proposed surface measurement and contact area analysis approach using the virtual surface slicing technique provided important information about the sample macro geometry that helped understanding sample behavior under different measuring conditions applied in different experimental setups. The surface measurement approaches found in the available literature typically neglect the information about the sample form and waviness, providing only the roughness component of the surface. Such deficient information about the sample surfaces prevents from wholesome analyses and comparison of results from different studies. If the overall (primary) information about the test surface is presented, understanding of the sample behavior under different measuring conditions can be improved. Afterwards, additional filtering can be applied, and the obtained results analyzed in the context of roughness or waviness. The proposed surface analysis approach can be helpful not only for ice tribology but for other tribology studies, where two surfaces are in contact as well.
C. A similar influence of surface texture and/or roughness on the coefficient of friction and sliding velocity (decrease with decreased surface roughness) was observed in different experimental setups (inclined plane tribometer and oscillating tribometer). The observed results correlate with observations reported by other scientists for similar experimental conditions.
Data Availability Statement
The raw data supporting the conclusions of this article will be made available by the authors, without undue reservation.
Author Contributions
Conceptualization, JL, EJ, and IV; investigation, JL, EJ, and IV; methodology, analysis and validation, JL, EJ, IV, IB, JV, TW; writing—original draft preparation, JL, EJ, and IV; writing—review and editing, IV, JV, TW, IB.
Funding
Parts of this work were funded by the Austrian COMET Program (Project InTribology, No. 872176) and carried out at the “Excellence Centre of Tribology” (AC2T research GmbH) in cooperation with V-Research GmbH and Riga Technical University. Financial support of Austrian Cooperative Research (ACR) is gratefully acknowledged. Parts of this work were also funded by the ERDF project “The quest for disclosing how surface characteristics affect slideability” (No. 1.1.1.1/16/A/129), which is being implemented in Riga Technical University. This research was partly supported by the Doctoral Grant Program of Riga Technical University. Riga Technical University Research Support Fund has supported the costs for open-access publishing of this article.
Conflict of Interest
Authors IV, JV, and TW were employed by the company “VResearch GmbH”
The remaining authors declare that the research was conducted in the absence of any commercial or financial relationships that could be construed as a potential conflict of interest.
Supplementary Material
The Supplementary Material for this article can be found online at: https://www.frontiersin.org/articles/10.3389/fmech.2021.691485/full#supplementary-material
SUPPLEMENTARY FIGURE 1 | The proportion of variance (RSQ) between surface roughness/contact pressure and the measured sliding velocities on the inclined plane tribometer.
SUPPLEMENTARY FIGURE 2 | The proportion of variance (RSQ) between surface roughness/contact pressure and the measured coefficients of friction (COF) on the oscillating tribometer.
References
Bäurle, L., Kaempfer, T. U., Szabó, D., and Spencer, N. D. (2007). Sliding Friction of Polyethylene on Snow and Ice: Contact Area and Modeling. Cold Regions Sci. Techn. 47, 276–289. doi:10.1016/j.coldregions.2006.10.005
Bitrus, S., Velkavrh, I., and Rigger, E. (2021). “Applying an Adapted Data Mining Methodology (DMME) to a Tribological Optimisation Problem,” in In Data Science – Analytics And Applications. Editors P. Haber, T. Lampoltshammer, M. Mayr, and K. Plankensteiner (Wiesbaden: Springer Vieweg), 38–43. doi:10.1007/978-3-658-32182-6_7
Böttcher, R., Seidelmann, M., and Scherge, M. (2017). Sliding of UHMWPE on Ice: Experiment vs. Modeling. Cold Regions Sci. Techn. 141, 171–180. doi:10.1016/j.coldregions.2017.06.010
Ducret, S., Zahouani, H., Midol, A., Lanteri, P., and Mathia, T. G. (2005). Friction and Abrasive Wear of UHWMPE Sliding on Ice. Wear 258, 26–31. doi:10.1016/j.wear.2004.09.026
Gross, K. A., Lungevics, J., Zavickis, J., and Pluduma, L. (2018). A Comparison of Quality Control Methods for Scratch Detection on Polished Metal Surfaces. Measurement 117, 397–402. doi:10.1016/j.measurement.2017.12.022
Hasler, M., Schindelwig, K., Mayr, B., Knoflach, C., Rohm, S., van Putten, J., et al. (2016). A Novel Ski-Snow Tribometer and its Precision. Tribol Lett. 63, 12552. doi:10.1007/s11249-016-0719-2
Jansons, E., Lungevics, J., and Gross, K. A. (2016). “Surface Roughness Measure that Best Correlates to Ease of Sliding,” in Proceedings of 15th International Scientific Conference Engineering for Rural Development (Jegava: Latvia University of Agriculture), 687–695. Available at: http://www.tf.llu.lv/conference/proceedings2016/Papers/N127.pdf
Jansons, E., Lungevičs, J., Jerāne, I., and Gross, K. A. (2021). A Smaller Bearing Ratio, as a Surface Texture Measure, Promotes Faster Sliding on Ice. J. Tribology 143 (8), 111801. doi:10.1115/1.4049704
Jansons, E., Lungevics, J., Stiprais, K., Pluduma, L., and Gross, K. A. (2018). Measurement of Sliding Velocity on Ice, as a Function of Temperature, Runner Load and Roughness, in a Skeleton Push-Start Facility. Cold Regions Sci. Techn. 151, 260–266. doi:10.1016/j.coldregions.2018.03.015
Kietzig, A.-M., Hatzikiriakos, S. G., and Englezos, P. (2010a). Ice Friction: the Effect of thermal Conductivity. J. Glaciol. 56, 473–479. doi:10.3189/002214310792447752
Kietzig, A.-M., Hatzikiriakos, S. G., and Englezos, P. (2009). Ice Friction: The Effects of Surface Roughness, Structure, and Hydrophobicity. J. Appl. Phys. 106, 024303. doi:10.1063/1.3173346
Kietzig, A.-M., Hatzikiriakos, S. G., and Englezos, P. (2010b). Physics of Ice Friction. J. Appl. Phys. 107, 081101. doi:10.1063/1.3340792
Kietzig, A.-M., Mirvakili, M. N., Kamal, S., Englezos, P., and Hatzikiriakos, S. G. (2011). Nanopatterned Metallic Surfaces: Their Wettability and Impact on Ice Friction. J. Adhes. Sci. Techn. 25, 1293–1303. doi:10.1163/016942411X55587210.1163/016942410x549988
Liefferink, R. W., Hsia, F.-C., Weber, B., and Bonn, D. (2021). Friction on Ice: How Temperature, Pressure, and Speed Control the Slipperiness of Ice. Phys. Rev. X 11, 011025. doi:10.1103/PhysRevX.11.011025
Ling, E. J. Y., Uong, V., Renault-Crispo, J.-S., Kietzig, A.-M., and Servio, P. (2016). Reducing Ice Adhesion on Nonsmooth Metallic Surfaces: Wettability and Topography Effects. ACS Appl. Mater. Inter. 8, 8789–8800. doi:10.1021/acsami.6b00187
Lou, S., Jiang, X., and Scott, P. J. (2013a). Correlating Motif Analysis and Morphological Filters for Surface Texture Analysis. Measurement 46, 993–1001. doi:10.1016/j.measurement.2012.10.001
Lou, S., Zeng, W.-H., Jiang, X.-Q., and Scott, P. J. (2013b). Robust Filtration Techniques in Geometrical Metrology and Their Comparison. Int. J. Autom. Comput. 10, 1–8. doi:10.1007/s11633-013-0690-4
Lungevics, J., Jansons, E., and Gross, K. A. (2018). An Ice Track Equipped with Optical Sensors for Determining the Influence of Experimental Conditions on the Sliding Velocity. Latvian J. Phys. Tech. Sci. 55, 64–75. doi:10.2478/lpts-2018-0007
Ripamonti, F., Furlan, V., Savio, A., Demir, A. G., Cheli, F., Ossi, P., et al. (2020). Dynamic Behaviour of Miniature Laser Textured Skis. Surf. Eng. 36, 1250–1260. doi:10.1080/02670844.2018.1512730
Rohm, S., Hasler, M., Knoflach, C., van Putten, J., Unterberger, S. H., Schindelwig, K., et al. (2015). Friction Between Steel and Snow in Dependence of the Steel Roughness. Tribol Lett. 59, 12552. doi:10.1007/s11249-015-0554-x
Scherge, M., Böttcher, R., Richter, M., and Gurgel, U. (2013). High-Speed Ice Friction Experiments under Lab Conditions: On the Influence of Speed and Normal Force. ISRN Tribology 2013, 1–6. doi:10.5402/2013/703202
Scherge, M., Böttcher, R., Spagni, A., and Marchetto, D. (2018). High-Speed Measurements of Steel-Ice Friction: Experiment vs. Calculation. Lubricants 6, 26. doi:10.3390/lubricants6010026
Spagni, A., Berardo, A., Marchetto, D., Gualtieri, E., Pugno, N. M., and Valeri, S. (2016). Friction of Rough Surfaces on Ice: Experiments and Modeling. Wear 368-369, 258–266. doi:10.1016/j.wear.2016.10.001
Sukhorukov, S., and Marchenko, A. (2014). Geometrical Stick-Slip between Ice and Steel. Cold Regions Sci. Techn. 100, 8–19. doi:10.1016/j.coldregions.2013.12.007
Keywords: ice friction, surface topography, contact area, contact pressure, friction regimes, coefficient of friction, sliding velocity
Citation: Lungevics J, Jansons E, Boiko I, Velkavrh I, Voyer J and Wright T (2021) A Holistic Approach Towards Surface Topography Analyses for Ice Tribology Applications. Front. Mech. Eng 7:691485. doi: 10.3389/fmech.2021.691485
Received: 06 April 2021; Accepted: 26 May 2021;
Published: 09 June 2021.
Edited by:
Emile Van Der Heide, University of Twente, NetherlandsCopyright © 2021 Lungevics, Jansons, Boiko, Velkavrh, Voyer and Wright. This is an open-access article distributed under the terms of the Creative Commons Attribution License (CC BY). The use, distribution or reproduction in other forums is permitted, provided the original author(s) and the copyright owner(s) are credited and that the original publication in this journal is cited, in accordance with accepted academic practice. No use, distribution or reproduction is permitted which does not comply with these terms.
*Correspondence: Janis Lungevics, amFuaXMubHVuZ2V2aWNzQHJ0dS5sdg==