 Tangcheng Li
 Chentao Guo1
 Yaqun Zhang
 Xin Lin
 Senjie Lin
- 1State Key Laboratory of Marine Environmental Science and Xiamen City Key Laboratory of Urban Sea Ecological Conservation and Restoration, Xiamen University, Xiamen, China
- 2Department of Marine Sciences, University of Connecticut, Groton, CT, United States
Emiliania huxleyi, a cosmopolitan coccolithophore in the modern ocean, plays an important role in the carbon cycle and local climate feedback as it can form extensive blooms, calcify, and produce dimethylsulfoniopropionate (DMSP) leading to the generation of dimethyl sulfide (DMS) which affects climate when oxidized in the atmosphere. It is known to be able to utilize dissolved organic phosphorus (DOP) by expressing a specific type of alkaline phosphatase (EHAP1) under phosphorus-limited conditions. In this study, we identified a new alkaline phosphatase (EH-PhoAaty) in this species, which we found belongs to the newly classified PhoAaty family. The expression of this atypical phosphatase was up-regulated under P-depleted conditions at both the transcriptional and translational levels, suggesting that E. huxleyi is able to express this AP to cope with phosphorus limitation. Comparative analysis revealed different transcriptional expression dynamics between eh-PhoAaty and ehap1, although both genes exhibited inducible expression under phosphate deficiency. In addition, after AP activity was eliminated by using EDTA to chelate metal ions, we found that AP activity was recovered with the supplement of Ca2+ and Zn2+, indicative of the adoption of Ca2+ as the cofactor under Zn-P co-limited conditions, likely a result of adaptation to oceanic environments where Zn2+ is often limiting.
Introduction
Phosphorus (P) is an essential nutrient required by living cells to synthesize vital biomolecules, such as lipids, nucleic acids, ATP, and signaling molecules (Dyhrman et al., 2012; Karl, 2014; Lin et al., 2016; Luo et al., 2017). In the ocean, phosphorus is one of the major nutrients required for primary production existing in both inorganic and organic forms (Karl, 2000). The preferred form of dissolved inorganic phosphorus (DIP), which can be utilized directly by phytoplankton, is chronically low in many parts of the ocean and seasonally limited in coastal waters (Lomas et al., 2004; Thingstad et al., 2005; Moutin et al., 2007; Van Mooy et al., 2009). In contrast, dissolved organic phosphorus (DOP) is usually more abundant than DIP in the euphotic zone, and mainly comprising phosphoesters (>75%) and phosphonates (nearly 25%) (Clark et al., 1998; Kolowith et al., 2001; Karl and Björkman, 2002). Studies so far have consistently indicated that DOP can be utilized by marine phytoplankton to support primary production. Marine microorganisms have developed various mechanisms to hydrolyze DOP and release inorganic phosphate (Pi) to meet their P requirements for growth (Dyhrman et al., 2007). Alkaline phosphatase (AP) is the most common DOP hydrolase expressed by marine unicellular microorganisms (Labry et al., 2005; Nicholson et al., 2006; Huang et al., 2007; Duhamel et al., 2010).
AP (EC 3. 1. 3. 1) is a phosphoester hydrolase with two properties: low substrate specificity and an alkaline pH optimum (Masahiro and Kimitoshi, 1998; Lee et al., 2015). In seawater, AP can enable bacteria and phytoplankton to scavenge phosphorus from various chemical forms of DOP when DIP is depleted, although recent studies showed utilization of glucose-6-phosphate and ATP in the dinoflagellate Karenia mikimotoi was AP-independent (Luo et al., 2017; Zhang et al., 2017). Because it is inducible by P deficiency, AP activity has been widely accepted as a biomarker of P-stress in phytoplankton (Cembella et al., 1984; Mahaffey et al., 2014). Many studies have been conducted to identify and characterize AP genes in marine bacteria, resulting in the recognition of three homologs, PhoA, PhoX, and PhoD (Gomez and Ingram, 1995; Kriakov et al., 2003; Majumdar et al., 2005). They were found to show different substrate preferences, different ionic activators (Zn2+, Mg2+, Ca2+, Fe3+), and different subcellular localizations (Luo et al., 2009; White, 2009). Sharing little sequence similarity with the classified APs (PhoA, PhoD, and PhoX), several distinct types of APs have been identified in the haptophyte Emiliania huxleyi (Xu et al., 2006), the pelagophyte Aureoumbra lagunensis (Sun et al., 2012), some dinoflagellates (Lin et al., 2011, 2012a,b), and the diatom Phaeodactylum tricornutum (Bowler et al., 2008). Among these, AP identified in dinoflagellates has recently been classified as an atypical group of APs (PhoAaty), which shares conserved motifs with various putative PhoAaty genes in other phytoplankton genomes, including one from E. huxleyi (Lin X. et al., 2015).
Emiliania huxleyi (Lohman), a cosmopolitan coccolithophore in the modern ocean, forms extensive blooms in both coastal and open oceanic waters (Brown and Yoder, 1994; Paasche, 2002). The blooms of E. huxleyi have significant biogeochemical implications, particularly in the global carbon and sulfur cycles through their production of calcite coccoliths and dimethy1sulfoniopropionate (DMSP), the precursor of the climate-relevant gas dimethyl sulfide (DMS) (Paasche, 2002; Marsh, 2003; Rost and Riebesell, 2004). Previous studies revealed that there is a large internal Pi pool and an inducible AP in several strains making E. huxleyi particularly well adapted to low phosphate conditions (Riegman et al., 1992; Dyhrman and Palenik, 2003). Furthermore, kinetic analyses have suggested that E. huxleyi possesses more than one type of AP (Dyhrman and Palenik, 2003; Shaked et al., 2006). However, to the best of our knowledge, only one kind of AP gene (ehap1) has been documented in this species.
In this study, we attempted to obtain molecular evidence that E. huxleyi possesses more APs than just ehap1 and characterized their differential expression patterns. We identified an atypical AP gene (eh-PhoAaty) in E. huxleyi and found that its expression was inducible under P deficiency at both the transcriptional and translational levels. We compared eh-PhoAaty and ehap1 expression patterns following growth in P-depleted and P-replete conditions. To further characterize APs in E. huxleyi, we also examined the subcellular localization and affinity for metal ions as cofactors of APs in cells.
Materials and Methods
Algal Cultures and P Treatments
Emiliania huxleyi (strain PML B92/11, non-axenic strain) was provided by the Collection Center of Marine Algae, Xiamen University China, and was cultured at 20 ± 1°C under a 14 h: 10 h light/dark cycle with a photon flux of 100 μE m-2 s-1. Cultures were prepared with 0.22_μm pore-size filtered and autoclaved seawater, and an antibiotic cocktail comprising 100 mg/L streptomycin, 100 mg/L kanamycin and 200 mg/L ampicillin (final concentration) to inhibit the growth of bacteria in the culture (Lin S. et al., 2015, Wang et al., 2016). Experimental cultures were set up in 2 L culture flasks for both P-depleted and P-replete conditions, each in triplicate. Algae were grown in f/2 medium (Guillard and Ryther, 1962) modified with vitamins and trace metals supplied in half, and N:P ratio was 150:1 (P-deplete) and 16:1 (P-replete) respectively (Mckew et al., 2015; Ameijeiras et al., 2016). Cell concentrations were monitored daily using a Sedgwick-Rafter counting chamber (Phycotech, St. Joseph, MI, United States). DIP concentration in each culture was also determined daily by filtering 25 mL culture through a 0.22 μm pore-size mixed-cellulose-ester membrane and filtrate to the molybdenum blue inorganic phosphate assay (Timothy et al., 1984).
AP Activity Quantification and Subcellular Localization
Bulk AP activity was measured by adding 50 μL of 20 mM p-nitro-phenylphosphate (p-NPP; prepared in 1 M Tris buffer at pH 9.0) into 1 mL culture sample, followed by 2 h-incubation at 20°C in the dark (Xu et al., 2006; Lin et al., 2011). Samples were then placed on ice to stop further enzymatic activity and centrifuged at 10,000 × g for 2 min. The supernatant was transferred into a 96 well plate and the absorbance was measured on a SpectraMax® Paradigm® microplate reader (Molecular Devices, United States) at a wavelength of 405 nm. The absorbance of a dilution series of p-NP (the AP-hydrolysis product of p-NPP) was used to create a standard curve. AP activity was computed as the amount of p-NP produced during the incubation time, based on the absorbance of the test sample and the absorbance-concentration linear regression (standard curve), normalized to per cell and unit time and averaged across triplicate samples.
With this approach, analyses were conducted to partition the AP activity into different compartments of the culture. Besides above mentioned bulk AP activity (W), P-depleted cultures were centrifuged at 4,500 × g for 10 min at 20°C and the resulting supernatants were used to determine the activity of secretory AP (S). In parallel, cell pellets were resuspended in autoclaved filtered seawater to determine cell surface AP activity (C), while other replicated cell pellets were homogenized to measure AP activity of cell lysates (CL). To further microscopically examine the subcellular localization of AP in E. huxleyi, ELF®-97 Phosphatase Substrate (Invitrogen, Carlsbad, CA, United States) was used to label AP in intact cells. Cells were centrifuged at 4,500 × g for 10 min. The cell pellets were first incubated in 200 μL 75% (v/v) ethanol for 30 min to remove chlorophyll, and then mixed with ELF®-97 phosphatase substrate at a finial concentration of 0.25 mM and incubated for 30 min in the dark (Lin et al., 2012a). Cells were washed twice using sterile seawater and resuspended in 100 μL sterile seawater before microscopic observation. Green fluorescent cell images were taken at different scanning depths using a Laser Scanning Confocal Microscope (LSM780 NLO, excitation: 350–420 nm, ZEISS, Germany), and whole cell images were captured using an epifluorescence microscope (excitation: 300–400 nm, Axio Imager A2, ZEISS corporation, Germany).
RNA Isolation and cDNA Synthesis
Cells were collected and total RNA was isolated as previously reported (Zhang et al., 2007). Briefly, after cells were homogenized using the Fastprep®-24 Sample Preparation System (MP Biomedicals, United States) with bead-beating (0.5 mm mixed 0.1 mm diameter ceramic beads at 5:1), total RNA was extracted using Trizol reagent (Molecular Research Center, Inc., United States) coupled with further purification using Direct-Zol RNA Miniprep (Zymo Research, Orange, CA, United States). The concentration and quality of extracted RNA were determined on a NanoDrop (ND-2000 spectrophotometer; Thermo Scientific, Wilmington, DE, United States). For each sample, 300 ng total RNA was used in cDNA synthesis using the PrimeScriptTM RT reagent Kit (Takara, Clontech, Japan).
Identification of eh-PhoAaty and Computational Prediction of Subcellular Localization
We used the sequence an atypical AP identified in Amphidinium carterae as a query to blastx against the genome of E. huxleyi strain CCMP1516 (GenBank accession No. GCA_000372725.1). Four hits (E-value < 3e-66) from the genome assembly were retrieved and aligned. Conserved regions were identified and used to design degenerate primers (Table 1) to obtain homologs in E. huxleyi strain PML B92/11. Primers EhuxAP-F4 and EhuxAP-R1 (Table 1) were used to amplify the gene fragment of eh-PhoAaty from cDNA template of E. huxleyi strain PML B92/11. PCR conditions were: 95°C for 3 min followed by 10 cycles of 95°C for 15 s, 52°C for 30 s, 72°C for 1 min, and 20 cycles 95°C for 15 s, 56°C for 30 s, 72°C for 1 min and a final step of extension at 72°C for 5 min. PCR reactions were performed in a total volume of 25 μL, which contained 0.005 U ExTaq HS, 2.5 μL 10 × ExTaq buffer, 0.2 μM of each dNTP, 0.2 μM of each primer. The PCR product with the expected size was purified using the Universal DNA Purification Kit (TransGen, Biotech, Beijing, China) and directly sequenced (BGI, Shanghai, China). Based on the gene fragment obtained, specific primers (Table 1) were designed and used to acquire both 5′ and 3′ cDNA ends of the full length ORF region using the SMARTer® RACE 5′/3′ kit (Clontech, Japan). The deduced amino acid sequence of the full length eh-PhoAaty was used to conduct a pairwise sequence comparison with two hits acquired from the genome of E. huxleyi (CCMP1516) (Accession No: XP 005774892.1 and XP 005761790.1), PhoAaty of dinoflagellate (Amphidinium carterae, Accession No: ADT91623.2; Karenia brevis, Accession No: AFO84050.1; Alexandrium tamarense, Accession No: ALG03341.1; K. mikimotoi, Accession No: ALG03306.1), and reported EHAP1 of E. huxleyi (CCMP1516) (Accession No: XP 005759684.1, ABI51308.1, XP 005788892.1). Phylogenetic analyses were performed on MEGA v5.5 platform (Tamura et al., 2011), with alignment further visualized using BoxShade1 and phylogenetic tree reconstructed by using Neighbor Joining (Saitou and Nei, 1987) and Maximum-Likelihood (Guindon et al., 2010).
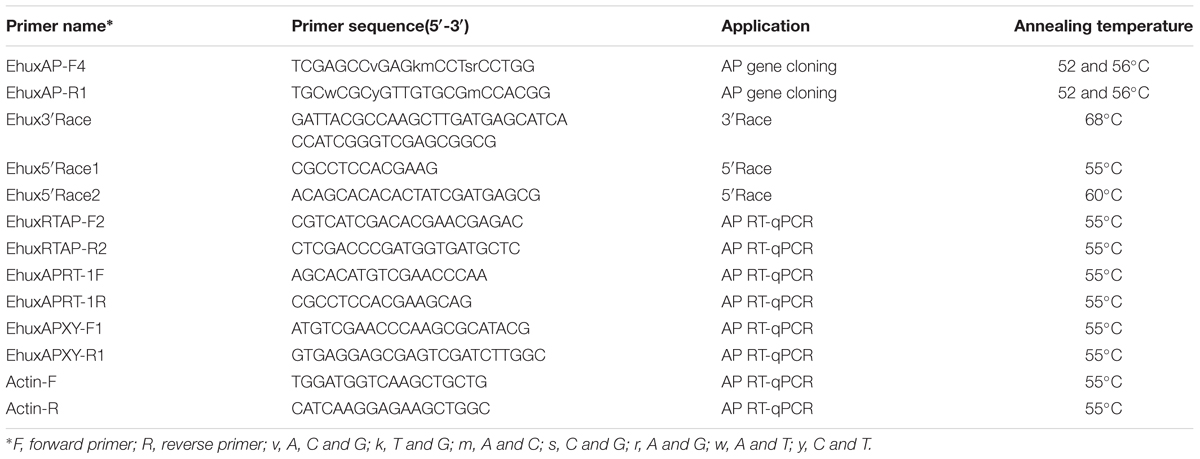
TABLE 1. Primers and thermal cycling conditions used in PCRs.
The computational program-CELLO (Yu et al., 2006) which has been used to make protein localization predictions in unicellular organisms (Luo et al., 2009) was used to predict subcellular localizations of APs in E. huxleyi. Because no algal model has been built into the program, we applied the plant model in our analysis. Furthermore, signal peptide of APs was determined using SignalP V4.1 (Petersen et al., 2011).
Real Time Quantitative PCR Analysis of AP Gene Expression
Specific primers (Table 1) targeting both eh-PhoAaty and ehap1 (Accession No: XM_005759627.1) were designed respectively for real time quantitative PCR (RT-qPCR) analysis to compare the genes expression in different cultures. RT-qPCR was performed using iQTM SYBR® Green Supermix on a CFX96 Real-time PCR System (Bio-Rad Laboratories, Hercules, CA, United States) essentially following a previously reported protocol (Zhang and Lin, 2003). We used actin as the reference gene because it has been reported to show a relatively stable level of expression (Bach et al., 2013). Purified amplicons for each gene (from a plasmid clone) were diluted to 105-1010 copies per reaction to generate standard curves for both the target and the reference genes (Hou et al., 2010). RT-qPCR reactions were carried out in a total volume of 12 μL containing 2.5 μM of each primer, cDNA equivalent to 5 ng of total RNA and 6 μL Supermix. Transcript levels of both test genes were normalized in two ways, to the transcript abundances of the actin gene and to the amount of total RNA used to generate the cDNA template used in the qPCR assay (Cui et al., 2016).
Western Blot Analysis of EH-PhoAaty Protein Accumulation
A peptide (pACAAP) comprising 180 amino acid residues of ACAAP (amino acid site 220-400), encoded by the gene acaap identified in dinoflagellate A. carterae (Lin et al., 2011) was overexpressed in E. coli. Purified pACAAP was used to immunize a rabbit and generate the polyclonal antiserum (Proteintech Group Inc., Wuhan, China). Pairwise comparison showed pACAAP shared sequence similarity of 49% (E value = 6e-37) with the counterpart fragments of EH-PhoAaty (amino acid site 196-375). The applicability of this antiserum to determine the EH-PhoAaty expression was verified firstly by the detection of a clear band (∼110 kD) in western blot analysis, which was close to the predicted MW of EH-PhoAaty (Supplementary Figure 1). Meanwhile, the two counterpart gel fragments with the range of 100–120 kD and 40–60 kD were cut out from a parallel SDS-PAGE gel, and subjected to mass spectroscopic analysis using a TripleTOF® 5600+ (AB Sciex, United States). We also conducted a competitive immunoreaction with cell free protein of E. huxelyi as follows: 5 μL antiserum was pre-incubated overnight with 95 μL antigen (pACAAP) before undertaking western blot analysis; meanwhile, a duplicate blot was immunoreacted with antiserum. This type of competition for the epitope has previously been employed to verify the specificity of antibodies used to detect algal proteins (Lin et al., 1994).
Total proteins were extracted from the P-replete and P-depleted cultures after homogenizing the cells using the Fastprep®-24 Sample Preparation System with bead-beating. After centrifugation at 10,000 × g for 2 min, the supernatant was transferred into a fresh 1.5 mL tube. Protein concentration was determined using the BCA Protein Assay Kit (TransGen Biotech, Beijing, China) according to the manufacturer’s instructions and absorbance was measured on a SpectraMax® Paradigm® microplate reader (Molecular Devices, United States) at a wavelength of 562-nm (Li et al., 2016). After the protein was denatured at 95°C for 5 min by mixing with β-mercaptoethanol-SDS protein loading buffer (4 folds volume; Solarbio, Beijing, China. Cat. No. P1016), and 15 μg was loaded into each well of a 10% (w/v) SDS-PAGE gel (Bio-Rad, United States). Samples were loaded onto duplicated gels and electrophoresed at 80 V for 30 min then at 120 V for 1 h. The resolved proteins were then transferred to polyvinylidene difluoride (PVDF) membranes (Bio-Rad, Hercules, CA, United States) at 25 V for 30 min using a Trans-Blot SD Semi-Dry Transfer Cell (Bio-Rad, United States). Membranes were subsequently blocked in 5% (w/v) defatted dry milk prepared in Tris buffered saline (TBS) with 0.1 % (v/v) Tween-20 (TBST) over 1 h at room temperature, and incubated with the polyantiserum (diluted 1: 4000 in TBST) and GAPDH (provided by BBI Life Science, Sangon Biotech, Shanghai, China; diluted 1: 1000 in TBST), respectively. The abundance of GAPDH was used as a reference because of the reported relatively stable abundance of this protein in a dinoflagellate (Shi et al., 2015), and the lack of an established reference protein in E. huxleyi. After three washes in TBST each for 10 min, the membranes were incubated with a secondary antibody (goat anti-rabbit IgG antibody, TransGen Biotech, Beijing, China; diluted 1: 4000 in TBST) for 1 h. After three washes the membranes were treated with the enhanced chemiluminescent (ECL) substrate (Bio-Rad, Hercules, CA, United States) to detect the immunoreactive bands visualized on the Molecular Imager® Chemi Doc XR system (Bio-Rad, Hercules, CA, United States) and quantified using Image LabTM software (Li et al., 2016).
Metal Dependency Analysis of AP Activity in E. huxelyi
Total proteins were extracted as described above and were subjected to examine the metal dependency of AP in E. huxelyi. First, a metal chelating reaction was set up in a 96-well plate by mixing 80 μL AP buffer (0.02M Tris-Cl, 0.1M NaCl, pH = 8.0), 5 μL protein, 5 μL EDTA (100 mM) and 5 μL p-NPP, and the mix was incubated for 30-min at 20°C in the dark. Then, 10 μL of different metal ions (EDTA, Ca2+, Mg2+, Zn2+, and Co2+) were supplied separately into the reaction mix at a final concentration of 10, 10, 10, 8, and 5 mM respectively and incubated at 20°C for another 2 h, each group in triplicate. Meanwhile, the control group was set up with no addition of metal ions. AP activities were measured as described above. Fold change of AP activities of each group was computed as dividing by that of the control group.
Statistical Analysis
In order to evaluate the statistical significance of the differences observed between the two phosphorus treatments (P-depleted and P-replete groups), a Generalized Linear Model Repeated Measure procedure was applied using SPSS statistic software package, which test the effect of both the treatment factor and treatment-time factors. For comparisons of the gene expression, the one-way ANOVA test was used to analyze the overall difference in variances between times, and then the t-test was performed to compare the difference in means between each pair of times with p-values adjusted by the Bonferroni method (Supplementary Material_ST). The statistical analyses were done using R 3.4.4 (R Development Core Team, 2018).
Results
Identification of eh-PhoAaty in E. huxleyi and Prediction of Subcellular Localization
Four hits (E-value < 3e-66; GenBank Accession No: XP_005774892.1, XP_005761790.1, XP_005777715.1, XP_005780497.1) were obtained while using acaap to blastx against the E. huxleyi CCMP1516 genome (Supplementary Table 1). Using degenerate primers designed based on the conserved regions of these sequences, a 634 bp gene fragment was successfully amplified from the cDNA templates of E. huxleyi PML B92/11. Sequences of 10 randomly picked clones showed no nucleotide differences and were used to design specific primers for RACE PCR to acquire the full-length ORF region. After assembly, the full-length eh-PhoAaty is 2388 bp (GenBank Accession No: MG572018, encoding a protein comprising 696 amino acids). Pairwise sequence comparison confirmed that this gene was 99% identical to a hypothetical protein from E. huxleyi CCMP 1516 (GenBank Accession No: XP_005774892.1), which was the top hit in the blast analysis described above (Supplementary Figure 2). Phylogenetic analysis showed that, EH-PhoAaty was grouped together with the PhoAaty-type of APs identified from dinoflagellates, whilst EHAP1 was on a standalone distant branch (Figure 1A). A pairwise sequences comparison of deduced amino acid sequences of EH-PhoAaty with reported PhoAaty-type of APs from dinoflagellates, showed that it also contained the conserved domains in PhoAaty (Figure 1B). Successful amplification of eh-PhoAaty from cDNA template indicated that this gene was actively transcribed in E. huxleyi PML B92/11. Furthermore, sequence comparisons showed that eh-PhoAaty was different from ehap1 (Xu et al., 2006) at both the nucleotide (no significant similarity) and amino acid (E-value = 1.2, 39% identical) sequence levels, as shown by the distant phylogenetic branch in Figure 1A.
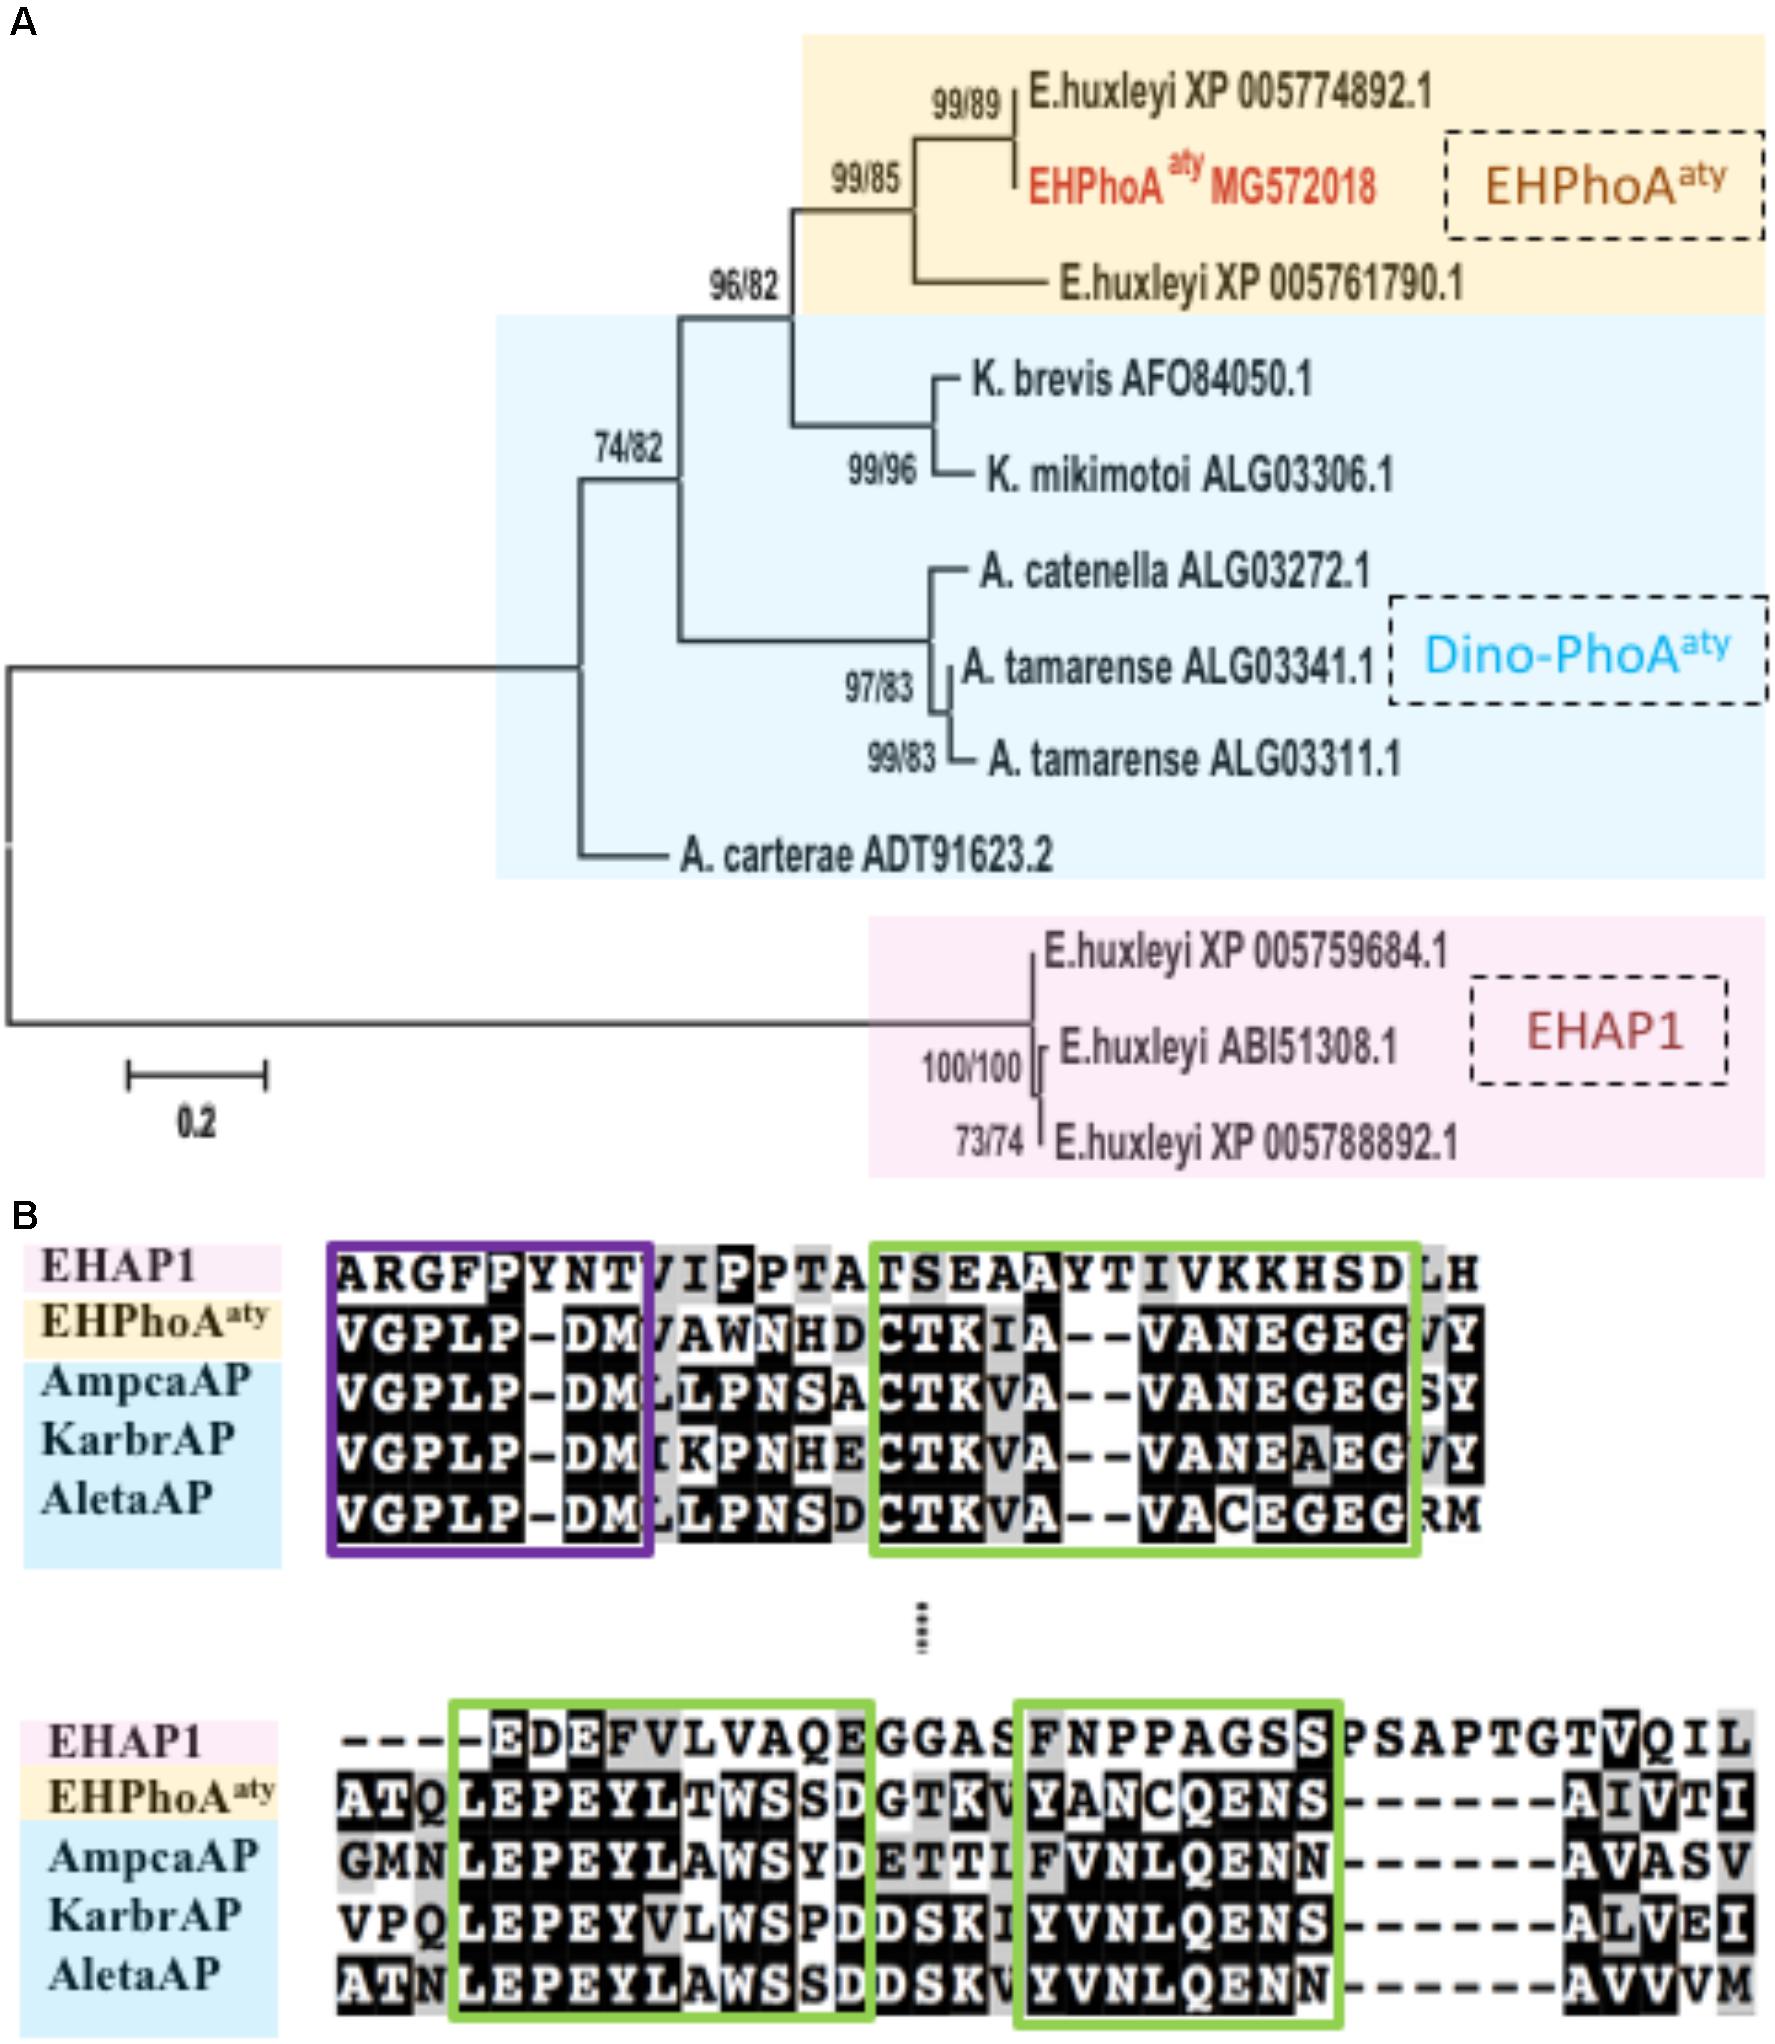
FIGURE 1. Phylogenetic analysis and conserved regions identified from alignment of amino acid sequences of EH-PhoAaty, EHAP1 and dinoflagellate APs. (A) Tree topology is shown as a Neighbor Joining tree with 1000 bootstraps and similar topology was obtained using the Maximum-Likelihood. Support value of nodes on each branch are shown as ML/NJ. Color backgrounds indicated the different types of APs. Yellow represents atypical EH-PhoAaty type from Emiliania huxleyi, blue represents the PhoAaty type from dinoflagellates (Dino-PhoAaty), and pink represents the EHAP1 type from E. huxleyi. (B) Pairwise comparison of deduced amino acid sequences of EHAP1 (XP 005759684.1), EHPhoAaty (MG572018), AP of dinoflagellate Amphidinium carterae (AmpcaAP, ADT91623.2), Karenia brevis (KarbrAP, AFO84050.1), Alexandrium tamarense (AletaAP, ALG03341.1). Green boxes represent identified conserved domains in PhoAaty (Lin X. et al., 2015).
The computation model (CELLO) predicted that EH-PhoAaty (Supplementary Table 2) was located in the periplasmic compartment (nearly 60% probability), and no signal peptide was identified using computational prediction software packages (Supplementary Figure 3). In contrast, the CELLO program predicted that EHAP1 is a periplasmic (nearly 48% probability) or extracellular protein (nearly 25% probability). A signal peptide was found at the N-terminus of EHAP1 (Supplementary Figure 3). Moreover, EHAP1 has been experimentally shown to be a secretory protein (Xu et al., 2006).
Culture Growth and AP Activity Under Different P Conditions
Starting from the similar initial cell densities, different growth patterns and maximum cell concentrations were observed between the two groups (Figure 2A). In the DIP-replete group, cell concentration maintained exponential growth from day 2 to day 8, reaching cell concentration of ∼1.2 × 10⁶ cells mL-1 on day 8. Contrastingly, the concentration in the Dip-depleted group was 5 × 10⁵ cells mL-1 on day 8, only half of that in the P-replete group.
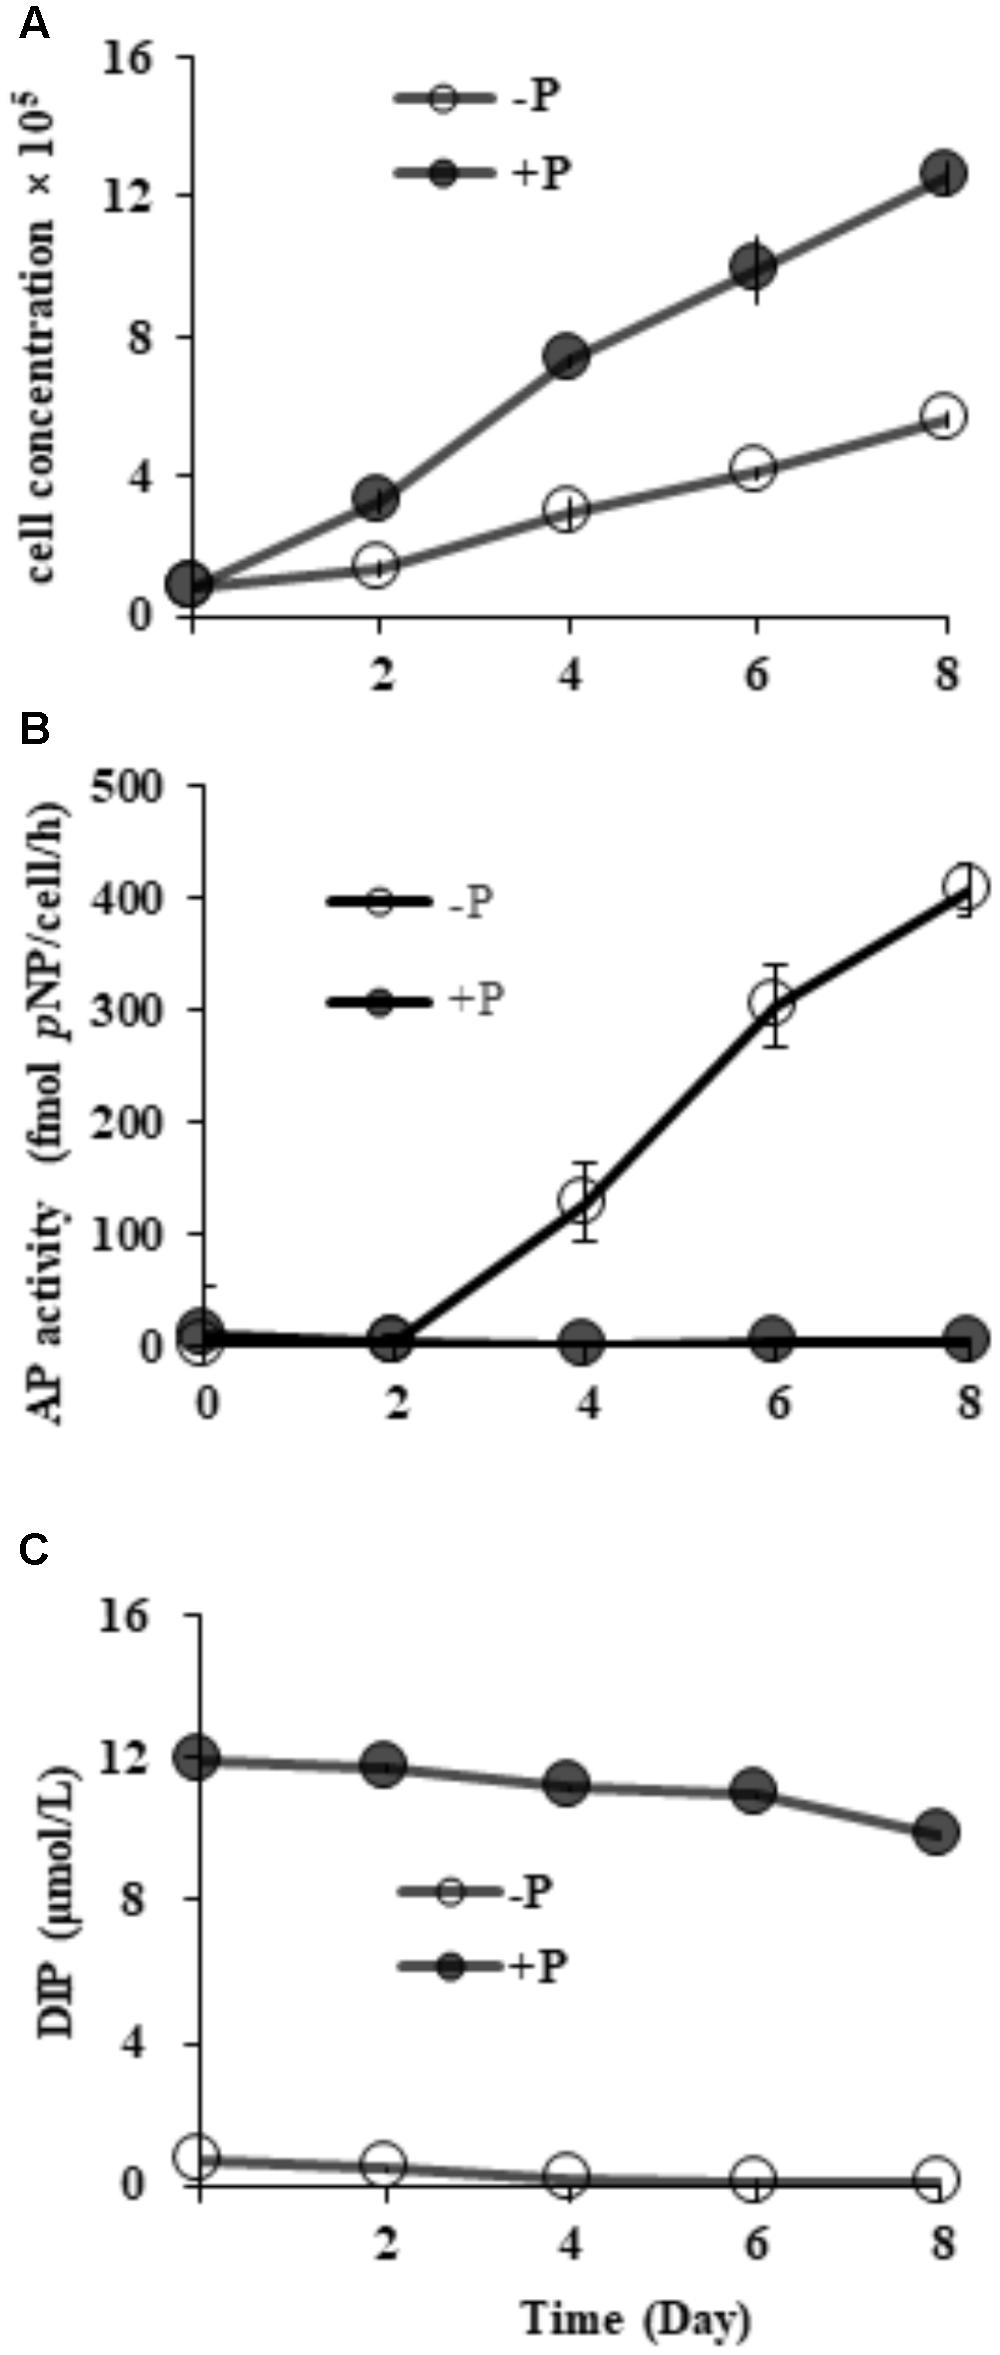
FIGURE 2. Growth curves (A), AP activity (B) and dissolved inorganic phosphorus (DIP) concentrations (C) in P-replete and P-depleted cultures. Shown are means ± standard deviations (error bars) from the triplicated cultures.
Compared to barely detectable AP activity in P-replete grown cultures, bulk AP activity in P-depleted cultures increased significantly (p < 0.05) along with a decrease in DIP from day 2 (Figures 2B,C). AP activity in the P-depleted cultures was about ∼ 127 fmol p-NP cell-1 h-1 on day 4 and reached a maximum of ∼ 405 fmol p-NP cell-1 h-1 in the whole experiment period.
To assess the partition of bulk AP activity into the different subcellular compartments. Further enzymatic activity assays (Figure 3) on the cell-free supernatant (S), resuspended cell pellets (C), cell lysate (CL), and bulk culture (W) showed that ∼97% of the measured bulk AP activity was contributed by AP of cell pellets (C) on day 8 and ∼65% on day 15. We also found that the total AP activity of CL was not significantly different from that of C (p > 0.05) and the AP activity of the supernatant increased markedly from day 8 to day 15.
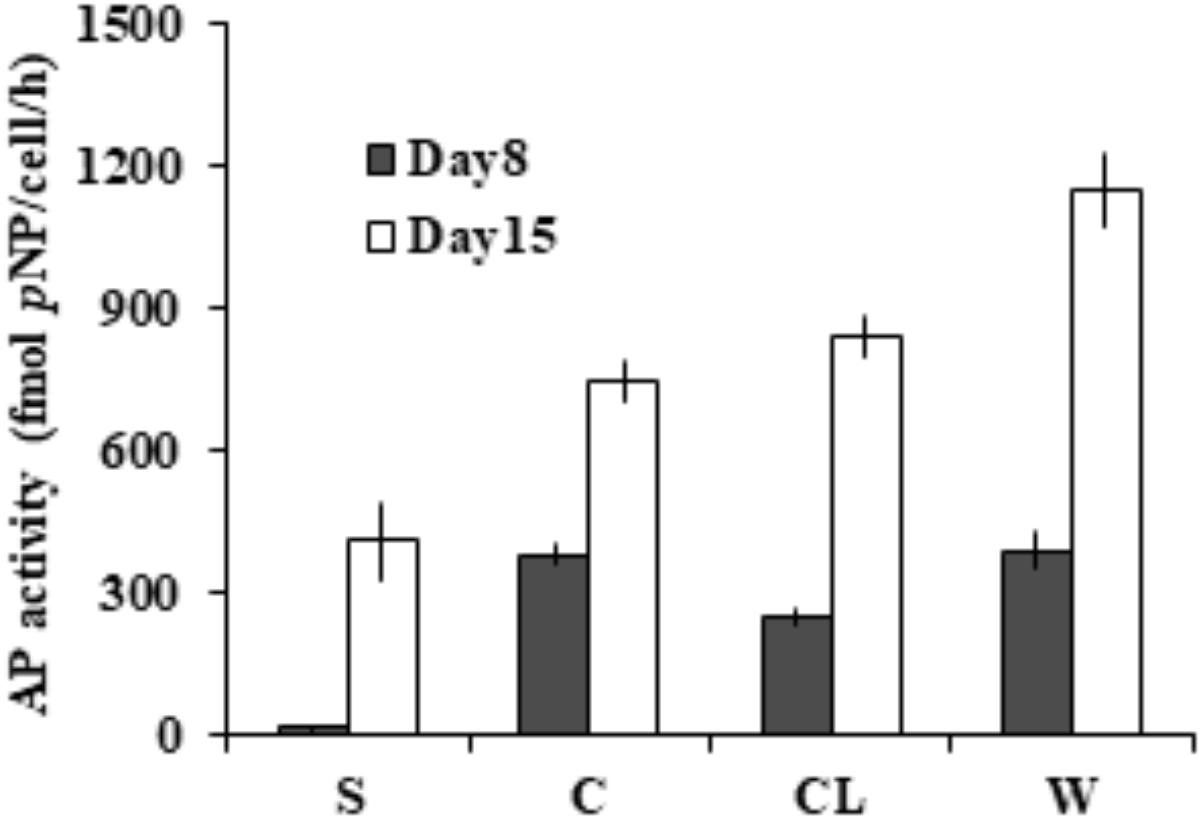
FIGURE 3. Different subcellular sources of AP activity (intracellular and membrane-associated) in E. huxleyi examined on day 8 and day 15. S for supernatant, C for live cells, CL for cell lysate, W for bulk AP activity.
ELF labeling observation was consistent with the above AP activity measurement results. As shown in Figure 4A, cells of the P-depleted group displayed stronger green fluorescence compared to the P-replete cells. Confocal microscope images acquired from different layers of the P-depleted cells confirmed that most of the cell-associated AP activity was localized around the cell surface (Figure 4B). Low AP activity in the intracellular compartment was in good agreement with the above-mentioned result that AP activity of the CL was similar to that of C. Taken these results together, the major contributor of the bulk AP activity was cell surface associated AP.
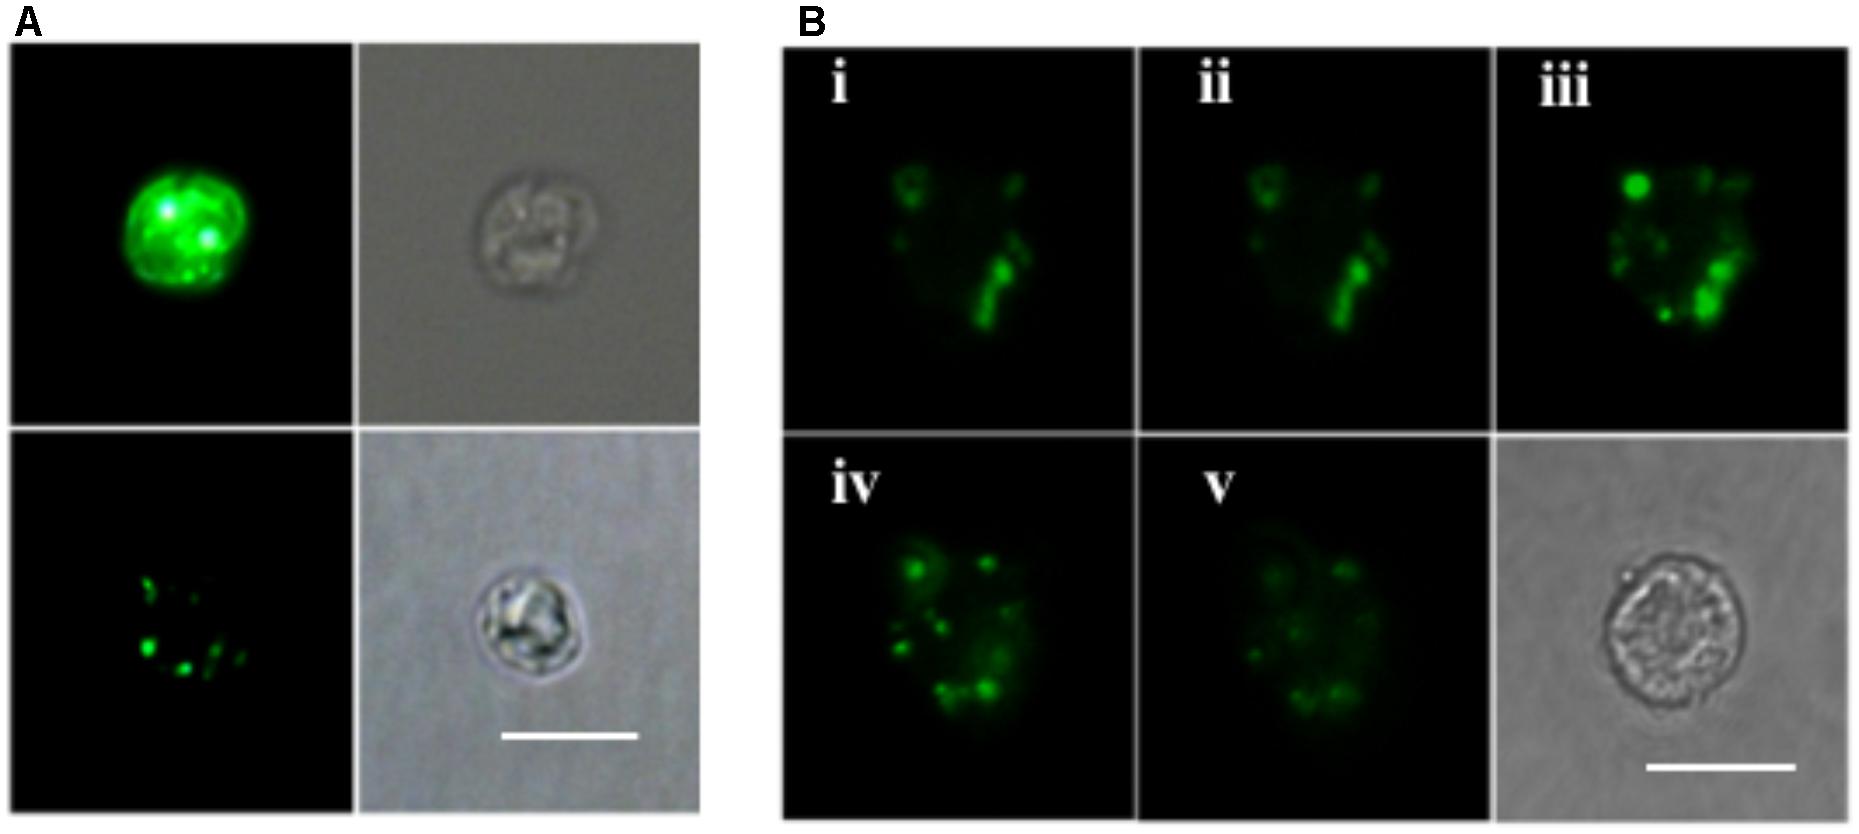
FIGURE 4. Microscopic images of ELF-97 labeling cells. (A) Fluorescent (left) and bright field (right) images of E. huxleyi cells grown under P-depleted (upper) and P-replete (bottom) conditions. (B) A series of images (i, ii, iii, iv, v) taken with scanning confocal microscope at the depths of 1, 2, 3, 4, 5 μm from P-depleted E. huxleyi cells, showing the labeling of AP; Bottom right is a bright field image. Scale bar = 5 μm.
Transcriptional Expression of eh-PhoAaty and ehap1
RT-qPCR analysis of both eh-PhoAaty and ehap1 showed that expression of both genes was higher in cells grown under P-depleted conditions compared to the P-replete group (p < 0.05) (Figure 5), regardless of the normalization process. However, each gene expression profile was distinct from each other (Figure 5). Under P-depleted conditions, ehap1 expression was 5–19 fold higher than eh-PhoAaty, when normalized to actin (Figures 5A,C) and about 6–24 fold higher when normalized to the amount of total RNA (Figures 5B,D). Secondly, when normalized to actin, eh-PhoAaty expression peaked on day 4 (∼6.2 fold higher than day 2, p < 0.05, paired t-test) and decreased on day 6 (∼3.8 fold lower than day 4, p < 0.05, paired t-test) and day 8 (∼1.56 fold higher than day 6, p > 0.05, paired t-test) while the ehap1 expression increased significantly on day 4 (∼50.5 folds higher than day 2, p < 0.05, paired t-test) and continued to increase until the end of the experiment (p < 0.05, paired t-test) (Figure 5A,C). Thirdly, a detectable level of eh-PhoAaty expression was observed even in P-replete grown cultures, ∼7 fold higher than ehap1 expression under the same P-replete growth condition (p < 0.05) (Figure 5A,C).
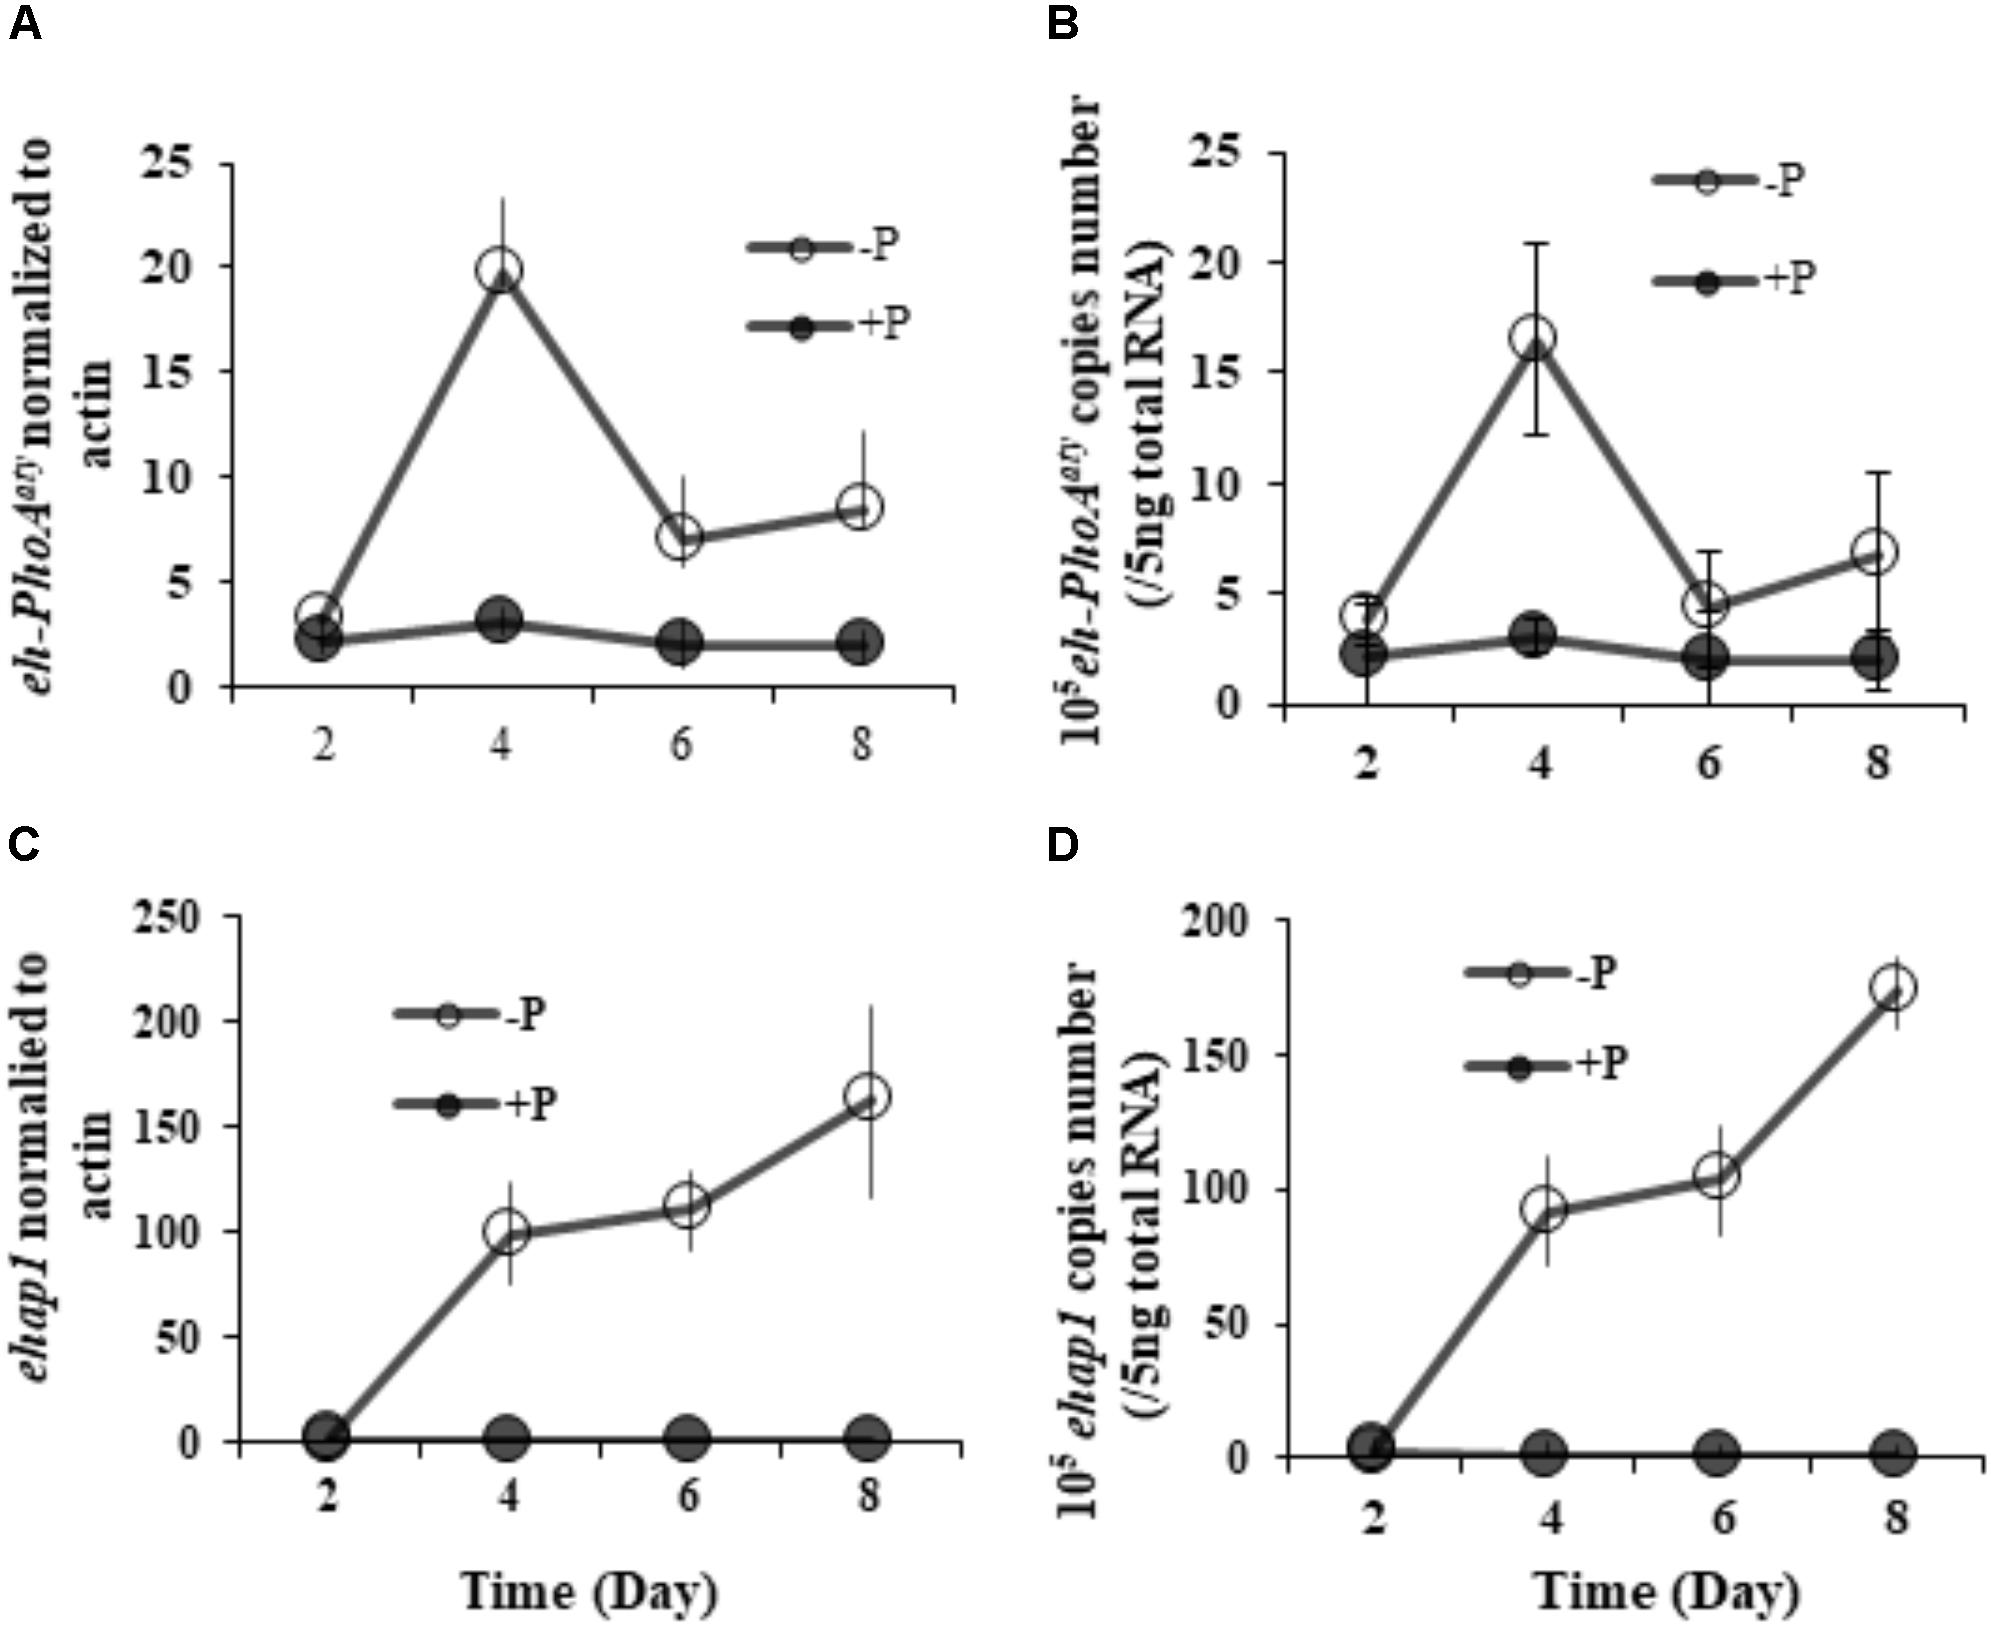
FIGURE 5. Transcriptional expression of both ehap1 and eh-PhoAaty, normalized to actin (A,C) and 5 ng total RNA (B,D) under P-depleted and P-replete conditions. Solid circles, DIP-replete group; White circles, Dip-depleted group.
Translational Expression of EH-PhoAaty Using Western Blot Analysis
The affinity and specificity of the antibody used to detect EH-PhoAaty was verified by competitive immunodetection. An aliquot of the antiserum was pre-incubated with antigen (pACAAP). Then, this pre-incubated antibody and the antiserum without pre-incubation with pACAAP were separately used to react with duplicated protein blots of E. huxleyi. A protein band of ∼110 KDa was detected on the blot using the antiserum whereas the blot using the pre-incubated antiserum showed that the band was largely eliminated (Figure 6A) and the other smaller band (about 50 kD) was slightly eliminated (Supplementary Figure 4). To verify that the ∼110 kDa band was the AP being studied, we cut out the bands corresponding to 100–120 kDa and 40–60 kDa for mass spectroscopic analysis. The result showed that EH-PhoAaty was present only in the fragment of 100–120 kD and not in the shorter fragment (Supplementary Data Sheet 1). This indicated that the antibody was specific to EH-PhoAaty and the ∼110 kDa band was indeed EH-PhoAaty. Also EHAP1 (the predicted MW is 95kD and the experimental size is 75, 110, and 115 kD) (Xu et al., 2010) was also present in the fragment of 100–120 kD. The discrepancy in molecular mass between the detected band (110 kDa) and sequence-based prediction (75 kDa) was probably due to formation of stable dimers or post-translational modification. Some dimers, for instance those linked by sulfide, can remain undissociated in the PAGE gel (Rosen et al., 2010). Besides, N-linked glycosylation can increase the molecular mass of a protein substantially (Kim et al., 2016). In any case, with the antibody of verified specificity, our western blots showed that EH-PhoAaty abundance increased gradually in cells grown under P-depleted conditions, and was markedly more abundant compared to cells grown in the P-replete conditions using Molecular Imager® Chemi Doc XR system for band density analysis (Figure 6B). Normalization to GAPDH and equivalent cell numbers gave a similar result (Figures 6C,D), with EH-PhoAaty abundance in P-depleted cells on day 8 about 10-fold higher than cells grown under P-replete conditions. The same high P-depleted versus low P-replete pattern was consistently obtained from the triplicate cultures (Supplementary Figure 1), although the considerable variation among the triplicate cultures made the difference between their means not statistically different in most of the sample sets.
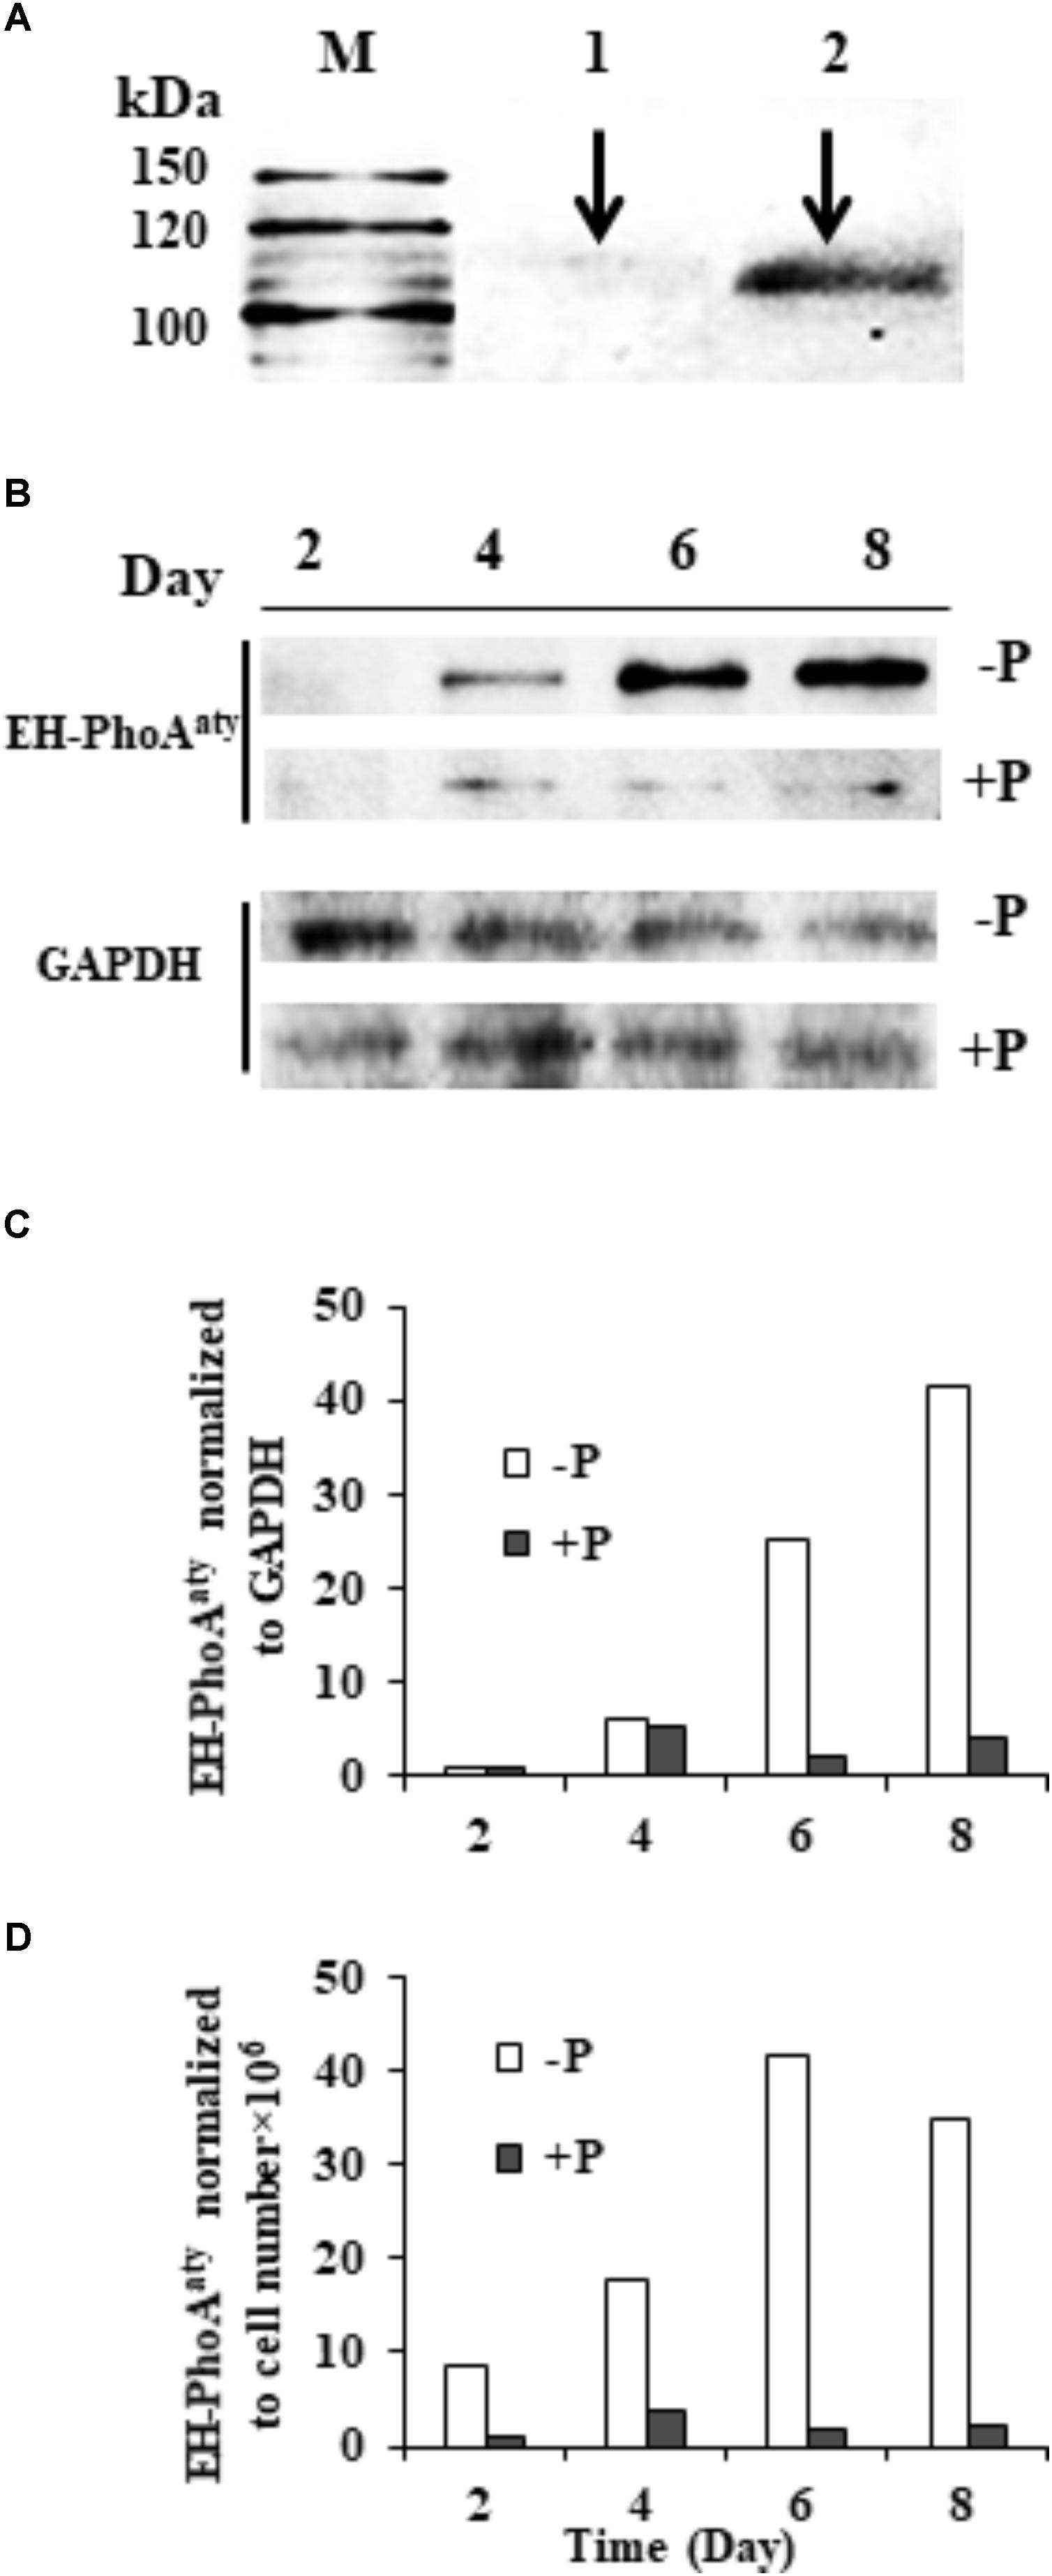
FIGURE 6. Western blot showing the abundance of EH-PhoAaty under P-depleted and P-replete conditions and competitive immunoblot analysis of EH-PhoAaty in E. huxleyi. (A) M, marker. Lanes 1 and 2 contained equal amount (10 μg) of E. huxleyi total proteins; lane 1, poly-antiserum against AP was pre-incubated with antigen (pACAAP) before the western blot analysis; lane 2, poly-antiserum against AP was pre-incubated with buffer instead. (B) Immunoblot images of EH-PhoAaty and GAPDH. (C,D) Densitometric analysis of protein EH-PhoAaty normalized to GAPDH and per cell equivalent to the protein loaded into the gels (B).
Metal Dependency of AP Activity
Cells were collected and washed three times with fresh medium to eliminate the left-over activity of the medium. Compared to the EDTA-treated control, we found that AP activity in the group supplied with extra EDTA remained essentially unchanged, indicating that the chelating pre-incubation already completely eliminated AP activity. With this as the basis, we found that the addition of Ca2+ and Zn 2+ restored AP activity significantly (p < 0.05, t-test; Figure 7). In contrast, the addition of Mg2+ or Co2+ did not restore AP activity.
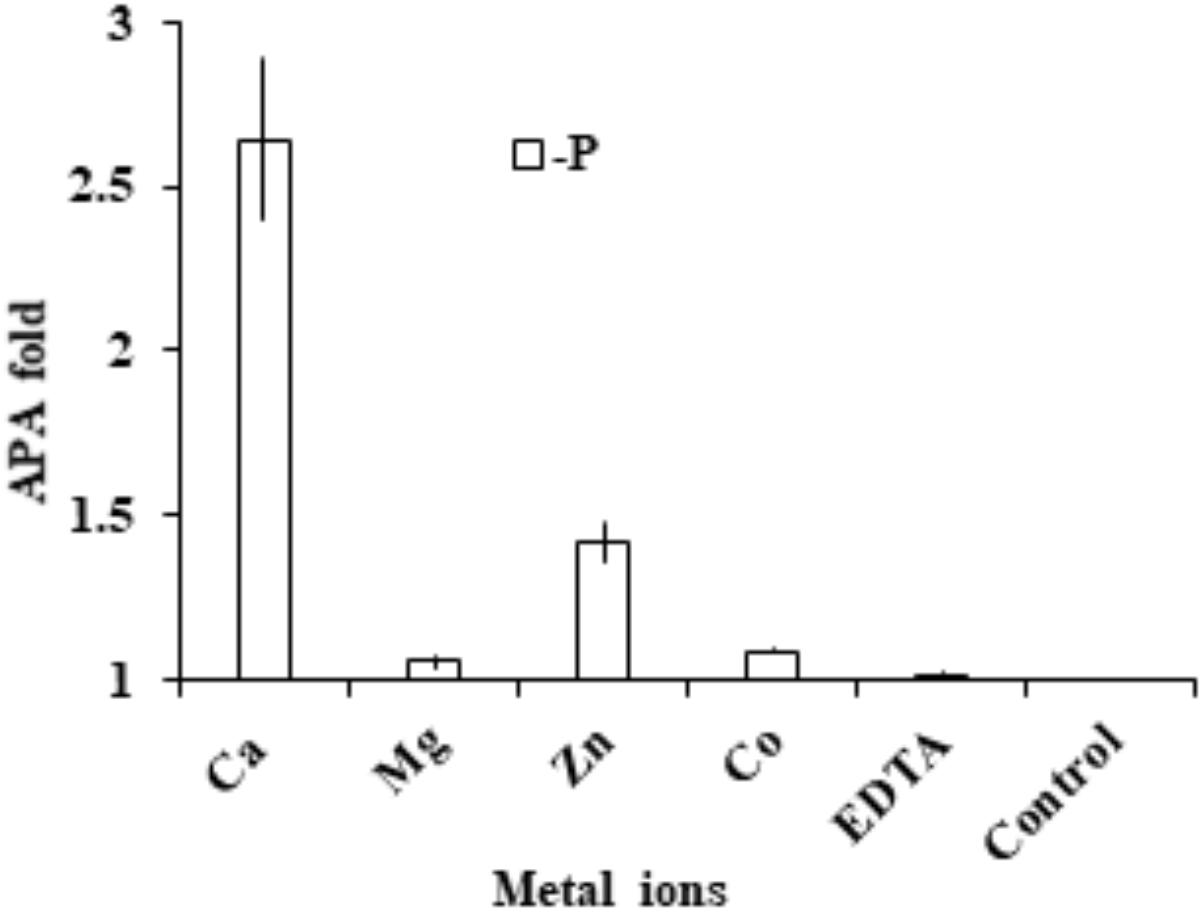
FIGURE 7. Assay to determine cation cofactors of APs in E. huxleyi. After cell lysate was pre-incubated with EDTA to chelate all metal ions, in separate tubes Ca2+, Mg2+, Zn2+, Co2+ and EDTA were added and AP was measured and compared to that in the control (no addition of metal or EDTA).
Discussion
Identification of eh-PhoAaty and Occurrence of Two APs in E. huxleyi
Many studies have been performed to identify and characterize AP genes in marine microorganisms, leading to the categorization of three types of AP in marine prokaryotes (Gomez and Ingram, 1995; Kriakov et al., 2003; Majumdar et al., 2005). However, relatively few AP genes have been identified in eukaryotic phytoplankton, and most are poorly characterized. Efforts so far indicate that multiple types of AP exist in eukaryotic phytoplankton. For instance, a protein with AP activity was detected in the dinoflagellate Prorocentrum minimum (Dyhrman and Palenik, 1997), but a very different family of APs was later identified in a number of dinoflagellate species (Lin et al., 2011, 2012b). The latter APs group phylogenetically with putative AP homologs from other algae, which form a clade recently classified as PhoAaty due to their weak similarity to typical PhoAEC first isolated from E. coli (Zalatan et al., 2006) and being distinct from other phosphatases (Lin X. et al., 2015). Here, we identified such a homolog in E. huxleyi, with the gene name of eh-phoAaty. Sequence comparisons and phylogenetic analyses (Lin et al., 2012a) inferred from AP amino acid sequences of eukaryotes indicated that eh-PhoAaty is more closely related to atypical dinoflagellate APs than APs from other algae. It is even very different from the other characterized AP in E. huxleyi ehap1 (Xu et al., 2006), raising the question why does E. huxleyi possesses two completely different AP genes?
Emiliania huxleyi is a dominant bloom-forming coccolithophore and can be abundant even under oligotrophic conditions (Read et al., 2013). The use of two different APs may be a crucial strategy to exploit P sources under different P availability conditions. An earlier study showed that E. huxleyi expressed two type alkaline phosphatases, one being constitutive that was synthesized at a steady level under different growth rates and the other being inducible that expressed its highest activity at the lowest growth rate (Riegman et al., 2000). However, the correlations between growth rate and ehap1 and EH-PhoAaty observed in our study (Supplementary Figure 5) suggest that both ehap1 and EH-PhoAaty are inducible. Yet it is relatively rare in the literature that the same strain or species of eukaryotic algae harbors different alkaline phosphatase genes. In contrast, three prokaryotic APs, PhoA, PhoX, and PhoD, have been found, which share little sequence similarity and possess different subcellular localizations, metal cofactor requirements, and substrates preferences (Luo et al., 2009, 2011; Sebastian and Ammerman, 2009; Kageyama et al., 2011). In the present study, we found that the two types of APs show different expression patterns and our fractionation experiment and computational prediction suggest differential subcellular localizations. All these in part provide insight into the complex utilization of phosphorus in E. huxleyi. The ecological implications of the differences between these two AP are discussed below.
Differential Responses of eh-PhoAaty and ehap1 Expression to P Deficiency and the Ecological Implications
AP activity has been reported to increase in various algae grown under P-limitation, such as dinoflagellates (Lin et al., 2011), cyanobacteria (Tetu et al., 2009), diatoms (Dyhrman and Ruttenberg, 2006), and coccolithophorids (Xu et al., 2006). In the present study, our results showed that AP gene (eh-PhoAaty and ehap1) expression, protein abundance (EH-PhoAaty), and bulk AP activity were induced strongly by P-stress.
At the transcriptional level, the expression of both eh-PhoAaty and ehap1, relative to the actin reference gene, was higher under P-depleted than P-replete conditions. This indicates that both APs are inducible by P stress. However, the overall expression of these two genes differed considerably. eh-PhoAaty gene expression rapidly reached a maximum from day 2 to day 4 before subsequently dropping, whereas ehap1 expression continued to increase and peaked on day 8 in the whole experiment period (Figure 5). It is unclear why eh-PhoAaty expression decreased after the initial rapid increase, while corresponding protein levels continued to increase (Figure 6), the latter being more consistent with ehap1 expression levels (Figure 5). The discrepancy between gene expression and protein abundance was not likely due to the antibody detecting both EHAP1 and EH-PhoAaty, since competitive immunoblotting showed the antibody was specific for EH-PhoAaty although the protein band detected by the antibody in the western blot (110 kDa) was substantially larger in molecular mass than that predicted based on the amino acid sequence of the gene (75 kDa). One possibility is that this EH-PhoAaty forms stable dimers in vivo. The other is that EH-PhoAaty is modified, like SUMOylation or glycosylation. These possibilities need to be examined by the sophisticated study of protein structure in the future. Furthermore, eh-PhoAaty gene expression (Figure 5A) and EH-PhoAaty protein abundance (Figure 6) were detected in the P-replete grown cells in which ehap1 expression was barely detectable (p < 0.05) (Figure 5C) indicating that some constitutive expression of eh-PhoAaty or its expression may be triggered earlier than ehap1 when phosphate levels in the cell internally decreases.
The difference between eh-PhoAaty and ehap1 was also apparent in their contrasting gene expression profiles. Not only ehap1 transcript showed continuous increase, but also ehap1 expression was about 6–20 fold higher than that of eh-PhoAaty under P-depleted conditions. If this difference is translated to protein abundance and enzyme activity, EHAP1 would play a more important role than EH-PhoAaty in hydrolyzing phosphoesters for phosphate in E. huxleyi.
As demonstrated previously in bacteria (Luo et al., 2009) and eukaryotic phytoplankton (Lin et al., 2012a), APs may also differ in their subcellular localization. EHAP1 was isolated and identified from the medium under P-limitation, and is thus a secretory protein released into the ambient environment (Xu et al., 2006). This is in part supported by computational prediction complemented with the detection of a signal peptide at the N terminus of the protein. In contrast, EH-PhoAaty, with a highly diverging sequence compared to EHAP1, has higher possibility as a non-secretory protein supported by computational prediction (periplasmic) and the lack of a signal peptide. For sure, further verification is needed to examine such a prediction, and direct evidence of that would further help us to deduce the ecological implications of these two APs. Further, our AP assays on various cellular components and whole-cell ELF-labeling indicated that the major contributor of AP activity was cell surface located. Consequently, cell-associated AP activity would enable uptake of P from DOP hydrolysis only in the space immediately surrounding algal cells.
The Cofactor Requirement of APs in E. huxleyi
Divalent cations such as Mg2+, Ca2+, Mn2+, Zn2+ and Co2+ have been reported to be able to activate bacterial or phytoplankton alkaline phosphates (Galperin et al., 1998; Wisniewski, 2006; White, 2009; Sun et al., 2012; Mahaffey et al., 2014). Generally, Zn2+ serves as an essential cofactor for PhoAEC (Coleman, 1992; Zalatan et al., 2006). Previous studies indicated that Co2+ can replace Zn2+ for growth in E. huxleyi (Timmermans et al., 2001; Xu et al., 2007) and AP produced by E. huxleyi was Zn-dependent and Ca2+ could also enhance AP activity (Shaked et al., 2006). Thus, we chose to examine the restoration of AP activity in E. huxleyi by the supplement of Ca2+, Mg2+, Zn2+ and Co2+ respectively.
After AP activity was eliminated by EDTA, the enzymatic activity could be restored by the supplement of Ca2+ (2.6 fold) and Zn2+ (1.4 fold) respectively. In addition, our other study found that dinoflagellate AP (PhoAaty type) was also able to restored by Ca2+ (Lin et al., in preparation), similar to the widely distributed marine PhoX, which was initially reported in Vibrio cholerae (Majumdar et al., 2005) to use calcium and iron as enzyme cofactor (Yong et al., 2014). PhoX has been found to be more widespread in marine bacteria than the conventional PhoAEC in marine environments (Sebastian and Ammerman, 2009) where Zn2+ often occurs at subnanomolar concentrations (Moore et al., 2013). Thus, use of Ca2+ as a cofactor for AP may be an adaptive response to zinc-P co-limited environments. This would explain in part, from the AP perspective, the cosmopolitan distribution of E. huxleyi in both coastal and open oceanic waters. However, direct identification of the co-factor still needs to come from structural analysis of purified AP (Yong et al., 2014), and only then can we start to inquire whether there is differentiation in terms of using Zn2+ or Ca2+ as the cofactor between EHAP1 and EH-PhoAaty.
Conclusion
We identified a new AP (EH-PhoAaty) in E. huxleyi PML B92/11, which is similar in protein sequence (42–55% identical) to an atypical eukaryotic type of AP that is widespread in dinoflagellates. Our mRNA and protein quantification results showed that the expression of both eh-PhoAaty gene and EH-PhoAaty protein were inducible by P deficiency in E. huxleyi. Different transcriptional expression profiles between eh-PhoAaty and ehap1, suggest low level constitutive expression of eh-PhoAaty or a differential P stress threshold triggering their expression when phosphate levels in the cell internally decrease. Furthermore, we found that Ca2+ can highly restore cell associated AP activity suggesting an adaptation to zinc-P co-limited open ocean environments. However, further work needs to resolve their potentially different modes of action and the cofactor requirement of EH-PhoAaty and EHAP1.
Author Contributions
SL and XL designed the study. TL conducted the experiments. CG, YZ, and CW contributed to the experimental design and data analysis. TL, SL, XL, and CW wrote the paper.
Funding
This work was supported by National Key Research and Development Program of China grant 2016YFA0601202 (SL), Natural Science Foundation of China grants NSFC 41776116 (SL) and 41706116 (XL), and Fundamental Research Funds for the Central Universities 20720180101 (XL) and 20720180123 (SL).
Conflict of Interest Statement
The authors declare that the research was conducted in the absence of any commercial or financial relationships that could be construed as a potential conflict of interest.
Acknowledgments
We thank all members of Marine EcoGenomics Laboratory of Xiamen University, China for various ways of assistance in this study and Miss Huiyun Chen and Yaying Wu of Xiamen University, China for assistance with the operation of the Laser Scanning Confocal Microscope and AB Sciex TripleTOF® 5600+, respectively. We also thank Wupeng Xiao, Ling Li, and Xinguo Shi for their help in data analysis.
Supplementary Material
The Supplementary Material for this article can be found online at: https://www.frontiersin.org/articles/10.3389/fmicb.2018.02156/full#supplementary-material
Footnotes
References
Ameijeiras, S. B., Lebrato, M., Stoll, H. M., Rodriguez, D. I., Müller, M. N., Vicente, A. M., et al. (2016). Phenotypic variability in the coccolithophore Emiliania huxleyi. PLoS One 11:e157697. doi: 10.1371/journal.pone.0157697
Bach, L. T., Mackinder, L. C. M., Schulz, K. G., Wheeler, G. L., Schroeder, D. C., Brownlee, C., et al. (2013). Dissecting the impact of CO2 and pH on the mechanisms of photosynthesis and calcification in the coccolithophore Emiliania huxleyi. New Phytol. 199, 121–134. doi: 10.1111/nph.12225
Bowler, C., Allen, A. E., Badger, J. H., Grimwood, J., Jabbari, K., Kuo, A., et al. (2008). The Phaeodactylum genome reveals the evolutionary history of diatom genomes. Nature 456, 239–244. doi: 10.1038/nature07410
Brown, C. W., and Yoder, J. A. (1994). Coccolithophorid blooms in the global ocean. J. Geophys. Res. Oceans 99, 7467–7482. doi: 10.1029/93JC02156
Cembella, A. D., Antia, N. J., and Harrison, P. J. (1984). The utilization of inorganic and organic phosphorus compounds as nutrients by eukaryotic microalgae: a multidisciplinary perspective: part I. CRC Crit. Rev. Microbiol. 10, 317–391. doi: 10.3109/10408418209113567
Clark, L. L., Ingall, E. D., and Benner, R. (1998). Marine phosphorus is selectively remineralized. Nature 393, 426–426. doi: 10.1038/30881
Coleman, J. E. (1992). Structure and mechanism of alkaline phosphatase. Annu. Rev. Biophys. Biomol. Struct. 21, 441–483. doi: 10.1146/annurev.bb.21.060192.002301
Cui, Y., Lin, X., Zhang, H., Lin, L., and Lin, S. (2016). PhnW-PhnX pathway in dinoflagellates not functional to utilize extracellular phosphonates. Front. Mar. Sci. 2:120. doi: 10.3389/fmars.2015.00120
Duhamel, S., Dyhrman, S. T., and Karl, D. M. (2010). Alkaline phosphatase activity and regulation in the North Pacific Subtropical Gyre. Limnol. Oceanogr. 55:1414. doi: 10.4319/lo.2010.55.3.1414
Dyhrman, S. T., Ammerman, J. W., and Van Mooy, B. A. S. (2007). Microbes and the marine phosphorus cycle. Oceanography 20, 110–116. doi: 10.5670/oceanog.2007.54
Dyhrman, S. T., Jenkins, B. D., Rynearson, T. A., Saito, M. A., Mercier, M. L., Alexander, H., et al. (2012). The transcriptome and proteome of the diatom Thalassiosira pseudonana reveal a diverse phosphorus stress response. PLoS One 7:e33768. doi: 10.1371/journal.pone.0033768
Dyhrman, S. T., and Palenik, B. (2003). Characterization of ectoenzyme activity and phosphate-regulated proteins in the coccolithophorid E. huxleyi. J. Plankton Res. 25, 1215–1225. doi: 10.1093/plankt/fbg086
Dyhrman, S. T., and Palenik, B. P. (1997). The identification and purification of a cell-surface alkaline phosphatase from the dinoflagellate Prorocentrum minimum (Dinophyceae)1. J. Phycol. 33, 602–612. doi: 10.1111/j.0022-3646.1997.00602.x
Dyhrman, S. T., and Ruttenberg, K. C. (2006). Presence and regulation of alkaline phosphatase activity in eukaryotic phytoplankton from the coastal ocean: implications for dissolved organic phosphorus remineralization. Limnol. Oceanogr. 51, 1381–1390. doi: 10.4319/lo.2006.51.3.1381
Galperin, M. Y., Koonin, E. V., and Bairoch, A. (1998). A superfamily of metalloenzymes unifies phosphopentomutase and cofactor-independent phosphoglycerate mutase with alkaline phosphatases and sulfatases. Protein Sci. 7, 1829–1835. doi: 10.1002/pro.5560070819
Gomez, P. F., and Ingram, L. O. (1995). Cloning, sequencing and characterization of the alkaline phosphatase gene (phoD) from Zymomonas mobilis. FEMS Microbiol. Lett. 125, 237–245. doi: 10.1111/j.1574-6968.1995.tb07364.x
Guillard, R. R. L., and Ryther, J. H. (1962). Studies of marine planktonic diatoms: 1, cyclotella nana hustedt, and detonula confervacea (cleve gran). Can. J. Microbiol. 8, 229–239. doi: 10.1139/m62-029
Guindon, S., Dufayard, J. F., Lefort, V., Anisimova, M., Hordijk, W., and Gascuel, O. (2010). New algorithms and methods to estimate maximum-likelihood phylogenies: assessing the performance of PhyML 3.0. Syst. Biol. 59, 307–321. doi: 10.1093/sysbio/syq010
Hou, Y., Zhang, H., Miranda, L., and Lin, S. (2010). Serious overestimation in quantitative PCR by circular (supercoiled) plasmid standard: microalgal PCNA as the model gene. PLoS One 5:e9545. doi: 10.1371/journal.pone.0009545
Huang, B., Ou, L., Wang, X., Huo, W., Li, R., Hong, H., et al. (2007). Alkaline phosphatase activity of phytoplankton in East China Sea coastal waters with frequent harmful algal bloom occurrences. Aquat. Microb. Ecol. 49, 195–206. doi: 10.3354/ame01135
Kageyama, H., Tripathi, K., Rai, A. K., Cha-um, S., Waditee-Sirisattha, R., and Takabe, T. (2011). An alkaline phosphatase/phosphodiesterase, PhoD, induced by salt stress and secreted out of the cells of Aphanothece halophytica, a halotolerant cyanobacterium. Appl. Environ. Microbiol. 77, 5178–5183. doi: 10.1128/AEM.00667-11
Karl, D., and Björkman, K. (2002). “Dynamics of DOP,” in Biogeochemistry of Marine Dissolved Organic Matter, eds D. A. Hansell and C. A. Carlson (Amsterdam: Elsevier Science), 249–366.
Karl, D. M. (2014). Microbially mediated transformations of phosphorus in the sea: new views of an old cycle. Ann. Rev. Mar. Sci. 6, 279–337. doi: 10.1146/annurev-marine-010213-135046
Kim, Y. H., Kwak, M. S., Park, J. B., Lee, S. A., Choi, J. E., Cho, H. S., et al. (2016). N-linked glycosylation plays a crucial role in the secretion of HMGB1. J. Cell Sci. 129, 29–38. doi: 10.1242/jcs.176412
Kolowith, L. C., Ingall, E. D., and Benner, R. (2001). Composition and cycling of marine organic phosphorus. Limnol. Oceanogr. 46, 309–320. doi: 10.4319/lo.2001.46.2.0309
Kriakov, J., Lee, S. H., and Jacobs, W. R. (2003). Identification of a regulated alkaline phosphatase, a cell surface-associated lipoprotein in Mycobacterium smegmatis. J. Bacteriol. 185, 4983–4991. doi: 10.1128/JB.185.16.4983-4991.2003
Labry, C., Delmas, D., and Herbland, A. (2005). Phytoplankton and bacterial alkaline phosphatase activities in relation to phosphate and DOP availability within the Gironde plume waters (Bay of Biscay). J. Exp. Mar. Biol. Ecol. 318, 213–225. doi: 10.1016/j.jembe.2004.12.017
Lee, D., Choi, S., Rha, E., Kim, S. J., Yeom, S., Moon, J., et al. (2015). A novel psychrophilic alkaline phosphatase from the metagenome of tidal flat sediments. BMC Biotechnol. 15:1. doi: 10.1186/s12896-015-0115-2
Li, M., Shi, X., Guo, C., and Lin, S. (2016). Phosphorus deficiency inhibits cell division but not growth in the dinoflagellate Amphidinium carterae. Front. Microbiol. 7:826. doi: 10.3389/fmicb.2016.00826
Lin, S., Chang, J., and Carpenter, J. (1994). Detection of proliferating cell nuclear antigen analog in four species of marine phytoplankton1. J. Phycol. 30, 449–456. doi: 10.1111/j.0022-3646.1994.00449.x
Lin, S., Cheng, S., Song, B., Zhong, X., Lin, X., Li, L., et al. (2015). The Symbiodinium kawagutii genome illuminates dinoflagellate gene expression and coral symbiosis. Science 350, 691–695. doi: 10.1126/science.aad0408
Lin, X., Wang, L., Shi, X., and Lin, S. (2015). Rapidly diverging evolution of an atypical alkaline phosphatase (PhoAaty) in marine phytoplankton: insights from dinoflagellate alkaline phosphatases. Front. Microbiol. 6:868. doi: 10.3389/fmicb.2015.00868
Lin, S., Litaker, W., and Sunda, G. (2016). Phosphorus physiological ecology and molecular mechanisms in marine phytoplankton. J. Phycol. 52, 10–36. doi: 10.1111/jpy.12365
Lin, X., Zhang, H., Cui, Y., and Lin, S. (2012a). High sequence variability, diverse subcellular localizations, and ecological implications of alkaline phosphatase in dinoflagellates and other eukaryotic phytoplankton. Front. Microbiol. 3:235. doi: 10.3389/fmicb.2012.00235
Lin, X., Zhang, H., Huang, B., and Lin, S. (2012b). Alkaline phosphatase gene sequence characteristics and transcriptional regulation by phosphate limitation in Karenia brevis (Dinophyceae). Harmful Algae 17, 14–24. doi: 10.1016/j.hal.2012.02.005
Lin, X., Zhang, H., Huang, B., and Lin, S. (2011). Alkaline phosphatase gene sequence and transcriptional regulation by phosphate limitation in Amphidinium carterae (Dinophyceae). J. Phycol. 47, 1110–1120. doi: 10.1111/j.1529-8817.2011.01038.x
Lomas, M. W., Swain, A., Shelton, R., and Ammerman, J. W. (2004). Taxonomic variability of phosphorus stress in Sargasso Sea phytoplankton. Limnol. Oceanogr. 49, 2303–2309. doi: 10.4319/lo.2004.49.6.2303
Luo, H., Benner, R., Long, R. A., and Hu, J. (2009). Subcellular localization of marine bacterial alkaline phosphatases. Proc. Natl. Acad. Sci. U.S.A. 106, 21219–21223. doi: 10.1073/pnas.0907586106
Luo, H., Lin, X., Li, L., Lin, L., Zhang, C., and Lin, S. (2017). Transcriptomic and physiological analyses of the dinoflagellate Karenia mikimotoi reveal non-alkaline phosphatase-based molecular machinery of ATP utilization. Environ. Microbiol. 19, 4506–4518. doi: 10.1111/1462-2920.13899
Luo, H., Zhang, H., Long, R. A., and Benner, R. (2011). Depth distributions of alkaline phosphatase and phosphonate utilization genes in the North Pacific Subtropical Gyre. Aquat. Microb. Ecol. 62, 61–69. doi: 10.3354/ame01458
Mahaffey, C., Reynolds, S., Davis, C. E., and Lohan, M. C. (2014). Alkaline phosphatase activity in the subtropical ocean: insights from nutrient, dust and trace metal addition experiments. Front. Mar. Sci. 1:73. doi: 10.3389/fmars.2014.00073
Majumdar, A., Ghatak, A., and Ghosh, R. K. (2005). Identification of the gene for the monomeric alkaline phosphatase of Vibrio cholerae serogroup O1 strain. Gene 344, 251–258. doi: 10.1016/j.gene.2004.11.005
Marsh, M. E. (2003). Regulation of CaCO3 formation in coccolithophores. Compar. Biochem. Physiol. Part B Biochem. Mol. Biol. 136, 743–754. doi: 10.1016/S1096-4959(03)00180-5
Masahiro, S., and Kimitoshi, I. (1998). Characterization of dissolved organic phosphorus in coastal seawater using ultrafiltration and phosphohydrolytic enzymes. Limnol. Oceanogr. 43, 1553–1564. doi: 10.4319/lo.1998.43.7.1553
Mckew, B. A., Metodieva, G., Raines, C. A., Metodiev, M. V., and Geider, R. J. (2015). Acclimation of Emiliania huxleyi (1516) to nutrient limitation involves precise modification of the proteome to scavenge alternative sources of N and P. Environ. Microbiol. 17, 4050–4062. doi: 10.1111/1462-2920.12957
Moore, C. M., Mills, M. M., Arrigo, K. R., Bermanfrank, I., Bopp, L., Boyd, P. W., et al. (2013). Processes and patterns of oceanic nutrient limitation. Nat. Geosci. 6, 701–710. doi: 10.1038/ngeo1765
Moutin, T., Karl, D. M., Duhamel, S., Rimmelin, P., Raimbault, P., Van Mooy, B. A., et al. (2007). Phosphate availability and the ultimate control of new nitrogen input by nitrogen fixation in the tropical Pacific Ocean. Biogeosci. Discuss. 4, 2407–2440. doi: 10.5194/bg-5-95-2008
Nicholson, D. P., Dyhrman, S. T., Chavez, F. P., and Paytan, A. (2006). Alkaline phosphatase activity in the phytoplankton communities of Monterey Bay and San Francisco Bay. Limnol. Oceanogr. 51, 874–883. doi: 10.4319/lo.2006.51.2.0874
Paasche, E. (2002). A review of the coccolithophorid Emiliania huxleyi (Prymnesiophyceae), with particular reference to growth, coccolith formation, and calci cation-photosynthesis interactions. Phycologia 40, 503–529. doi: 10.2216/i0031-8884-40-6-503.1
Petersen, T. N., Brunak, S., Heijne, G. V., and Nielsen, H. B. (2011). SignalP 4.0: discriminating signal peptides from transmembrane regions. Nat. Methods 8, 785–786. doi: 10.1038/nmeth.1701
R Development Core Team. (2018). R: A Language and Environment for Statistical Computing. Vienna: R Foundation for Statistical Computing. Available at: http://cran.r-project.org
Read, B. A., Kegel, J., Klute, M. J., Kuo, A., Lefebvre, S. C., Maumus, F., et al. (2013). Pan genome of the phytoplankton Emiliania underpins its global distribution. Nature 499, 209–213. doi: 10.1038/nature12221
Riegman, R., Noordeloos, A. A. M., and Cadée, G. C. (1992). Phaeocystis blooms and eutrophication of the continental coastal zones of the North Sea. Mar. Biol. 112, 479–484. doi: 10.1007/BF00356293
Riegman, R., Stolte, W., Noordeloos, A. A. M., and Slezak, D. (2000). Nutrient uptake and alkaline phosphatase (ec 3:1:3:1) activity of E. huxleyi (PRYMNESIOPHYCEAE) during growth under N and P limitation in continuous cultures. J. Phycol. 36, 87–96. doi: 10.1046/j.1529-8817.2000.99023.x
Rosen, R. F., Tomidokoro, Y., Ghiso, J., and Walker, L. C. (2010). SDS-PAGE/immunoblot detection of Aβ multimers in human cortical tissue homogenates using antigen-epitope retrieval. J. Vis. Exp. 38, 1–4. doi: 10.3791/1916
Rost, B., and Riebesell, U. (2004). “Coccolithophores and the biological pump: responses to environmental changes”, in Coccolithophores: From Molecular Processes To Global Impact, eds H. R. Thierstein and J. R. Young (Berlin: Springer Berlin Heidelberg), 99–125. doi: 10.1007/978-3-662-06278-4_5
Saitou, N., and Nei, M. (1987). The neighbor-joining method: a new method for reconstructing phylogenetic trees. Mol. Biol. Evol. 4, 406–425. doi: 10.1093/oxfordjournals.molbev.a040454
Sebastian, M., and Ammerman, J. W. (2009). The alkaline phosphatase PhoX is more widely distributed in marine bacteria than the classical PhoA. ISME J. 3, 563–572. doi: 10.1038/ismej.2009.10
Shaked, Y., Xu, Y., Leblanc, K., and Morel, F. M. M. (2006). Zinc availability and alkaline phosphatase activity in E. huxleyi: implications for Zn-P co-limitation in the ocean. Limnol. Oceanogr. 51, 299–309. doi: 10.4319/lo.2006.51.1.0299
Shi, X., Li, L., Guo, C., Lin, X., Li, M., and Lin, S. (2015). Rhodopsin gene expression regulated by the light dark cycle, light spectrum and light intensity in the dinoflagellate Prorocentrum. Front. Microbiol. 6:555. doi: 10.3389/fmicb.2015.00555
Sun, M., Sun, J., Qiu, J., Jing, H., and Liu, H. (2012). Characterization of the proteomic profiles of the brown tide alga Aureoumbra lagunensis under phosphate-and nitrogen-limiting conditions and of its phosphate limitation-specific protein with alkaline phosphatase activity. Appl. Environ. Microbiol. 78, 2025–2033. doi: 10.1128/AEM.05755-11
Tamura, K., Peterson, D., Peterson, N., Stecher, G., Nei, M., and Kumar, S. (2011). MEGA5: molecular evolutionary genetics analysis using maximum likelihood, evolutionary distance, and maximum parsimony methods. Mol. Biol. Evol. 10, 2731–2739. doi: 10.1093/molbev/msr121
Tetu, S. G., Brahamsha, B., Johnson, D. A., Tai, V., Phillippy, K., Palenik, B., et al. (2009). Microarray analysis of phosphate regulation in the marine cyanobacterium Synechococcus sp, WH8102. ISME J. 3, 835–849. doi: 10.1038/ismej.2009.31
Thingstad, T. F., Krom, M. D., Mantoura, R. F. C., Flaten, G. A. F., Groom, S., Herut, B., et al. (2005). Nature of phosphorus limitation in the ultraoligotrophic Eastern Mediterranean. Science 309, 1068–1071. doi: 10.1126/science.1112632
Timmermans, K. R., Snoek, J., Gerringa, L. J. A., Zondervan, I., and Baar, H. J. W. D. (2001). Not all eukaryotic algae can replace zinc with cobalt. Limnol. Oceanogr. 46, 699–703. doi: 10.4319/lo.2001.46.3.0699
Timothy, R., Yoshiaki, M., and Carol, M. (1984). A Manual of Chemical and Biological Methods for Seawater Analysis. New York, NY: Pergamon Press.
Van Mooy, B. A. S., Fredricks, H. F., Pedler, B. E., Pedler, B. E., Dyhrman, S. T., Karl, D. M., et al. (2009). Phytoplankton in the ocean use non-phosphorus lipids in response to phosphorus scarcity. Nature 458, 69–72. doi: 10.1038/nature07659
Wang, C., Lin, X., Li, L., and Lin, S. (2016). Differential growth responses of marine phytoplankton to herbicide glyphosate. PLoS One 11:0e151633. doi: 10.1371/journal.pone.0151633
White, A. E. (2009). New insights into bacterial acquisition of phosphorus in the surface ocean. Proc. Natl. Acad. Sci. U.S.A. 106, 21013–21014. doi: 10.1073/pnas.0912475107
Wisniewski, R. (2006). Relating the Biogeochemistries of Zinc, Cobalt, and Phosphorus to Phytoplankton Activities in the Sea. Dissertation, Woods Hole Oceanographic Institution, St, Woods Hole, MA.
Xu, Y., Boucher, J. M., and Morel, F. M. M. (2010). Expression and diversity of alkaline phosphatase EHAP1 in Emiliania huxleyi (Prymnesiophyceae) 1. J. Phycol. 46, 85–92. doi: 10.1111/j.1529-8817.2009.00788.x
Xu, Y., Tang, D., Shaked, Y., and Morel, F. M. M. (2007). Zinc, cadmium, and cobalt interreplacement and relative use efficiencies in the coccolithophore Emiliania huxleyi. Limnol. Oceanogr. 52, 2294–2305. doi: 10.4319/lo.2007.52.5.2294
Xu, Y., Wahlund, T. M., Feng, L., Shaked, Y., and Morel, F. M. M. (2006). A novel alkaline phosphatase in the Coccolithophore Emiliania huxleyi (Prymnesiophyceae) and its regulation by phosphorus. J. Phycol. 42, 835–844. doi: 10.1111/j.1529-8817.2006.00243.x
Yong, S. C., Roversi, P., Lillington, J., Rodriguez, F., Krehenbrink, M., Zeldin, O. B., et al. (2014). A complex iron-calcium cofactor catalyzing phosphotransfer chemistry. Science 345, 1170–1173. doi: 10.1126/science.1254237
Yu, C., Chen, Y., Lu, C., and Hwang, J. (2006). Prediction of protein subcellular location. Proteins 64, 643–651. doi: 10.1002/prot.21018
Zalatan, J. G., Fenn, T. D., Brunger, A. T., and Herschlag, D. (2006). Structural and functional comparisons of nucleotide pyrophosphatase/phosphodiesterase and alkaline phosphatase: implications for mechanism and evolution. Biochemistry 45, 9788–9803. doi: 10.1021/bi060847t
Zhang, C., Luo, H., Huang, L., and Lin S. (2017). Molecular mechanism of glucose-6-phosphate utilization in the dinoflagellate Karenia mikimotoi. Harmful Algae 67, 74–84. doi: 10.1016/j.hal.2017.06.006
Zhang, H., Hou, Y., Miranda, L., Campbell, D. A., Sturm, N. R., Gaasterland, T., et al. (2007). Spliced leader RNA trans-splicing in dinoflagellates. Proc. Natl. Acad. Sci. U.S.A. 104, 4618–4623. doi: 10.1073/pnas.0700258104
Keywords: Emiliania huxleyi, alkaline phosphatase, gene expression, phosphorus limitation, cofactor
Citation: Li T, Guo C, Zhang Y, Wang C, Lin X and Lin S (2018) Identification and Expression Analysis of an Atypical Alkaline Phosphatase in Emiliania huxleyi. Front. Microbiol. 9:2156. doi: 10.3389/fmicb.2018.02156
Received: 02 December 2017; Accepted: 23 August 2018;
Published: 19 September 2018.
Edited by:
Jonathan P. Zehr, University of California, Santa Cruz, United StatesReviewed by:
Elly Spijkerman, Universität Potsdam, GermanyDavid J. Scanlan, University of Warwick, United Kingdom
Maria Segovia, Universidad de Málaga, Spain
Copyright © 2018 Li, Guo, Zhang, Wang, Lin and Lin. This is an open-access article distributed under the terms of the Creative Commons Attribution License (CC BY). The use, distribution or reproduction in other forums is permitted, provided the original author(s) and the copyright owner(s) are credited and that the original publication in this journal is cited, in accordance with accepted academic practice. No use, distribution or reproduction is permitted which does not comply with these terms.
*Correspondence: Xin Lin, eGlubGluQHhtdS5lZHUuY24= Senjie Lin, c2VuamllLmxpbkB1Y29ubi5lZHU=