 Yang Zhang1†
 Chaoyue Chen
 Xuelei Ma
 Xuejin Ou
 Fan Xia
 Jianguo Xu
- 1Department of Neurosurgery, West China Hospital, Sichuan University, Chengdu, China
- 2Department of Radiology, Sichuan Provincial People's Hospital, Sichuan Academy of Medical Sciences, Chengdu, China
- 3Department of Biotherapy, Cancer Center, West China Hospital, Sichuan University, Chengdu, China
- 4State Key Laboratory of Biotherapy and Cancer Center, West China Hospital, Sichuan University and Collaborative Innovation Center for Biotherapy, Chengdu, China
- 5West China School of Medicine, West China Hospital, Sichuan University, Chengdu, China
- 6School of Computer Science, Nanjing University of Science and Technology, Nanjing, China
Purpose: The aim of this study was to investigate the diagnostic value of machine-learning models with radiomic features and clinical features in preoperative differentiation of common lesions located in the anterior skull base.
Methods: A total of 235 patients diagnosed with pituitary adenoma, meningioma, craniopharyngioma, or Rathke cleft cyst were enrolled in the current study. The discrimination was divided into three groups: pituitary adenoma vs. craniopharyngioma, meningioma vs. craniopharyngioma, and pituitary adenoma vs. Rathke cleft cyst. In each group, five selection methods were adopted to select suitable features for the classifier, and nine machine-learning classifiers were employed to build discriminative models. The diagnostic performance of each combination was evaluated with area under the receiver operating characteristic curve (AUC), accuracy, sensitivity, and specificity calculated for both the training group and the testing group.
Results: In each group, several classifiers combined with suitable selection methods represented feasible diagnostic performance with AUC of more than 0.80. Moreover, the combination of least absolute shrinkage and selection operator as the feature-selection method and linear discriminant analysis as the classification algorithm represented the best comprehensive discriminative ability.
Conclusion: Radiomics-based machine learning could potentially serve as a novel method to assist in discriminating common lesions in the anterior skull base prior to operation.
Introduction
A variety of lesions are present in the anterior skull base. The most common types of tumors in this area are pituitary adenoma, craniopharyngioma, and meningioma (1, 2). Rathke cleft cyst is also taken as the common differential diagnosis for the sellar mass as a congenital lesion (3). The importance of early diagnosis for lesions in this region has been highlighted because even these benign lesions may be progressive and unrelenting if situated in an area where growth cannot be controlled, and some of them could show aggressive behavior (4). Magnetic resonance (MR) scan is highly recommended for preoperative evaluation of the anterior skull base lesion owing to the advantage of excellent soft tissue resolution. Descriptions of the four types of lesions in MR imaging (MRI) are characteristic (5). However, the diagnostic accuracy of MR images depends on experiences of radiologists, and in some cases, these lesions with similar MRI patterns may mimic each other and complicate the radiological diagnosis (6, 7). Therefore, new methods that could assist in preoperative differentiation may be of clinical value.
Radiomics could extract high-dimensional features from medical images and provide information associated with the pathophysiology of lesions that is difficult to be assessed by visual inspection (8–10). Moreover, mineable radiomic features of lesions could be analyzed with the novel machine-learning technology that has shown promising prospects in the biomedical domain (11). Radiomics-based machine learning has been applied in differential diagnosis of various brain tumors in previous studies, representing the potential to be utilized in clinical practice to facilitate diagnosis, and offer guidance for decision making (12–16). In the present study, we evaluated the ability of machine-learning technology combined with MRI radiomic features and clinical parameters in differentiating the four common types of lesions in the anterior skull base. Considering the epidemiology and position of lesions, the differential analysis was divided into three groups: pituitary adenoma vs. craniopharyngioma (the most common tumors in the sellar/suprasellar region), meningioma vs. craniopharyngiomas (the most common tumors in the parasellar region), and pituitary adenoma vs. Rathke cleft cyst (the most common lesions in the intrasellar region).
Method
Patient Selection
Institution database was reviewed to search for patients treated at our neurosurgery department from November 2014 to June 2018. We initially selected the potentially qualified patients according to the following criteria: (a) with the pathological confirmation of pituitary adenoma, craniopharyngioma, meningioma, or Rathke cleft cyst; (b) the lesion was located at the anterior skull base; and (c) with preoperative sellar MR images. Exclusion criteria were as follows: (a) history of any other intracranial diseases, such as stroke and intracranial infection; (b) history of any anti-tumor treatment prior to MR scans, such as brain surgery, chemotherapy, or radiotherapy; and (c) incomplete electronic medical records. The flowchart of patient selection is shown in Figure 1. Clinical parameters were recorded, including age, gender, lesion size, and the time between MR scan and surgery. The lesion size was measured by the maximum diameter of the lesion that was collected from radiological reports. This retrospective study was approved by the institutional review board. The written informed consent was obtained from all participants (written informed consent for patients <16 years old was obtained from their parents or guardians).
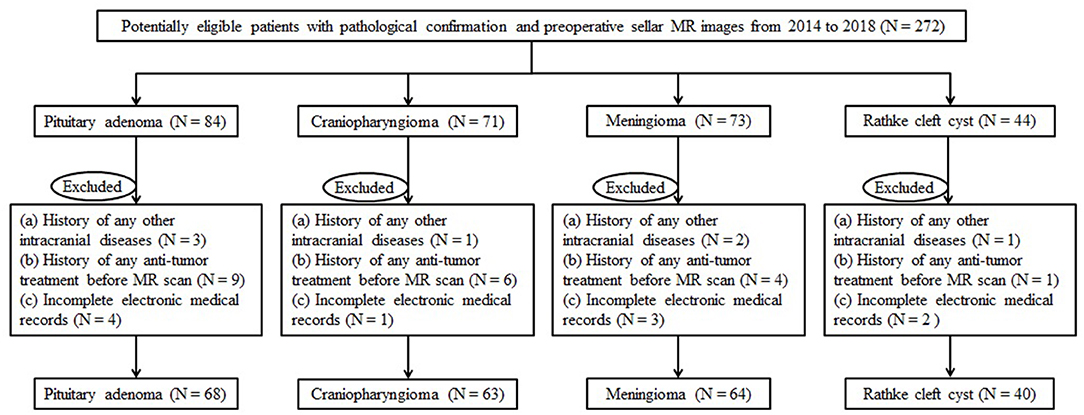
Figure 1. Workflow chart of the patient enrollment process.
Image Acquisition
All patients underwent MR scans via a 3.0-T GE scanner with an eight-channel phase array head coil. The parameters of the contrast-enhanced T1-weighted imaging were as follows: TR/TE = 552/10 ms, slice thickness = 5 mm, flip angle = 90°, field of view = 150 × 150 mm2, data matrix = 256 × 256, and voxel size = 1.0 × 1.0 × 1.0 mm3. The scanning was conducted within 200 s after injection of gadopentetate dimeglumine (0.1 mmol/kg) as the contrast agent. The preoperative MR images were collected from picture archiving and communication system (PACS) of our institutional radiology department (Figure 2).
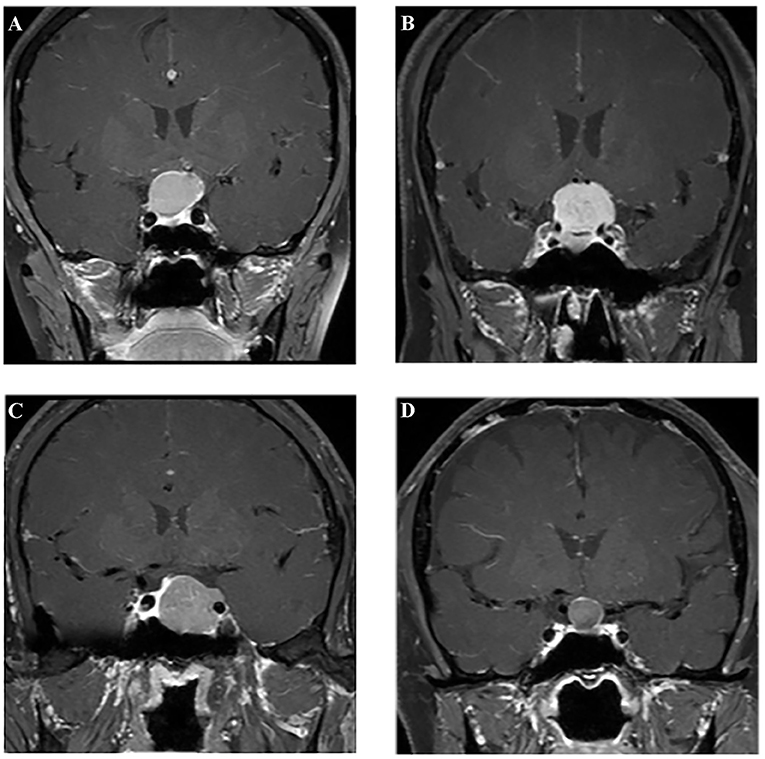
Figure 2. Examples of different lesions on contrast-enhanced T1-weighted image. (A) Craniopharyngioma; (B) meningioma; (C) pituitary adenoma; (D) Rathke cleft cyst.
Feature Extraction
Texture features were extracted from MR images as radiomic parameters by two neurosurgeons together with the assistance of senior radiologists using LIFEx software (http://www.lifexsoft.org) (17). Following protocols of the software, the region of interest (ROI) was manually drawn within the border of the lesion in each slice. Considering the clear depiction of the boundary of lesions, ROI delineation was performed on the contrast-enhanced T1-weighted imaging, in which lesions were carefully separated from adjacent brain tissues through different enhancement patterns and surrounding anatomic structures. Any disagreements regarding the border of lesions were recorded and solved by senior radiologists. After the whole lesion was contoured slice by slice, three-dimensional radiomic parameters could be automatically calculated by the software with established formulas (Supplementary Material 1). A total of 40 features were obtained from two orders, including the first-order features from shape-based matrix and histogram-based matrix, and the second-order/higher-order features from gray-level co-occurrence matrix (GLCM), gray-level zone length matrix (GLZLM), neighborhood gray-level dependence matrix (NGLDM), and gray-level run length matrix (GLRLM) (Supplementary Material 2). Examples of ROI delineation are shown in Supplementary Material 3. Combined with two clinical parameters (age and gender), a dataset was built for further analysis.
Machine-Learning Modeling
Given that there was a relatively large number of statistics and some parameters may not be associated with the differential process, optimal features should be selected first for the predictive model. The feature-selection method was important but complicated considering the sample size and efficiency in discrimination. Least absolute shrinkage and selection operator (LASSO) regression model was reported to be appropriate for high-dimensional data regression analysis (18, 19). Other selection methods were also evaluated by previous researchers and reported to represent good diagnostic performances (20, 21). To settle the dilemma, five different feature-selection methods were adopted, namely, distance correlation, random forest (RF), LASSO, eXtreme gradient boosting (Xgboost), and gradient boosting decision tree (GBDT). A similar predicament also needs to be solved in regard to the selection of machine-learning classifiers. We employed nine classification algorithms in this study, including linear discriminant analysis (LDA), support vector machine (SVM), RF, Adaboost, k-nearest neighbor (KNN), GaussianNB, logistic regression (LR), GBDT, and decision tree (DT). Patients were randomly divided into the training group and the testing group at the ratio of 4:1 on the basis of experiences from previous studies (22–24). The model was first created by the training group and then applied to the independent testing group, and this procedure was repeated over 100 times to conclude the realistic distribution of classification accuracies. Area under receiver operating characteristic (ROC) curve (AUC), accuracy, sensitivity, and specificity were calculated based on the confusion matrix to assess the discriminative ability of different models. Regular statistical analyses of this study were performed using SPSS (Version 22.0, IBM Corp. Armonk, NY, USA), and machine-learning algorithms were programmed with Python Programming Language and scikit-learn package.
Results
Patient Characteristic
A total number of 235 patients who underwent surgical resection of lesions in our neurosurgery department were enrolled in the current study. Among all participants involved, 68 patients were diagnosed with pituitary adenoma, 63 patients were diagnosed with craniopharyngioma, 64 patients were diagnosed with meningioma, and 40 patients were diagnosed with Rathke cleft cyst. The average age of patients was 49.16, 31.62, 49.19, and 44.23 years, respectively. The mean value of the maximum diameter of lesions was 23.21, 28.86, 20.41, and 19.87 mm, respectively. The characteristics of patients and lesions are summarized in Table 1.
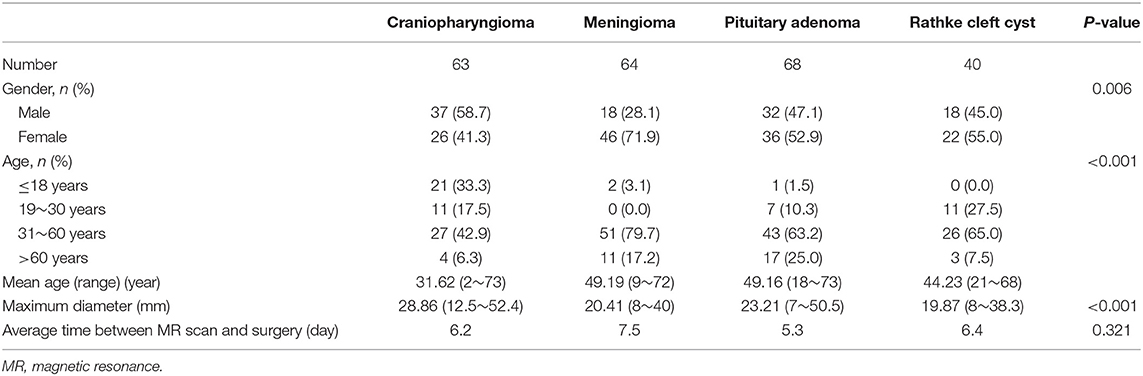
Table 1. Characteristics of patients and lesions.
Machine-Learning Model Assessment
In each group, 45 diagnostic models were established through the combinations of five selection methods and nine classifiers. The combination of LASSO as the selection method and LDA as the classifier (LASSO + LDA) seemed to be the optimal model in differentiating common lesions in the anterior skull base with AUC of more than 0.80 in all three groups. It is worth noting that some combinations represented better performance than LASSO + LDA in a single group, but LASSO + LDA showed the best comprehensive discriminative ability.
Group 1 was the differentiation between pituitary adenoma and craniopharyngioma considering these are the most common tumors located in the sellar/suprasellar region. For LASSO + LDA, ROC analysis demonstrated that AUC, accuracy, sensitivity, and specificity in the training group were 0.845, 0.851, 0.897, and 0.820, respectively. In the testing group, this predictive model was proven to be feasible in discrimination with AUC of 0.804, accuracy of 0.800, sensitivity of 0.888, and specificity of 0.734 (Table 2). Besides, other models like RF + RF (AUC = 0.811 in the testing group) and GBDT + RF (AUC = 0.837 in the testing group) also represented feasible ability in distinguishing pituitary adenoma from craniopharyngioma (Table 3).
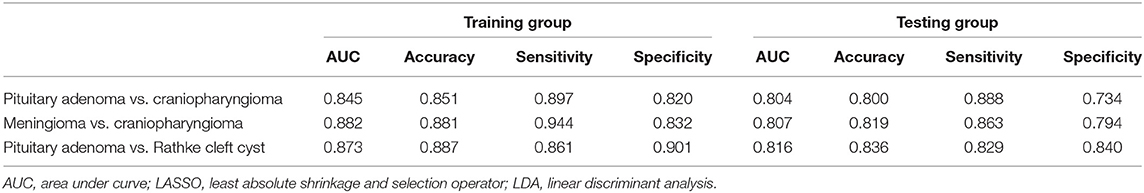
Table 2. Results of the discriminative model of LASSO + LDA in distinguishing lesions in the training group and the testing group.
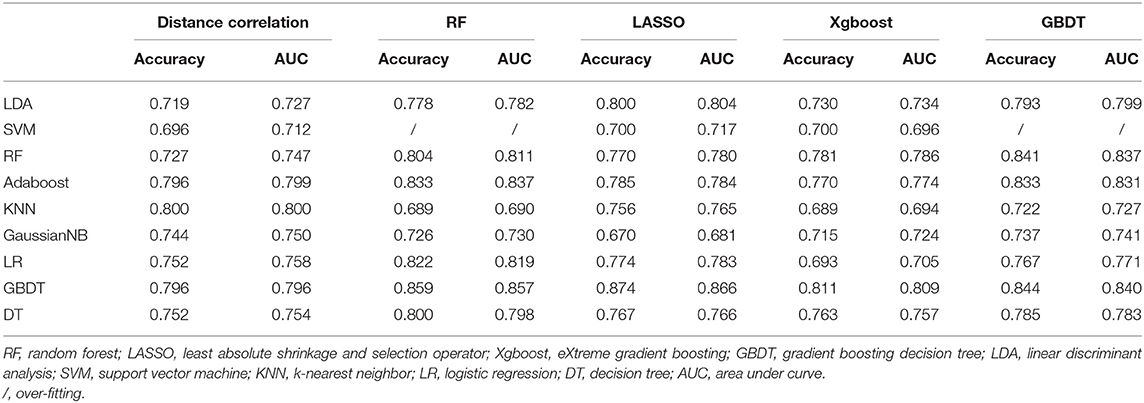
Table 3. Results of discriminative models in distinguishing pituitary adenoma from craniopharyngioma in the testing group.
Group 2 was the differentiation between meningioma and craniopharyngioma, given that they are the most common tumors located in the parasellar region. ROC analysis illustrated the differential ability of LASSO + LDA with AUC of 0.882, accuracy of 0.881, sensitivity of 0.944, and specificity of 0.832 in the training group. In the testing group, AUC of LASSO + LDA was 0.807, accuracy was 0.819, sensitivity was 0.863, and specificity was 0.794 (Table 2). Besides, distance correlation + LDA (AUC = 0.843 in the testing group), RF + LDA (AUC = 0.842 in the testing group), GBDT + LDA (AUC = 0.809 in the testing group), and distance correlation + KNN (AUC = 0.846 in the testing group) also represented reliable diagnostic performance in discrimination between meningioma and craniopharyngioma (Table 4).
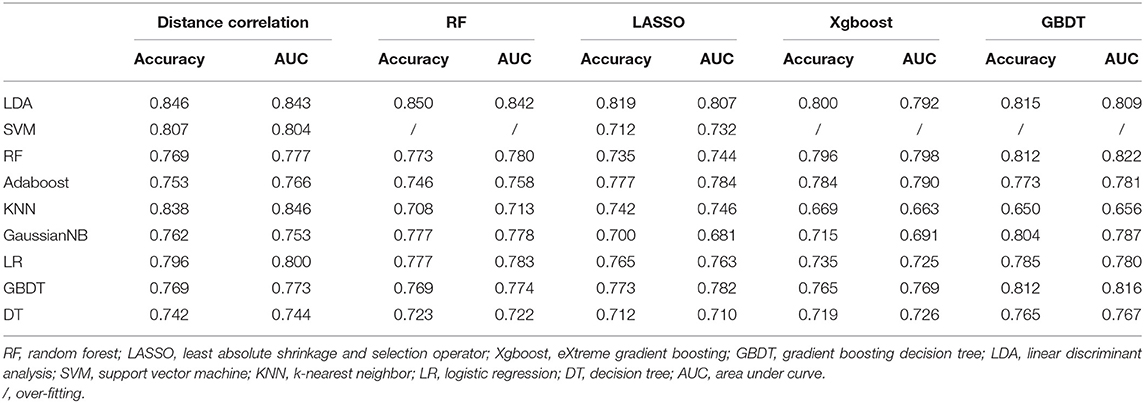
Table 4. Results of discriminative models in distinguishing meningioma from craniopharyngioma in the testing group.
Group 3 was the differentiation between pituitary adenoma and Rathke cleft cyst, which are the most common lesions in the intrasellar region. In the training group, ROC analysis demonstrated that AUC of LASSO + LDA was 0.873 with accuracy of 0.887, sensitivity of 0.861, and specificity of 0.901. In the testing group, this model also represented feasible discriminative ability with AUC of 0.816, accuracy of 0.836, sensitivity of 0.829, and specificity of 0.840 (Table 2). In addition, distance correlation + RF also represented good performance in differentiating pituitary adenoma from Rathke cleft cyst with AUC of 0.825 in the testing group (Table 5).
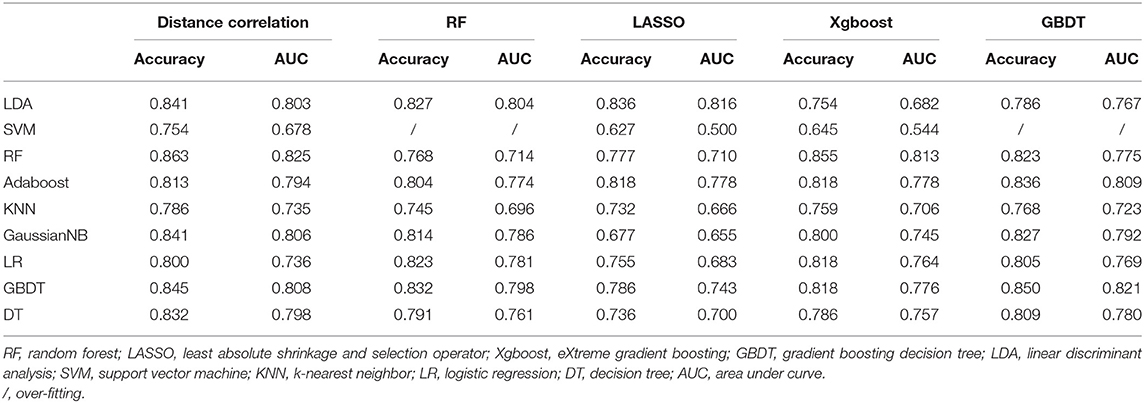
Table 5. Results of discriminative models in distinguishing pituitary adenoma from Rathke cleft cyst in the testing group.
The features selected into LASSO + LDA model are listed in Table 6. The association between discriminant functions for LASSO + LDA model is represented in Figure 3, in which minimal overlap between two clusters was observed in each group. Figure 4 represents examples of distributions of the direct LDA function for lesions for one of the 100 independent cycles. In group 1, a shift of the LDA function values for craniopharyngioma toward positive values was shown while predominantly negative values for pituitary adenoma. Similar trends could be observed in group 2 and group 3, suggesting that the LASSO + LDA model had feasible discriminative ability in the three groups.
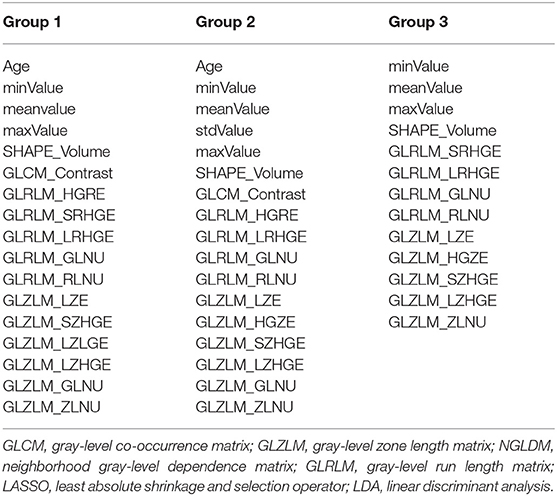
Table 6. Parameters selected in the discriminative model of LASSO + LDA.
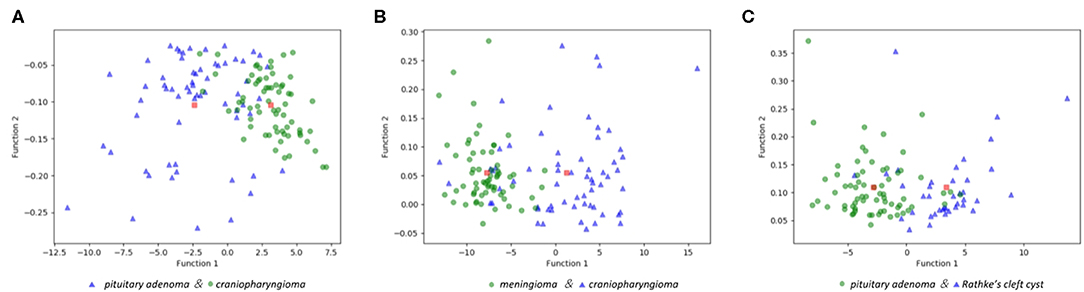
Figure 3. Relationships between the discriminant functions for different lesions in the three groups and for the group centroids. (A) Pituitary adenoma vs. craniopharyngioma; (B) meningioma vs. craniopharyngioma; (C) pituitary adenoma vs. Rathke cleft cyst.
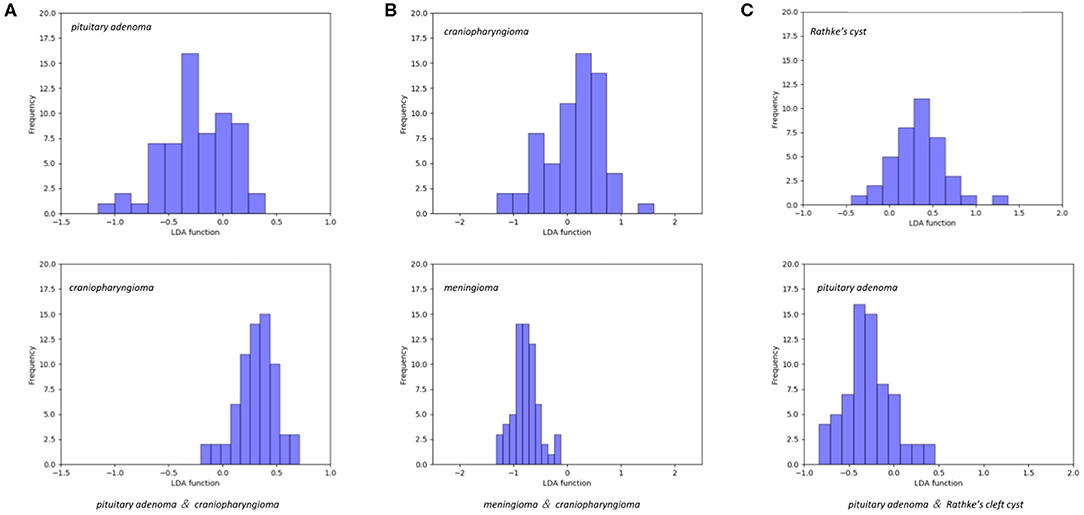
Figure 4. Examples of distributions of the linear discriminant analysis (LDA) function determined for the lesions for one cycle. (A) Pituitary adenoma vs. craniopharyngioma; (B) meningioma vs. craniopharyngioma; (C) pituitary adenoma vs. Rathke cleft cyst.
Discussion
In the present study, a series of clinical parameters and radiomic features were utilized in differentiating four types of lesions in the anterior skull base. The predictive models were built using five feature-selection methods (distance correlation, RF, LASSO, Xgboost, and GBDT) and nine machine-learning classification algorithms (LDA, SVM, RF, Adaboost, KNN, GaussianNB, LR, GBDT, and DT). The combination of LASSO as the feature-selection method and LDA as the classification algorithm represented the optimal comprehensive performance with AUC of over 0.80 in all of the training groups and the testing groups. Moreover, several models also showed reliable discriminative ability between two types of lesions in a single group. Considering the features we selected could be extracted from routine MR images, the predictive model has the potential to be utilized as a novel, convenient tool in clinical practice.
The most important result of our research was to identify suitable discriminative models for lesions located in the anterior skull base. In previous studies, researchers investigated various combinations and tried to identify the optimal diagnostic or prognostic model. For instance, one study on CT-based survival prediction of non-small cell lung cancer involved models with four selection and classification methods (25). Another study made evaluations on models with 14 selection and 12 classification methods in predicting the overall survival of lung cancer patients (26). Similar studies were performed in bone tumor and head and neck cancer, implicating that the machine-learning model could potentially be a reliable method in differential diagnosis and prognosis prediction (27–30). However, it brought our attention and further investigation that various classifiers were used but that unanimous results on which one could be taken as the universal method were not reached. Considering that the purpose of clinical application of machine learning is to lessen the workload for doctors, simple discriminative models between two types of lesions are relatively meaningless because of complicated and elusive situations in clinical practice. Based on this idea, not only different combinations were tested, but also analyses on four types of lesions were performed simultaneously in three groups in the present study.
LASSO is a brilliant feature-selection method that tries to retain useful features in both ridge regression and subset selection (31). With the characteristics of avoiding over-fitting, it is suitable for large sets of radiomic features when a relatively small number of samples are involved (28). LDA is a machine-learning classification algorithm that could find a linear model with the best discriminative ability for two classes. The mechanism of LDA is to identify the boundaries around clusters of two classes and to project the statistics into a lower-dimensional space with good discriminative power based on the distance to a centroid of each cluster (32). LDA was reported to be able to reduce the dimensionality and to preserve the class discrimination information as much as possible. The combination of LASSO and LDA showed optimal comprehensive results in all three groups with AUC of more than 0.80 in each group. However, the results of our study were not as good as those of others. One study on the prediction of ATRX mutation in low-grade gliomas represented brilliant results with AUC of 0.925 in the validation group (19). Another study on differentiating sacral chordoma from sacral giant cell tumor represented AUC of 0.984 in the validation group (30). Future researches with more feature-selection methods and machine-learning classifiers are required to verify our results and to explore the optimal model with higher reliability.
There were some limitations in the present study. First, this study was performed in a single center, and only patients with resectable tumors were enrolled. Second, the study cohort, especially the testing cohort, was relatively small, which was a common limitation of other similar studies. Multicenter studies with larger sample sizes are required to validate our results. Third, only the contrast-enhanced T1-weighted imaging was used in radiomic analysis considering that this sequence was most suitable and available for the evaluation of lesions in the anterior skull base. Multi-model imaging statistics need to be integrated into the model to improve its performance in future studies. Fourth, images acquired from different MR scanners may possibly result in the model performance discrepancy. Standardized imaging quality and consistent protocols are required if the predictive models are put into clinical work.
In conclusion, we utilized MRI radiomics and clinical parameters to build predictive models via the combinations of selection methods and machine-learning classifiers. Our results indicated that radiomics-based machine learning could preoperatively differentiate common lesions in the anterior skull base with feasible diagnostic performance and facilitate clinical decision making.
Data Availability Statement
The raw data supporting the conclusions of this article will be made available by the authors, without undue reservation, to any qualified researcher.
Ethics Statement
The studies involving human participants were reviewed and approved by Ethics Committee of Sichuan University. The written informed consent was obtained from participants enrolled in this study.
Author Contributions
YZ participated in data interpretation and feature illustration, and revised the manuscript for important intellectual content. LS participated in image evaluation and manuscript revision. CC collected MR images, participated in feature extraction, and drafted the manuscript. XM participated in conceptualization and revised some intellectual content in manuscript. XO collected MR images and participated in feature extraction. JW deployed the machine-learning algorithm and participated in statistical analysis. FX assisted in feature extraction and data collection. JX participated in conceptualization and revised some intellectual content in manuscript. All authors read and approved the submitted version.
Funding
This work was supported by 1.3.5 project for disciplines of excellence, West China Hospital, Sichuan University (ZYJC18007); Key research and development project of science and technology department of Sichuan Province (2019YFS0392).
Conflict of Interest
The authors declare that the research was conducted in the absence of any commercial or financial relationships that could be construed as a potential conflict of interest.
Supplementary Material
The Supplementary Material for this article can be found online at: https://www.frontiersin.org/articles/10.3389/fonc.2020.00752/full#supplementary-material
Supplementary Material 1. Explanations and formulas of radiomic features.
Supplementary Material 2. Original data of extracted radiomic features.
Supplementary Material 3. Examples of ROI delineation in MR images.
References
1. Schwartz TH, Fraser JF, Brown S, Tabaee A, Kacker A, Anand VK. Endoscopic cranial base surgery: classification of operative approaches. Neurosurgery. (2008) 62:991–1002. doi: 10.1227/01.neu.0000325861.06832.06
2. Famini P, Maya MM, Melmed S. Pituitary magnetic resonance imaging for sellar and parasellar masses: 10-year experience in 2598 patients. J Clin Endocrinol Metab. (2011) 96:1633–41. doi: 10.1210/jc.2011-0168
3. Han SJ, Rolston JD, Jahangiri A, Aghi MK. Rathke's cleft cysts: review of natural history and surgical outcomes. J Neurooncol. (2014) 117:197–203. doi: 10.1007/s11060-013-1272-6
4. Ivan ME, Han SJ, Aghi MK. Tumors of the anterior skull base. Exp Rev Neurother. (2014) 14:425–38. doi: 10.1586/14737175.2014.892830
5. Zamora C, Castillo M. Sellar and parasellar imaging. Neurosurgery. (2017) 80:17–38. doi: 10.1093/neuros/nyw013
6. Chin BM, Orlandi RR, Wiggins RH 3rd. Evaluation of the sellar and parasellar regions. Magn Reson Imaging Clin N Am. (2012) 20:515-43. doi: 10.1016/j.mric.2012.05.007
7. Nowosielski M, Galldiks N, Iglseder S, Kickingereder P, von Deimling A, Bendszus M, et al. Diagnostic challenges in meningioma. Neuro Oncol. (2017) 19:1588–98. doi: 10.1093/neuonc/nox101
8. Kickingereder P, Burth S, Wick A, Gotz M, Eidel O, Schlemmer HP, et al. Radiomic profiling of glioblastoma: identifying an imaging predictor of patient survival with improved performance over established clinical and radiologic risk models. Radiology. (2016) 280:880–9. doi: 10.1148/radiol.2016160845
9. Prasanna P, Patel J, Partovi S, Madabhushi A, Tiwari P. Radiomic features from the peritumoral brain parenchyma on treatment-naïve multi-parametric MR imaging predict long versus short-term survival in glioblastoma multiforme: preliminary findings. Eur Radiol. (2017) 27:4188–97. doi: 10.1007/s00330-016-4637-3
10. Gillies RJ, Kinahan PE, Hricak H. Radiomics: images are more than pictures, they are data. Radiology. (2016) 278:563–77. doi: 10.1148/radiol.2015151169
11. Bi WL, Hosny A, Schabath MB, Giger ML, Birkbak NJ, Mehrtash A, et al. Artificial intelligence in cancer imaging: clinical challenges and applications. CA Cancer J Clin. (2019) 69:127–57. doi: 10.3322/caac.21552
12. Kniep HC, Madesta F, Schneider T, Hanning U, Schonfeld MH, Schon G, et al. Radiomics of brain MRI: utility in prediction of metastatic tumor type. Radiology. (2019) 290:479–87. doi: 10.1148/radiol.2018180946
13. Li C, Wang S, Serra A, Torheim T, Yan JL, Boonzaier NR, et al. Multi-parametric and multi-regional histogram analysis of MRI: modality integration reveals imaging phenotypes of glioblastoma. Eur Radiol. (2019) 29:4718-29. doi: 10.1007/s00330-018-5984-z
14. Nie D, Lu J, Zhang H, Adeli E, Wang J, Yu Z, et al. Multi-channel 3D deep feature learning for survival time prediction of brain tumor patients using multi-modal neuroimages. Sci Rep. (2019) 9:1103. doi: 10.1038/s41598-018-37387-9
15. Wu S, Meng J, Yu Q, Li P, Fu S. Radiomics-based machine learning methods for isocitrate dehydrogenase genotype prediction of diffuse gliomas. J Cancer Res Clin Oncol. (2019) 145:543–50. doi: 10.1007/s00432-018-2787-1
16. Rudie JD, Rauschecker AM, Bryan RN, Davatzikos C, Mohan S. Emerging applications of artificial intelligence in neuro-oncology. Radiology. (2019) 290:607–18. doi: 10.1148/radiol.2018181928
17. Nioche C, Orlhac F, Boughdad S, Reuzé S, Goya-Outi J, Robert C, et al. LIFEx: a freeware for radiomic feature calculation in multimodality imaging to accelerate advances in the characterization of tumor heterogeneity. Cancer Res. (2018) 78:4786–9. doi: 10.1158/0008-5472.CAN-18-0125
18. Sauerbrei W, Royston P, Binder H. Selection of important variables and determination of functional form for continuous predictors in multivariable model building. Stat Med. (2007) 26:5512–28. doi: 10.1002/sim.3148
19. Li Y, Liu X, Qian Z, Sun Z, Xu K, Wang K, et al. Genotype prediction of ATRX mutation in lower-grade gliomas using an MRI radiomics signature. Eur Radiol. (2018) 28:2960–8. doi: 10.1007/s00330-017-5267-0
20. Ditmer A, Zhang B, Shujaat T, Pavlina A, Luibrand N, Gaskill-Shipley M, et al. Diagnostic accuracy of MRI texture analysis for grading gliomas. J Neurooncol. (2018) 140:583–9. doi: 10.1007/s11060-018-2984-4
21. Bonora M, Wieckowsk MR, Chinopoulos C, Kepp O, Kroemer G, Galluzzi L, et al. Molecular mechanisms of cell death: central implication of ATP synthase in mitochondrial permeability transition. Oncogene. (2015) 34:1608. doi: 10.1038/onc.2014.462
22. Lee J-G, Ko J, Hae H, Sòo-Kang J, Do-Kang Y, Lee JH, et al. Intravascular ultrasound-based machine learning for predicting fractional flow reserve in intermediate coronary artery lesions. Atherosclerosis. (2020) 292:171–77. doi: 10.1016/j.atherosclerosis.2019.10.022
23. Yin W-J, Yi YH, Guan XF, Zhou LY, Wang JL, Li Y, et al. Preprocedural prediction model for contrast-induced nephropathy patients. J Am Heart Assoc. (2017) 6:004498. doi: 10.1161/JAHA.116.004498
24. Blanc-Durand P, Campedel L, Mule S, Jegou S, Luciani A, Pigneur F, et al. Prognostic value of anthropometric measures extracted from whole-body CT using deep learning in patients with non-small-cell lung cancer. Eur Radiol. (2020). doi: 10.1007/s00330-019-06630-w. [Epub ahead of print].
25. Hawkins SH, Korecki JN, Balagurunathan Y, Gu Y, Kumar V, Basu S, et al. Predicting outcomes of nonsmall cell lung cancer using CT image features. IEEE Access. (2014) 2:1418–26. doi: 10.1109/ACCESS.2014.2373335
26. Parmar C, Grossmann P, Bussink J, Lambin P, Aerts HJ. Machine learning methods for quantitative radiomic biomarkers. Sci Rep. (2015) 5:13087. doi: 10.3389/fonc.2015.00272
27. Zhang B, He X, Ouyang F, Gu D, Dong Y, Zhang L, et al. Radiomic machine-learning classifiers for prognostic biomarkers of advanced nasopharyngeal carcinoma. Cancer Lett. (2017) 403:21–7. doi: 10.1016/j.canlet.2017.06.004
28. Zhang B, Tian J, Dong D, Gu D, Dong Y, Zhang L, et al. Radiomics features of multiparametric MRI as novel prognostic factors in advanced nasopharyngeal Carcinoma. Clin Cancer Res. (2017) 23:4259–69. doi: 10.1158/1078-0432.CCR-16-2910
29. Wu W, Parmar C, Grossmann P, Quackenbush J, Lambin P, Bussink J, et al. Exploratory study to identify radiomics classifiers for lung Cancer histology. Front Oncol. (2016) 6:71. doi: 10.3389/fonc.2016.00071
30. Yin P, Mao N, Zhao C, Wu J, Sun C, Chen L, et al. Comparison of radiomics machine-learning classifiers and feature selection for differentiation of sacral chordoma and sacral giant cell tumour based on 3D computed tomography features. Eur Radiol. (2018) 29:1841–7. doi: 10.1007/s00330-018-5730-6
31. Wu S, Zheng J, Li Y, Yu H, Shi S, Xie W, et al. A radiomics nomogram for the preoperative prediction of lymph node metastasis in bladder Cancer. Clin Cancer Res. (2017) 23:6904–11. doi: 10.1158/1078-0432.CCR-17-1510
Keywords: pituitary adenoma, meningioma, craniopharyngioma, Rathke cleft cyst, anterior skull base, radiomics, machine learning
Citation: Zhang Y, Shang L, Chen C, Ma X, Ou X, Wang J, Xia F and Xu J (2020) Machine-Learning Classifiers in Discrimination of Lesions Located in the Anterior Skull Base. Front. Oncol. 10:752. doi: 10.3389/fonc.2020.00752
Received: 10 May 2019; Accepted: 20 April 2020;
Published: 28 May 2020.
Edited by:
Andreia Vasconcellos Faria, Johns Hopkins University, United StatesReviewed by:
Ivan Jambor, University of Turku, FinlandYanwei Miao, Dalian Medical University, China
Copyright © 2020 Zhang, Shang, Chen, Ma, Ou, Wang, Xia and Xu. This is an open-access article distributed under the terms of the Creative Commons Attribution License (CC BY). The use, distribution or reproduction in other forums is permitted, provided the original author(s) and the copyright owner(s) are credited and that the original publication in this journal is cited, in accordance with accepted academic practice. No use, distribution or reproduction is permitted which does not comply with these terms.
*Correspondence: Xuelei Ma, ZHJtYXh1ZWxlaUBnbWFpbC5jb20=; Jianguo Xu, ZHJqaWFuZ3VveHVAZ21haWwuY29t
†These authors have contributed equally to this work