 Rong Da1
 Wei Wang
- 1Department of Clinical Laboratory, The First Affiliated Hospital of Xi’an Jiaotong University, Xi’an, China
- 2Department of Neurosurgery, The First Affiliated Hospital of Xi’an Jiaotong University, Xi’an, China
Abnormal RAS/RAF signaling plays a critical role in glioma. Although it is known that the V600E mutation of v-raf murine viral oncogene homolog B1 (BRAFV600E) and BRAF amplification (BRAFAMP) both result in constitutive activation of the RAS/RAF pathway, whether BRAFV600E and BRAFAMP have different effects on the survival of glioma patients needs to be clarified. Using cBioPortal, we retrieved studies of both mutations and copy number variations of the BRAF gene in CNS/brain tumors and investigated data from 69 nonredundant glioma patients. The BRAF mutation group had significantly more male patients (64.00% vs. 36.84%; P = 0.046) and a higher occurrence of glioblastoma multiforme (66.00% vs. 31.58%; P = 0.013) compared to those in the other group. The BRAFAMP group had significantly more patients with the mutant isocitrate dehydrogenase 1 and 2 (IDH1/2) (73.68% vs. 18.00%; P = 0.000), tumor protein p53 (TP53) (73.68% vs. 30.00%; P = 0.002), and alpha thalassemia/mental retardation syndrome X linked (ATRX) (63.16% vs. 18.00%; P = 0.001) than the mutation group. The BRAFAMP and IDH1/2WT cohort had lower overall survival compared with the BRAFAMP and IDH1/2MT groups (P = 0.001) and the BRAF mutation cohort (P = 0.019), including the BRAFV600E (P = 0.033) and BRAFnon-V600E (P = 0.029) groups, using Kaplan–Meier survival curves and the log rank (Mantel–Cox) test. The BRAFAMP and IDH1/2WT genotype was found to be an independent predictive factor for glioma with BRAF mutation and BRAFAMP using Cox proportional hazard regression analysis (HR = 0.138, P = 0.018). Our findings indicate that BRAFAMP frequently occurs with IDH1/2, TP53, and ATRX mutations. Adult patients with glioma with BRAFAMP and IDH1/2WT had worse prognoses compared with those with BRAF mutation and BRAFAMP and IDH1/2MT. This suggests that the assessment of the status of BRAFAMP and IDH1/2 in adult glioma/glioblastoma patients has prognostic value as these patients have relatively short survival times and may benefit from personalized targeted therapy using BRAF and/or MEK inhibitors.
Introduction
Gliomas are the most frequent primary brain neoplasms occurring in both the pediatric and adult populations (1). The 2016 WHO Classification of Tumors of the Central Nervous System was the first to provide combined data regarding the genetic and histological characteristics of tumors and is, thus, considered a cornerstone for understanding and diagnosing tumors. When diagnosing the disease, mutation site genotypes of genes such as isocitrate dehydrogenase (IDH), tumor protein p53(TP53), and alpha thalassemia/mental retardation syndrome X linked (ATRX) and 1p/19q codeletion should be evaluated. Hence, determining the status of IDH mutation and 1p/19q is essential for the 2016 classification of diffused gliomas, including astrocytoma, oligoastrocytoma, oligodendroglioma, and glioblastoma (2). The RAS/RAF/MEK/extracellular signal-regulated kinase (ERK) mitogen-activated protein kinase (MAPK) pathway, which transduces mitogenic stimuli via the activation of growth factor receptors, is critical for cell proliferation, survival, and differentiation. Abnormal activation of RAS/RAF signaling plays a role in various tumors, and studies have revealed that the MAPK pathway is of great clinical significance in gliomas (3). Oncogenic mutations as well as the copy number amplification of RAS/RAF and/or abnormal activation of upstream growth factor receptors can cause hyperactivation of the RAS/RAF pathway (4), resulting in various neoplasms.
BRAF (v-raf murine viral oncogene homolog B1) participates in the pathological mechanism of 7% of human neoplasms, especially in melanoma, colorectal, thyroid, and lung cancers (5, 6). Because of the negative outcome of high-grade glioma, BRAF mutations have gained considerable interest in the possible benefit of the MAPK pathway inhibitors for glioma treatment. The BRAFV600E mutation in which the thymine at nucleotide 1799 is substituted by adenine results in the substitution of valine with glutamic acid at amino acid 600; this is the most common BRAF mutation in glioma (6). It imitates the normal phosphorylation of T599 and S602, resulting in the overactivation of BRAF kinase and hyperactivation of the ERK signaling pathway (7). In addition, BRAF amplification (BRAFAMP) can also cause hyperactivation of MAPK signaling, which plays essential roles in the acquired resistance to MAPK inhibitor therapy in cancers harboring BRAFV600E (8). Moreover, BRAFAMP is also found in primary pediatric low-grade gliomas (9).
Although both BRAFV600E and BRAFAMP can lead to the hyperactivation of MAPK signaling, the differences between the patterns of BRAFV600E and BRAFAMP signaling in glioma, their influence on the survival of glioma patients, and the involvement of other genes, remains unclear. In this study, based on cBioPortal data, we found that patients with glioma harboring BRAFAMP had lower overall survival compared with those harboring BRAFV600E. Furthermore, we found that BRAFAMP frequently co-occurred with IDH1/2, TP53, and ATRX mutations.
Materials and Methods
Data Collection and Enrollment
We used cBioPortal (https://www.cbioportal.org/) (10, 11). The Cancer Genome Atlas Program (TCGA) data mining tool to collect the necessary data. TCGA is a public database, and we strictly followed its publication guidelines (https://www.cancer.gov/about-nci/organization/ccg/research/structural-genomics/tcga/using-tcga/citing-tcga) for collecting and generating data. Multiple patient cohorts, including all 19 available studies on central nervous system (CNS)/brain tumors (6122 samples) were queried. The data were filtered to include studies that listed both gene mutation and copy number data. In each study, mutations and putative copy number alterations (CNA) identified using the Genomic Identification of Significant Targets in Cancer (GISTIC) tool were selected to analyze the genomic profiles. We first selected tumor samples with mutations and CNA data for creating the patient/case set. Then, the gene names BRAF, ATRX, TP53, IDH1, and IDH2 were entered, and the query was submitted. Among the retrieved data files, we selected samples harboring the BRAF mutation with AMP. The mutation data and CNA as well as the patient and sample data were retrieved. All data were recorded in a chart for further analysis.
Characteristics Associated With BRAFAMP and BRAF Mutation in Glioma Using Univariate and Multivariate Logistic Regression Analysis
The study population was divided into the BRAFAMP and BRAF mutation groups, and the numerical values of the categorical variables were calculated. The demographic characteristics of the patients, pathological classification, and molecular biomarkers in the two groups were analyzed using univariate logistic regression analysis. Then, the statistically significant variables (P < 0.10) were analyzed using multivariate logistic regression analysis. The odds ratios and 95% confidence intervals were estimated. P value < 0.05 was considered statistically significant. For greater precision of characteristic evaluation, we created a descriptive table and divided the BRAFAMP group into two groups based on the non- and co-occurrence of the IDH1/2 mutation, and the BRAF mutation group into BRAFV600E and BRAFnon-V600E groups.
Cross-Over Analysis Using Kaplan–Meier Survival Curves and the Log Rank (Mantel–Cox) Test
The overall survival of the BRAFAMP and IDH1/2MT, BRAFAMP and IDH1/2WT, BRAFV600E, and BRAFnon-V600E groups was determined by a crossover comparison using Kaplan–Meier survival curves and the log rank (Mantel–Cox) test (12). The survival of the BRAF mutation group was compared with that of the BRAFAMP and IDH1/2MT and BRAFAMP and IDH1/2WT groups, respectively. P value < 0.05 was considered statistically significant.
Multivariate Analysis of Overall Survival Using Cox Regression Analysis
The BRAFAMP and IDH1/2WT, TP53, and ATRX were analyzed using the Cox regression analysis in the 69 samples with BRAFAMP or BRAF mutation. P value < 0.05 was considered statistically significant.
String Analysis of BRAF, IDH1, IDH2, TP53, and ATRX
Using STRING: functional protein association networks (https://string-db.org/) (13), the association among BRAF, IDH1, IDH2, TP53, and ATRX was investigated, and the combined scores among those four proteins were obtained.
Results
Data Enrollment in the Study
Among the 19 CNS/brain studies available (6122 samples), 12 studies (5487 samples) matched the required inclusion criteria, containing both gene mutation and CNA data (Table 1). The cancer types in these 12 CNS/brain studies included diffuse glioma, glioblastoma, oligodendroglioma, and miscellaneous neuroepithelial tumors. A schematic representation of the flow of data screening and enrollment is shown in Figure 1. A total of 115 samples (109 patients) with BRAF mutation or BRAFAMP were enrolled in this study, and data from 69 nonredundant patients were investigated. Integrated data of major patient characteristics, including sex, age, cancer type, BRAF mutation, BRAF CNA, and mutation of IDH1/2, TP53, and ATRX, were collected for further analysis (Supplementary Table S1).
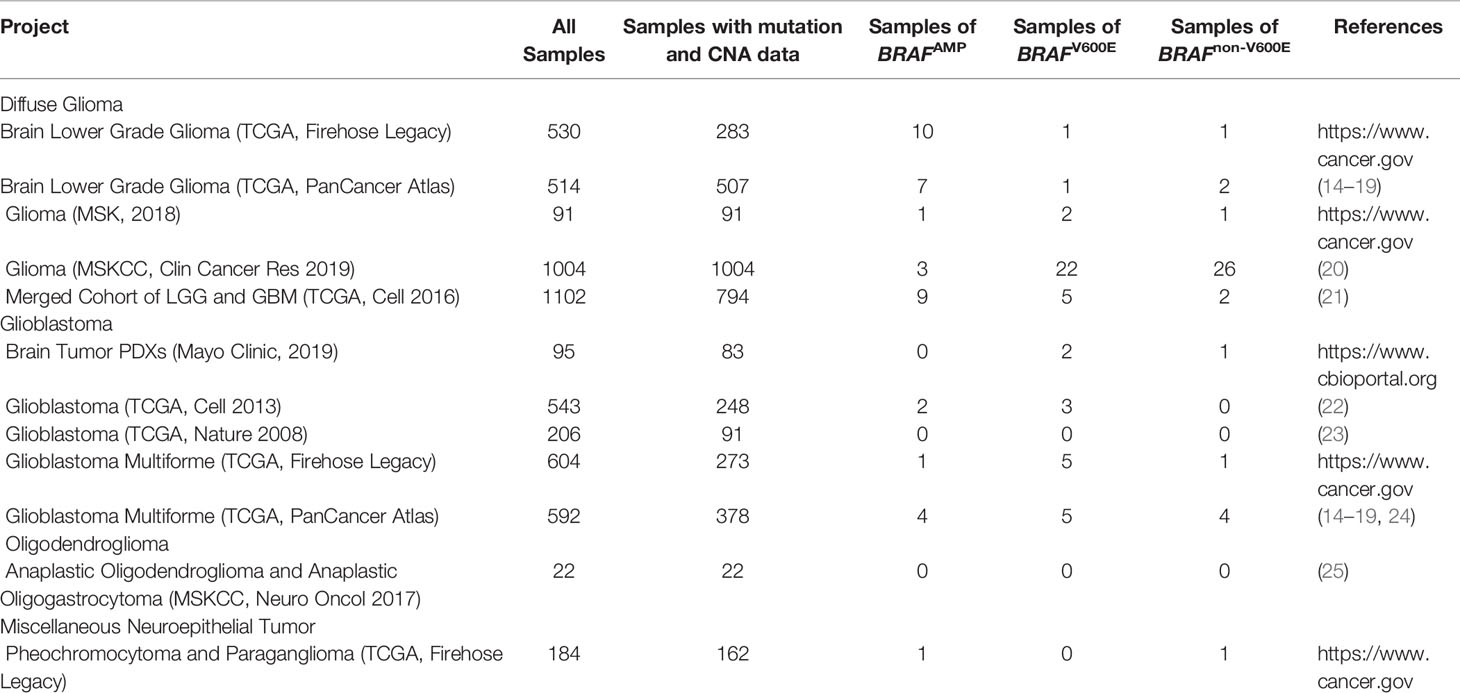
Table 1 The CNS/Brain projects of TCGA data enrolled in the study retrieved using cBioPortal.
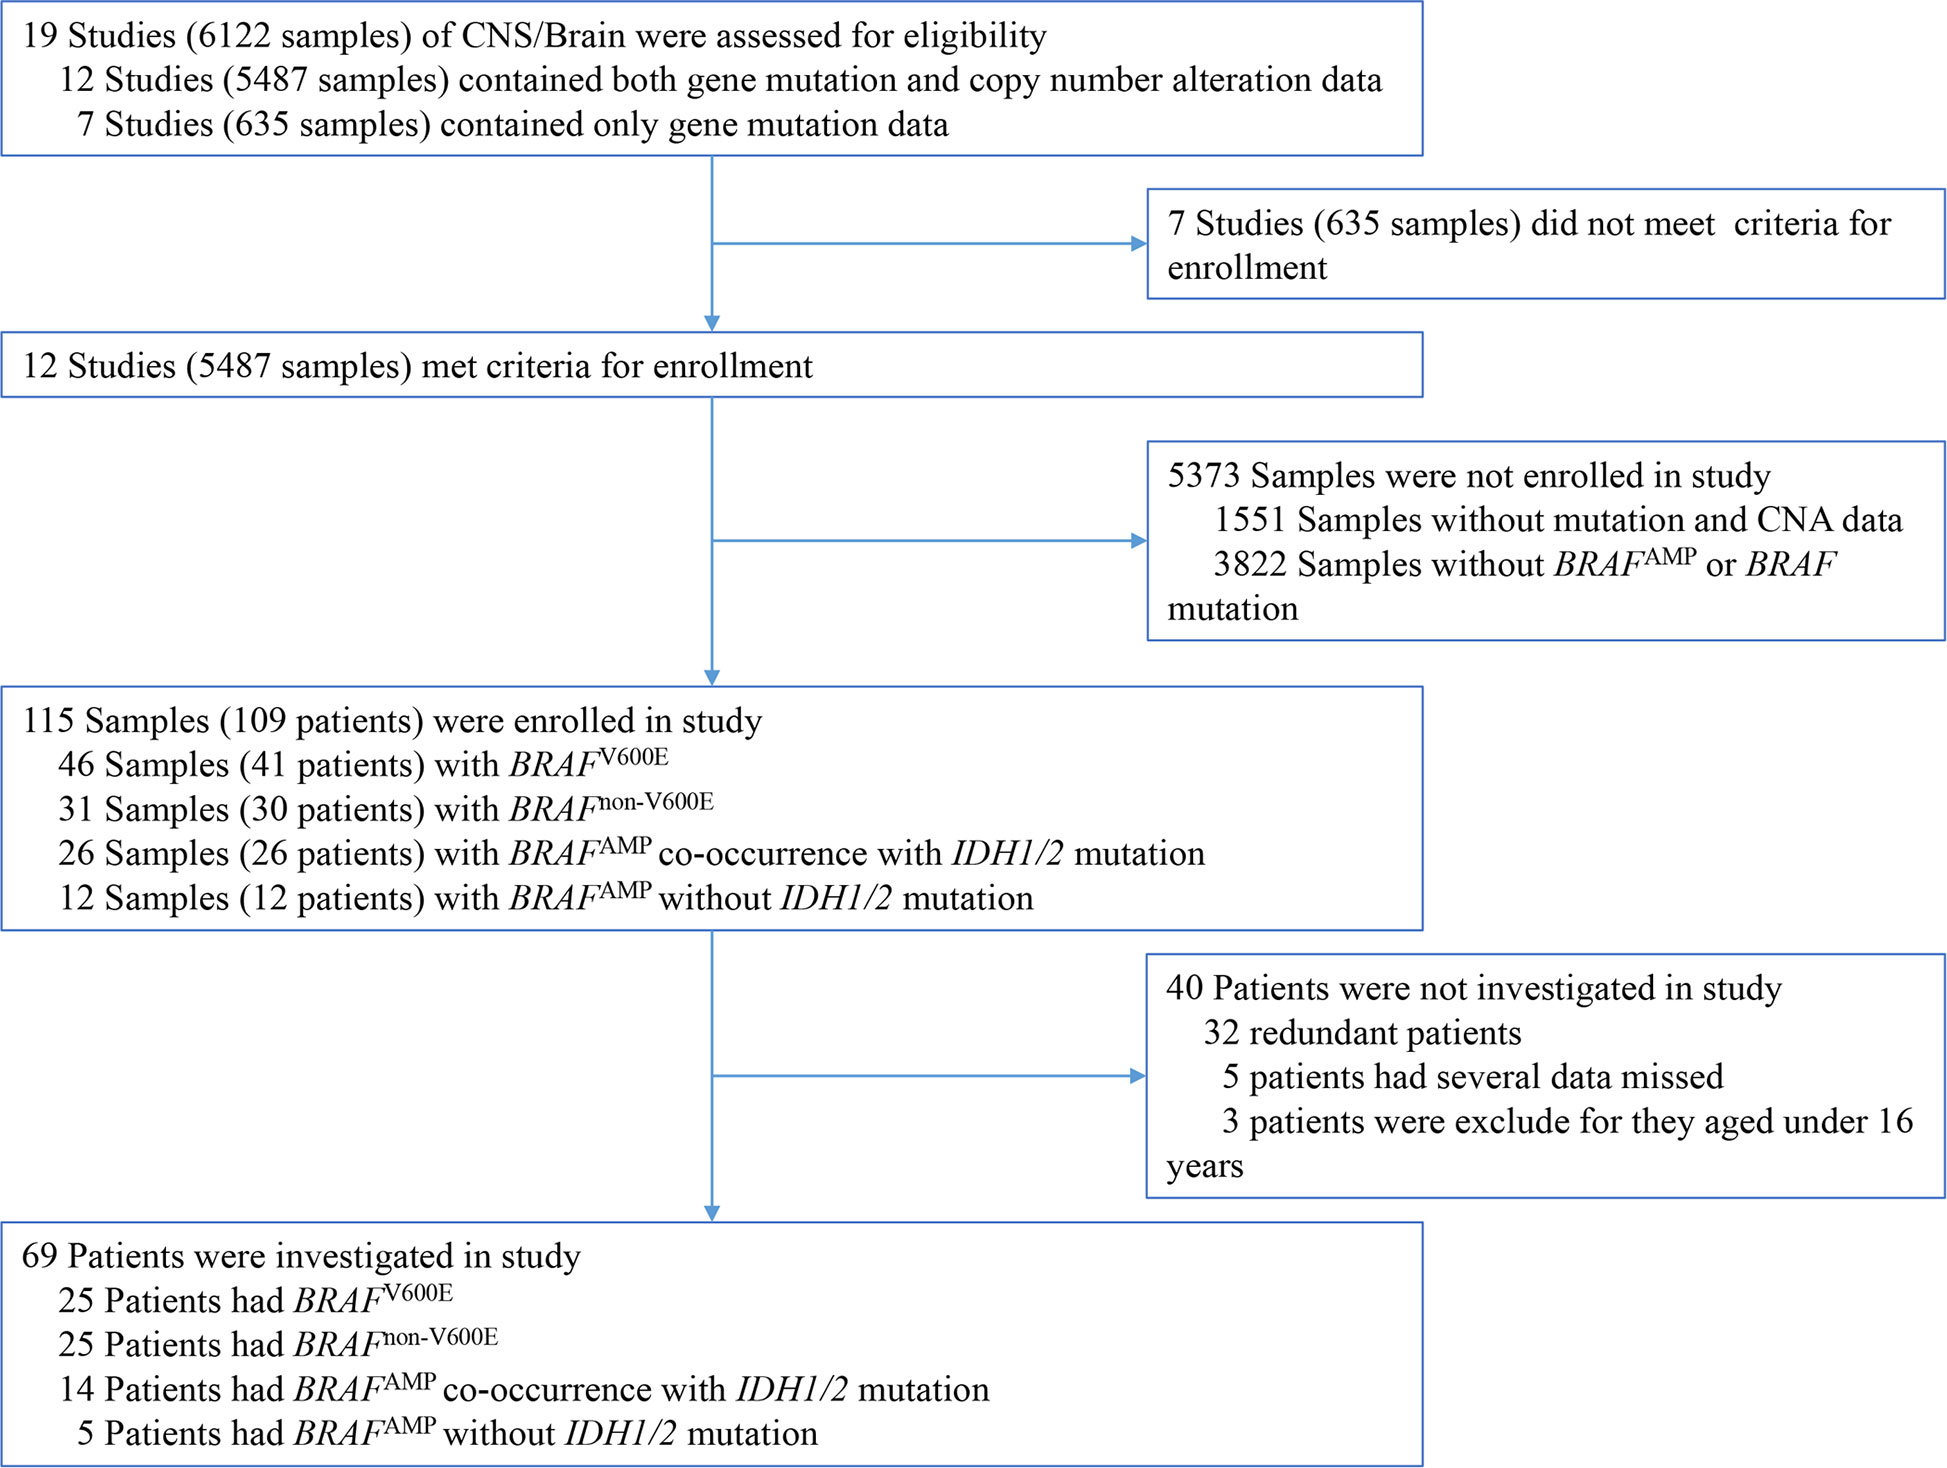
Figure 1 Schematic representation of the process of data enrollment in the study using cBioPortal. Among the 19 CNS/brain studies, including 6112 samples, 115 samples (109 patients) with BRAF mutation or BRAFAMP were enrolled in this study, and 69 nonredundant patients with information regarding major patient characteristics, including sex, age, cancer type details, BRAF mutation, BRAF copy number alteration, and mutation of IDH1/2, TP53, as well as ATRX, were further investigated. BRAF, v-raf murine viral oncogene homolog B1; IDH1/2, isocitrate dehydrogenase 1 and 2.
Characteristics Associated With BRAFAMP and BRAF Mutation of Glioma
The study population was divided into two groups, BRAFAMP and BRAF mutation. The demographic characteristics and clinical data of the two groups are summarized in Table 2. The age of patients ranged from 20 to 85 years with an average of 45.46 years. Twenty-five patients harbored BRAFnon-V600E mutations; of these, two patients harbored a D594G mutation; two patients, a G469A mutation; and the remaining patients, an A320T mutation combined with A171E, A404Cfs*9, E375*, G466E, G466V, G469R, G469V, G596D, G69S, L331F, L382V, L597R, M531, P708S, S394P, S614P, T121I, V504_R506dup, V504I, W476*, and X709_splice mutations. The BRAF mutation group had significantly more male patients (64.00% vs. 36.84%; P = 0.046) and a higher occurrence of glioblastoma multiforme (66.00% vs. 31.58%; P = 0.013). In contrast, the BRAFAMP group had significantly more patients harboring IDH1/2 (73.68% vs. 18.00%; P = 0.000), TP53 (73.68% vs. 30.00%; P = 0.002), and ATRX (63.16% vs. 18.00%; P = 0.001) mutations. Variables with P value < 0.10 were analyzed using multivariate logistic regression analysis; the BRAF mutation group had more male patients (64.00% vs. 36.84%; P = 0.027), and the BRAFAMP group had significantly more patients harboring IDH1/2 mutations (73.68% vs. 18.00%; P = 0.029) (Table 2). Further analysis indicated that the BRAFAMP group had no simultaneously detected BRAF mutations, and that the BRAF mutation group had no simultaneously detected BRAFAMP. The BRAFAMP and IDH1/2MT group had a significantly higher percentage of co-occurrence of TP53 (13/14, 92.86%) and ATRX (12/14, 85.71%) mutations (Table 3).
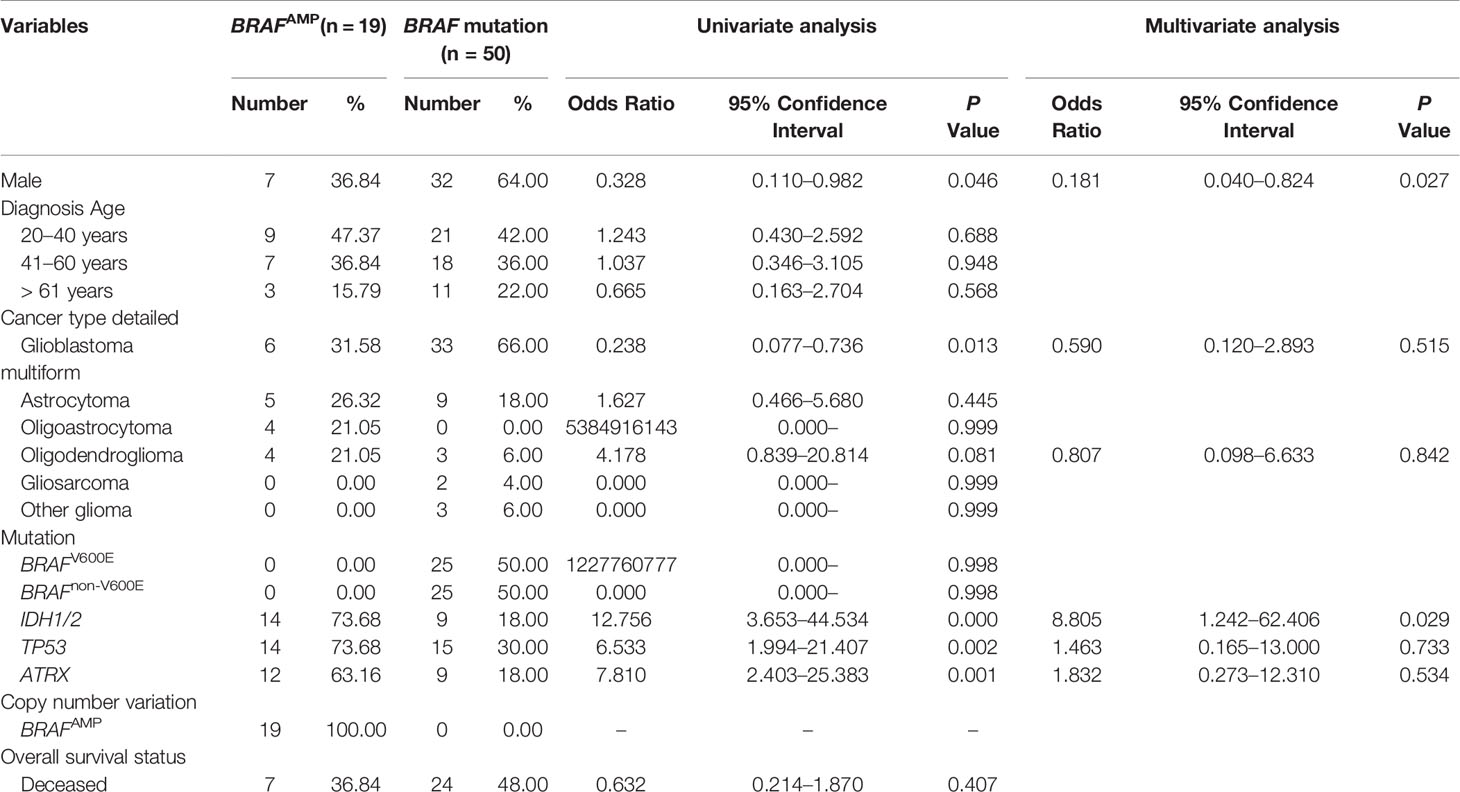
Table 2 Univariate and multivariate analysis: characteristics associated with BRAFAMP and BRAF mutation in gliomas.
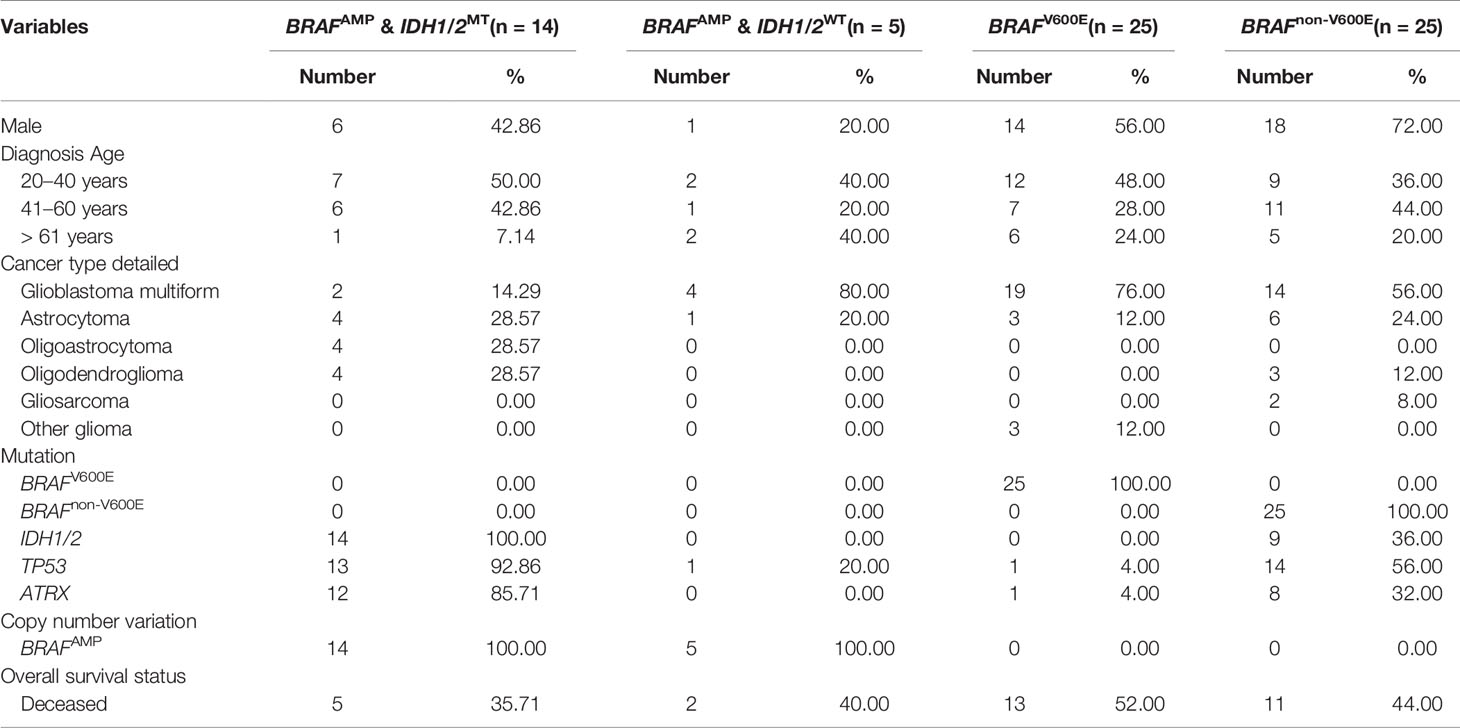
Table 3 Characteristics associated with BRAFAMP and BRAF mutation in gliomas.
Crossover Analysis Using Kaplan–Meier Survival Curves and Log Rank (Mantel–Cox) Test
The crossover Kaplan–Meier survival curves and log rank (Mantel–Cox) test were performed to explore the influence of BRAF gene alteration on the overall survival of glioma patients. The estimated mean survival time was 67.026 months for patients harboring BRAFAMP and IDH1/2MT, 9.750 months for patients harboring BRAFAMP and IDH1/2WT, 41.573 months for patients harboring BRAFV600E, and 89.958 months for patients harboring BRAFnon-V600E. The estimated survival time of the BRAFAMP and IDH1/2WT cohort was the shortest and was significantly lower compared with that of the BRAFAMP and IDH1/2MT (9.750 vs. 67.026, chi-square 10.526, P = 0.001), the BRAFV600E (9.750 vs. 41.573, chi-square 4.536, P = 0.033), and the BRAFnon-V600E (9.750 vs. 89.958, chi-square 4.747, P = 0.029) cohorts. The estimated mean survival time of the BRAF mutation cohort was significantly greater than that of the BRAFAMP and IDH1/2WT cohort (71.698 vs. 9.750, chi-square 5.469, P = 0.019). The estimated mean survival times of the three cohorts were significantly greater than that of the BRAFAMP and IDH1/2WT cohort (74.401 vs. 9.750, chi-square 7.639, P = 0.006) (Figure 2). When analyzed using Kaplan–Meier survival curves and the log rank (Mantel–Cox) test, there was no significance between the following groups: BRAFAMP cohort vs. BRAF mutation cohort (58.835 vs. 71.698, chi-square 0.020, P = 0.886), BRAFV600E cohort vs. BRAFnon-V600E cohort (41.573 vs. 89.958, chi-square 1.999, P = 0.157), BRAFAMP and IDH1/2MT cohort vs. BRAFV600E cohort (67.026 vs. 41.573, chi-square 1.031, P = 0.310), BRAFAMP and IDH1/2MT cohort vs. BRAFnon-V600E cohort (67.026 vs. 89.958, chi-square 0.025, P = 0.875), BRAFAMP and IDH1/2MT cohort vs. BRAF mutation cohort (67.026 vs. 71.698, chi-square 0.513, P = 0.474) (Supplementary Figure S1). The estimated survival time of the BRAFV600E cohort above 30 years of age was 40.135 months, whereas that of the BRAFAMP and IDH1/2WT cohort was significantly lower (9.750 vs. 40.135, chi-square 5.575, P = 0.018) (Supplementary Figure S2).
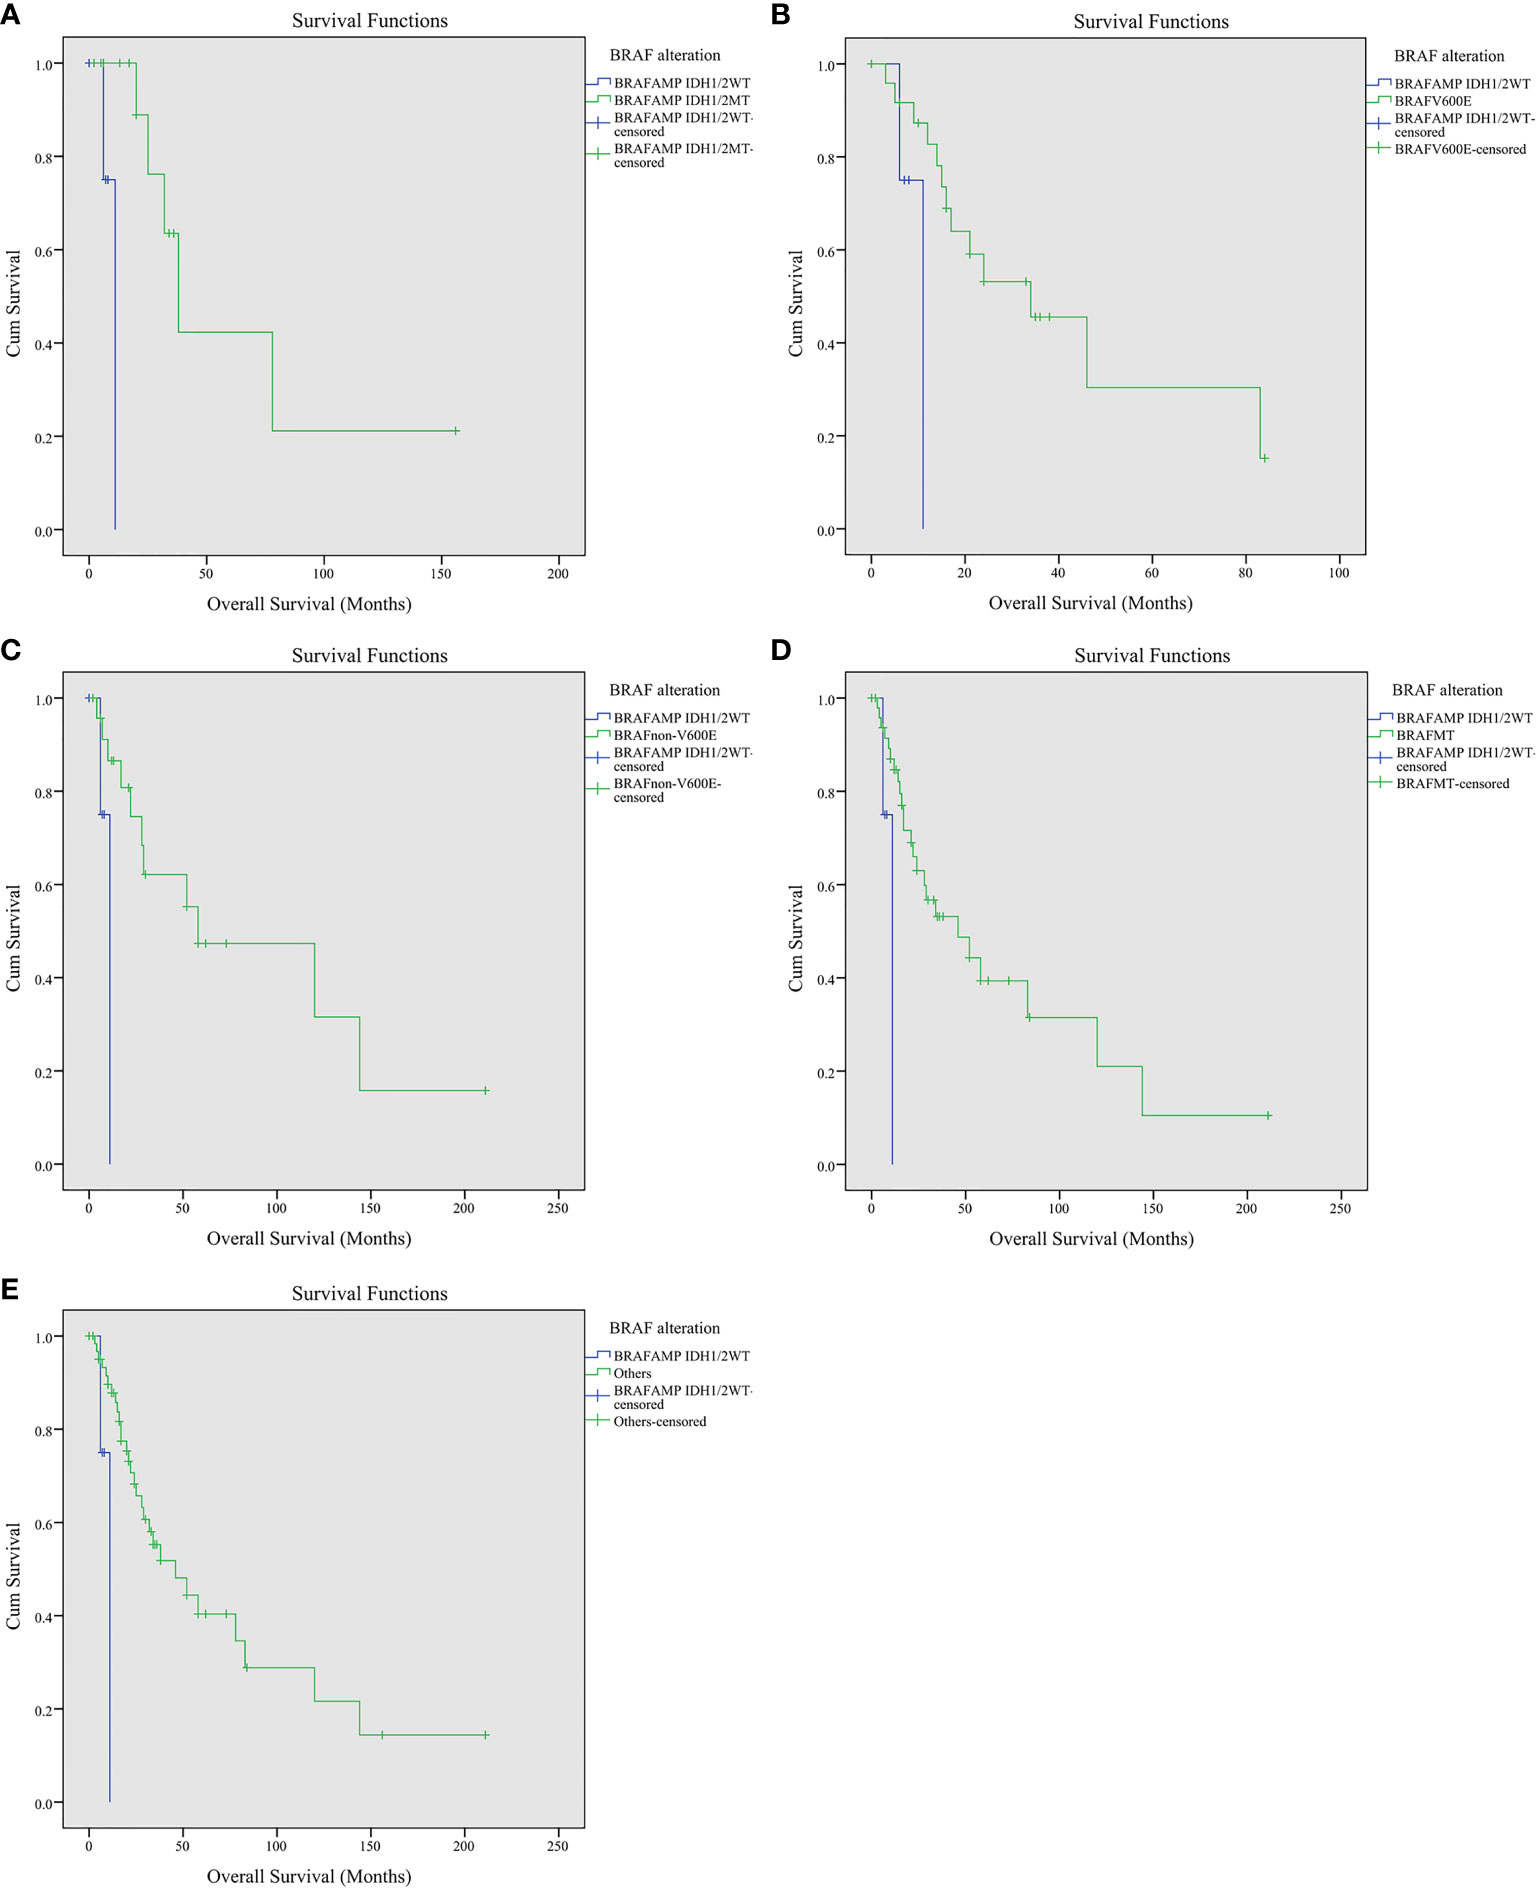
Figure 2 Kaplan–Meier survival curves of patients with gliomas harboring BRAFAMP and BRAF mutation. (A) BRAFAMP and IDH1/2WT cohort vs. BRAFAMP and IDH1/2MT cohort (9.750 vs. 67.026, chi-square 10.526, P = 0.001). (B) BRAFAMP and IDH1/2WT cohort vs. BRAFV600E cohort (9.750 vs. 41.573, chi-square 4.536, P = 0.033). (C) BRAFAMP and IDH1/2WT cohort vs. BRAFnon-V600E cohort (9.750 vs. 89.958, chi-square 4.747, P = 0.029). (D) BRAFAMP and IDH1/2WT cohort vs. BRAF mutation cohort (9.750 vs. 71.698, chi-square 5.469, P = 0.019). (E) BRAFAMP and IDH1/2WT cohort vs. other three BRAF alteration cohorts, including the BRAFAMP and IDH1/2MT, BRAFV600E, and BRAFnon-V600E cohorts (9.750 vs. 74.401, chi-square 5.469, P = 0.019). BRAF, v-raf murine viral oncogene homolog B1; IDH1/2, isocitrate dehydrogenase 1 and 2.
Multivariate Analysis of Overall Survival Using the Cox Regression Analysis
The IDH1/2 mutation in 13 of the 14 BRAFAMP patients was R132H, and one patient harbored the R132G mutation. The IDH1/2 mutation in eight BRAFnon-V600E patients was R132H with the exception of one sample (R132S). The TP53 and ATRX mutations were highly diverse in all patients (Supplementary Table S1). The Cox regression analysis introduced three factors, including BRAFAMP and IDH1/2WT, TP53 mutation, and ATRX mutation in all BRAFAMP and BRAF mutation patients and determined the BRAFAMP and IDH1/2WT genotype as an independent predictive factor for overall survival (HR = 0.138, P = 0.018) (Figure 3).
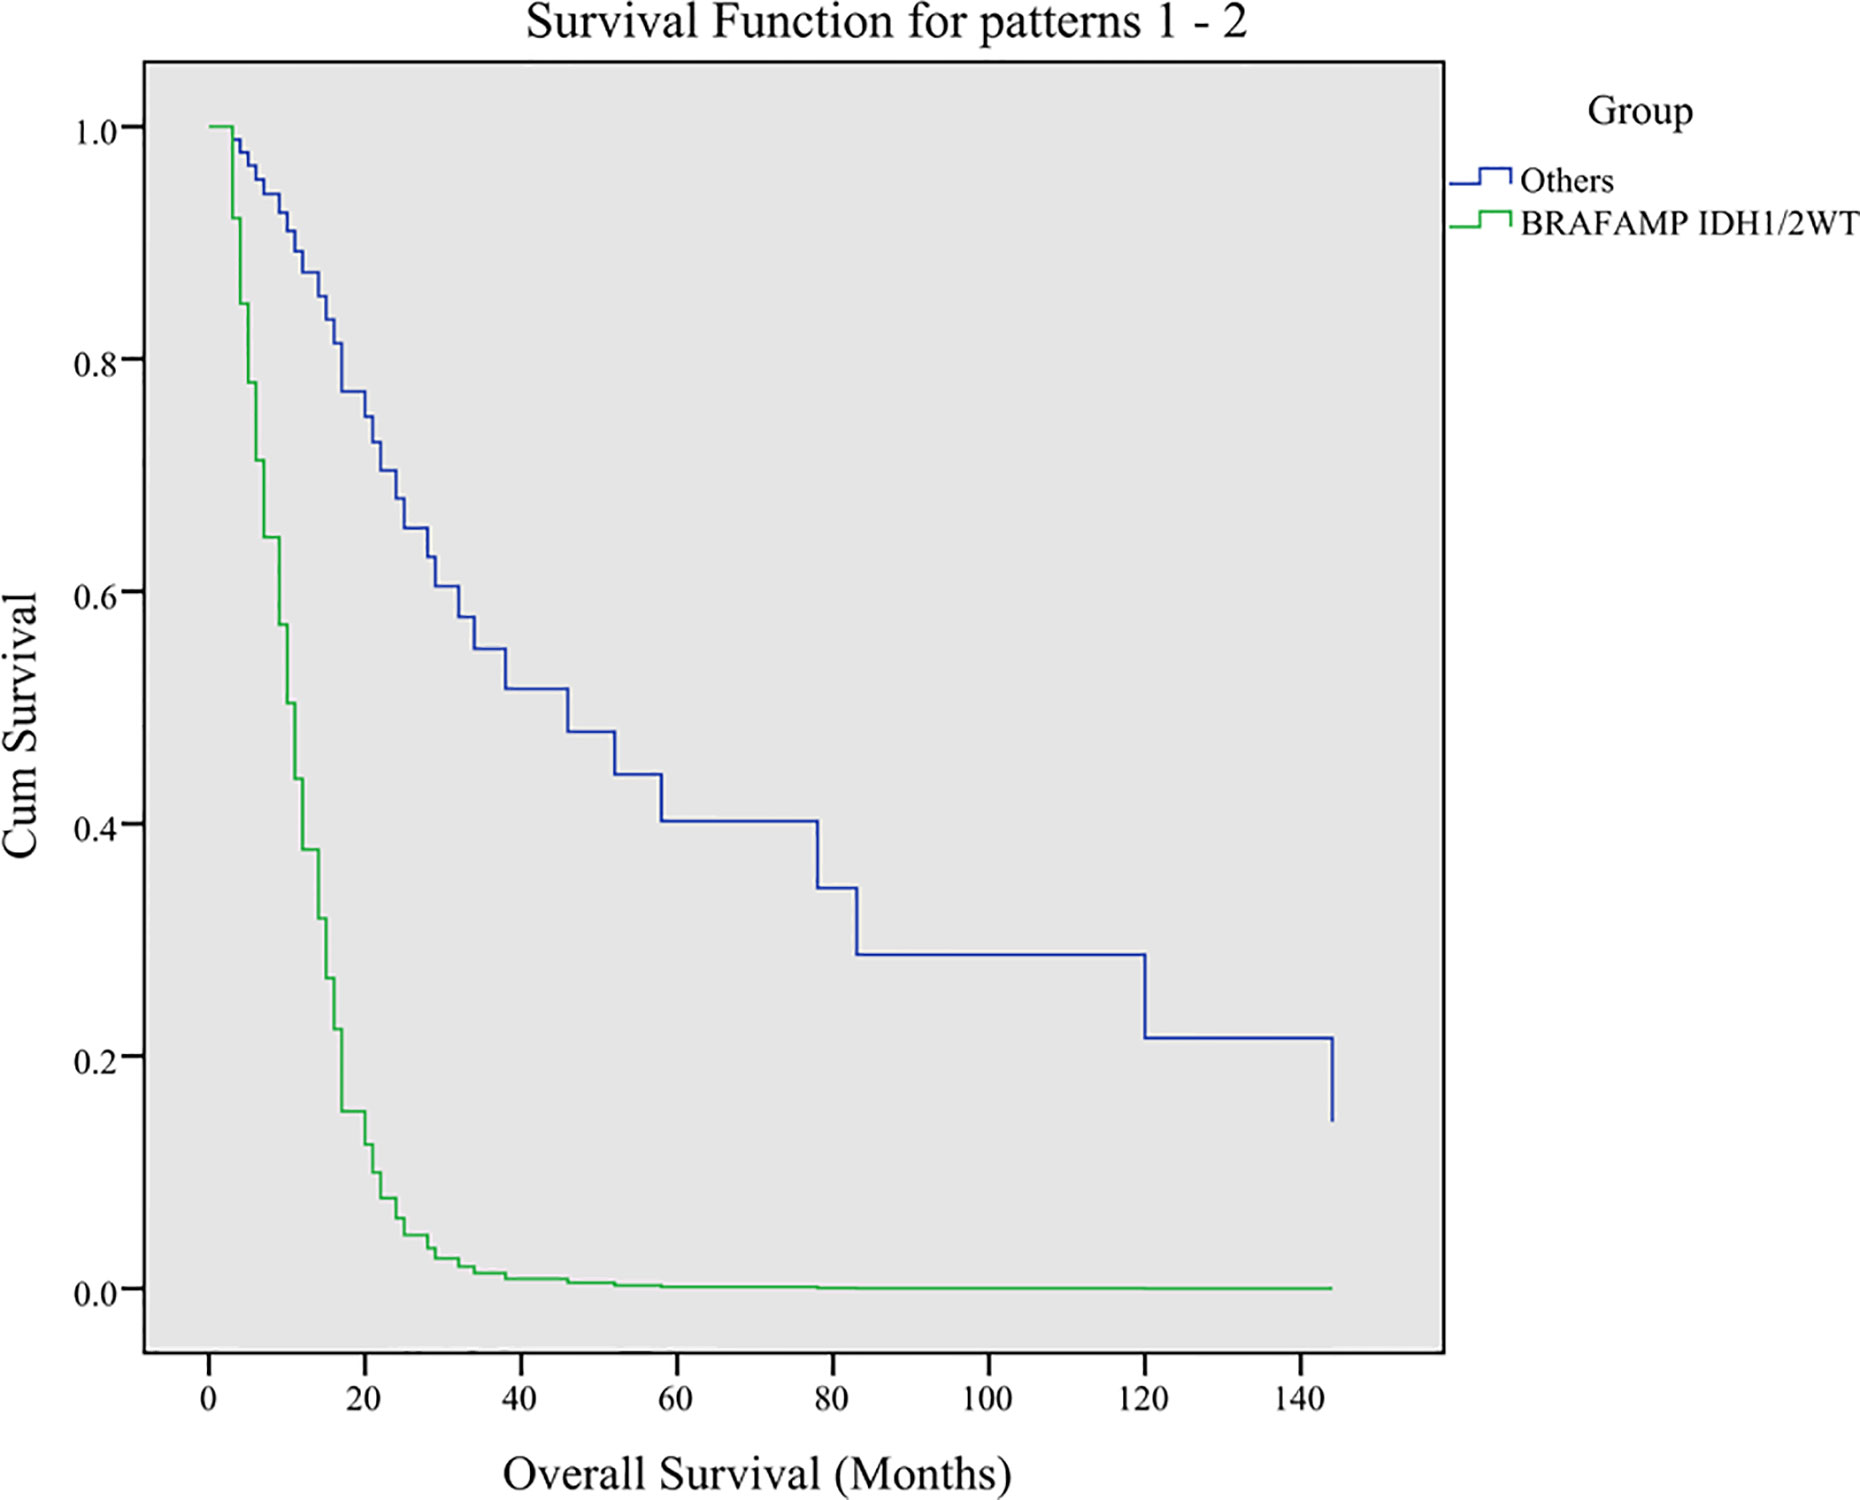
Figure 3 Multivariate analysis of overall survival using Cox regression analysis. Three factors including BRAFAMP and IDH1/2WT, TP53, and ATRX were analyzed. The BRAFAMP and IDH1/2WT genotype was determined as an independent predictive factor for overall survival (HR = 0.138, P = 0.018). BRAF, v-raf murine viral oncogene homolog B1; IDH1/2, isocitrate dehydrogenase 1 and 2.
Associations Between BRAF, IDH1, IDH2, TP53, and ATRX Using String Analysis
The networks showed that there were functional links between BRAF, IDH1, IDH2, TP53, and ATRX except for BRAF and ATRX and BRAF and IDH2. BRAF was directly associated with TP53 and indirectly interacted with ATRX through TP53. BRAF was directly associated with IDH1 and indirectly interacted with IDH2 through IDH1. There were direct interactions among TP53, ATRX, IDH1, and IDH2 (Figure 4A). The combined score of the association showed that the highest score was that between IDH1 and IDH2 (0.976), followed by TP53 and ATRX (0.793), TP53 and IDH1 (0.770), IDH1 and ATRX (0.731), IDH2 and TP53 (0.700), ATRX and IDH2 (0.669), BRAF and TP53 (0.561), and BRAF and IDH1 (0.409) (Figure 4B).
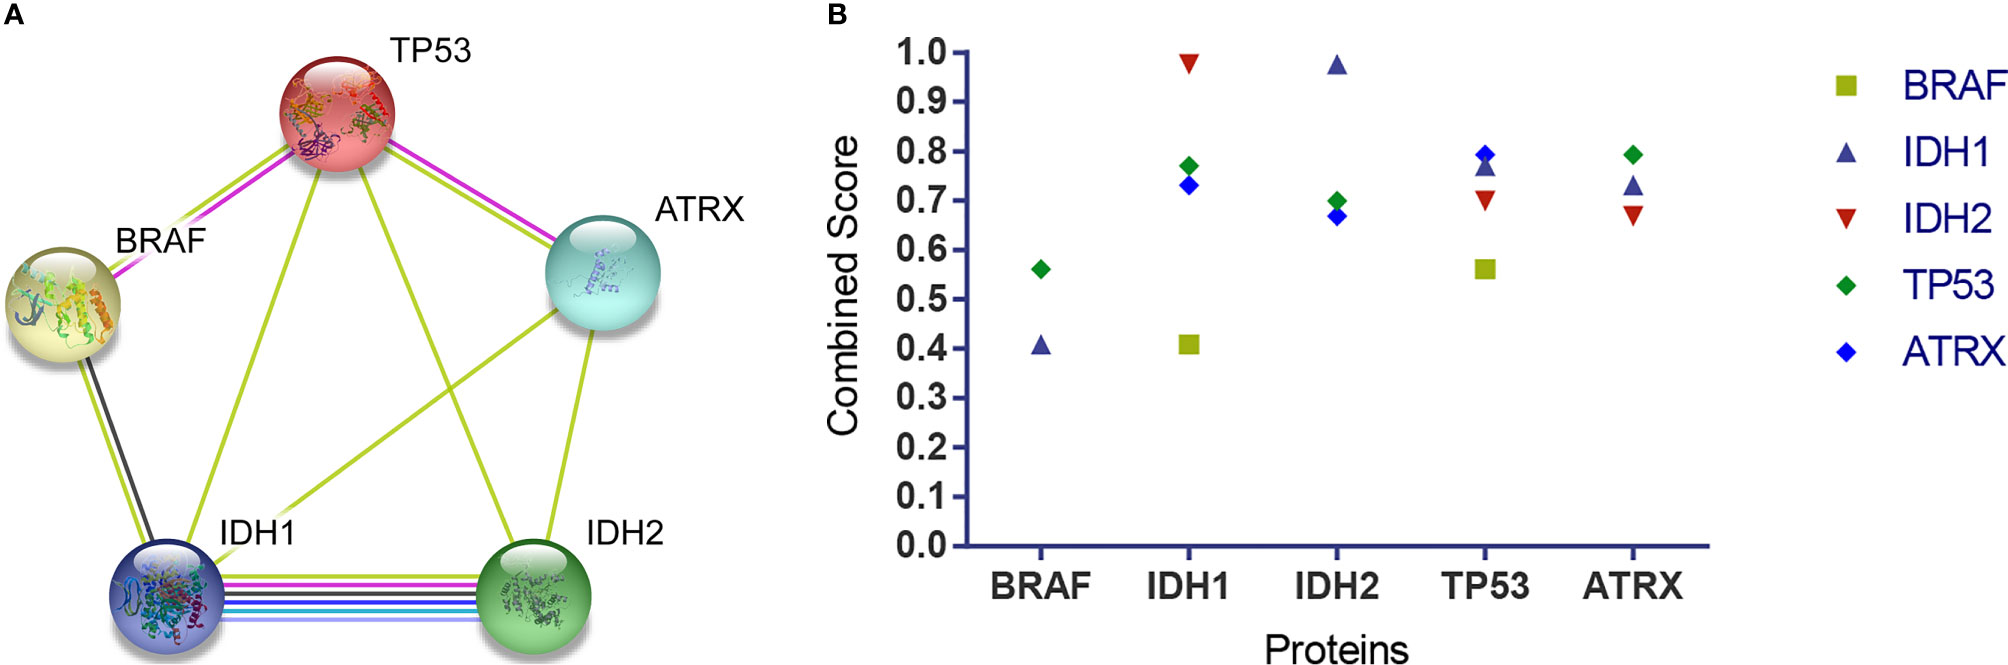
Figure 4 The association among BRAF, IDH1, IDH2, TP53, and ATRX proteins. (A) The networks showed functional links among these four proteins, except for BRAF and ATRX and BRAF and IDH2. TP53 is associated with BRAF and ATRX via a known interaction (experimentally determined, the pink edge) and another interaction (text mining, the lime green edge), respectively. BRAF is associated with IDH1 via other interactions (coexpression, the black edge; text mining, the lime green edge). IDH1 is associated with IDH2 via known interactions (from curated databases, the jungle green edge; experimentally determined, the pink edge), predicted interaction (gene co-occurrence, the blue edge), and other interactions (text mining, the lime green edge; coexpression, the black edge; protein homology, the violet edge). TP53 is associated with IDH1 and IDH2, and ATRX is associated with IDH1 and IDH2 via another interaction (text mining, the lime green edge) respectively. (B) The combined score showed that the highest score was that between IDH1 and IDH2 (0.976), followed by TP53 and ATRX (0.793), TP53 and IDH1(0.770), IDH1 and ATRX (0.731), IDH2 and TP53 (0.700), ATRX and IDH2 (0.669), BRAF and TP53 (0.561), and BRAF and IDH1(0.409). BRAF, v-raf murine viral oncogene homolog B1; IDH1/2, isocitrate dehydrogenase 1 and 2; TP53, tumor protein p53; ATRX, alpha thalassemia/mental retardation syndrome X linked.
Discussion
Glioma is the most common primary brain malignancy and is characterized by high heterogeneity and extensive mutations (26). The roles of RAF serine/threonine protein kinases in various cancers have been investigated in the last two decades. BRAF regulates normal cell growth, differentiation, and survival via the MAPK/ERK pathway (27, 28). BRAF mutations and copy number variation have been widely investigated in melanoma, thyroid carcinoma, and lung and colon cancers (6, 29). Although BRAFV600E is rarely found in adult gliomas, it occurs predominately in pediatric gliomas, accounting for 68%–80% of pleomorphic xanthoastrocytoma (PXA), 20%–70% of ganglioglioma, 9%–10% of pilocytic astrocytoma (PA), 5%–15% of low-grade glioma (LGG), 20% of pediatric glioblastoma (pGBM), and 3% of adult glioblastoma multiforme (GBM) cases (30–32). Because genetic alterations are important in tumor development and progression (33, 34) and both BRAFV600E and BRAFAMP can activate the MAPK pathway, we investigated the different effects of these two BRAF alterations and the mutations associated on the survival of glioma patients.
In this study, among the various BRAF mutations that were identified using next-generation sequencing, the most frequent mutation was BRAFV600E. Although some BRAF mutations are in the functional domains, other BRAF mutations with unknown functions occur across the gene (35). Patients with IDH1WT glioma have a poor prognosis; however, patients with BRAFV600E and IDH1WT experience favorable outcomes. Andrew S. Chi et al. report that five patients with grade II glioma harboring BRAFV600E without IDH1 mutation who had undergone gross total resection without treatment were progression-free for 14–35 months; two patients with glioblastoma harboring BRAFV600E and IDH1WT had a progression-free survival of 36 and 19 months, respectively (36). In addition, a study reported a glioma patient with BRAFV600E without the IDH1 mutation who experienced 2 years of overall survival (37). Hiromichi Suzuki’s study shows that IDHWT in grade II and III gliomas (type III) is associated with a poorer overall survival rate compared with that of glioblastoma. In contrast, the grade II subtype (type IIIa) was associated with more BRAF mutations and better overall survival than the grade III subtype (type IIIb) (26). Patients with glioma harboring BRAFV600E might benefit from MAPK pathway inhibitor target therapy, a rescue treatment that includes the use of RAF inhibitors and MEK inhibitors alone or in combination (38–41), and the results were encouraging (42). Our data show that the survival of the BRAFnon-V600E cohort was comparable to that of the BRAFV600E cohort.
We also find that the gross survival of the BRAFAMP cohort was comparable to that of both the BRAFV600E and BRAFnon-V600E cohorts. Because the IDH1/2 mutation was frequently present in the BRAFAMP cohort, we divided this cohort into two groups based on the absence/presence of the IDH1/2 mutation in order to elucidate the exact survival of patients with BRAFAMP alone and without the interference of the IDH1/2 mutation. We found that the BRAFAMP and IDH1/2WT cohort had reduced overall survival compared with that of the BRAF mutation cohort (BRAFV600E and BRAFnon-V600E) and the BRAFAMP and IDH1/2MT groups. We propose two possible reasons for this. First, the mRNA and protein expression levels of BRAFAMP may be higher than those of BRAFV600E, resulting in higher activation of the MAPK/ERK pathway and subsequent proliferation of cancer cells. Second, the survival of patients with BRAFAMP and IDH1/2MT was comparable to that of patients with BRAF mutations and greater than that of patients with BRAFAMP and IDH1/2WT, probably because the IDH1/2 mutation and 2-HG can induce oxidative stress, autophagy, and apoptosis in cancer cells. We believe that these two reasons may explain the poor survival of the BRAFAMP and IDH1/2WT cohorts. Young adult patients are enriched with BRAFV600E mutations and have better survival than older patients; we reveal that the survival of patients above 30 years of age in the BRAFAMP and IDH1/2WT cohort was also significantly reduced compared with that of the BRAFV600E cohort above 30 years (P = 0.018).
The results of Cox proportional hazard regression analysis show that BRAFAMP and IDH1/2WT genotype was an independent predictive factor for glioma with BRAF mutation and BRAFAMP. IDH1/2 mutations exist in greater than 70% of lower-grade gliomas (grades II and III) and in some glioblastomas (43, 44). It is known that the IDH1/2 mutation leads to hypermethylation, which is the molecular basis of the CpG island methylator phenotype in gliomas (45). We found that BRAFAMP cohorts have lower survival compared with BRAF mutation cohorts, including BRAFV600E and BRAFnon-V600E. However, the survival of patients with BRAFAMP and IDH1/2MT was better than that of patients with BRAFAMP and IDH1/2WT and comparable to that of the BRAFnon-V600E cohort. A previous study indicated that IDH1/2 mutation status alone was a predictive factor for longer overall survival and progression-free survival for the entire group of nonenhancing hemispheric grade II–III gliomas (46). Therefore, we propose that IDH1/2 mutations can improve the survival of cohorts with BRAFAMP. Because the mutant IDH1 and 2-HG can induce oxidative stress, autophagy, and apoptosis (47), we propose that this is the mechanism underlying the improvement in survival conferred by the IDH1/2 mutation.
Most of the studies of BRAFV600E in gliomas focus on pediatric neoplasms, especially in gangliogliomas and PXA (48–50). As all the patients enrolled in this study were adults, our findings provide insight into the effects of BRAF alterations in adult glioma. In addition to their diagnostic role, BRAF mutations may also have a prognostic value (51). Our data show that males accounted for the majority of patients in the BRAF mutation cohort, compared with the BRAFAMP cohort. The occurrence of GBM was higher in the BRAF mutation cohort than in the BRAFAMP cohort, whereas the BRAFAMP group had significantly more patients with the IDH1/2, TP53, and ATRX mutations. ATRX deletions/mutations are associated with several conventional molecular events, including IDH1 and TP53 mutations (52, 53). Somatic mutations in TP53, ATRX, and IDH1/2 have been identified in adult low-grade gliomas (54). Although IDH1/2 mutations are scarce in primary GBM, they are common in diffuse/anaplastic gliomas and secondary GBM (43, 44). ATRX mutations are detected in adult diffuse gliomas and astrocytomas harboring both TP53 and IDH1/2. The co-occurrence of TP53, IDH1/2, and ATRX mutations facilitates the growth of a subgroup of adult diffuse astrocytomas (55). All of the above studies indicate that ATRX mutations frequently overlap with IDH1 and TP53 mutations. Additionally, our string analysis reveals close connections between BRAF, IDH1, IDH2, TP53, and ATRX proteins, similar to previous studies (55). Moreover, our results show that BRAF has direct reactions with TP53 and IDH1 but not with ATRX.
Active Ras can induce the hetero-dimerization of BRAF and CRAF (56), and BRAF can phosphorylate CRAF through direct protein–protein interactions (57, 58). CRAF exerts anti-apoptotic effects, which are mediated by an independent MAPK pathway (59, 60) through direct binding to Bcl-2 (59). TP53 can regulate Bcl-2 by suppressing Bcl-2 transcription (61). Liu et al. (55). find that ATRX alterations are correlated with mutations in IDH1/2 and TP53 in glioma of all grades. Lai et al. (62) find that the rate of Arg-to-Cys substitutions at position 273 in TP53 is higher than that of Arg-to-His substitutions at position 132 in IDH1. They propose that this event is caused by a strand asymmetry mechanism (63) in which C to T mutations occur in the nontranscribed DNA strand in TP53 and IDH1 mutations occur in the transcribed strand in IDH. The study indicates that IDH1/2 mutations represent early events in brain tumor formation (64). We propose that an increase in BRAF activates Bcl-2 by phosphorylating CRAF, and mutated TP53 fails to regulate Bcl-2 but frequently accompanies IDH1/2 mutation via a strand asymmetry mechanism. Further work using appropriate clinical tissue samples or animal models is required to provide some evidence for this proposal.
In conclusion, our study shows that BRAFAMP and IDH1/2WT is related to the reduced survival in adult patients with glioma compared with BRAFV600E and that BRAFAMP is associated with mutations in IDH1, TP53, and ATRX. This suggests that assessment for BRAFAMP and IDH1/2WT alterations is of prognostic value in adult glioma/glioblastoma patients because patients with this gene alteration pattern have relatively shorter survival times and may benefit from personalized, targeted therapy using BRAF and/or MEK inhibitors. As noted above, a concentrated effort is required to prospectively evaluate these findings in adult glioma patients.
Data Availability Statement
The results published or shown here are in whole or part based upon data generated by the TCGA Research Network: https://www.cancer.gov/tcga.
Ethics Statement
All data collected and generated from TCGA, which is a public database, and we strictly followed TCGA publication guidelines (https://www.cancer.gov/about-nci/organization/ccg/research/structural-genomics/tcga/using-tcga/citing-tcga).
Author Contributions
RD, WW, MW, and HJ conceived and designed the work. RD and WW performed data analysis. RD, WW, and TW wrote the manuscript. MW and HJ revised the paper. All authors contributed to the article and approved the submitted version.
Funding
This work was financially supported by the Natural Science Basic Research Program of Shaanxi (Program No. 2019JM-445, 2018JM7062) and The Project of The First Affiliated Hospital of Xi’an Jiaotong University (XJYFY-2019w33).
Conflict of Interest
The authors declare that the research was conducted in the absence of any commercial or financial relationships that could be construed as a potential conflict of interest.
Acknowledgments
The results published or shown here are in whole or part based upon public data generated by the TCGA Research Network: https://www.cancer.gov/tcga.
Supplementary Material
The Supplementary Material for this article can be found online at: https://www.frontiersin.org/articles/10.3389/fonc.2020.531968/full#supplementary-material
Supplementary Figure 1 | Kaplan-Meier Survival curves of patients with gliomas harboring BRAFAMP and BRAF mutation. A: BRAFAMP cohort vs. BRAF mutation cohort (58.835 vs. 71.698, Chi-Square 0.020, P = 0.886);B: BRAFV600E cohort vs. BRAFnon-V600E cohort (41.573 vs. 89.958, Chi-Square 1.999, P = 0.157);C: BRAFAMP & IDH1/2MT cohort vs. BRAFV600E cohort (67.026 vs. 41.573, Chi-Square 1.031, P = 0.310);D: BRAFAMP & IDH1/2MT cohort vs. BRAFnon-V600E cohort (67.026 vs. 89.958, Chi-Square 0.025, P = 0.875);E: BRAFAMP & IDH1/2MT cohort vs. BRAF mutation cohort (67.026 vs.71.698, Chi-Square 0.513, P = 0.474). BRAF, v-raf murine viral oncogene homolog B1; IDH1/2, isocitrate dehydrogenase 1 and 2.
Supplementary Figure 2 | Kaplan-Meier Survival curves of patients above 30 years of age with gliomas harboring BRAFAMP& IDH1/2WT and BRAF V600E. BRAFAMP & IDH1/2WT cohort vs. BRAFV600E cohort (9.750 vs. 40.135, chi-square 5.575, P = 0.018). BRAF, v-raf murine viral oncogene homolog B1; IDH1/2, isocitrate dehydrogenase 1 and 2.
References
1. Ostrom QT, Gittleman H, Xu J, Kromer C, Wolinsky Y, Kruchko C, et al. CBTRUS Statistical Report: Primary Brain and Other Central Nervous System Tumors Diagnosed in the United States in 2009-2013. Neuro-oncology (2016) 18(suppl_5):v1–v75. doi: 10.1093/neuonc/now207
2. Louis DN, Perry A, Reifenberger G, von Deimling A, Figarella-Branger D, Cavenee WK, et al. The 2016 World Health Organization Classification of Tumors of the Central Nervous System: a summary. Acta Neuropathol (2016) 131(6):803–20. doi: 10.1007/s00401-016-1545-1
3. Lyustikman Y, Momota H, Pao W, Holland EC. Constitutive activation of Raf-1 induces glioma formation in mice. Neoplasia (2008) 10(5):501–10. doi: 10.1593/neo.08206
4. Jeuken J, van den Broecke C, Gijsen S, Boots-Sprenger S, Wesseling P. RAS/RAF pathway activation in gliomas: the result of copy number gains rather than activating mutations. Acta Neuropathol (2007) 114(2):121–33. doi: 10.1007/s00401-007-0239-0
5. Network TCGAR. Comprehensive molecular profiling of lung adenocarcinoma. Nature (2014) 511(7511):543–50. doi: 10.1038/nature13385
6. Davies H, Bignell GR, Cox C, Stephens P, Edkins S, Clegg S, et al. Mutations of the BRAF gene in human cancer. Nature (2002) 417(6892):949–54. doi: 10.1038/nature00766
7. Wan PT, Garnett MJ, Roe SM, Lee S, Niculescu-Duvaz D, Good VM, et al. Mechanism of activation of the RAF-ERK signaling pathway by oncogenic mutations of B-RAF. Cell (2004) 116(6):855–67. doi: 10.1016/s0092-8674(04)00215-6
8. Xue Y, Martelotto L, Baslan T, Vides A, Solomon M, Mai TT, et al. An approach to suppress the evolution of resistance in BRAF(V600E)-mutant cancer. Nat Med (2017) 23(8):929–37. doi: 10.1038/nm.4369
9. Laviv Y, Toledano H, Michowiz S, Dratviman-Storobinsky O, Turm Y, Fichman-Horn S, et al. BRAF, GNAQ, and GNA11 mutations and copy number in pediatric low-grade glioma. FEBS Open Bio (2012) 2:129–34. doi: 10.1016/j.fob.2012.05.004
10. Cerami E, Gao J, Dogrusoz U, Gross BE, Sumer SO, Aksoy BA, et al. The cBio cancer genomics portal: an open platform for exploring multidimensional cancer genomics data. Cancer Discov (2012) 2(5):401–4. doi: 10.1158/2159-8290.CD-12-0095
11. Gao J, Aksoy BA, Dogrusoz U, Dresdner G, Gross B, Sumer SO, et al. Integrative analysis of complex cancer genomics and clinical profiles using the cBioPortal. Sci Signaling (2013) 6(269):pl1. doi: 10.1126/scisignal.2004088
12. Kleinbaum DG, Klein M. Kaplan–Meier Survival Curves and the Log–Rank Test. New York: Springer (1996).
13. Szklarczyk D, Gable AL, Lyon D, Junge A, Wyder S, Huerta-Cepas J, et al. STRING v11: protein-protein association networks with increased coverage, supporting functional discovery in genome-wide experimental datasets. Nucleic Acids Res (2019) 47(D1):D607–D13. doi: 10.1093/nar/gky1131
14. Hoadley KA, Yau C, Hinoue T, Wolf DM, Lazar AJ, Drill E, et al. Cell-of-Origin Patterns Dominate the Molecular Classification of 10,000 Tumors from 33 Types of Cancer. Cell (2018) 173(2):291–304.e6. doi: 10.1016/j.cell.2018.03.022
15. Ellrott K, Bailey MH, Saksena G, Covington KR, Kandoth C, Stewart C, et al. Scalable Open Science Approach for Mutation Calling of Tumor Exomes Using Multiple Genomic Pipelines. Cell Syst (2018) 6(3):271–81.e7. doi: 10.1016/j.cels.2018.03.002
16. Taylor AM, Shih J, Ha G, Gao GF, Zhang X, Berger AC, et al. Genomic and Functional Approaches to Understanding Cancer Aneuploidy. Cancer Cell (2018) 33(4):676–89.e3. doi: 10.1016/j.ccell.2018.03.007
17. Gao Q, Liang WW, Foltz SM, Mutharasu G, Jayasinghe RG, Cao S, et al. Driver Fusions and Their Implications in the Development and Treatment of Human Cancers. Cell Rep (2018) 23(1):227–38.e3. doi: 10.1016/j.celrep.2018.03.050
18. Liu J, Lichtenberg T, Hoadley KA, Poisson LM, Lazar AJ, Cherniack AD, et al. An Integrated TCGA Pan-Cancer Clinical Data Resource to Drive High-Quality Survival Outcome Analytics. Cell (2018) 173(2):400–16.e11. doi: 10.1016/j.cell.2018.02.052
19. Sanchez-Vega F, Mina M, Armenia J, Chatila WK, Luna A, La KC, et al. Oncogenic Signaling Pathways in The Cancer Genome Atlas. Cell (2018) 173(2):321–37.e10. doi: 10.1016/j.cell.2018.03.035
20. Jonsson P, Lin AL, Young RJ, DiStefano NM, Hyman DM, Li BT, et al. Genomic Correlates of Disease Progression and Treatment Response in Prospectively Characterized Gliomas. Clin Cancer Res (2019) 25(18):5537–47. doi: 10.1158/1078-0432.CCR-19-0032
21. Ceccarelli M, Barthel FP, Malta TM, Sabedot TS, Salama SR, Murray BA, et al. Molecular Profiling Reveals Biologically Discrete Subsets and Pathways of Progression in Diffuse Glioma. Cell (2016) 164(3):550–63. doi: 10.1016/j.cell.2015.12.028
22. Brennan CW, Verhaak RG, McKenna A, Campos B, Noushmehr H, Salama SR, et al. The somatic genomic landscape of glioblastoma. Cell (2013) 155(2):462–77. doi: 10.1016/j.cell.2013.09.034
23. Cancer Genome Atlas Research N. Comprehensive genomic characterization defines human glioblastoma genes and core pathways. Nature (2008) 455(7216):1061–8. doi: 10.1038/nature07385
24. Bhandari V, Hoey C, Liu LY, Lalonde E, Ray J, Livingstone J, et al. Molecular landmarks of tumor hypoxia across cancer types. Nat Genet (2019) 51(2):308–18. doi: 10.1038/s41588-018-0318-2
25. Thomas AA, Abrey LE, Terziev R, Raizer J, Martinez NL, Forsyth P, et al. Multicenter phase II study of temozolomide and myeloablative chemotherapy with autologous stem cell transplant for newly diagnosed anaplastic oligodendroglioma. Neuro-oncology (2017) 19(10):1380–90. doi: 10.1093/neuonc/nox086
26. Suzuki H, Aoki K, Chiba K, Sato Y, Shiozawa Y, Shiraishi Y, et al. Mutational landscape and clonal architecture in grade II and III gliomas. Nat Genet (2015) 47(5):458–68. doi: 10.1038/ng.3273
28. Roskoski R Jr. Targeting oncogenic Raf protein-serine/threonine kinases in human cancers. Pharmacol Res (2018) 135:239–58. doi: 10.1016/j.phrs.2018.08.013
29. Ciampi R, Zhu Z, Nikiforov YE. BRAF copy number gains in thyroid tumors detected by fluorescence in situ hybridization. Endocr Pathol (2005) 16(2):99–105. doi: 10.1385/ep:16:2:099
30. Schindler G, Capper D, Meyer J, Janzarik W, Omran H, Herold-Mende C, et al. Analysis of BRAF V600E mutation in 1,320 nervous system tumors reveals high mutation frequencies in pleomorphic xanthoastrocytoma, ganglioglioma and extra-cerebellar pilocytic astrocytoma. Acta Neuropathol (2011) 121(3):397–405. doi: 10.1007/s00401-011-0802-6
31. Dahiya S, Emnett RJ, Haydon DH, Leonard JR, Phillips JJ, Perry A, et al. BRAF-V600E mutation in pediatric and adult glioblastoma. Neuro-oncology (2014) 16(2):318–9. doi: 10.1093/neuonc/not146
32. Behling F, Barrantes-Freer A, Skardelly M, Nieser M, Christians A, Stockhammer F, et al. Frequency of BRAF V600E mutations in 969 central nervous system neoplasms. Diagn Pathol (2016) 11(1):55. doi: 10.1186/s13000-016-0506-2
33. Godek KM, Venere M, Wu Q, Mills KD, Hickey WF, Rich JN, et al. Chromosomal Instability Affects the Tumorigenicity of Glioblastoma Tumor-Initiating Cells. Cancer Discov (2016) 6(5):532–45. doi: 10.1158/2159-8290.CD-15-1154
34. Stanislaw C, Xue Y, Wilcox WR. Genetic evaluation and testing for hereditary forms of cancer in the era of next-generation sequencing. Cancer Biol Med (2016) 13(1):55–67. doi: 10.28092/j.issn.2095-3941.2016.0002
35. Schreck KC, Grossman SA, Pratilas CA. BRAF Mutations and the Utility of RAF and MEK Inhibitors in Primary Brain Tumors. Cancers (Basel) (2019) 11(9):1262. doi: 10.3390/cancers11091262
36. Chi AS, Batchelor TT, Yang D, Dias-Santagata D, Borger DR, Ellisen LW, et al. BRAF V600E mutation identifies a subset of low-grade diffusely infiltrating gliomas in adults. J Clin Oncol (2013) 31(14):e233–6. doi: 10.1200/JCO.2012.46.0220
37. Suzuki Y, Takahashi-Fujigasaki J, Akasaki Y, Matsushima S, Mori R, Karagiozov K, et al. BRAF V600E-mutated diffuse glioma in an adult patient: a case report and review. Brain Tumor Pathol (2016) 33(1):40–9. doi: 10.1007/s10014-015-0234-4
38. Brown NF, Carter T, Kitchen N, Mulholland P. Dabrafenib and trametinib in BRAFV600E mutated glioma. CNS Oncol (2017) 6(4):291–6. doi: 10.2217/cns-2017-0006
39. Migliorini D, Aguiar D, Vargas MI, Lobrinus A, Dietrich PY. BRAF/MEK double blockade in refractory anaplastic pleomorphic xanthoastrocytoma. Neurology (2017) 88(13):1291–3. doi: 10.1212/WNL.0000000000003767
40. Schreck KC, Guajardo A, Lin DDM, Eberhart CG, Grossman SA. Concurrent BRAF/MEK Inhibitors in BRAF V600-Mutant High-Grade Primary Brain Tumors. J Natl Compr Cancer Netw JNCCN (2018) 16(4):343–7. doi: 10.6004/jnccn.2017.7052
41. Johanns TM, Ferguson CJ, Grierson PM, Dahiya S, Ansstas G. Rapid Clinical and Radiographic Response With Combined Dabrafenib and Trametinib in Adults With BRAF-Mutated High-Grade Glioma. J Natl Compr Cancer Netw JNCCN (2018) 16(1):4–10. doi: 10.6004/jnccn.2017.7032
42. Kaley T, Touat M, Subbiah V, Hollebecque A, Rodon J, Lockhart AC, et al. BRAF Inhibition in BRAF(V600)-Mutant Gliomas: Results From the VE-BASKET Study. J Clin Oncol (2018), JCO2018789990. doi: 10.1200/JCO.2018.78.9990
43. Yan H, Parsons DW, Jin G, McLendon R, Rasheed BA, Yuan W, et al. IDH1 and IDH2 mutations in gliomas. New Engl J Med (2009) 360(8):765–73. doi: 10.1056/NEJMoa0808710
44. Parsons DW, Jones S, Zhang X, Lin JC, Leary RJ, Angenendt P, et al. An integrated genomic analysis of human glioblastoma multiforme. Science (2008) 321(5897):1807–12. doi: 10.1126/science.1164382
45. Turcan S, Rohle D, Goenka A, Walsh LA, Fang F, Yilmaz E, et al. IDH1 mutation is sufficient to establish the glioma hypermethylator phenotype. Nature (2012) 483(7390):479–83. doi: 10.1038/nature10866
46. Sabha N, Knobbe CB, Maganti M, Al Omar S, Bernstein M, Cairns R, et al. Analysis of IDH mutation, 1p/19q deletion, and PTEN loss delineates prognosis in clinical low-grade diffuse gliomas. Neuro-oncology (2014) 16(7):914–23. doi: 10.1093/neuonc/not299
47. Gilbert MR, Liu Y, Neltner J, Pu H, Morris A, Sunkara M, et al. Autophagy and oxidative stress in gliomas with IDH1 mutations. Acta Neuropathol (2014) 127(2):221–33. doi: 10.1007/s00401-013-1194-6
48. Henson JD, Cao Y, Huschtscha LI, Chang AC, Au AY, Pickett HA, et al. DNA C-circles are specific and quantifiable markers of alternative-lengthening-of-telomeres activity. Nat Biotechnol (2009) 27(12):1181–5. doi: 10.1038/nbt.1587
49. Lau LM, Dagg RA, Henson JD, Au AY, Royds JA, Reddel RR. Detection of alternative lengthening of telomeres by telomere quantitative PCR. Nucleic Acids Res (2013) 41(2):e34. doi: 10.1093/nar/gks781
50. Sievert AJ, Jackson EM, Gai X, Hakonarson H, Judkins AR, Resnick AC, et al. Duplication of 7q34 in pediatric low-grade astrocytomas detected by high-density single-nucleotide polymorphism-based genotype arrays results in a novel BRAF fusion gene. Brain Pathol (2009) 19(3):449–58. doi: 10.1111/j.1750-3639.2008.00225.x
51. Dahiya S, Haydon DH, Alvarado D, Gurnett CA, Gutmann DH, Leonard JR. BRAFV600Emutation is a negative prognosticator in pediatric ganglioglioma. Acta Neuropathol (2013) 125(6):901–10. doi: 10.1007/s00401-013-1120-y
52. Cai J, Zhang C, Zhang W, Wang G, Yao K, Wang Z, et al. ATRX, IDH1-R132H and Ki-67 immunohistochemistry as a classification scheme for astrocytic tumors. Oncoscience (2016) 3(7-8):258–65. doi: 10.18632/oncoscience.317
53. Modrek AS, Golub D, Khan T, Bready D, Prado J, Bowman C, et al. Low-Grade Astrocytoma Mutations in IDH1, P53, and ATRX Cooperate to Block Differentiation of Human Neural Stem Cells via Repression of SOX2. Cell Rep (2017) 21(5):1267–80. doi: 10.1016/j.celrep.2017.10.009
54. Kannan K, Inagaki A, Silber J, Gorovets D, Zhang J, Kastenhuber ER, et al. Whole-exome sequencing identifies ATRX mutation as a key molecular determinant in lower-grade glioma. Oncotarget (2012) 3(10):1194–203. doi: 10.18632/oncotarget.689
55. Liu XY, Gerges N, Korshunov A, Sabha N, Khuong-Quang DA, Fontebasso AM, et al. Frequent ATRX mutations and loss of expression in adult diffuse astrocytic tumors carrying IDH1/IDH2 and TP53 mutations. Acta Neuropathol (2012) 124(5):615–25. doi: 10.1007/s00401-012-1031-3
56. Weber CK, Slupsky JR, Kalmes HA, Rapp UR. Active Ras induces heterodimerization of cRaf and BRaf. Cancer Res (2001) 61(9):3595–8.
57. Mizutani S, Inouye K, Koide H, Kaziro Y. Involvement of B-Raf in Ras-induced Raf-1 activation. FEBS Lett (2001) 507(3):295–8. doi: 10.1016/s0014-5793(01)02992-1
58. Dhomen N, Marais R. New insight into BRAF mutations in cancer. Curr Opin Genet Dev (2007) 17(1):31–9. doi: 10.1016/j.gde.2006.12.005
59. Wang HG, Rapp UR, Reed JC. Bcl-2 targets the protein kinase Raf-1 to mitochondria. Cell (1996) 87(4):629–38. doi: 10.1016/s0092-8674(00)81383-5
60. Wang HG, Takayama S, Rapp UR, Reed JC. Bcl-2 interacting protein, BAG-1, binds to and activates the kinase Raf-1. Proc Natl Acad Sci USA (1996) 93(14):7063–8. doi: 10.1073/pnas.93.14.7063
61. Hemann MT, Lowe SW. The p53-Bcl-2 connection. Cell Death Differ (2006) 13(8):1256–9. doi: 10.1038/sj.cdd.4401962
62. Rodin SN, Rodin AS. Strand asymmetry of CpG transitions as indicator of G1 phase-dependent origin of multiple tumorigenic p53 mutations in stem cells. Proc Natl Acad Sci USA (1998) 95(20):11927–32. doi: 10.1073/pnas.95.20.11927
63. Lai A, Kharbanda S, Pope WB, Tran A, Solis OE, Peale F, et al. Evidence for sequenced molecular evolution of IDH1 mutant glioblastoma from a distinct cell of origin. J Clin Oncol (2011) 29(34):4482–90. doi: 10.1200/JCO.2010.33.8715
Keywords: BRAF, IDH1/2, TP53, ATRX, glioma, copy number amplification, mutation, overall survival
Citation: Da R, Wang M, Jiang H, Wang T and Wang W (2021) BRAFAMP Frequently Co-occurs With IDH1/2, TP53, and ATRX Mutations in Adult Patients With Gliomas and Is Associated With Poorer Survival Than That of Patients Harboring BRAFV600E. Front. Oncol. 10:531968. doi: 10.3389/fonc.2020.531968
Received: 02 February 2020; Accepted: 11 November 2020;
Published: 07 January 2021.
Edited by:
Theodore Nicolaides, New York University, United StatesReviewed by:
Vadim Kumeiko, Far Eastern Federal University, RussiaClaudia Katharina Petritsch, Stanford University, United States
Copyright © 2021 Da, Wang, Jiang, Wang and Wang. This is an open-access article distributed under the terms of the Creative Commons Attribution License (CC BY). The use, distribution or reproduction in other forums is permitted, provided the original author(s) and the copyright owner(s) are credited and that the original publication in this journal is cited, in accordance with accepted academic practice. No use, distribution or reproduction is permitted which does not comply with these terms.
*Correspondence: Wei Wang, d2VpX3dhbmdkb2NAeGp0dS5lZHUuY24=