 Rui Sun
 Simin Li3
 Ke Zhao
 Long Li
- 1Department of Pediatric Surgery, Capital Institute of Pediatrics, Beijing, China
- 2Chinese Academy of Medical Sciences and Peking Union Medical College, Beijing, China
- 3Stomatological Hospital, Southern Medical University, Guangzhou, China
- 4Department of Ophthalmology, Ningbo Hangzhou Bay Hospital, Ningbo, China
Background: This study aimed to systematically investigate gene signatures for hepatoblastoma (HB) and identify potential biomarkers for its diagnosis and treatment.
Materials and Methods: GSE131329 and GSE81928 were obtained from the Gene Expression Omnibus (GEO) database. Differentially expressed genes (DEGs) between hepatoblastoma and normal samples were identified using the Limma package in R. Then, the similarity of network traits between two sets of genes was analyzed by weighted gene correlation network analysis (WGCNA). Cytoscape was used to visualize and select hub genes. PPI network of hub genes was construed by Cytoscape. GO enrichment and KEGG pathway analyses of hub genes were carried out using ClueGO. The random forest classifier was constructed based on the hub genes using the GSE131329 dataset as the training set, and its reliability was validated using the GSE81928 dataset. The resulting core hub genes were combined with the InnateDB database to identify the innate core genes.
Results: A total of 4244 DEGs in HB were identified. WGCNA identified four modules that were significantly correlated with the disease status. A total of 114 hub genes were obtained within the top 20 genes of each node rank. 6982 relation pairs and 3700 nodes were contained in the PPI network of 114 hub genes. GO enrichment and KEGG pathway analyses of hub genes were focused on MAPK, cell cycle, p53, and other crucial pathways involved in HB. A random forest classifier was constructed using the 114 hub genes as feature genes, resulting in a 95.5% true positive rate when classifying HB and normal samples. A total of 35 core hub genes were obtained through the mean decrease in accuracy and mean decrease Gini of the random forest model. The classification efficiency of the random forest model was 81.4%. Finally, CDK1, TOP2A, ADRA1A, FANCI, XRCC1, TPX2, CCNB2, CDK4, GLYATL1, and CFHR3 were identified by cross-comparison with the InnateDB database.
Conclusion: Our study established a random forest classifier that identified 10 core genes in HB. These findings may be beneficial for the diagnosis, prediction, and targeted therapy of HB.
Introduction
Hepatoblastoma (HB) is the most common pediatric liver tumor, affecting mainly children under 4 years of age (1). Although its incidence has increased markedly over the last few decades, HB is a rare pediatric malignancy with an annual incidence of 1.5 cases per million (2). Complete surgical resection and chemotherapy have contributed to improving the survival rate of up to 80% in all diagnosed patients (3). However, the prognosis for patients with clinically advanced HB remains relatively low. Furthermore, surviving patients can suffer severe and lifelong side effects due to chemotherapy and immunosuppression (4). Lacking of an effective means of early diagnosis is the main reason contributed to the relative worse prognosis for patients with HB. At present, clinicians rely primarily on clinical symptoms, imaging, and alpha-fetoprotein levels to diagnose the disease. Among these methods, no novel biomarker had been showed except the conventional AFP levels. However, the sensitivity and specificity were not satisfied due to the various sources of AFP from different patients.In the previous study of Liu et al, it claimed there were 5 patients with a normal AFP level were diagnosed as HB (5). Consequently, novel biomarkers must be identified to develop efficient diagnostic methods and therapeutic strategies for patients affected with HB.
Recent studies have demonstrated that some RNAs are aberrantly expressed in HB thanks to the advancements in gene chips and high-throughput sequencing. A recent study reported by Liu et al. revealed that the increase of N6-Methyladenosine modification is an oncogenic mechanism in HB (6). Multiple studies have also shown that different genes, including genes encoding for long non-coding RNAs, are involved in the proliferation, apoptosis, and glutaminolysis of HB, such as zinc finger antisense 1 (7), 3-hydroxy-3-methylglutaryl-CoA synthase 1 (8), and TUG1 (9). Since the analysis pipeline, experimental methods, and sample size of each research are different, the conclusions have been controversial. Thus, a further bioinformatics exploration of data published in public databases could consolidate data and reveal novel additional genes associated with HB.
In this study, we investigated two HB datasets obtained from the Gene Expression Omnibus (GEO) database to identify reliable differentially expressed genes (DEGs) in HB. Through deep and comprehensive bioinformatics analysis, we identified hub genes, which we used to construct a diagnosis classification for HB. Moreover, we identified the core genes using our classification and cross-comparing it with the congenital immune-related genes present in the InnateDB database. The identification of a list of core genes may provide new diagnostic, prognostic, and potential therapeutic biomarkers for HB.
Materials and Methods
Acquisition of Microarray Profiles
The flow chart for the study was showed in Figure 1. Microarrays that met the following criteria were collected: (1) studies including at least 20 samples and (2) examination expression of both cancerous tissue and adjacent noncancerous tissue from HB patients. Microarrays without useful data for analysis were excluded. Finally, 2 independent microarrays data, GSE131329 and GSE81928 databases, were obtained from the GEO database (http://www.ncbi.nlm.nih.gov/geo). The characteristics of the 2 datasets were presented in Table 1. Probes were converted into the corresponding gene symbols according to the annotation information in the dataset.
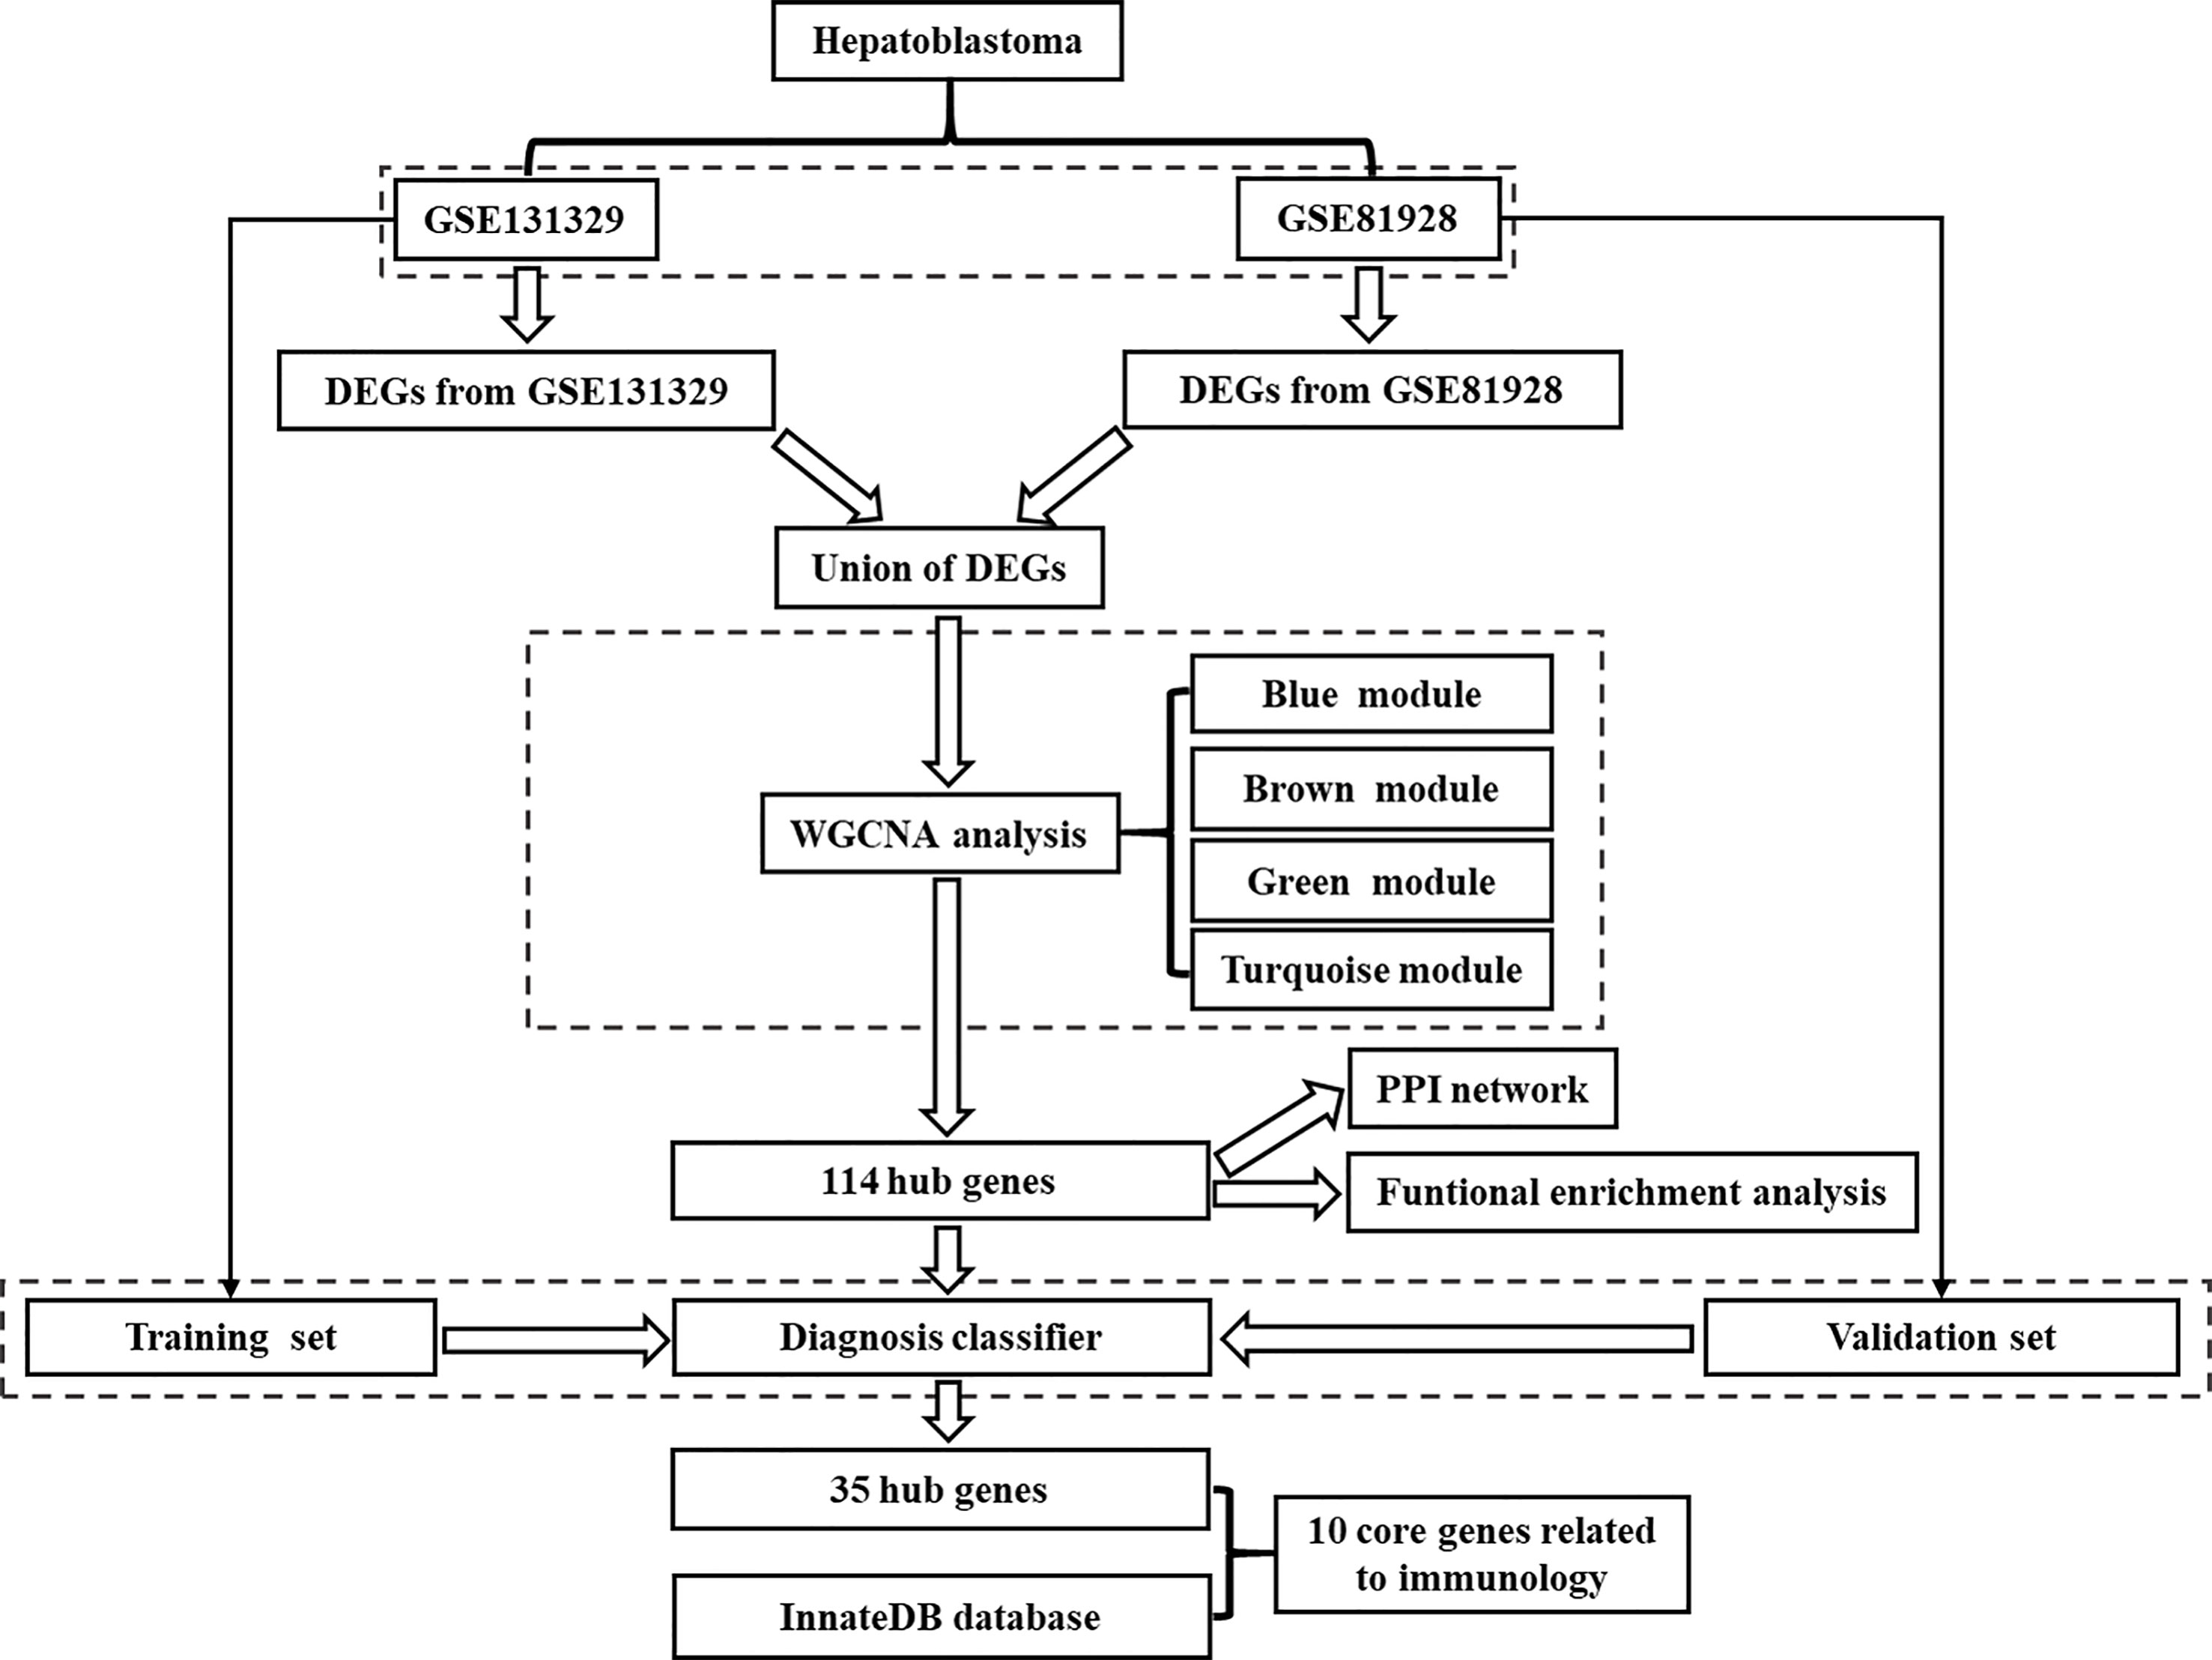
Figure 1 Flowchart showing the protocol of the study. DEGs, differentially expressed genes; WGCNA, Weighted gene correlation network analysis; PPI, protein-protein interaction.
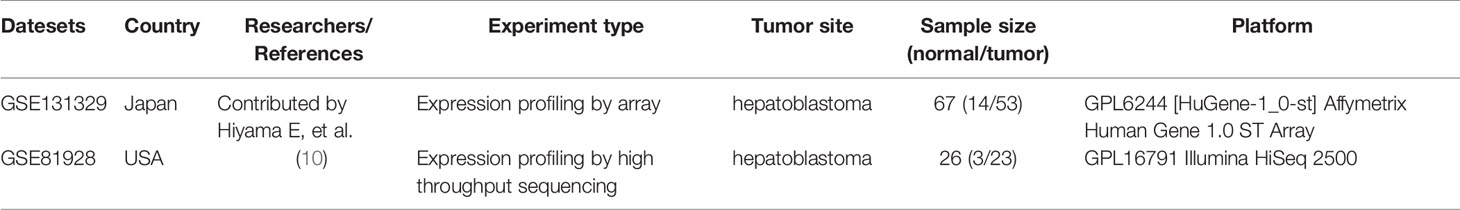
Table 1 The characteristics of the 2 datasets in the study.
Since GSE131329 is chip data and GSE81928 is sequencing data, we used different procedures to deal with 2 datasets. For the GSE131329 dataset, platform annotation files were used to match probes to the gene symbol. If multiple probes matched a single gene, the median ranking value was used as the expression value. Then, the disease and normal gene expression spectrum of GSE131329 was constructed. For the GSE81928 dataset, we excluded from the analysis genes whose expression value was 0 in 80% of the samples. We analyzed a total of 17920 genes from the two data sets, which were then used for the subsequent analyses.
Identification of Differentially Expressed Genes (DEGs)
The Limma package in R was used to identify DEGs between HB and non-tumor samples. The cutoff value was set to |Log2FC (fold-change)| > 0.58 in both datasets to obtain more DEGS for further analysis in accordance with protocols of previous studies (11, 12). Because the experimental assay and platform of the 2 datasets were different, the P value was < 0.05 for GSE131329, and was < 0.01 for GSE81928 to obtain more significant DEGs, which was used the previous researches as reference (13, 14).
Weighted Gene Correlation Network Analysis (WGCNA)
WGCNA is a systematic biological method used to describe gene association patterns among different samples (15). It can be used to identify highly collaborative gene sets and to identify candidate biomarker genes or therapeutic targets based on gene set interconnection and the correlation between gene sets and phenotypes. Using the GSE131329 dataset as reference, the potential DEGs expression profile of HB was constructed. Then, we identified the related modules of HB, and analyzed the relationship between those modules and either HB or normal samples, using the WGCNA package in R. The identified network of HB modules was visualized using Cytoscape v. 3.8.0 (https://cytoscape.org/) to identify the hub genes in each module.
Protein-Protein Interaction (PPI) Network Construction of Hub Genes
In order to analyze the role of 114 hub genes in the global human biological network, we constructed a PPI network of modular genes. We downloaded and integrated human interaction protein data from the following database: HPRD release9 (http://www.hprd.org/), IntAct (http://www.ebi.ac.uk/intact/), MINT (http://mint.bio.uniroma2.it/mint/Welcome.do), BioGRID Release 3.4.132 (http://thebiogrid.org/), DIP (http://dip.doe-mbi.ucla.edu/dip/Main.cgi), String (https://string-db.org). We extracted 114 protein interaction pairs of hub genes from the integrated human interaction protein pairs. Even if there was only one protein interacting with one of the 114 module genes, it would be extracted. The PPI network of these 114 modules was visualized by Cytoscape. In the network, 114 hub genes were marked with the color of their modules. Network analyzer, a Cytoscape tool, was used to calculate network topology properties.
Bioinformatic Analysis of Hub Genes
Gene ontology (GO) analysis was used to identify potential biological processes, cellular components, and molecular functions associated with DEGs. The Kyoto Encyclopedia of Genes and Genomes (KEGG) is a collection of databases for the systematic analysis of gene functions that link genomic information with higher-order functional information (16). GO enrichment and KEGG pathway analysis of the top 20 DEGs in HB were revealed using the ClueGO software. ClueGO software is a Cytoscape App that extracts representative functional biological information from a large list of genes or proteins (17). P < 0.05 was regarded as the cut-off criterion with statistic difference.
Construction and Validation of the HB Classifier
Random forest is a classification method that uses multiple trees to train and predict samples and is characterized by high accuracy (18). Therefore, we constructed a random forest model for HB, using GSE131329 as the training set, the top 20 genes in the module as the classification feature, and disease and normal samples as the variables. Then, we validated the model using the GSE81928 dataset as an independent validator. The model feature files of training set (Supplementary Table 1) and verification set (Supplementary Table 2) were shown in the Supplementary.
Cross-Comparison of Biological Markers of HB in InnateDB
InnateDB (http://www.innatedb.com) is a publicly available database of genes, proteins, and experimentally verified interacttions and signaling pathways involved in innate immunity (19). We intersected hub genes related to immunity in HB as revealed by our bioinformatics analysis with genes present in the InnateDB database.
Results
Identification of DEGs
In total, 4244 DEGs (2839 in GSE131329 and 1863 in GSE81928) were identified between tumor and normal tissues (Supplementary Table 3), of which in GSE131329, 1368 were downregulated and 1471 were upregulated (Supplementary Table 4), while in GSE81928, 28 were downregulated and 1835 were upregulated (Supplementary Table 5). There were 453 overlapping DEGs of 2 datasets. The Venn diagrams (Available online: http://bioinformatics.psb.ugent.be/webtools/Venn/) was showed in Figure 2. The heat map and Volcano plot of the two datasets were showed in Figures 3–D.
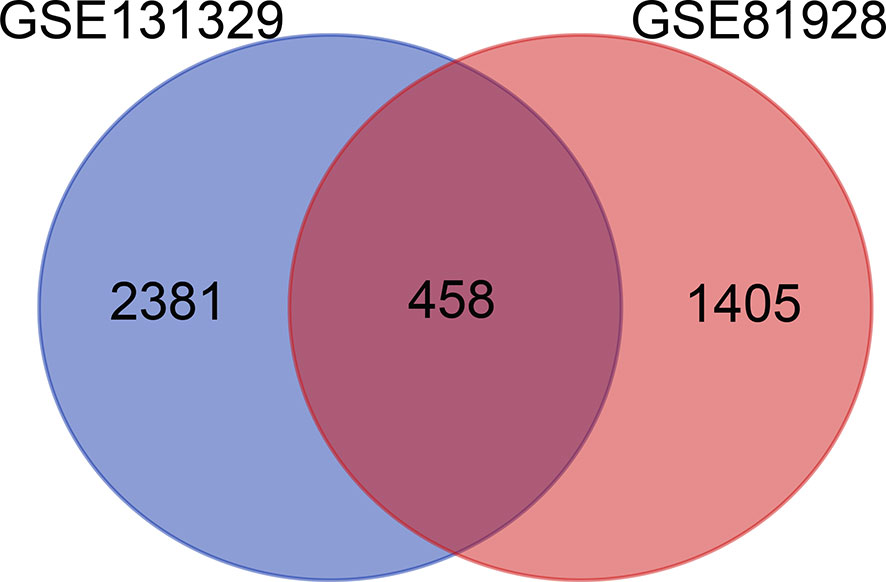
Figure 2 Total of 4,244 DEGs identified from 2 datasets (2839 in GSE131329 and 1863 in GSE81928). DEGs, differentially expressed genes.
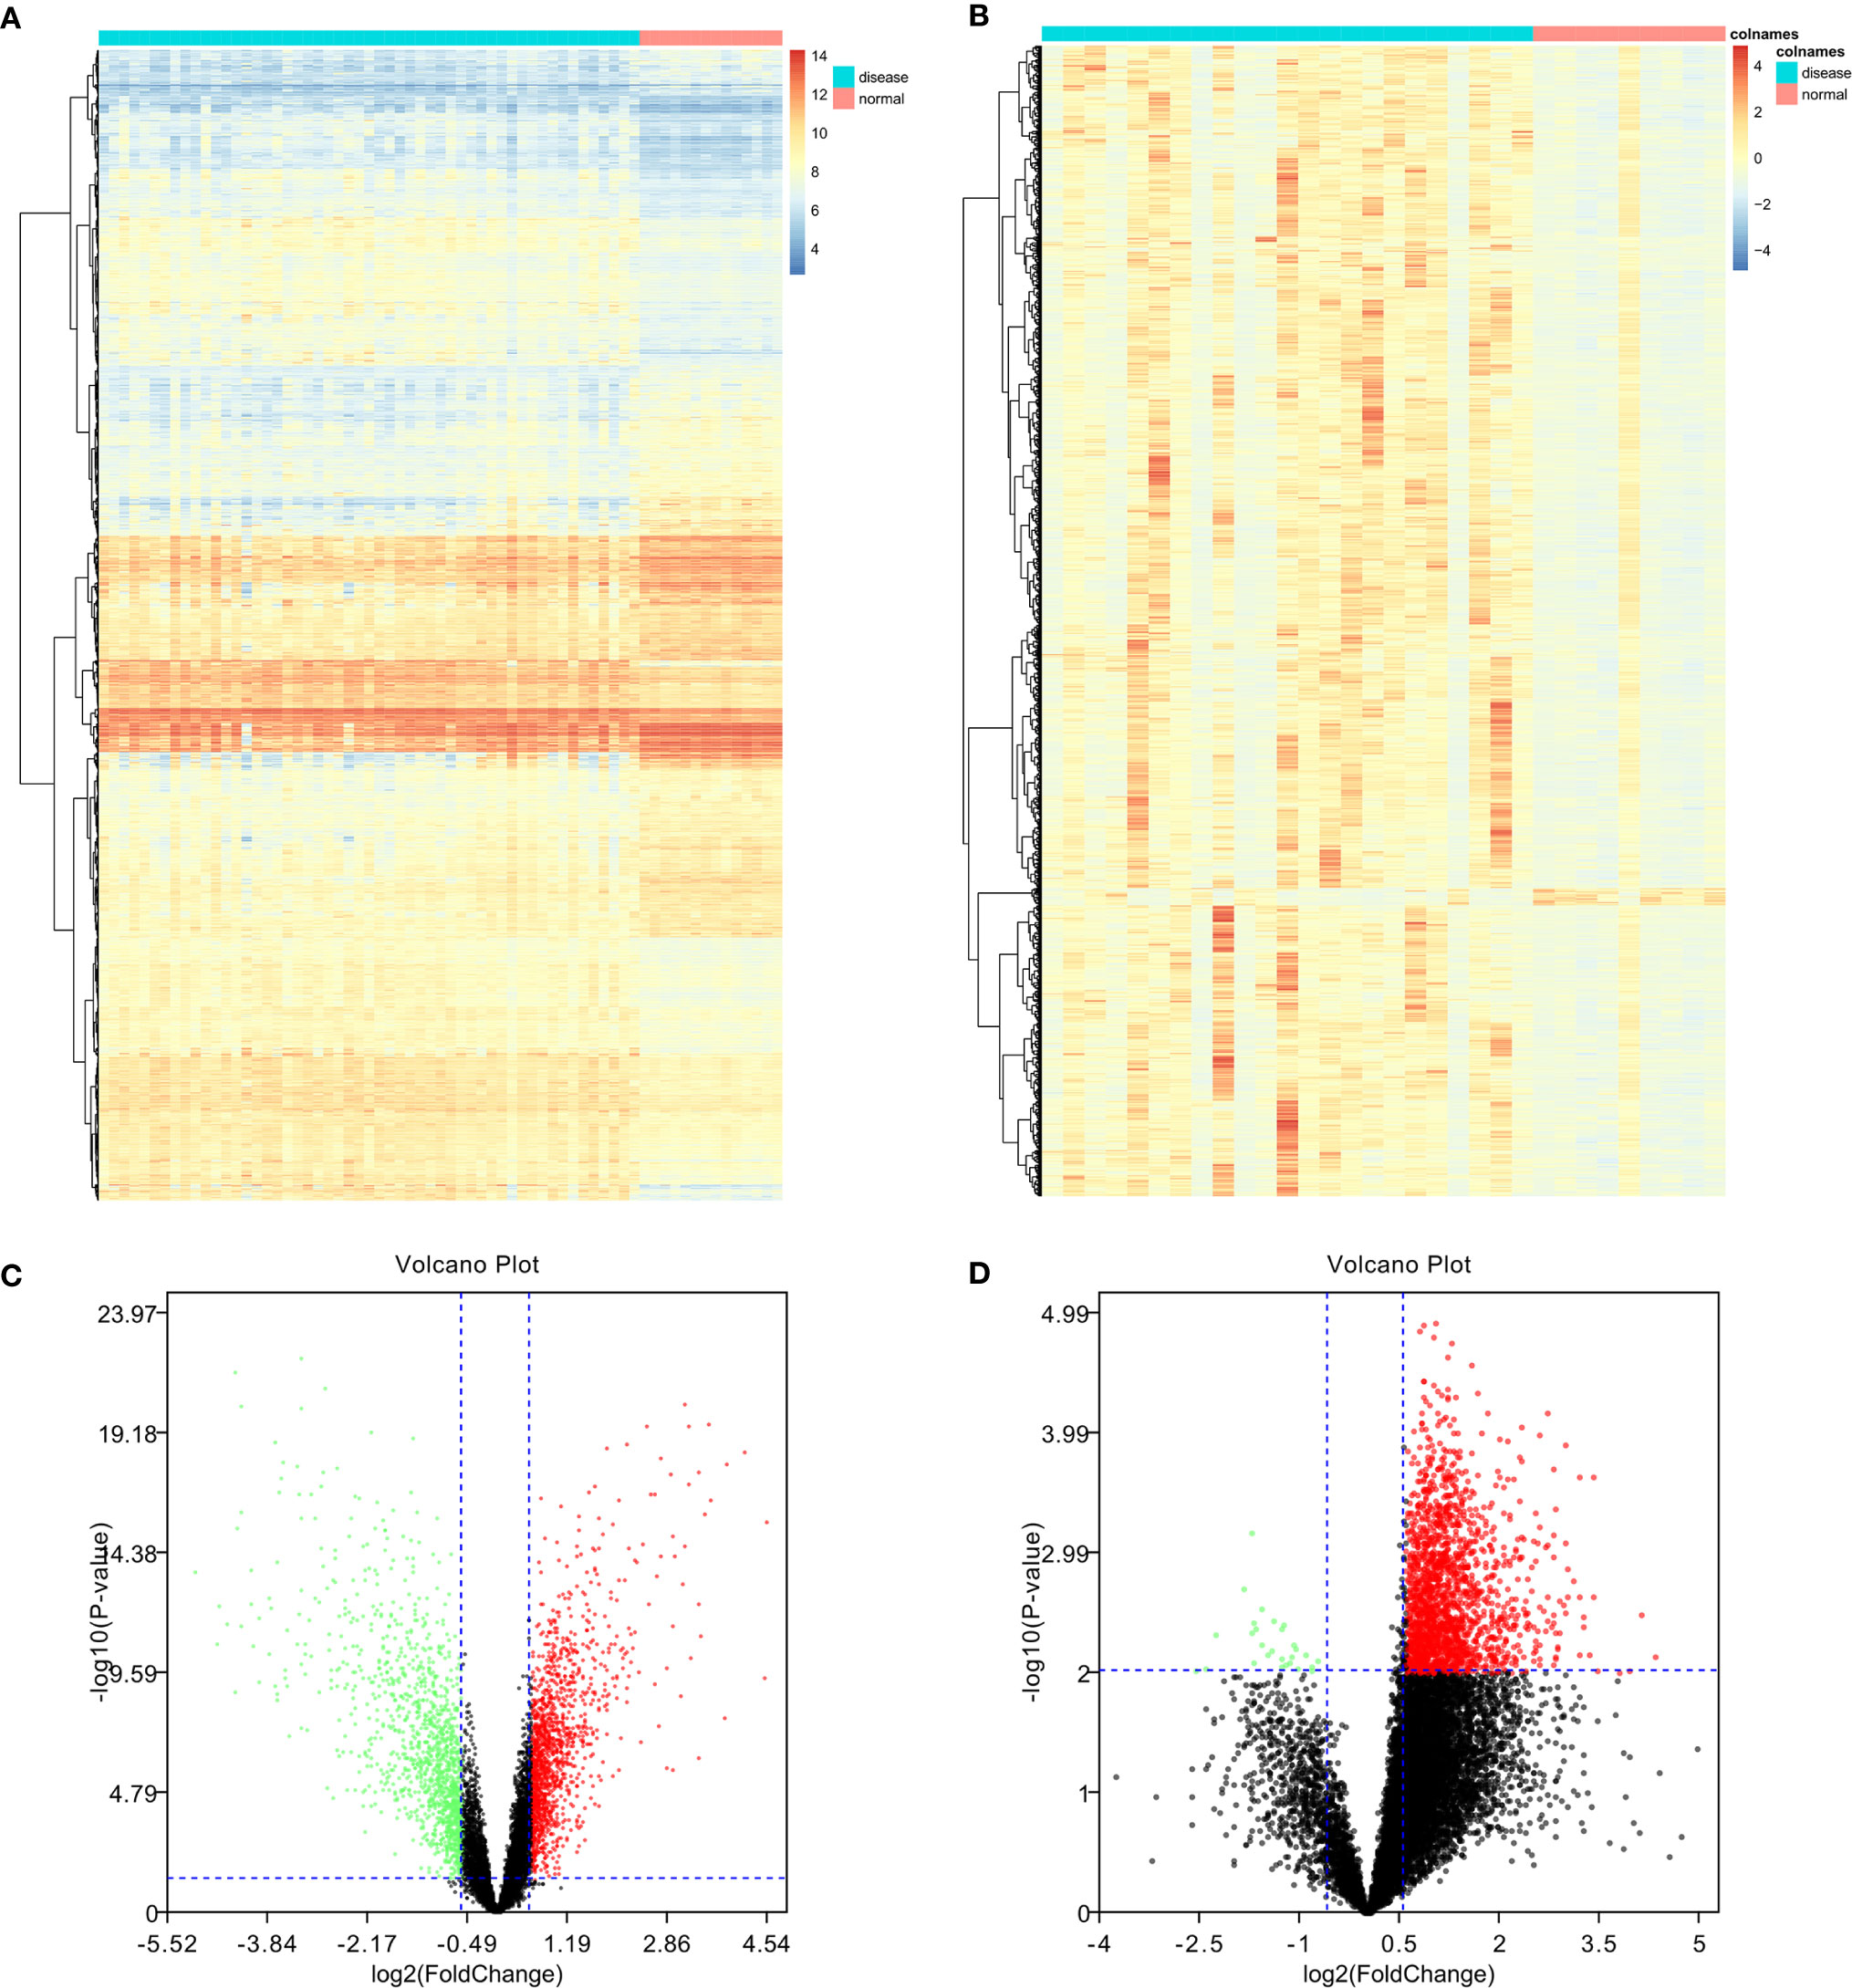
Figure 3 Heat map of differentially expressed genes (DEGs) and volcano plot of genes in the two datasets. Upregulated DEGs are shown in red; downregulated DEGs are shown in green; non-DEGs are shown in black. (A, B) GSE131329 dataset; (C, D) GSE81928 dataset.
WGCNA
Using the GSE131329 dataset and the WGCNA package in R to analyze the co-expression with default parameters, we constructed the expression spectrum of the 4244 DEGs. We obtained six different modules (indicated in blue, brown, green, turquoise and yellow) (Figure 4). The blue, brown, green, and turquoise modules were significantly correlated with HB and normal samples (Figure 4). The blue and brown modules were negatively correlated with HB disease, whereas the green and turquoise modules were positively correlated with HB disease. The modules contained 408 genes (blue), 188 genes (brown), 123 genes (green), and 666 genes (turquoise). Sample clustering is shown in Figure 4. The red component represents HB samples, while green represents the non-tumor samples.
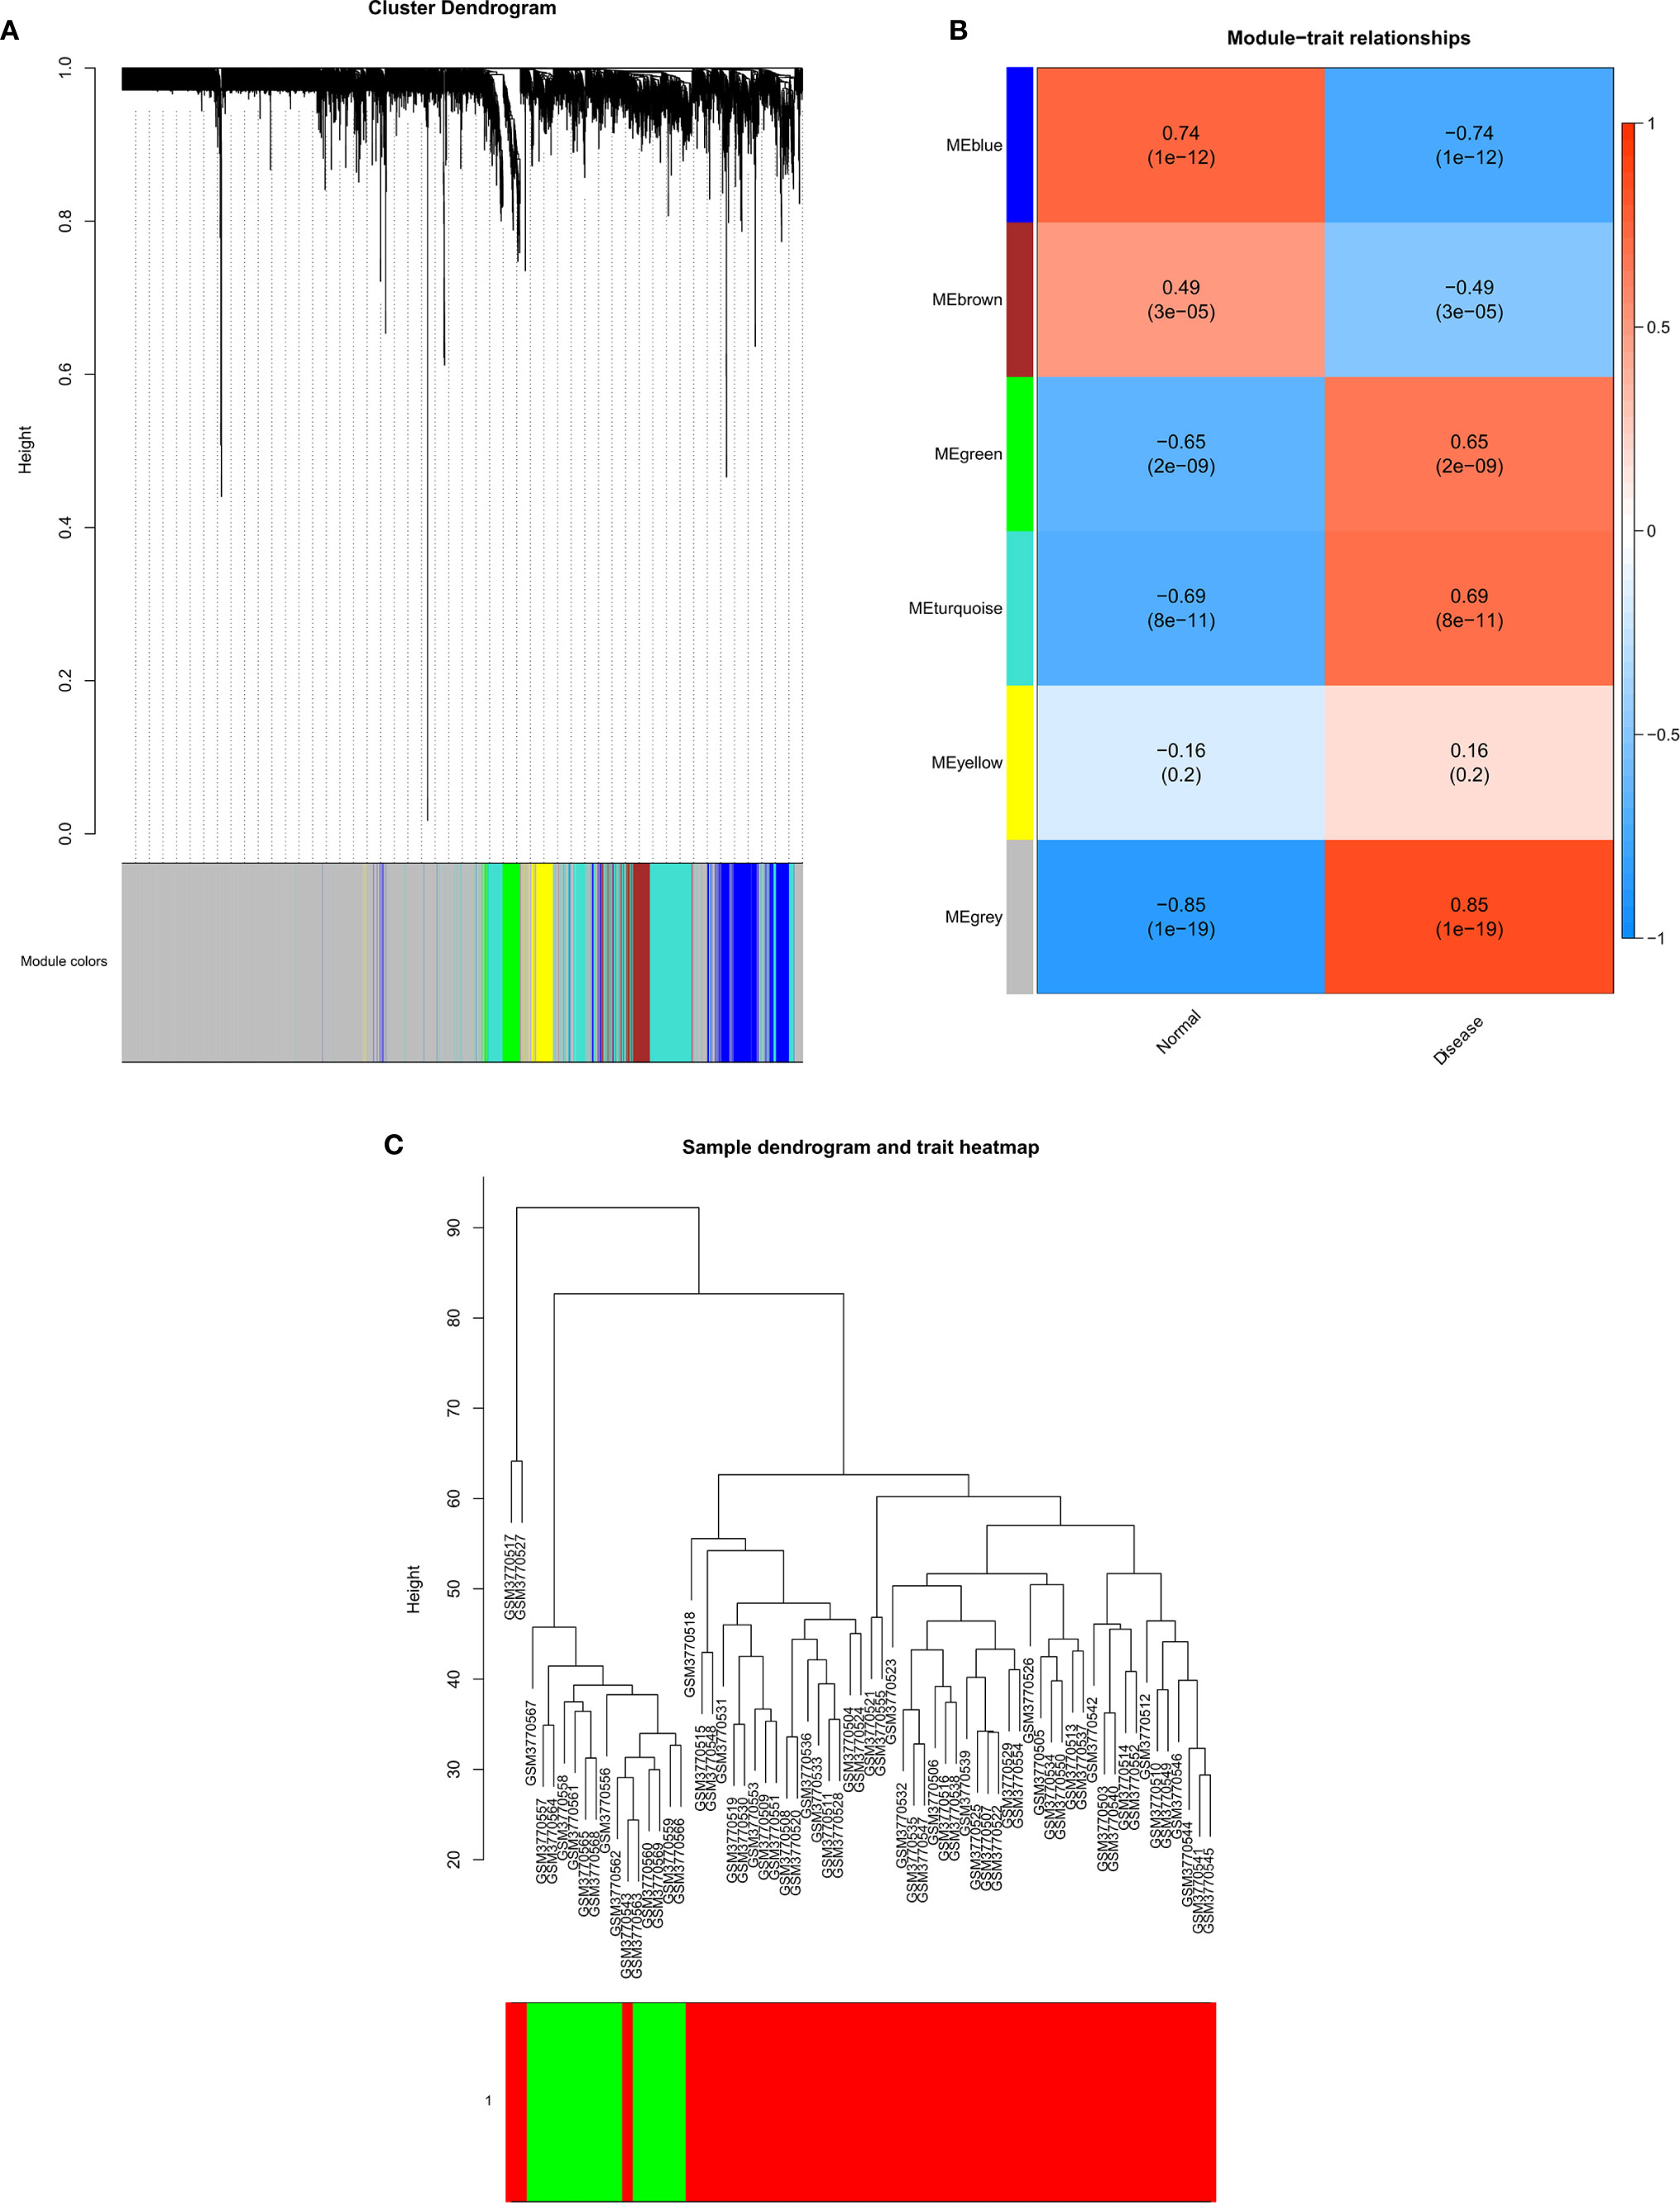
Figure 4 Gene modules identified by WGCNA. (A) Cluster dendrogram of the coexpression network modules; (B) Gene relation between hepatoblastoma and normal samples; (C) Cluster tree of hepatoblastoma and normal samples.
Modules Network Construction and Hub Genes Identification
The network of HB-related modules (blue, brown, green, and turquoise modules) is shown in Figures 5A–D. Then, we analyzed the network using Cytoscape, selecting the top 20 genes of each module as the HB hub genes (genes with the same degree were taken out at the same time). Degree refers to the number of connections between one point and other points in the network. We identified a total of 114 hub genes (Supplementary Table 6). The larger the point is, the greater the degree of the representative node.
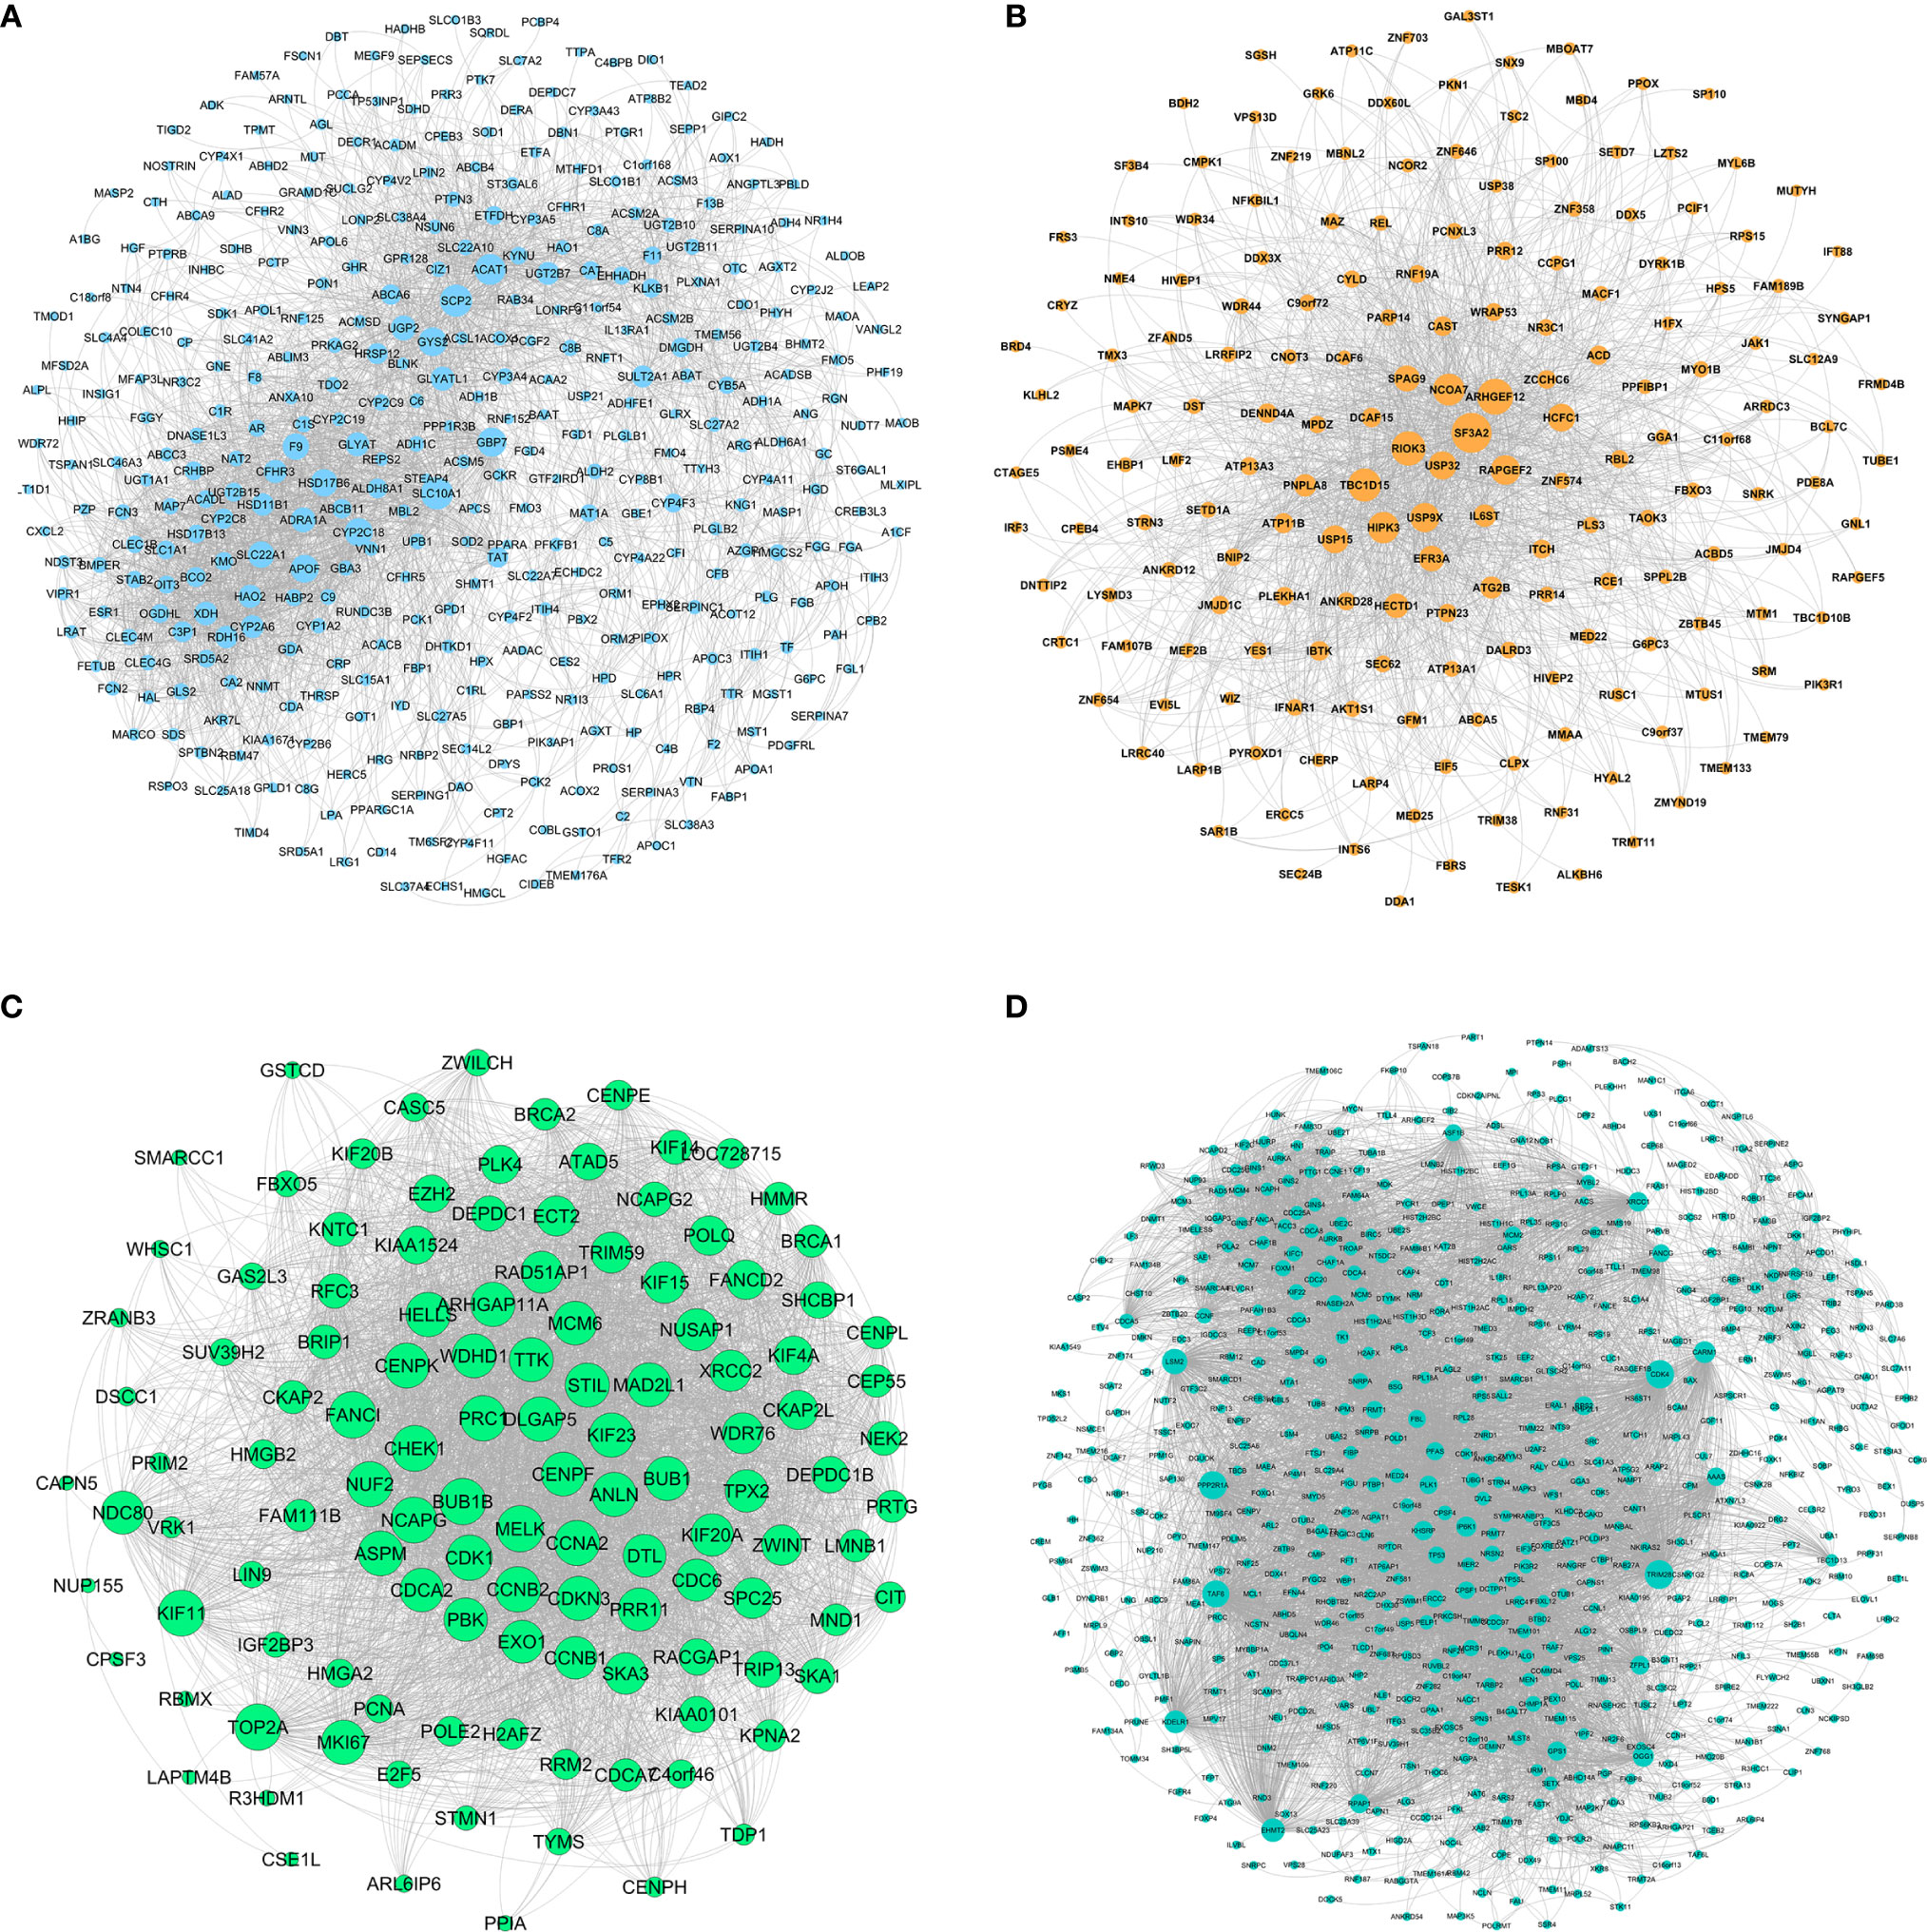
Figure 5 Gene symbols and gene interaction in the four modules, as determined by ClueGO. (A) Blue module; (B) Brown module; (C) Green module; (D) Turquoise module.
PPI Network Construction of Hub Genes
We constructed the PPI network of 114 hub genes. Finally, the network was consisted of 6982 relation pairs and 3700 nodes (Figure 6). For the topological properties of nodes, we arranged them in descending order according to the interaction degrees, and selected the top 20 genes to display, including RPS2, PPP2R1A, CDK1, FBL, PLK1, TRIM28, CDK4, PRMT1, SF3A2, ITCH, ANLN, USP15, CCNB1, EHMT2, CCNA2, USP9X, HCFC1, KIF11, TOP2A, as shown in Table 2. These genes play an important role in the global biological network.
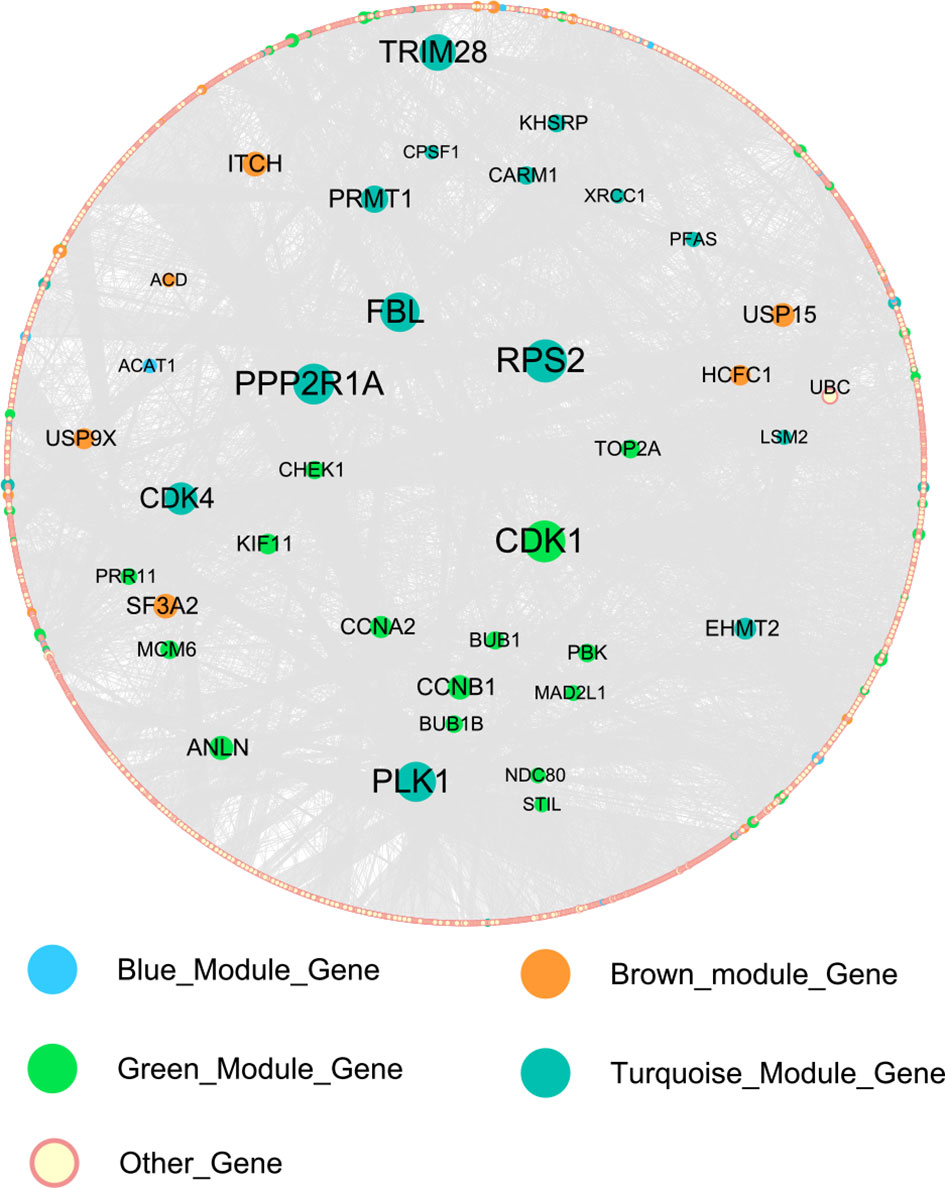
Figure 6 The protein-protein interaction (PPI) network of the 114 hub genes.
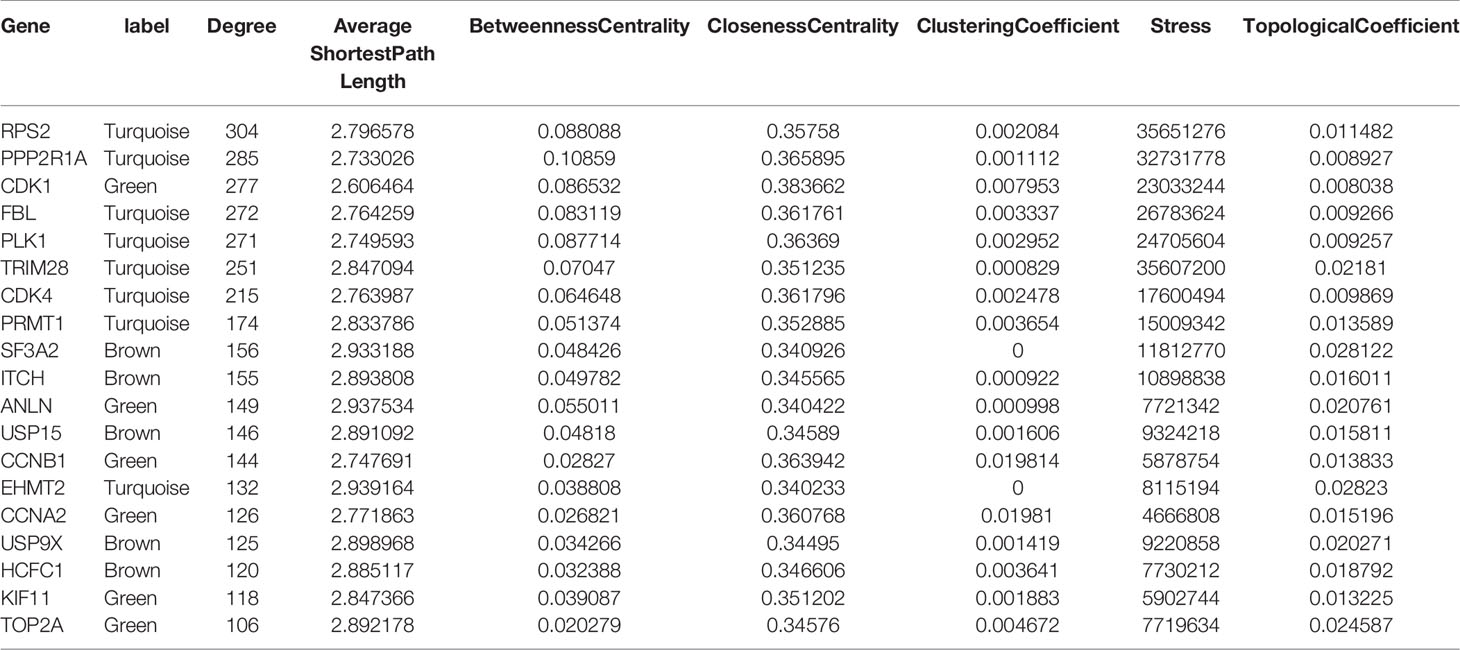
Table 2 Network topological characteristic of top 20 nodes in PPI network.
Bioinformatic Analysis of Hub Genes
We performed the GO enrichment and KEGG pathway analysis of the top 20 genes using ClueGO. Of the 114 hub genes identified, 21 were from the blue module, 24 from the brown module, 46 from the green module, and 23 from the turquoise module. GO function enrichment results are shown in Figure 7. Hub genes were enriched in multiple biological functions, including regulation of DNA demethylation, nuclear chromosome isolation, protein targeting to the peroxisomes, negative regulation of stress-activated MAPK cascade, signal transduction by p53 class mediator resulting in cell cycle arrest, toroid dehydrogenase activity with the CH-OH group acting as donors and NAD or NADP as acceptors et al. (Supplementary Table 7). The KEGG pathway analysis results showed that these hub genes also participated in the P53 signaling pathway, cell aging, cell cycle, meiotic maturation process of oocytes, progesterone-mediated oocyte maturation, steroid biosynthesis, retinol metabolism, chemical carcinogenesis, and other biological pathways (Figure 7) (Supplementary Table 8).
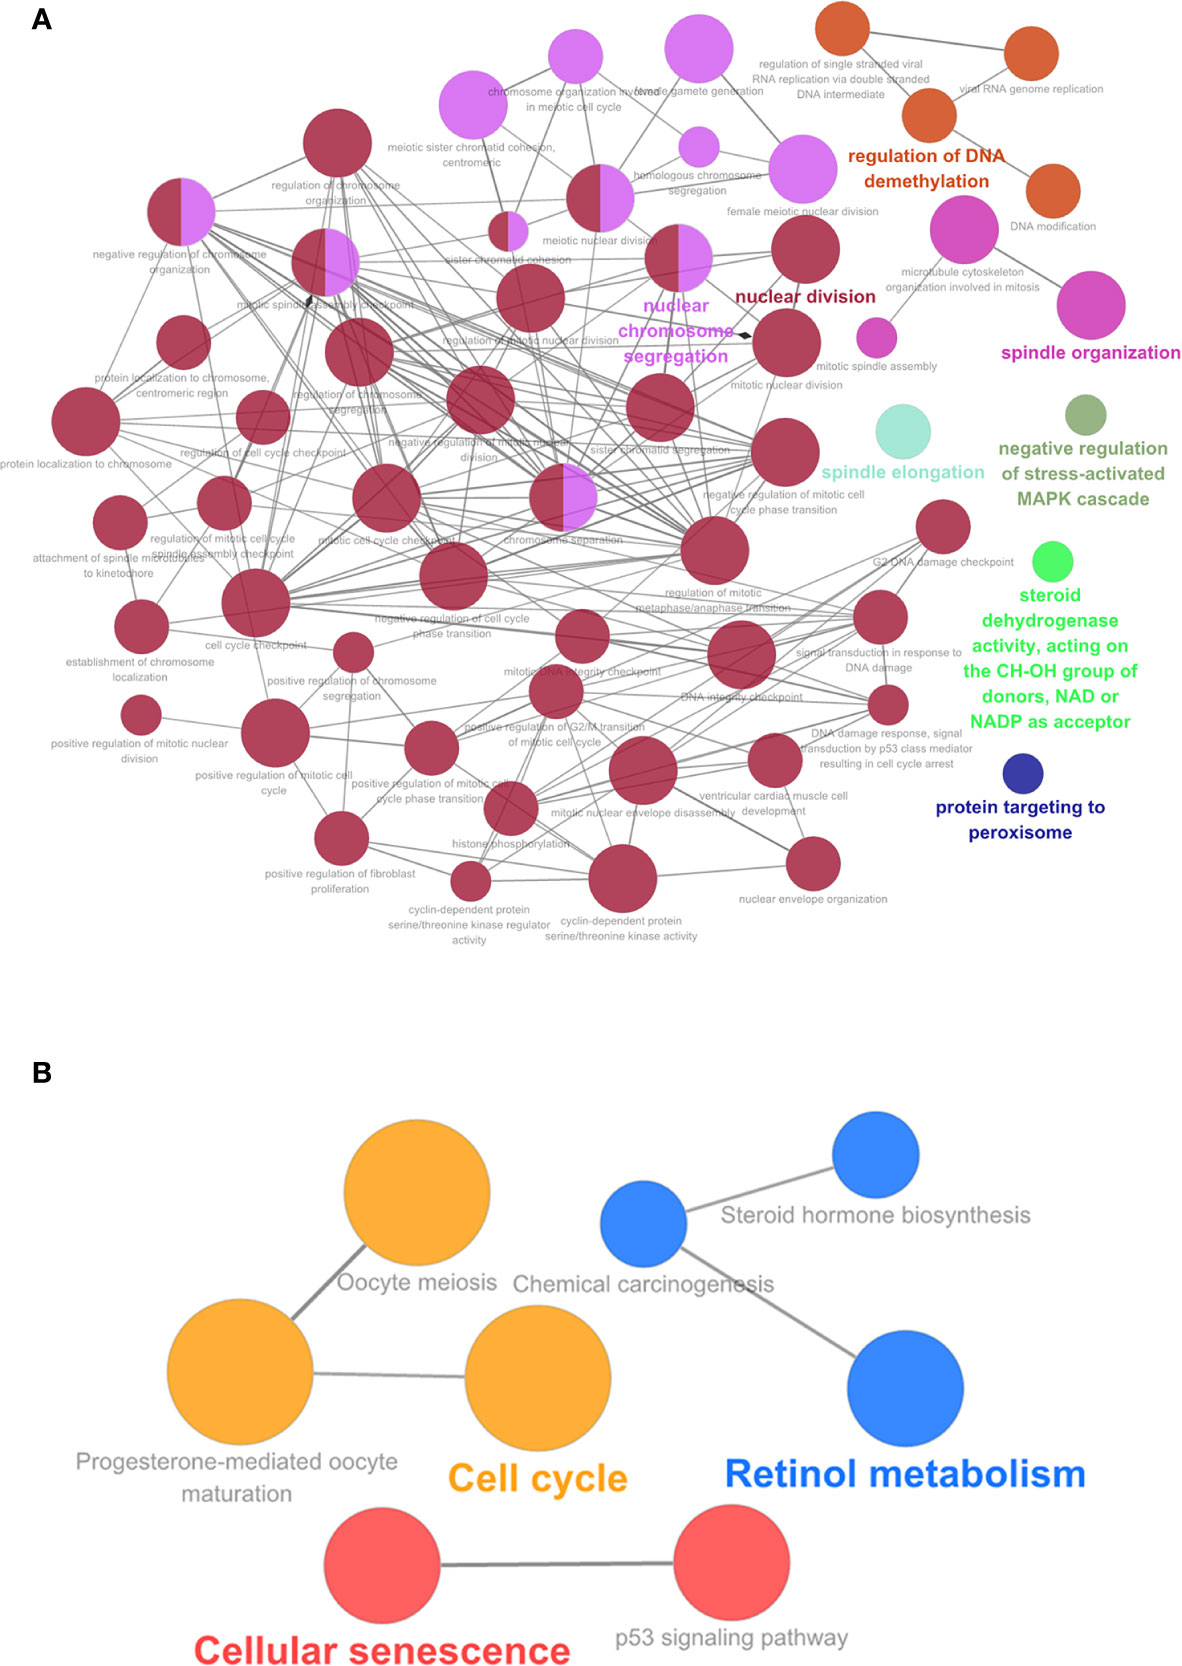
Figure 7 (A) GO analysis of the 114 hub genes. (B) KEGG pathway of the 114 hub genes, GO.
Construction and Validation of the HB Classification Method
The random forest method can calculate the importance of a single feature and screen the feature against the selected dataset. Therefore, we used the 114 hub genes as the feature, HB and normal as the variables, and the GSE131329 dataset as the training set to construct the model. The receiving operator curve (ROC) of the GES131329 training set is shown in Figure 8. The area under the curve was 0.955. The mean decrease accuracy (MDA) of the random forest model was positively correlated with the predictive variable, and the mean decrease Gini (MDG) is positively correlated with the most important variable (20). Therefore, 30 hub genes were established using MDA and MDG (Figure 8). Furthermore, a total of 35 core genes of HB were obtained by cross-comparison with InnateDB database (Supplementary Table 9). The random forest model was then validated using the independent GSE81928 dataset, which was also contained the 114 hub genes. The area under the ROC curve was 0.814 (Figure 8).
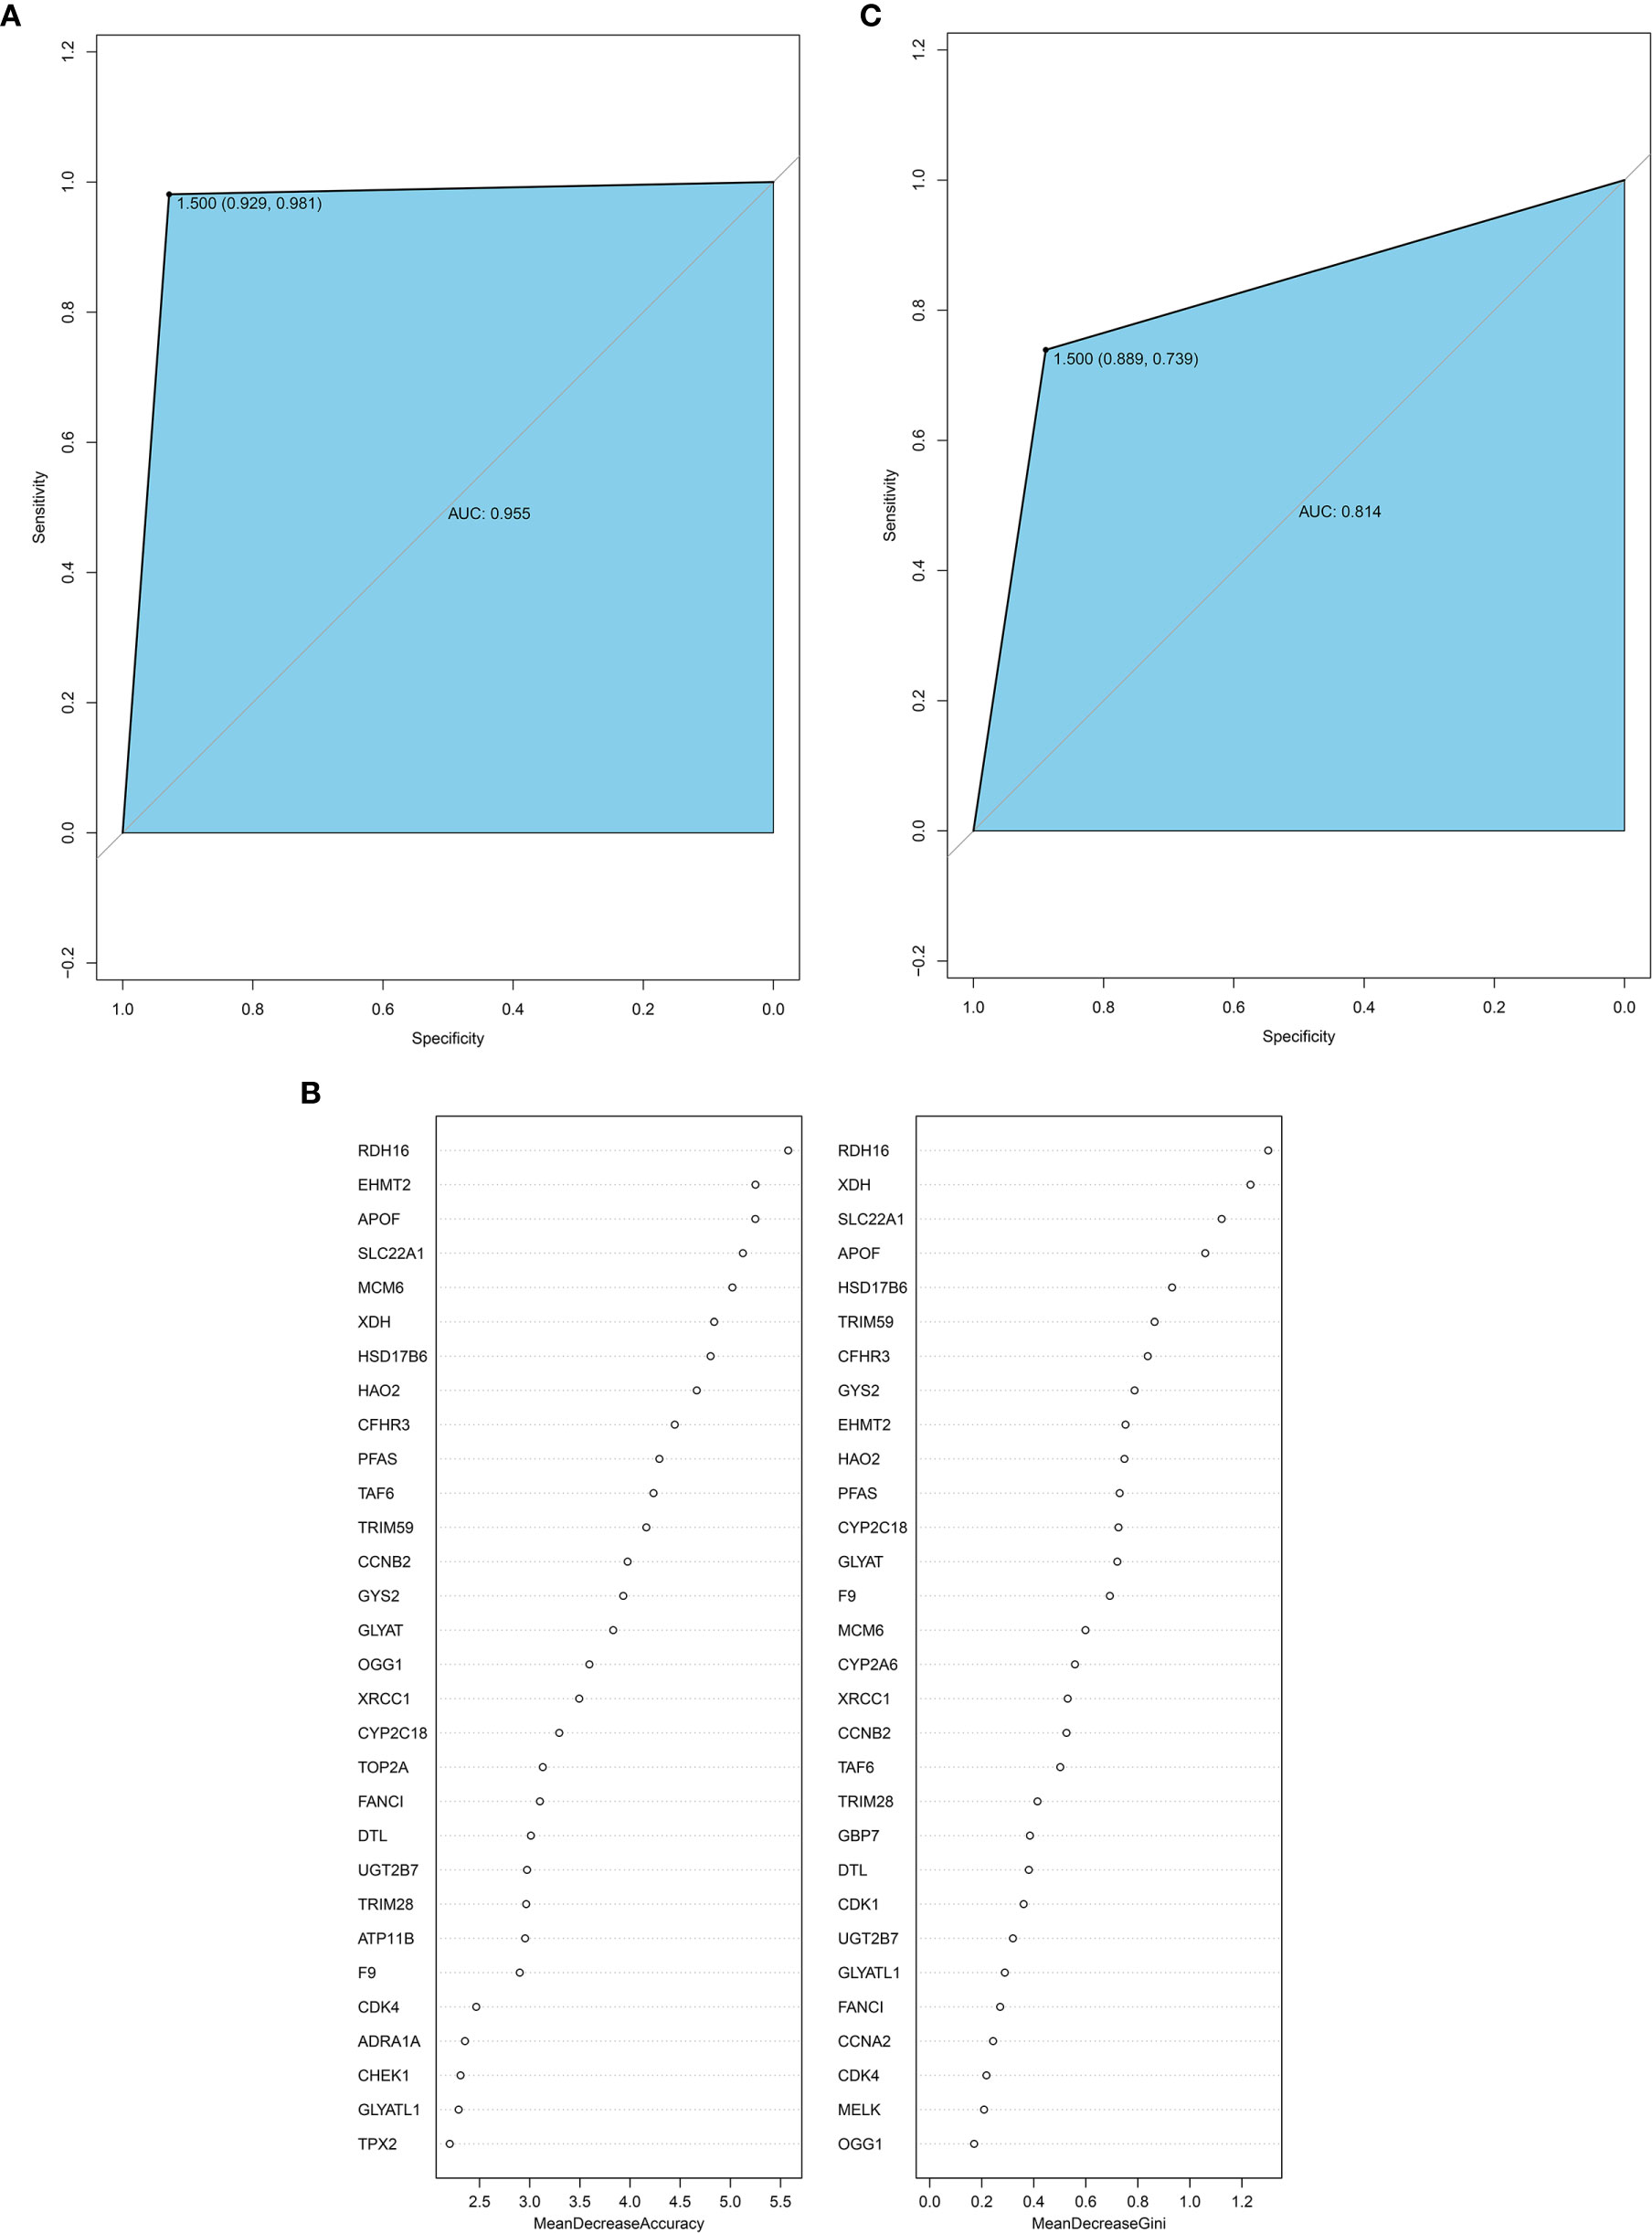
Figure 8 (A) ROC curve for the GSE131329 dataset; (B) 30 hub genes from the random forest classifier extracted through MDA and MDG; (C) ROC curve for the GSE81928 dataset. AUC, area under the curve; ROC, receiver operating characteristic; MDA, mean decrease accuracy; MDG, mean decrease Gini.
Validation of HB Biological Markers Through InnateDB Cross-Comparison
We selected the immune-related hub gene, containing 35 genes, as the HB innate immune core genes and compared it with the immune-related genes present in the InnateDB database. We obtained 10 core genes: CDK1, TOP2A, ADRA1A, FANCI, XRCC1, TPX2, CCNB2, CDK4, GLYATL1, and CFHR3. For nine genes at least one molecular interaction was annotated in the InnateDB database, except GLYATL1. These interactions were mainly protein-protein and DNA-protein, as shown in Supplementary Figures 1–9.
Discussion
In this study, we established for the first time a diagnosis classifier model based on the random tree method for HB using 114 hub genes. We also validated the classification efficiency of this model using an independent dataset. Consequently, this model may contribute to improving the diagnosis of HB. We also performed GO and KEGG analyses, revealing that the identified hub genes were mainly involved in the p53 pathway and cell cycle. We also identified 10 core genes by cross-referencing our analysis with the InnateDB database. Among the 10 core genes, the molecular interactions for 9 genes were annotated, which may provide new therapeutic targets.
Among the 10 identified core genes, CDK1 and CDK4 were previously reported to be associated with HB (21, 22). CDK1 and CDK4 both belong to the family of cyclin-dependent kinases (CDKs). CDK complexes are critical regulatory enzymes that drive the transition of different phases of the cell cycle and ensure successful cell division through their activity (23). Almost all malignant cells exhibit some features that derange the normal controls over the cell cycle (24). Therefore, various drugs targeting different CDKs have been developed and have been applied in the clinic over the past decades. CDK1 can bind to different cyclins and regulate all the steps required for cell division (25). For this reason, CDK1 is essential for mammalian cell proliferation (21) and is the only CDK that can initiate mitosis (26). CDK1 is a key determinant of mitotic progression and thus it is also a pivotal tumorigenic event. It has been reported that treatment with a CDK1 inhibitor could decrease tumor growth of HB and prolong the survival rate in an HB murine model (21). Therefore, CDK1 is considered an ideal target for HB treatment. CDK4 can mediate the transition from the G0 or G1 phase into the S phase of the cell cycle (27). The activity of CDK4 is primarily controlled by its association with D-type cyclins, with cyclin D1 being the best characterized. Kim et al. revealed that CDK4 and cyclin D1 were significantly overexpressed in HB tissues compared with normal tissues (22). They also suggested that CDK4 may be correlated with tumorigenesis, tumor recurrence, and metastasis of HB. Although there is still no available CDK4 inhibitor for HB, multiple selective CDK4 inhibitors targeting other types of cancer have been used in the clinic. The progression-free survival rate of patients with estrogen receptor-positive breast cancer can improve when CDK4/6 inhibitors are added to antiestrogen therapy (28). Therefore, the role of CDK4 in HB progression and treatment requires further studies.
The role of the other 8 core genes in HB has never been reported before. Among them, 6 genes have been reported to be associated with hepatocellular carcinoma (HCC). TOP2A was one of the top 20 genes with the highest degree of interaction in the PPI network complex. TOP2A encodes a DNA topoisomerase that controls and alters the topologic states of intertwined DNA during anaphase. Therefore, TOP2A is involved in chromosome condensation and chromatid separation (29). Overexpression of TOP2A is correlated with a more aggressive tumor phenotype, microvascular invasion, and early age onset of HCC (30). Moreover, TOP2A has also been a valuable prognostic marker for tumor advancements, recurrences, and predictors of poor survival in a variety of cancers, such as breast, ovarian, colon, and small cell lung cancer (29). ADRA1A encodes the alpha-1 adrenergic receptor subtype with catecholamines ligands (31), which is located on chromosome 8p (32). ADRA1A can stimulate the sympathetic nervous system to compete with some functions (33). It was reported by Chen et al. that the mean methylation level of the ADRA1A promoter region was significantly increased in HCC tissues compared with the normal tissues (32). They also demonstrated that the mean methylation levels of the ADRA1A gene in HCC samples were not only associated with clinical characteristics but could also discriminate between HCC tissues and adjacent normal tissues, thus being suitable as a diagnostic marker. XRCC1 is a DNA repair gene that plays a crucial role in maintaining genomic integrity and stability and in the pathogenesis and carcinogenesis of various type of cancer (34). XRCC1 is significantly correlated with the number of tumors, tumor size, and location, and is also an independent risk factor for the poor prognosis of HCC (34, 35). TPX2, a nuclear proliferation microtubule-associated protein, is essential for spindle formation and stabilizes spindle microtubules (36). The overexpression of TPX2 induces abnormal centrosome amplification and aneuploidy formation, leading to malignant transformation of cells (37). Multiple studies have shown that the expression levels of TPX2 were significantly upregulated in HCC tissues compared with the adjacent normal tissues (36–38). They also confirmed that TPX2 may improve the viability of HCC cells and inhibit cell apoptosis. However, knockdown of TPX2 expression or TPX2 inhibition could reduce the migration and invasion ability of HCC cells. CCNB2 was one of the top 20 genes with the highest degree of interaction in the PPI network complex. CCNB2 belongs to the B-type cyclin family and regulates the activity of CDKs by binding to them during the cell cycle (23). The overexpression of CCNB2 was positively correlated with tumor number, tumor size, tumor thrombus, and metastasis of HCC, which may contribute to the poor prognosis of HCC patients (39–41). However, CCNB2 knockdown could slow cell growth and promote apoptosis of HCC cells, indicating that CCNB2 may be a novel treatment marker (41). CFHR3, a member of the human factor H protein family, is a negative complement activation regulator, which is an essential component of the innate immune system (42). The expression level of CFHR3 in HCC tissues was lower than that in normal tissues (43). In addition, the expression level of the CFHR3 gene was the highest in the liver than in other organs (44). CFHR3 is correlated to the HCC stage. In addition, the overall survival of patients affected with HCC was significantly better when CFHR3 was highly expressed than when its expression was low (43, 44). Therefore, CFHR3 may be a novel prognostic biomarker for HCC. Although these 6 genes were never reported in the context of HB, our bioinformatics analysis suggests that they deserve further attention as potential targets in HB.
FANCI and GLYATL1 have never been reported in either HB or HCC. However, their abnormal expression has been found in other tumor types. FANCI has a key role in the Fanconi anemia DNA repair pathway, where it forms a heterodimer with FANCD2 and recruits DNA repair proteins to promote the interstrand cross-link DNA damage repair (45). Moreover, FANCI may promote cellular metabolism when it is not needed for DNA repair, according to a recent study (46). FANCI mRNA and protein were both found to be overexpressed in lung adenocarcinoma tumor tissues compared with adjacent normal tissues (47). It was demonstrated that the expression level of FANCI was positively associated with lymphatic metastasis and distant metastasis of lung adenocarcinoma tumor, whereas knockdown of FANCI decreased lung adenocarcinoma tumor cell proliferation and invasion in vitro. FANCI has also been reported to regulate breast cancer survival (48). These findings suggest that FANCI has a novel oncogenic role and may be useful as a prognostic biomarker and/or therapeutic target for different tumors. GLYATL1 belongs to the glycine-N-acyltransferase gene family and is normally expressed in the liver and kidney (49). GLYATL1 encodes an enzyme with phenylacetyl-CoA glutamine N-acyltransferase activity, which regulates mitochondrial ATP production, glycine availability, CoASH availability, and the detoxification of various organic acids (50). In a previous study, the expression of GLYATL1 was higher in localized prostate cancers than in benign prostatic tissue and metastatic prostate cancer (49, 51). This study also demonstrated that GLYATL1 may be associated with the grade of prostate cancer since the expression of GLYATL1 was significantly high in low-grade tumors. Therefore, GLYATL1 could be a potential early-stage biomarker. In addition, GLYATL was also found to be overexpressed in ER-negative compared to ER-positive breast cancer (52).
We also conducted GO enrichment and KEGG pathway analysis to identify pathways correlated with the hub genes. KEGG pathway analysis revealed that the largest number of genes were enriched in the cell cycle, including 13 hub genes. Most of them, including CDK1 (21), CDK4 (27), BUB1 (53), BUB1B (54), CCNA2 (55), CCNB1 (56), CCNB2 (39), CDC6 (57), MAD2L1 (58), MCM6 (59), and PLK1 (60) have been already reported to be associated with cell cycle-related proliferation and tumor differentiation. GO analysis further showed that hub genes are involved in different cell cycle-related processes, including mitotic nuclear division, cell division, chromosome separation, sister chromatid cohesion, microtubule cytoskeleton organization involved in mitosis, and DNA integrity checkpoint. Furthermore, GO enrichment and KEGG pathway analysis also demonstrated that the hub genes were associated with the p53 signaling pathway, a tumor suppression pathway through a variety of responses, including cell-cycle arrest, apoptosis, senescence, and DNA repair (61, 62), suggesting that the p53 signaling pathway is also involved in the cell cycle. It was reported that p53 gene mutations may contribute to the development of sporadic HB (63). Moreover, hepatic p53 expression could cause lysis of implanted hepatoblastoma cells in a chimeric mouse (64). Although p53 may play a crucial role in HB development, the specific mechanism needs further studies. Taken together, based on the GO and KEGG analyses, we suggest that targeting the cell cycle could be a potential strategy for HB therapy. Compared with the traditional clinical manifestations, imaging, AFP and other diagnostic methods, our study considered the underlying genetic dysregulations. Genes are more objective and stable; thus, they may not be beneficial for early diagnosis.
Conclusion
In the present study, we established a 114 genes random forest classifier for HB and identified 10 core genes. These 10 core genes are closely related to the progression and prognosis of cancers and thus are also potential therapeutic targets. Our classifier model and the identified core genes may give novel insight into the diagnosis and development of therapeutic options for HB.
Data Availability Statement
The datasets presented in this study can be found in online repositories. The names of the repository/repositories and accession number(s) can be found in the article/Supplementary Material.
Author Contributions
RS performed the data analyses and wrote the manuscript. SL, KZ, and MD contributed significantly to data analyses and manuscript revision. LL conceived and designed the study. All authors contributed to the article and approved the submitted version.
Funding
This study was supported by grants from the Special and Key Projects in the Pediatrics of Beijing Hospitals Authority and Pediatric Collaborative Development (No. XTZD20180302) and Fundamental Research Funds for the Central Universities (No. 3332019166).
Conflict of Interest
The authors declare that the research was conducted in the absence of any commercial or financial relationships that could be construed as a potential conflict of interest.
Acknowledgments
We thank those authors who provided us with the full text and relevant data from their studies.
Supplementary Material
The Supplementary Material for this article can be found online at: https://www.frontiersin.org/articles/10.3389/fonc.2021.591507/full#supplementary-material
References
1. Kremer N, Walther AE, Tiao GM. Management of hepatoblastoma: an update. Curr Opin Pediatr (2014) 26(3):362–9. doi: 10.1097/mop.0000000000000081
2. Meyers RL, Maibach R, Hiyama E, Häberle B, Krailo M, Rangaswami A, et al. Risk-stratified staging in paediatric hepatoblastoma: a unified analysis from the Children’s Hepatic tumors International Collaboration. Lancet Oncol (2017) 18(1):122–31. doi: 10.1016/s1470-2045(16)30598-8
3. Hooks KB, Audoux J, Fazli H, Lesjean S, Ernault T, Dugot-Senant N, et al. New insights into diagnosis and therapeutic options for proliferative hepatoblastoma. Hepatology (2018) 68(1):89–102. doi: 10.1002/hep.29672
4. Carrillo-Reixach J, Torrens L, Simon-Coma M, Royo L, Domingo-Sabat M, Abril-Fornaguera J, et al. Epigenetic footprint enables molecular risk stratification of hepatoblastoma with clinical implications. J Hepatol (2020) 73(2):328–37. doi: 10.1016/j.jhep.2020.03.025
5. Liu W, Chen S, Liu B. Diagnostic and prognostic values of serum exosomal microRNA-21 in children with hepatoblastoma: A Chinese population-based study. Pediatr Surg Int (2016) 32(11):1059–65. doi: 10.1007/s00383-016-3960-8
6. Liu L, Wang J, Sun G, Wu Q, Ma J, Zhang X, et al. m(6)A mRNA methylation regulates CTNNB1 to promote the proliferation of hepatoblastoma. Mol Cancer (2019) 18(1):188. doi: 10.1186/s12943-019-1119-7
7. Cui X, Wang Z, Liu L, Liu X, Zhang D, Li J, et al. The Long Non-coding RNA ZFAS1 Sponges miR-193a-3p to Modulate Hepatoblastoma Growth by Targeting RALY via HGF/c-Met Pathway. Front Cell Dev Biol (2019) 7:271. doi: 10.3389/fcell.2019.00271
8. Zhen N, Gu S, Ma J, Zhu J, Yin M, Xu M, et al. CircHMGCS1 Promotes Hepatoblastoma Cell Proliferation by Regulating the IGF Signaling Pathway and Glutaminolysis. Theranostics (2019) 9(3):900–19. doi: 10.7150/thno.29515
9. Dong R, Liu GB, Liu BH, Chen G, Li K, Zheng S, et al. Targeting long non-coding RNA-TUG1 inhibits tumor growth and angiogenesis in hepatoblastoma. Cell Death Dis (2016) 7(6):e2278. doi: 10.1038/cddis.2016.143
10. Valanejad L, Cast A, Wright M, Bissig KD, Karns R, Weirauch MT, et al. PARP1 activation increases expression of modified tumor suppressors and pathways underlying development of aggressive hepatoblastoma. Commun Biol (2018) 1:67. doi: 10.1038/s42003-018-0077-8
11. McCarthy DJ, Smyth GK. Testing significance relative to a fold-change threshold is a TREAT. Bioinformatics (2009) 25(6):765–71. doi: 10.1093/bioinformatics/btp053
12. Ji Z, He L, Rotem A, Janzer A, Cheng CS, Regev A, et al. Genome-scale identification of transcription factors that mediate an inflammatory network during breast cellular transformation. Nat Commun (2018) 9(1):2068. doi: 10.1038/s41467-018-04406-2
13. Liang Y, Zhang C, Dai DQ. Identification of differentially expressed genes regulated by methylation in colon cancer based on bioinformatics analysis. World J Gastroenterol (2019) 25(26):3392–407. doi: 10.3748/wjg.v25.i26.3392
14. Zhou Y, Yang L, Zhang X, Chen R, Chen X, Tang W, et al. Identification of Potential Biomarkers in Glioblastoma through Bioinformatic Analysis and Evaluating Their Prognostic Value. BioMed Res Int (2019) 2019:6581576. doi: 10.1155/2019/6581576
15. Langfelder P, Horvath S. WGCNA: An R package for weighted correlation network analysis. BMC Bioinf (2008) 9:559. doi: 10.1186/1471-2105-9-559
16. Kanehisa M, Goto S, Kawashima S, Nakaya A. The KEGG databases at GenomeNet. Nucleic Acids Res (2002) 30(1):42–6. doi: 10.1093/nar/30.1.42
17. Mlecnik B, Galon J, Bindea G. Comprehensive functional analysis of large lists of genes and proteins. J Proteomics (2018) 171:2–10. doi: 10.1016/j.jprot.2017.03.016
18. Speiser JL, Durkalski VL, Lee WM. Random forest classification of etiologies for an orphan disease. Stat Med (2015) 34(5):887–99. doi: 10.1002/sim.6351
19. Lynn DJ, Chan C, Naseer M, Yau M, Lo R, Sribnaia A, et al. Curating the innate immunity interactome. BMC Syst Biol (2010) 4:117. doi: 10.1186/1752-0509-4-117
20. Wang H, Yang F, Luo Z. An experimental study of the intrinsic stability of random forest variable importance measures. BMC Bioinf (2016) 17:60. doi: 10.1186/s12859-016-0900-5
21. Goga A, Yang D, Tward AD, Morgan DO, Bishop JM. Inhibition of CDK1 as a potential therapy for tumors over-expressing MYC. Nat Med (2007) 13(7):820–7. doi: 10.1038/nm1606
22. Kim H, Ham EK, Kim YI, Chi JG, Lee HS, Park SH, et al. Overexpression of cyclin D1 and cdk4 in tumorigenesis of sporadic hepatoblastomas. Cancer Lett (1998) 131(2):177–83. doi: 10.1016/s0304-3835(98)00151-7
23. Asghar U, Witkiewicz AK, Turner NC, Knudsen ES. The history and future of targeting cyclin-dependent kinases in cancer therapy. Nat Rev Drug Discovery (2015) 14(2):130–46. doi: 10.1038/nrd4504
24. Malumbres M, Barbacid M. To cycle or not to cycle: a critical decision in cancer. Nat Rev Cancer (2001) 1(3):222–31. doi: 10.1038/35106065
25. Xie B, Wang S, Jiang N, Li JJ. Cyclin B1/CDK1-regulated mitochondrial bioenergetics in cell cycle progression and tumor resistance. Cancer Lett (2019) 443:56–66. doi: 10.1016/j.canlet.2018.11.019
26. Santamaría D, Barrière C, Cerqueira A, Hunt S, Tardy C, Newton K, et al. Cdk1 is sufficient to drive the mammalian cell cycle. Nature (2007) 448(7155):811–5. doi: 10.1038/nature06046
27. O’Leary B, Finn RS, Turner NC. Treating cancer with selective CDK4/6 inhibitors. Nat Rev Clin Oncol (2016) 13(7):417–30. doi: 10.1038/nrclinonc.2016.26
28. Goel S, DeCristo MJ, McAllister SS, Zhao JJ. CDK4/6 Inhibition in Cancer: Beyond Cell Cycle Arrest. Trends Cell Biol (2018) 28(11):911–25. doi: 10.1016/j.tcb.2018.07.002
29. Jain M, Zhang L, He M, Zhang YQ, Shen M, Kebebew E. TOP2A is overexpressed and is a therapeutic target for adrenocortical carcinoma. Endocr Relat Cancer (2013) 20(3):361–70. doi: 10.1530/erc-12-0403
30. Wong N, Yeo W, Wong WL, Wong NL, Chan KY, Mo FK, et al. TOP2A overexpression in hepatocellular carcinoma correlates with early age onset, shorter patients survival and chemoresistance. Int J Cancer (2009) 124(3):644–52. doi: 10.1002/ijc.23968
31. Chen G, Fan X, Li Y, He L, Wang S, Dai Y, et al. Promoter aberrant methylation status of ADRA1A is associated with hepatocellular carcinoma. Epigenetics (2020) 15(6-7):684–701. doi: 10.1080/15592294.2019.1709267
32. Loo SK, Fisher SE, Francks C, Ogdie MN, MacPhie IL, Yang M, et al. Genome-wide scan of reading ability in affected sibling pairs with attention-deficit/hyperactivity disorder: unique and shared genetic effects. Mol Psychiatry (2004) 9(5):485–93. doi: 10.1038/sj.mp.4001450
33. Peng L, Peng W, Hu P, Zhang HF. Clinical significance of expression levels of serum ADRA1A in hysterocarcinoma patients. Oncol Lett (2018) 15(6):9162–6. doi: 10.3892/ol.2018.8465
34. Guan Q, Chen Z, Chen Q, Zhi X. XRCC1 and XPD polymorphisms and their relation to the clinical course in hepatocarcinoma patients. Oncol Lett (2017) 14(3):2783–8. doi: 10.3892/ol.2017.6522
35. Xiong Y, Zhang Q, Ye J, Pan S, Ge L. Associations between three XRCC1 polymorphisms and hepatocellular carcinoma risk: A meta-analysis of case-control studies. PloS One (2018) 13(11):e0206853. doi: 10.1371/journal.pone.0206853
36. Huang DH, Jian J, Li S, Zhang Y, Liu LZ. TPX2 silencing exerts anti−tumor effects on hepatocellular carcinoma by regulating the PI3K/AKT signaling pathway. Int J Mol Med (2019) 44(6):2113–22. doi: 10.3892/ijmm.2019.4371
37. Liang B, Jia C, Huang Y, He H, Li J, Liao H, et al. TPX2 Level Correlates with Hepatocellular Carcinoma Cell Proliferation, Apoptosis, and EMT. Dig Dis Sci (2015) 60(8):2360–72. doi: 10.1007/s10620-015-3730-9
38. Liu Q, Tu K, Zhang H, Zheng X, Yao Y, Liu Q. TPX2 as a novel prognostic biomarker for hepatocellular carcinoma. Hepatol Res (2015) 45(8):906–18. doi: 10.1111/hepr.12428
39. Gao CL, Wang GW, Yang GQ, Yang H, Zhuang L. Karyopherin subunit-α 2 expression accelerates cell cycle progression by upregulating CCNB2 and CDK1 in hepatocellular carcinoma. Oncol Lett (2018) 15(3):2815–20. doi: 10.3892/ol.2017.7691
40. Gao X, Wang X, Zhang S. Bioinformatics identification of crucial genes and pathways associated with hepatocellular carcinoma. Biosci Rep (2018) 38(6). doi: 10.1042/bsr20181441
41. Li R, Jiang X, Zhang Y, Wang S, Chen X, Yu X, et al. Cyclin B2 Overexpression in Human Hepatocellular Carcinoma is Associated with Poor Prognosis. Arch Med Res (2019) 50(1):10–7. doi: 10.1016/j.arcmed.2019.03.003
42. Pouw RB, Gómez Delgado I, López Lera A, Rodríguez de Córdoba S, Wouters D, Kuijpers TW, et al. High Complement Factor H-Related (FHR)-3 Levels Are Associated With the Atypical Hemolytic-Uremic Syndrome-Risk Allele CFHR3*B. Front Immunol (2018) 9:848. doi: 10.3389/fimmu.2018.00848
43. Liu J, Li W, Zhao H. CFHR3 is a potential novel biomarker for hepatocellular carcinoma. J Cell Biochem (2020) 121(4):2970–80. doi: 10.1002/jcb.29551
44. Liu H, Zhang L, Wang P. Complement factor H−related 3 overexpression affects hepatocellular carcinoma proliferation and apoptosis. Mol Med Rep (2019) 20(3):2694–702. doi: 10.3892/mmr.2019.10514
45. Nalepa G, Clapp DW. Fanconi anaemia and cancer: an intricate relationship. Nat Rev Cancer (2018) 18(3):168–85. doi: 10.1038/nrc.2017.116
46. Sondalle SB, Longerich S, Ogawa LM, Sung P, Baserga SJ. Fanconi anemia protein FANCI functions in ribosome biogenesis. Proc Natl Acad Sci USA (2019) 116(7):2561–70. doi: 10.1073/pnas.1811557116
47. Zheng P, Li L. FANCI Cooperates with IMPDH2 to Promote Lung Adenocarcinoma Tumor Growth via a MEK/ERK/MMPs Pathway. Onco Targets Ther (2020) 13:451–63. doi: 10.2147/ott.S230333
48. Hu WF, Krieger KL, Lagundžin D, Li X, Cheung RS, Taniguchi T, et al. CTDP1 regulates breast cancer survival and DNA repair through BRCT-specific interactions with FANCI. Cell Death Discovery (2019) 5:105. doi: 10.1038/s41420-019-0185-3
49. Eich ML, Chandrashekar DS, Rodriguez Pen AM, Robinson AD, Siddiqui J, Daignault-Newton S, et al. Characterization of glycine-N-acyltransferase like 1 (GLYATL1) in prostate cancer. Prostate (2019) 79(14):1629–39. doi: 10.1002/pros.23887
50. van der Sluis R, Badenhorst CP, Erasmus E, van Dyk E, van der Westhuizen FH, van Dijk AA. Conservation of the coding regions of the glycine N-acyltransferase gene further suggests that glycine conjugation is an essential detoxification pathway. Gene (2015) 571(1):126–34. doi: 10.1016/j.gene.2015.06.081
51. Nalla AK, Williams TF, Collins CP, Rae DT, Trobridge GD. Lentiviral vector-mediated insertional mutagenesis screen identifies genes that influence androgen independent prostate cancer progression and predict clinical outcome. Mol Carcinog (2016) 55(11):1761–71. doi: 10.1002/mc.22425
52. Wang J, Shidfar A, Ivancic D, Ranjan M, Liu L, Choi MR, et al. Overexpression of lipid metabolism genes and PBX1 in the contralateral breasts of women with estrogen receptor-negative breast cancer. Int J Cancer (2017) 140(11):2484–97. doi: 10.1002/ijc.30680
53. Mur P, De Voer RM, Olivera-Salguero R, Rodríguez-Perales S, Pons T, Setién F, et al. Germline mutations in the spindle assembly checkpoint genes BUB1 and BUB3 are infrequent in familial colorectal cancer and polyposis. Mol Cancer (2018) 17(1):23. doi: 10.1186/s12943-018-0762-8
54. Ding Y, Hubert CG, Herman J, Corrin P, Toledo CM, Skutt-Kakaria K, et al. Cancer-Specific requirement for BUB1B/BUBR1 in human brain tumor isolates and genetically transformed cells. Cancer Discovery (2013) 3(2):198–211. doi: 10.1158/2159-8290.Cd-12-0353
55. Li J, Ying Y, Xie H, Jin K, Yan H, Wang S, et al. Dual regulatory role of CCNA2 in modulating CDK6 and MET-mediated cell-cycle pathway and EMT progression is blocked by miR-381-3p in bladder cancer. FASEB J (2019) 33(1):1374–88. doi: 10.1096/fj.201800667R
56. Zhang H, Zhang X, Li X, Meng WB, Bai ZT, Rui SZ, et al. Effect of CCNB1 silencing on cell cycle, senescence, and apoptosis through the p53 signaling pathway in pancreatic cancer. J Cell Physiol (2018) 234(1):619–31. doi: 10.1002/jcp.26816
57. Jiang W, Yu Y, Liu J, Zhao Q, Wang J, Zhang J, et al. Downregulation of Cdc6 inhibits tumorigenesis of osteosarcoma in vivo and in vitro. BioMed Pharmacother (2019) 115:108949. doi: 10.1016/j.biopha.2019.108949
58. Wang Y, Wang F, He J, Du J, Zhang H, Shi H, et al. miR-30a-3p Targets MAD2L1 and Regulates Proliferation of Gastric Cancer Cells. Onco Targets Ther (2019) 12:11313–24. doi: 10.2147/ott.S222854
59. Liu Z, Li J, Chen J, Shan Q, Dai H, Xie H, et al. MCM family in HCC: MCM6 indicates adverse tumor features and poor outcomes and promotes S/G2 cell cycle progression. BMC Cancer (2018) 18(1):200. doi: 10.1186/s12885-018-4056-8
60. Merrick DT, Edwards MG, Franklin WA, Sugita M, Keith RL, Miller YE, et al. Altered Cell-Cycle Control, Inflammation, and Adhesion in High-Risk Persistent Bronchial Dysplasia. Cancer Res (2018) 78(17):4971–83. doi: 10.1158/0008-5472.Can-17-3822
61. Duffy MJ, Synnott NC, Crown J. Mutant p53 as a target for cancer treatment. Eur J Cancer (2017) 83:258–65. doi: 10.1016/j.ejca.2017.06.023
62. Wang X, Simpson ER, Brown KA. p53: Protection against Tumor Growth beyond Effects on Cell Cycle and Apoptosis. Cancer Res (2015) 75(23):5001–7. doi: 10.1158/0008-5472.Can-15-0563
63. Curia MC, Zuckermann M, De Lellis L, Catalano T, Lattanzio R, Aceto G, et al. Sporadic childhood hepatoblastomas show activation of beta-catenin, mismatch repair defects and p53 mutations. Mod Pathol (2008) 21(1):7–14. doi: 10.1038/modpathol.3800977
Keywords: hepatoblastoma, gene expression omnibus, random forest classifier, nomogram, diagnosis
Citation: Sun R, Li S, Zhao K, Diao M and Li L (2021) Identification of Ten Core Hub Genes as Potential Biomarkers and Treatment Target for Hepatoblastoma. Front. Oncol. 11:591507. doi: 10.3389/fonc.2021.591507
Received: 04 August 2020; Accepted: 25 February 2021;
Published: 01 April 2021.
Edited by:
Jing He, Guangzhou Medical University, ChinaReviewed by:
Xiaoxi Meng, University of Minnesota Twin Cities, United StatesXiao Han, Fuzhou University, China
Wenlong Ren, Nantong University, China
Copyright © 2021 Sun, Li, Zhao, Diao and Li. This is an open-access article distributed under the terms of the Creative Commons Attribution License (CC BY). The use, distribution or reproduction in other forums is permitted, provided the original author(s) and the copyright owner(s) are credited and that the original publication in this journal is cited, in accordance with accepted academic practice. No use, distribution or reproduction is permitted which does not comply with these terms.
*Correspondence: Long Li, bGlsb25nX3BlZGlhdHJpY0AxNjMuY29t