 Zifeng Li1†
 Hongsheng Wang1†
 Rui Dong2Jie Man1
 Li Sun3
 Xiaowen Qian1
 Xiaohua Zhu1Ping Cao1
 Yi Yu1Jun Le1Yang Fu1
 Ping Wang1Wenjin Jiang1Chen Shen1Yangyang Ma4Lian Chen4Yaochen Xu5
 Jiantao Shi5
 Hui Zhang6
 Maoxiang Qian7*
 Xiaowen Zhai1*
- 1Department of Hematology and Oncology, Children’s Hospital of Fudan University, National Children's Medical Center, Shanghai, China
- 2Department of Pediatric Surgery, Children’s Hospital of Fudan University, National Children's Medical Center, Shanghai, China
- 3Department of Rheumatism and Immunology, Children’s Hospital of Fudan University, National Children's Medical Center, Shanghai, China
- 4Department of Pathology, Children’s Hospital of Fudan University, National Children's Medical Center, Shanghai, China
- 5Shanghai Institute of Biochemistry and Cell Biology, Center for Excellence in Molecular Cell Science, Chinese Academy of Sciences, Shanghai, China
- 6Department of Hematology/Oncology, Guangzhou Women and Children’s Medical Center, Guangzhou, China
- 7Institute of Pediatrics, Children’s Hospital of Fudan University, National Children's Medical Center, and the Shanghai Key Laboratory of Medical Epigenetics, Institutes of Biomedical Sciences, Fudan University, Shanghai, China
Background: Subcutaneous panniculitis-like T-cell lymphoma (SPTCL) is a malignant primary T-cell lymphoma that is challenging to distinguish from autoimmune disorders and reactive panniculitides. Delay in diagnosis and a high misdiagnosis rate affect the prognosis and survival of patients. The difficulty of diagnosis is mainly due to an incomplete understanding of disease pathogenesis.
Methods: We performed single-cell RNA sequencing of matched subcutaneous lesion tissue, peripheral blood, and bone marrow from a patient with SPTCL, as well as peripheral blood, bone marrow, lymph node, and lung tissue samples from healthy donors as normal controls. We conducted cell clustering, gene expression program identification, gene differential expression analysis, and cell-cell interaction analysis to investigate the ecosystem of SPTCL.
Results: Based on gene expression profiles in a single-cell resolution, we identified and characterized the malignant cells and immune subsets from a patient with SPTCL. Our analysis showed that SPTCL malignant cells expressed a distinct gene signature, including chemokines families, cytotoxic proteins, T cell immune checkpoint molecules, and the immunoglobulin family. By comparing with normal T cells, we identified potential novel markers for SPTCL (e.g., CYTOR, CXCL13, VCAM1, and TIMD4) specifically differentially expressed in the malignant cells. We also found that macrophages and fibroblasts dominated the cell-cell communication landscape with the SPTCL malignant cells.
Conclusions: This work offers insight into the heterogeneity of subcutaneous panniculitis-like T-cell lymphoma, providing a better understanding of the transcription characteristics and immune microenvironment of this rare tumor.
Introduction
Subcutaneous panniculitis-like T-cell lymphoma (SPTCL) is a rare primary cutaneous lymphoma of mature cytotoxic T cells arising primarily in the skin without the evidence of extracutaneous involvement. According to the 2016 World Health Organization (WHO) and 2018 World Health Organization-European Organization for Research and Treatment of Cancer (WHO-EORTC) classification, SPTCL is defined as subcutaneous lymphomas with an α/β T cell phenotype and neoplastic T cells expressing CD3, CD8, and cytotoxic proteins (GZMB, TIA-1, perforin) (1, 2). Both children (3) and adults can be affected, with a median age at diagnosis of 36 years and female gender bias (4). In a cohort of pediatric patients (3), the median age at diagnosis was 8 years (5 months to 21 years) with a male to female ratio of 1:1.7. The disease response to therapy is usually favorable, with a 5-year survival of more than 80% (5).
However, the clinical manifestations and pathological features of SPTCL are similar to those of benign panniculitis, lupus erythematosus profundus (LEP), and various autoimmune disorders, thus SPTCL is frequently misdiagnosed at the early stage (6). The long diagnosis period and high misdiagnosis rate may affect the prognosis and survival of patients. Although recent studies have provided insight into pathways that may be important to the pathogenesis of this disease (5, 7–11), additional investigations are required to better understand the profile and ecosystem of SPTCL.
Here, we conducted single-cell RNA sequencing (scRNA-seq) to decipher SPTCL at an unprecedented transcriptomic resolution for matched subcutaneous lesion tissue, peripheral blood, and bone marrow from a patient with SPTCL, as well as peripheral blood, bone marrow, lymph node, and lung tissue samples from healthy donors as normal controls. Using this dataset, we investigated the ecosystem of SPTCL and identified novel markers of SPTCL that may advance the detection and diagnosis of this disease.
Methods
Patient
A male patient diagnosed with SPTCL was recruited from the Children’s Hospital of Fudan University in the Department of Hematology and Oncology. At the time of sample collection, the patient was 22 months old with SPTCL.
This study was approved by the Medical Ethics Committee of the Children’s Hospital of Fudan University institutional review board and conducted under the Declaration of Helsinki principles (approval reference: No (2020). 307). Informed written consent was obtained from the parents before inclusion in the study.
Healthy Donors
Healthy donors’ datasets were downloaded from the Gene Expression Omnibus (GEO, accession number: GSE126030) (12). The samples were obtained from deceased, brain-dead donors at the time of organ acquisition for clinical transplantation. Donors were free of chronic disease, cancer, and chronic infections such as Hepatitis B, C, and HIV. The mononuclear cells were isolated from human lungs (LG), lymph nodes (LN), bone marrow (BM), and blood, and the untouched CD3+ T cells were enriched from single-cell suspensions of all tissues and blood using magnetic negative selection (MojoSort Human CD3+ T cell Isolation Kit; BioLegend) (12).
Single-Cell RNA Sequencing
Experimental procedures followed established techniques using the Chromium Single Cell 3’ Library V3 kit (10x Genomics). Briefly, mononuclear cells from enzymatically digested subcutaneous lesion biopsies and bone marrow, as well as peripheral blood by density gradient centrifugation using Lymphocyte Separation Medium, were loaded into the Chromium instrument (10X Genomics), and the resulting barcoded cDNAs were used to construct libraries. RNA-seq was performed on each sample (approximately 200 million reads/sample). Raw sequence data were converted into FASTQs using the Illumina bcl2fastq software. FASTQ files were aligned to the human genome (GRCh38) using the CellRanger v3.0.1 (10x Genomics) pipeline according to the manufacturer’s instructions.
Single-Cell Data Processing and Analysis
Initial data processing of scRNA-seq for peripheral blood (n = 6,463), bone marrow (n = 11,027), and subcutaneous lesion tissue (n = 19,247) from the patient were performed using Python 3.6 and the Single Cell Analysis in Python (Scanpy) (v1.4.6) (13) unless otherwise stated. Healthy donors’ scRNA-seq data were also processed in the same way. Individual cells were filtered based on the total number of genes expressed and the percentage of mitochondrial reads. The cells were included with genes greater than 200 but less than 6,000, and the percentage of mitochondrial reads less than 10%. Genes detected in fewer than three cells were filtered out. Read counts of qualified cells were normalized using the deconvolution method implemented in the R package Scran (v3.11) (14) and in-transformed.
Single-Sample Analysis
For visualization, a UMAP was calculated by computing the single-cell neighborhood graph (kNN-graph) on the specific principal components using 15 neighbors. The number of principal components utilized in the neighborhood graph was based on the standard deviations of the top 30 principal components. The Leiden graph-clustering method was used to cluster the neighborhood graph of cells.
Cell types were manually assigned to the clusters from the Leiden graph-clustering by comparing the mean expression of known markers across cells in a cluster. Markers used to type cells included CD19, MS4A1, CD79A (B cells), CD2, CD3, CD4, CD8 (T cells), CCR7, IL7R, LEF1, SELL (naive T cells), CD44, CXCR3 (memory T cells), IL2RA, FOXP3, IKZF2 (Tregs), CXCR5, BCL6, KLRB1, CCR4, TBX21, GATA3 (Th cells), NCAM1, NKG7 (NK cells), CD14, FCGR3A, ITGAM, CD68, ITGB2, ADGRE1, LYZ (macrophages), IRF8, CLEC4C (dendritic cells), DPP4, TAGLN, COL1A1, PDGFRA (fibroblasts), and CD34 (progenitor).
A consensus non-negative matrix factorization (cNMF) algorithm (15) was employed to identified gene expression programs (GEPs) following the protocol on Github https://github.com/dylkot/cNMF. The GEPs obtained were subjected to Gene Ontology (GO) and KEGG analysis using the R package clusterProfiler (v3.11) (16).
Integration Sample Analysis
We combined the data generated from isolated cells with CD3 and CD8 positive from peripheral blood (n= 1,812), bone marrow (n=1,143), and subcutaneous lesion tissue (n=5,956) of the patient, and healthy donors (n=13,494) to conduct integration analysis. The Scanorama algorithm (17) was applied to correct the combined dataset for technical batch effects. All reduced dimensions were the same as that in the single-sample analysis. Partition-based graph abstraction (PAGA) was calculated by Scanpy.
The top 100 correlated genes were defined as a GEP, and their average relative expression was calculated as a GEP cell score (18). The reference set was randomly sampled from the gene pool for each binned expression value. The number of reference genes to be sampled from each bin was 100.
The Wilcoxon rank-sum test was used to estimate and identify differentially expressed genes. The novel markers utilized a default threshold of 2 for average fold change and a filter for the minimum delta percent of cells ([X (percentage of cluster1) – X (percentage of cluster2)]/X (percentage of cluster1) * 100) greater than 90%.
InferCNV Analysis
Raw gene expression data were extracted from the Scanpy object as recommended in the “Using 10x data” section (inferCNV of the Trinity CTAT Project, https://github.com/broadinstitute/inferCNV). Normal reference cells were identified from annotated Leiden clusters as naïve T cells. Tumor cells were identified as malignant-like cells in Leiden clusters. The inferCNV analysis was performed following the tutorial (https://github.com/broadinstitute/inferCNV/wiki) with parameters including default settings.
Cell-Cell Ligand-Receptor Interactions
Cell-cell ligand-receptor interactions were inferred using the CellPhoneDB (v2.0.0) method in Python (19). The lower cutoff for the expression proportion of any ligand or receptor in a given cell type was set to 10%, and the number of permutations was set to 1000.
Whole-Exome Sequencing and Analysis
DNA was extracted from paraffin-embedded (FFPE) SPTCL tissue for whole-exome sequencing (WES). The Agilent SureSelect Human All Exon V6 kit was used for exome capture and library preparation. Paired-end sequencing (2 x 150 bp read length) was performed using the Illumina NovaSeq platform. Reads were mapped to the human genome (GRCh37) reference sequence by the Burrows-Wheeler aligner (bwa mem) algorithm (version 0.7.17) (20). The data processing, including indel realignment, marking duplicates, and recalibrating base quality scores, were performed according to the GATK best practices using GATK (version 3.7) (21) and Picard tools (version 2.18.25, http://broadinstitute.github.io/picard). Variants in the HAVCR2 gene were manually checked using the Integrative Genomics Viewer (IGV) with the bam file (22).
H&E and Immunohistochemistry Staining
The formalin-fixed and paraffin-embedded tissue was cut into 4-μm thick sections and affixed onto the slides. The slides were subjected to H&E staining and immunohistochemistry. After being deparaffinized and rehydrated, the antigens were retrieved in boiled Tris-EDTA (pH 9.0) buffer for 15 min, cooled off for 1 h in the fume hood, and then blocked according to the protocol of the DAB polymer detection kit (Gene Tech, Shanghai, China) for 10 min. The slides were incubated with primary antibody in 1% bovine serum albumin (BSA)/tris-base solution buffer at 4°C overnight. The next day, the slides were incubated with the secondary antibody and developed with DAB reagent according to the protocol of the DAB polymer detection kit (Gene Tech). Finally, the slides were counterstained with hematoxylin. Anti-CD3 antibody (Catalog Number : AR0042, Talent Biomedical, 1:500), anti-CD4 antibody (Catalog Number : AR0273, Talent Biomedical, 1:500), anti-CD8 antibody (Catalog Number : AM0063, Talent Biomedical, 1:500), anti-TIA-1 antibody (Catalog Number : AM0226, Talent Biomedical, 1:500), anti-Granzyme B antibody (Catalog Number : AM0308, Talent Biomedical, 1:500), anti-Perforin antibody (Catalog Number : AM0311, Talent Biomedical, 1:500), anti-Ki67 antibody (Catalog Number : AR0248, Talent Biomedical, 1:500), anti-CXCL13 (Catalog Number:10927-1-AP, Proteintech, 1:500), anti-TIMD4 (Catalog Number:12008-1-AP, Proteintech, 1:500), and anti-VCAM1 (Catalog Number:11444-1-AP, Proteintech, 1:400) were used.
Results
Clinical Characteristics of the Studied Patient With SPTCL
The clinical manifestations of the studied patient with SPTCL are summarized in Table 1. The initial disease onset of this male patient was at six months old, diagnosed with a small hard nodule (diameter: 1 cm) in the left clavicle and enlarged lymph nodes in the groin. When he was 12 months old after a measles vaccination, the initial nodule was significantly enlarged (diameter: 6 cm) with enlarged lymph nodes in the head of the pancreas and did not decrease significantly after antibiotic treatment, puncture, and drainage. At the age of 18 months, the disease progressed with multiple lesions at the root of the patient’s right thigh (diameter: 5 cm) accompanied by fever and then at the left hip (diameter: 3 cm) after anti-inflammatory treatment for controlling body temperature. Four months later (22 months old), the patient progressed with a new single lesion at the right shoulder (diameter: 2 cm) with no fever but enlarged lymph nodes in the neck, underarms, mediastinum, and groin. Subcutaneous lesions were more common in the extremities and partly in the trunk. The lesions varied from 1 cm to 6 cm in diameter, with redness and swelling. No ulcerated plaque was observed. Multiple lymphadenopathies were proven by computerized tomography (CT) scans without hepatomegaly. The patient did not receive any chemotherapy but was followed up according to his parents’ decision.
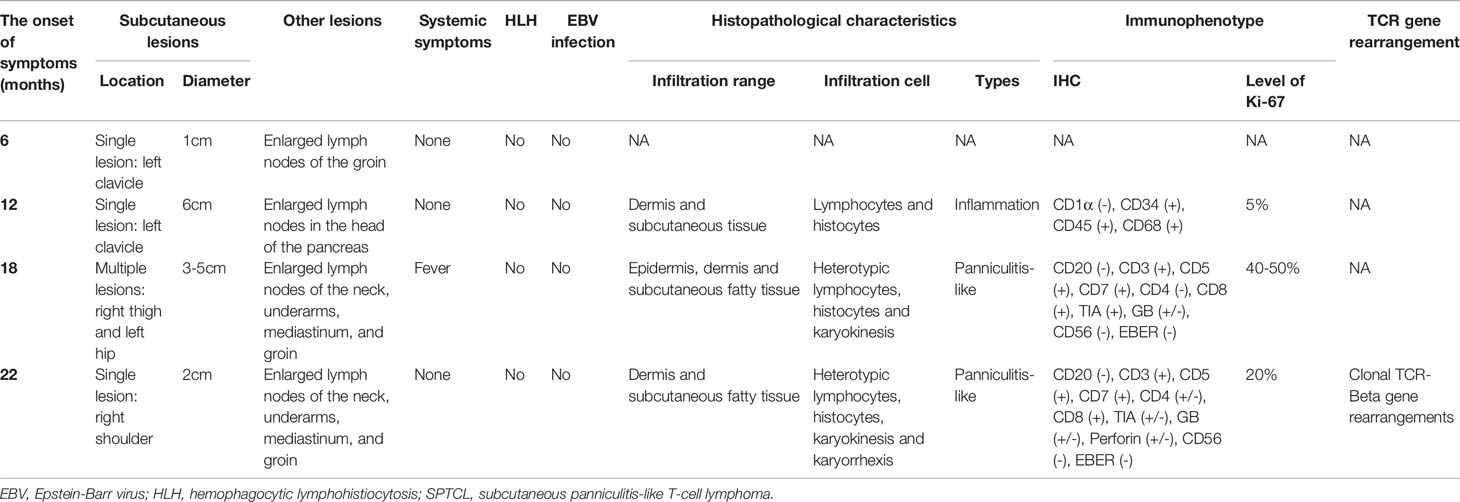
Table 1 The clinical characteristics of multiple episodes in the patient with SPTCL analyzed in this study.
Histopathological, immunophenotypical, and molecular features of the patient samples are also summarized in Table 1. All skin biopsy specimens demonstrated a dense lymphoid infiltrate located in the subcutaneous tissue, with the overlying epidermis and dermis involved. Atypical lymphocytes were pleomorphic small to medium-sized to diffusely large T cells with irregular hyperchromatic nuclei and were admixed with small lymphocytes and histiocytes, which were found in both biopsy specimens at 18 and 22 months old. Areas of karyokinesis and karyorrhexis were seen. These atypical lymphocytes showed a CD3+, CD4–, CD8+, Granzyme B+, Perforin+, and TIA1+ phenotype (Figure 1) with a high proliferation rate. Epstein-Barr virus (EBV) detection by EBV-encoded RNA (EBER) in situ hybridization was negative. Clonal rearrangement of the TCR beta gene was found in the biopsy at 22 months old. In all episodes, bone marrow examination showed no evidence of lymphoma.
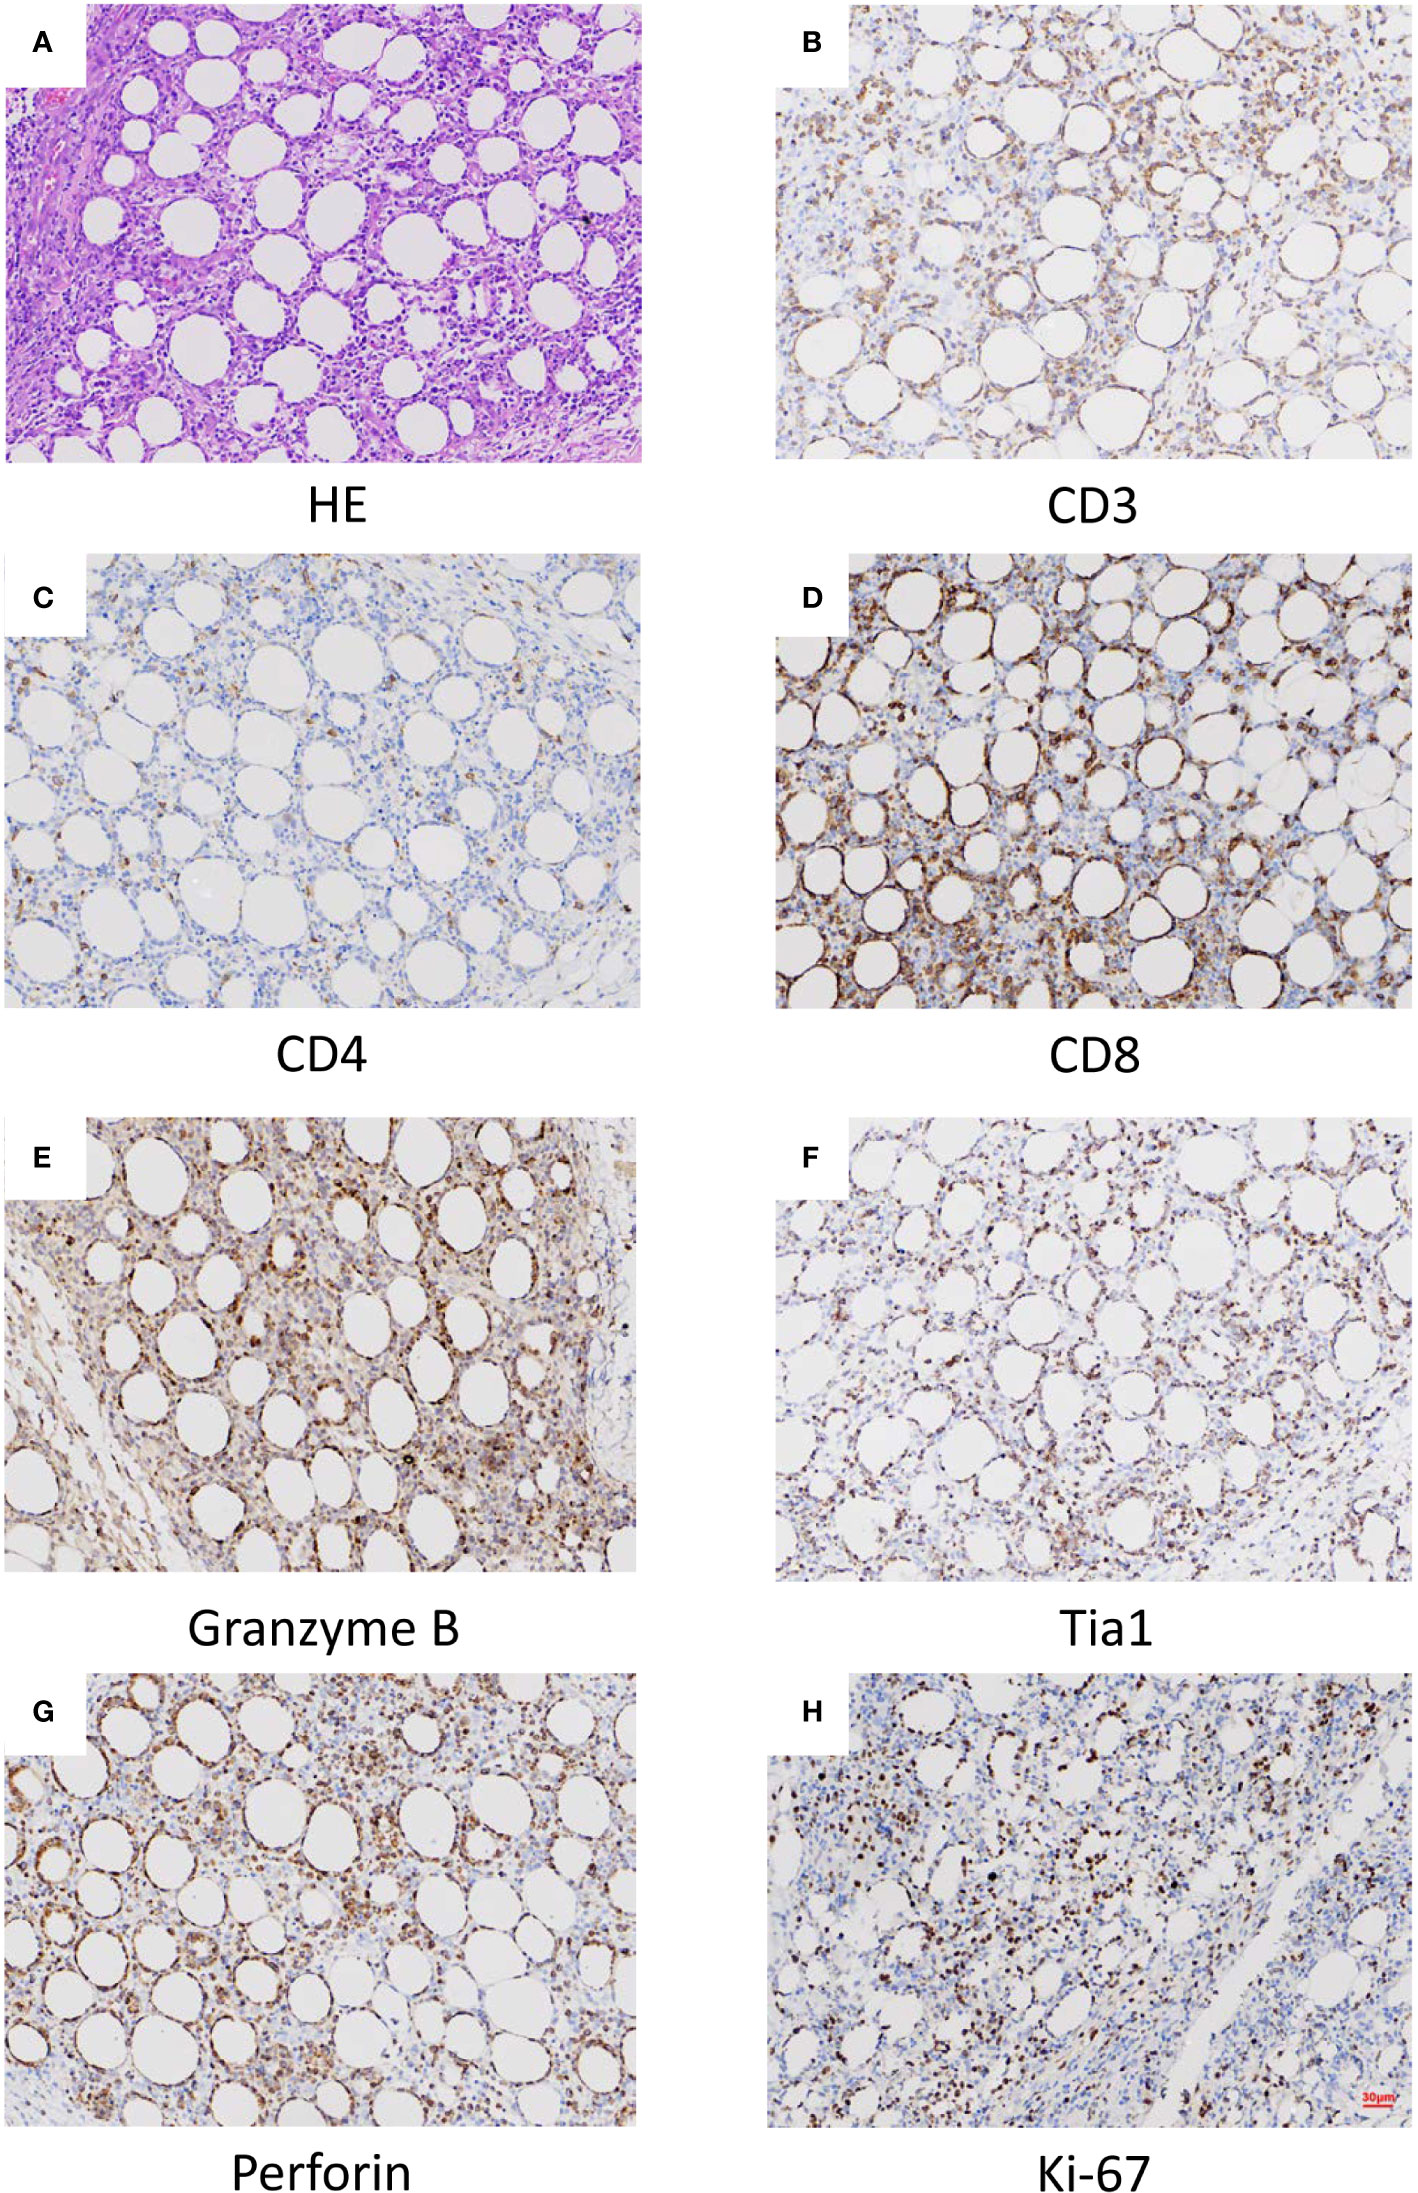
Figure 1 Histopathological (A) and histochemical (B–H) results of the lesion. (A) Sections at low power stained with hematoxylin and eosin showing a heavy lymphocytic infiltrate predominantly in the subcutis (x40). (B) CD3 positive (x40). (C) CD4 in approximately 5% of cells (x40). (D) CD8 positive (x40). (E) Granzyme B positive (x40). (F) Tia1 positive (x40). (G) Perforin positive (x40). (H) Ki-67 positive (x40).
The SPTCL-Specific Ecosystem at Single-Cell Resolution
We used scRNA-seq to profile gene expression in cells obtained from the enzymatically digested subcutaneous lesion tissue of the biopsy before any treatment at 22 months old. Transcriptomic data were obtained from a total of 17,598 cells, with a median of 1,672 genes detected per cell. Cells were grouped according to their expression profiles by principal component analysis (PCA) and Uniform Manifold Approximation and Projection (UMAP) dimensional reduction. Unsupervised graph-based Leiden clustering by Scanpy identified 17 clusters of cells that were annotated and assigned with a cell type based on the expression of genes described in known canonical markers and published transcriptome data (see Methods for details) (Figures 2A, B and Supplementary Figure S1). These included one naïve T cell cluster, one Treg cell cluster, two CD8+ T cell clusters, two NK cell clusters, one naïve B cell cluster, six macrophage clusters, one dendritic cell cluster, two fibroblast clusters, and one progenitor cell cluster. Macrophages were the most abundant immune cells in our study, with a low proportion of B cells. Malignant-like T cells were identified based on conventional SPTCL markers (i.e., MKI67, PRF1, TIA1, and GZMB; Figure 2C), which were highly expressed in these two CD8+ T cell clusters. However, we cannot rule out the possibility that there were a few normal CD8+ T cells in these two clusters since some markers such as GZMB and PRF1 were also expressed to a certain extent in normal CD8+ T cells. To validate the identification of malignant-like T cells, we further distinguished malignant from non-malignant T cells by inferring large-scale chromosomal copy-number variations (CNVs) based on transcriptomes (Figure 2D). As expected, almost all the identified malignant-like cells (>99%) showed clear evidence of a gain of 6p, 12p, and 14p compared with normal reference cells, supporting that most of them were real malignant cells.
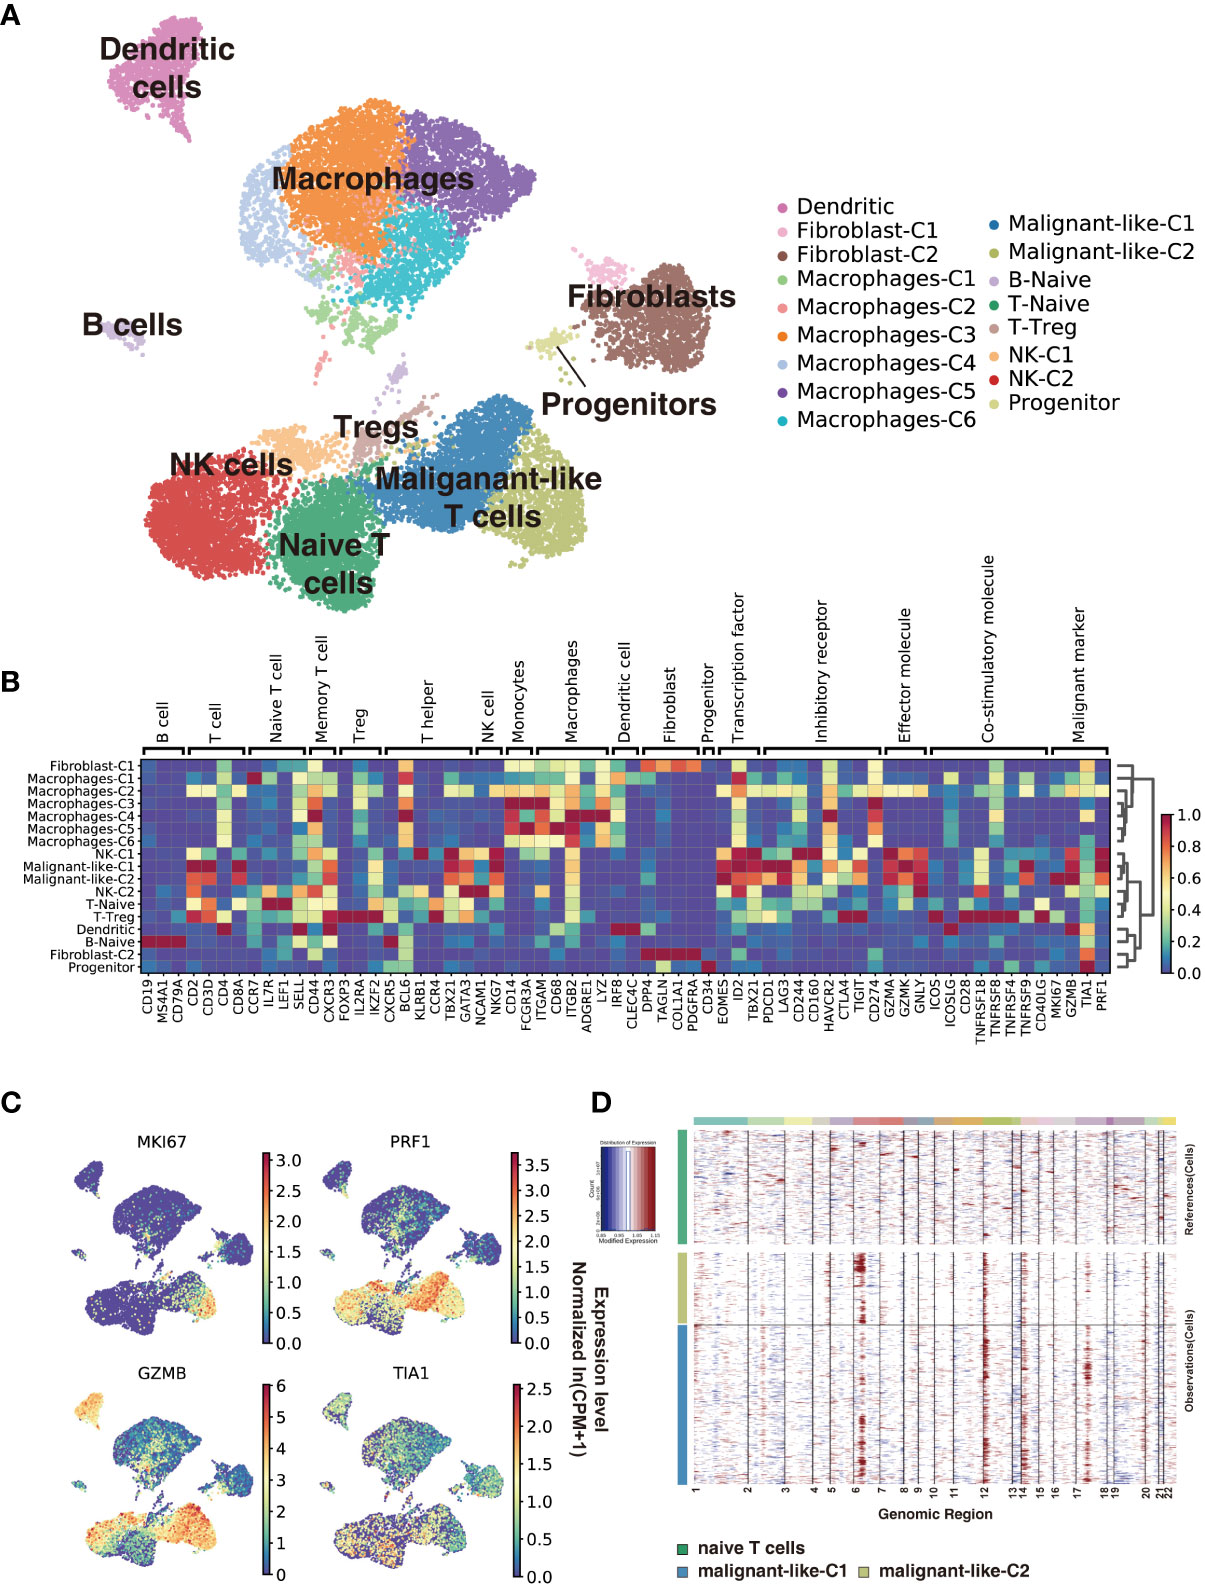
Figure 2 Subcutaneous panniculitis-like T-cell lymphoma ecosystem at single-cell resolution. Cells from the patient’s subcutaneous lesion tissue were clustered using the Leiden community detection algorithm to identify groups of cells with similar expression patterns. (A) Single-cell expression of the subcutaneous lesions’ cells in UMAP space (first two dimensions). Cells are color-coded according to the clusters generated by the Leiden algorithm. (B) Heatmap summarizes the mean expression (normalized and log-transformed) of selected canonical markers in each cluster. The gene expression value has been scaled for visualization. The covariate bar on the top side indicates the component associated with each gene, and red boxes highlight the prominent expression of genes for the known subtypes. (C) UMAP plots of malignant markers (MKI67, PRF1, TIA1, GZMB) expression in subcutaneous lesions’ cells. (D) Chromosomal landscape of inferred large-scale copy number variations (CNVs) distinguishes malignant from non-malignant cells. Amplifications (red) or deletions (blue) were inferred by averaging expression over 100-gene stretches on the respective chromosomes.
Next, we use cNMF (15) to infer potential GEPs underlying the expression profiles and which cells expressed the GEPs. We identified 23 distinct programs in this dataset, which were further divided into identity programs (n=19) and activity programs (n=4) based on the criterion that the former represents a unique cell type while the latter can occur in multiple diverse cell types (Supplementary Table S1; Supplementary Figure S2A). Most cells had only one GEP, which represents their identity program. In addition to the 17 primary cell-type clusters initially generated by Scanpy and refined by the identity GEPs, we also identified epithelial cells, endothelial cells, and mast cells in this SPTCL-specific ecosystem (Supplementary Figure S2A). We noticed that the identified malignant T cells expressed one identity GEP that was significantly enriched for genes involved in cell killing and T cells activation (Supplementary Figures S2A, B), including the chemokines family (i.e., CCL5, CCR5, CXCR3, CXCR6), cytotoxic proteins (i.e., NKG7, GZMA, GZMB, GZMH, GZMK, GNLY, PRF1), and immune checkpoint genes (i.e., LAG3, CD27, TIGIT, HAVCR2, PDCD1, CTLA4) (Supplementary Figure S2C; Supplementary Table S1). Some malignant T cells also expressed an activity GEP named Proliferation, which was strongly enriched for genes associated with cell cycle (e.g., Mitotic Nuclear Division; Supplementary Figures S2A, B). Moreover, parts of malignant T cells expressed an activity GEP named Act.T, which was also expressed in naïve T cells and NK cells (Supplementary Figure S2A).
Comparison of Malignant and Normal T Cells by Expression Profiling
To investigate the difference between malignant and normal T cells, we paired isolated T cells from the subcutaneous lesion tissue of the patient with normal T cells from donors’ peripheral blood, bone marrow, lung tissues, and lymph nodes. We applied Scanorama to correct the potential batch effects between two datasets and merged the neighbor sets via the UMAP algorithm as a combined dataset. Based on the cell-type clusters in SPTCL, we found that the naïve T cells from the patient overlapped with normal T cells from donors, while malignant T cells were obviously separated from them (Supplementary Figure S3). Using the Leiden clustering algorithm, we identified nine UMAP clusters presenting the normal versus malignant classification clearly (Figure 3A), actively supporting the separation within the UMAP. The graph-like maps of cells generated by the partition-based graph abstraction (PAGA) also confirmed these two distinct populations without secure connections (Figure 3B).
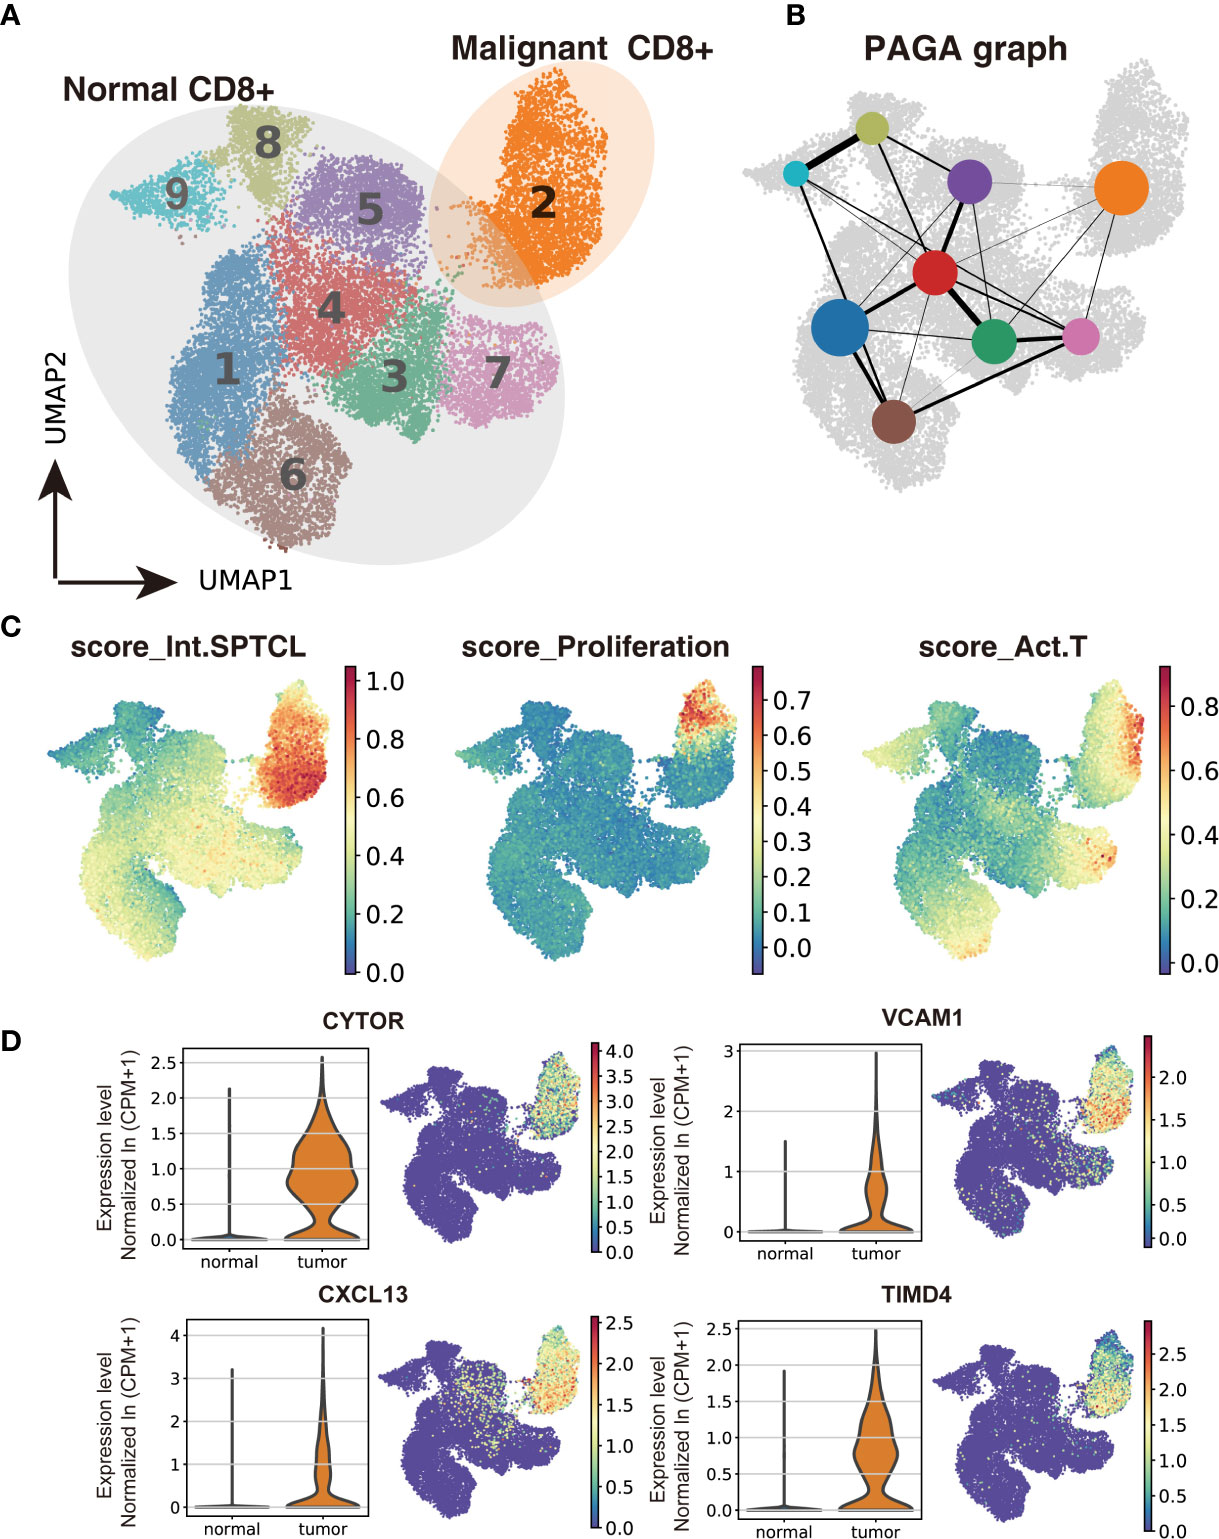
Figure 3 Transcriptomic comparison of malignant versus normal CD8+ T cells. (A) UMAP projection of cells from healthy donors and the patient’s subcutaneous lesion tissue with normal CD8+ T cells outlined in grey and malignant CD8+ T cells in orange. (B) Results of partition-based graph abstraction (PAGA). Each node represents a cluster, and edges show the connectivity between clusters. The size of nodes indicates the number of cells in each cluster, and the edge thickness shows the connection strength. (C) Results of GEP-program cell scoring in UMAP space (first two dimensions). (D) Potential novel markers of SPTCL cells with a Δ percentage of cells expressed greater than 90% and Padj < 1e-100. CPM, counts per million.
As reported by Gayden et al. (8), germline HAVCR2 mutations altering TIM-3 were significantly overrepresented in SPTCL patients, especially with hemophagocytic lymphohistiocytosis (HLH). They also observed elevated serum levels of IFN-γ-induced CXCL10, inflammasome-activated interleukin-18 (IL-18), and soluble CD25 in a HAVCR2 mutant SPTCL patient at the time of active disease, and increased amounts of tumor necrosis factor-α (TNF- α) and IL-2 produced in vitro by T lymphoblasts from HAVCR2 mutant patients with SPTCL. Thus, we checked the genotype of HAVCR2 by examining the whole-exome sequencing (WES) data of the patient’s SPTCL tissue and did not observe any coding mutation in the HAVCR2 gene (Supplementary Figure S4). We also checked the expression of genes (HAVCR2, TNF, IL2, CXCL10, IL18, and IL2RA/CD25) in our scRNA-seq data for malignant and normal T cells and found regular expression of HAVCR2 and CXCL10 and low expression of TNF, IL2, IL18, and IL2RA(CD25) in the SPTCL malignant cells (Supplementary Figure S5) compared with normal T cells, suggesting the difference between HAVCR2-wild-type and mutant SPTCL patients.
It has previously been proposed that regulatory T lymphocytes (Treg) could play an essential role in SPTCL pathogenesis, especially in the skin (8, 23). In particular, Gayden et al. identified a drastic decrease in FOXP3+CD4+ T cells in TIM-3 mutants compared with TIM-3 wild-type SPTCL (8). For comparison, we isolated FOXP3+CD4+ T cells in our SPTCL scRNA-seq data and found that the proportion (21.97%) of FOXP3+CD4+ T cells in CD4+ T cells in our patient was similar to that in TIM-3 wild-type SPTCLs and higher than that in TIM-3 mutants in the reported cohort, consistent with their finding (Supplementary Figure S6).
Next, we used the conventional SPTCL markers to examine the separation of normal and malignant cells above. As expected, we found that the classical SPTCL marker MKI67 was very specifically observed in malignant cells but mostly not seen in normal cells, while the markers GZMB and PRF1 were not only expressed in the tumor T cells but also in part of normal CD8+ T cells (Supplementary Figure S7). Then we scored each cell by their gene expression correlation to malignant GEPs, including the previously identified malignant identity GEP (Int.SPTCL) and activity GEPs (Proliferation and Act.T). There were significant differences in malignant and normal T cells scored with all these GEPs (P< 0.001) (Figure 3C).
Meanwhile, we also paired the isolated T cells from the subcutaneous lesion tissue with T cells from the peripheral blood and bone marrow of the patient using the same process. Interestingly, there were a small amount of CD8+ T cells from peripheral blood and bone marrow in proximity to malignant T cells, and PAGA analysis also showed connections between them (Supplementary Figures S8A, B). Furthermore, we also found that the malignant T cells and the proximate T cells from matched peripheral blood and bone marrow were scored significantly higher than others with GEPs named Int.SPTCL and Proliferation (Supplementary Figure S9), suggesting that malignant-like or pre-malignant cells may exist in the circulation of the patient resulting in malignant recurrence.
To identify potential novel markers and/or therapeutic targets of SPTCL, we performed differential gene analysis by comparing the malignant cells to normal T cells. In total, we identified 45 significantly overexpressed genes in the malignant cells as potential markers for SPTCL (Padj < 0.05 and average fold change >2). As expected, the top upregulated genes in the malignant cells were GNLY and the granzyme subfamily (e.g., GZMA, GZMK) (Supplementary Figure S10). We further identified potential novel markers for SPTCL including CYTOR, CXCL13, VCAM1, and TIMD4, which were specifically differentially expressed in the SPTCL cells as defined by average fold change > 2 and delta percentage > 90% in malignant T cells versus normal T cells (Figure 3D). Moreover, we also examined previously reported SPTCL-related genes (10) and found a group of genes significantly differentially expressed in the SPTCL cells (i.e., APOBEC3G, CCL4, CCL5, CXCL10, CXCR3, FASLG, GBP5, IFNG, IKZF3, KLRD1, PRF1, and TNFRSF9 (Padj < 1 x 10⁻¹⁰; Supplementary Figure S11). The complete results for differential expression analysis are included in Supplementary Table S2.
Next, we focused on three of these potential novel markers, CXCL13, VCAM1, and TIMD4, which are protein-coding genes and presented no or shallow expression in normal lymphocytes. Their expression was examined by immunohistochemistry in the patient’s subcutaneous lesion and additional samples from patients with panniculitis (PA) (Supplementary Figure S12). Results showed that PA lesions were negative or weakly positive for the expression of these markers, while SPTCL lesions exhibited high numbers of positive cells for all three markers.
Single-Cell Expression Patterns of Novel SPTCL-Specific Immune Subsets
To further characterize immune cells in the tumor environment of SPTCL, we annotated and dissected macrophages and fibroblasts based on the expression of genes described in known canonical markers (Figure 4A). We found that most of the macrophages were of the M1-type (classically activated macrophage) and M2-type (alternatively activated macrophage) with similar proportions (48.9% vs. 41.1%). The other two clusters of macrophages were not in polarized activation states; thus, they may be in M0 resting states. Intriguingly, we also identified a group of cancer-associated fibroblasts (CAFs), a type of perpetually activated fibroblasts, based on the “CAF markers”, suggesting that these cells could emerge as players in immune regulation.
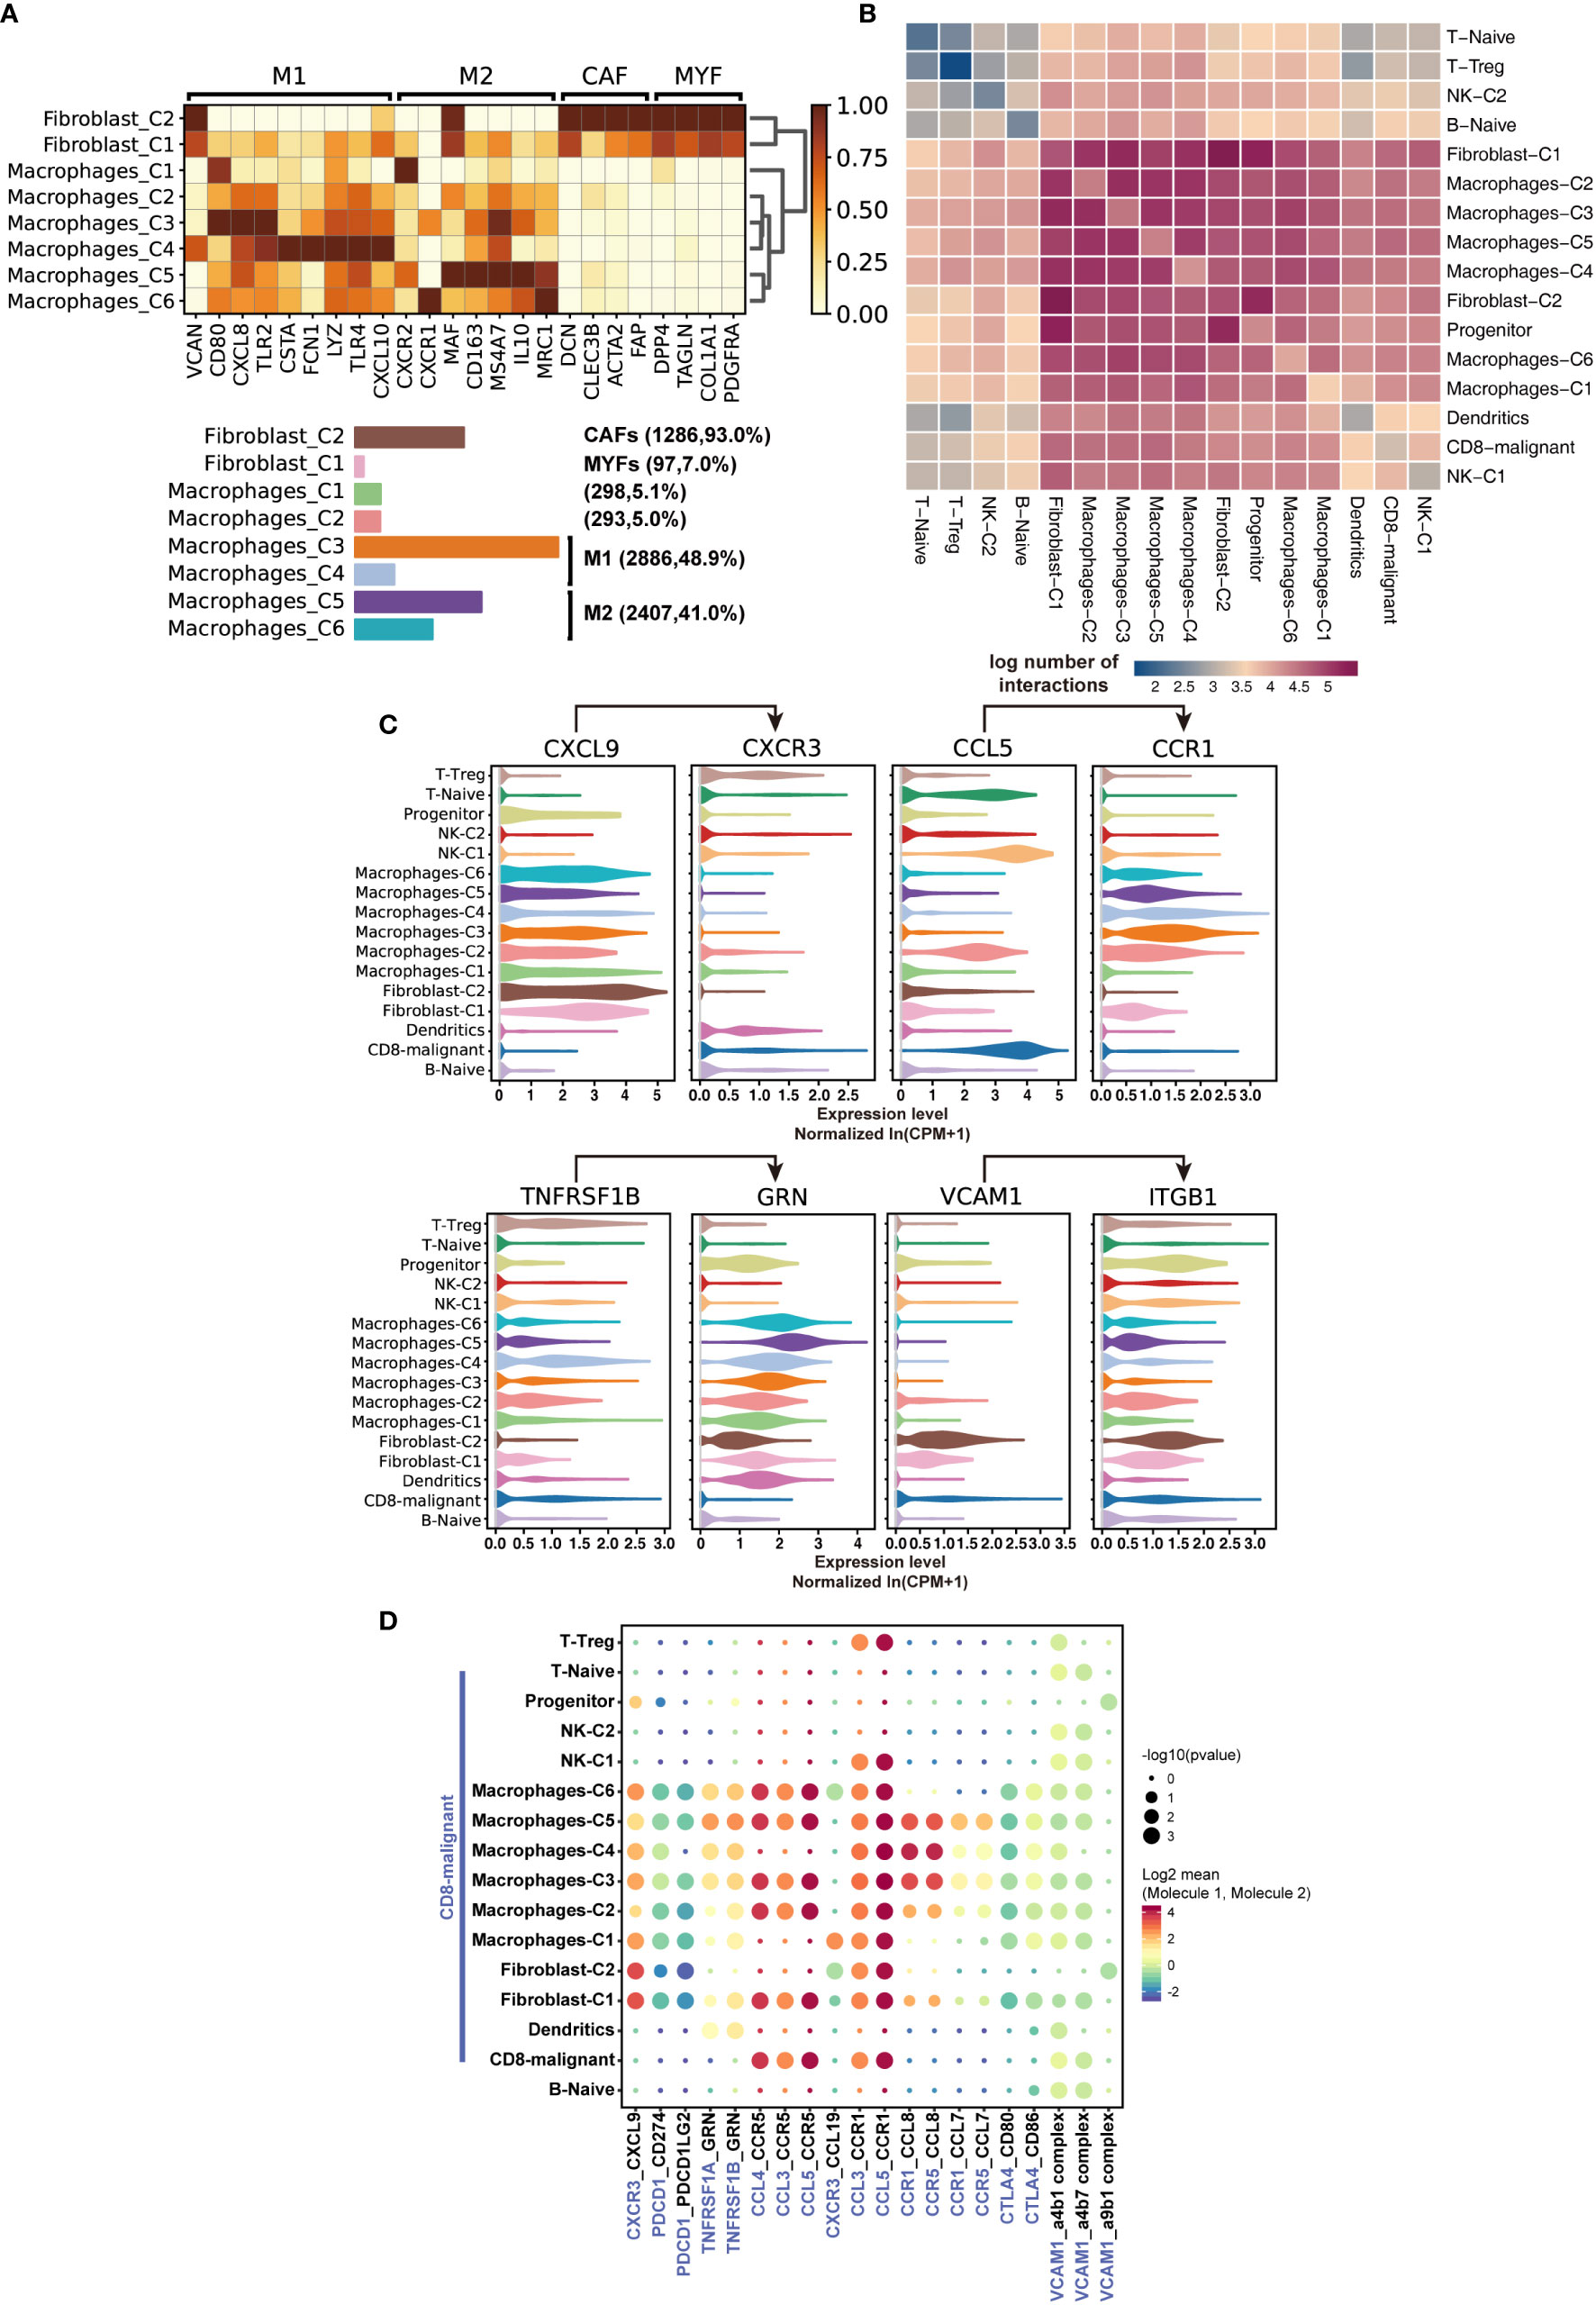
Figure 4 Characteristics of SPTCL-specific immune subsets. (A) Heatmap summarizing mean expression (normalized and log-transformed) of M1, M2, CAF, and MYF markers in each cluster (above). Bar plot showing the cell fraction of subsets of macrophages and fibroblasts (below). M1, classically activated macrophage; M2, alternatively activated macrophage; CAF, cancer-associated fibroblasts; MYF, myofibroblasts. (B) Heatmap depicting the log number of all possible interactions between the clusters analyzed. (C) Violin plots showing expression of ligands CXCR3, CCL5, TNFRSF1B, and VCAM1 and cognate receptors CXCL9, CCR1, GRN, and IGTB1 on respective stromal populations. (D) Dot plot depicting selected tumor-immune interactions enriched in the microenvironments.
Next, we sought to elucidate the interactions of the malignant T cells with the immune populations by examining the cross-talk between them. We systematically predicted cell-cell communication networks based on CellPhoneDB (19), a manually curated repository of ligands, receptors, and their interactions integrated with a statistical framework to infer cell-cell communication networks from single-cell transcriptomic data. We found that the interactions of malignant T cells occurred more frequently with macrophages, fibroblasts, and dendritic cells, compared with naïve T cells, Treg, NK cells, and B cells (Figures 4B, C). Notably, macrophages and fibroblasts dominated the cell-cell communication landscape in this microenvironment, suggesting they might play the primary role in tumor-immune interactions of SPTCL. There was no significant difference between M1 and M2 macrophages in tumor-immune interactions. We identified multiple tumor-immune interactions, for example between CXCR3, CCL5, TNFRSF1B, and VCAM1-expressing malignant T cells and macrophages/fibroblasts positive for CXCL9, CCR1, GRN, and IGTB1, respectively (Figure 4C). Interestingly, we found that the recruited macrophages might promote the inflammatory activity of malignant T cells via suppressing the PDCD1 and CTLA4 axis (Figure 4D), because the PDCD1(PD-1)-CD274(PD-L1) and CTL4-CD80/86 interactions can inhibit activation, expansion, and acquisition of effector functions of CD8+ T cells (24).
Discussion
SPTCL is a rare disease facing significant diagnostic challenges. The clinical manifestations of SPTCL are complex with only a few consistent characteristics. Subcutaneous tissue infiltration and/or infiltration by CD3+CD8+ cells expressing cytotoxic proteins (GZMB, TIA-1, perforin) is the typical pathological change of SPTCL (25). However, this change can also occur in benign panniculitis and lupus erythematosus profundus caused by autoimmune attacks (26, 27). The patient in this study experienced multiple subcutaneous mass in 16 months, and the results of the biopsy have shown that the mass evolved from benign to malignant. Because no standardized therapeutic approach has been established for SPTCL, the patient received two surgeries to remove the tumor without chemotherapy or radiotherapy. Interestingly, after the final operation, the patient has been followed up for more than one year and has not suffered a relapse. Thus, if there are proper approaches to effectively diagnose the disease and specific markers to distinguish malignant cells of SPTCL, timely surgical resection could be an effective therapy.
Here, we used scRNA-seq profiling of the malignant and normal cells from the SPTCL patient and normal cells from healthy donors to characterize the molecular events of SPTCL. To our knowledge, this is the first study exploring gene expression signatures, summarizing the tumor microenvironment of SPTCL in single-cell resolution. We identified a unique GEP that was expressed significantly higher in SPTCL cells than in normal T cells, which could be a characteristic of SPTCL. We found four genes (i.e., CYTOR, CXCL13, VCAM1, and TIMD4) explicitly expressed in malignant T cells, which may be potential novel markers for SPTCL. We also investigated interplays between different stromal populations and malignant T cells and found the leading role of macrophages and fibroblasts (especially CAFs) in the SPTCL microenvironment, suggesting their contribution to malignant T cell dysfunction. More specifically, the recruited macrophages might suppress the PDCD1 and CTLA4 axis to enhance the inflammatory activity of malignant cells, consistent with the clinical manifestation of SPTCL.
CYTOR (or Linc00152) is a long non-coding RNA that is overexpressed in multiple cancer cells, and it can promote cell proliferation and epithelial-mesenchymal transition (28). Given its crucial role in the pathogenesis of cancers, CYTOR (average fold change = 3.40, Δ percentage =95%) may play a role in SPTCL development.
CXCL13, initially identified as a B-cell chemoattractant, exerts essential functions in lymphoid neogenesis and has been widely implicated in the pathogenesis of several autoimmune diseases and inflammatory conditions, as well as in lymphoproliferative disorders (29). This chemokine has been proposed as a marker for certain lymphomas, such as angioimmunoblastic T-cell lymphoma (AITL), an aggressive nodal T-cell lymphoma derived from TFH cells (2, 30). The SPTCL malignant cells highly expressed CXCL13, suggesting that its role in SPTCL is intriguing and worth exploring.
Vascular adhesion molecule-1 (VCAM1), a member of the immunoglobulin family of cell-cell adhesion receptors, is expressed aberrantly in some tumor cells, such as renal, breast, or gastric carcinomas (31–33). Clustering of VCAM-1 on the cell surface, acting through Ezrin, triggers Akt activation and protects cancer cells from proapoptotic cytokines such as the TNF-related apoptosis-inducing ligand (TRAIL) (32, 34). VCAM-1 can tether macrophages to cancer cells via counter-receptor α4β1-integrins, and we found that macrophages and fibroblasts in the SPTCL microenvironment highly expressed ITGA4 and ITGB1, which constitute α4β1-integrins. The interaction between malignant T cells and immune cells may possess similar effects like VCAM1-mediated mechanisms in breast cancer cells (32, 34).
TIMD4, a member of the TIM family of immunoregulatory proteins, is overexpressed in multiple tumor tissues, which has been proven to promote tumor cell growth and proliferation both in vitro and in vivo in lung cancer (35). As reported in recent studies, TIMD4 is expressed in professional antigen-presenting cells (APCs), pro-B cells (36), and NKT cells (37) but not in normal CD8+ T cells. Its role of aberrant expression in SPTCL cells needs to be explored further in the future.
Single-cell methods allow researchers to characterize the tumor transcriptome and microenvironment in an unprecedented resolution. Our study offered a new insight into the heterogeneity of subcutaneous panniculitis-like T-cell lymphoma, providing a better understanding of the transcription characteristics and immune microenvironment of this rare tumor. This new level of data provided an opportunity for clinically meaningful advances in SPTCL.
Data Availability Statement
The datasets presented in this study can be found in online repositories. The names of the repository/repositories and accession number(s) can be found below: the Genome Sequence Archive (GSA) for Human in National Genomics Data Center (NGDC) under accession number HRA000370.
Ethics Statement
The studies involving human participants were reviewed and approved by Children’s Hospital of Fudan University Research Ethics Board. Written informed consent to participate in this study was provided by the participants’ legal guardian/next of kin.
Author Contributions
XWZ and MQ are the principal investigators of this study and take responsibility for the integrity of the data and the accuracy of the data analysis. ZL analyzed the single-cell RNA sequencing data. XWZ, RD, MQ, and ZL wrote the manuscript. HW, JM, LS, XQ, XHZ, PC, HM, YY, YF, PW, WJ, CS, YM, CL, XY, SJ, HZ, and RD provided advice on the study design and participated in data collection. XWZ, RD, MQ, and ZL interpreted the data and the research findings. All authors contributed to the article and approved the submitted version.
Funding
The work was supported by the Health and Family Planning Commission of Shanghai Municipality (201740011), the National Natural Science Foundation of China (81973997), and the Cyrus Tang Foundation. MQ is supported by the Program for Professor of Special Appointment (Eastern Scholar) at Shanghai Institutions of Higher Learning.
Conflict of Interest
The authors declare that the research was conducted in the absence of any commercial or financial relationships that could be construed as a potential conflict of interest.
Acknowledgments
The authors thank the patients in this study. We also thank the Biobank staff at Children’s Hospital of Fudan University for the clinical sample collection.
Supplementary Material
The Supplementary Material for this article can be found online at: https://www.frontiersin.org/articles/10.3389/fonc.2021.611580/full#supplementary-material
References
1. Willemze R, Cerroni L, Kempf W, Berti E, Facchetti F, Swerdlow SH, et al. The 2018 update of the WHO-EORTC classification for primary cutaneous lymphomas. Blood (2019) 133(16):1703–14. doi: 10.1182/blood-2018-11-881268
2. Swerdlow SH, Campo E, Pileri SA, Harris NL, Stein H, Siebert R, et al. The 2016 revision of the World Health Organization classification of lymphoid neoplasms. Blood (2016) 127(20):2375–90. doi: 10.1182/blood-2016-01-643569
3. Huppmann AR, Xi L, Raffeld M, Pittaluga S, Jaffe ES. Subcutaneous panniculitis-like T-cell lymphoma in the pediatric age group: a lymphoma of low malignant potential. Pediatr Blood Cancer (2013) 60(7):1165–70. doi: 10.1002/pbc.24462
4. Willemze R. Cutaneous lymphomas with a panniculitic presentation. Semin Diagn Pathol (2017) 34(1):36–43. doi: 10.1053/j.semdp.2016.11.009
5. Hahtola S, Burghart E, Jeskanen L, Karenko L, Abdel-Rahman WM, Polzer B, et al. Clinicopathological Characterization and Genomic Aberrations in Subcutaneous Panniculitis-Like T-Cell Lymphoma. J Invest Dermatol (2008) 128(9):2304–9. doi: 10.1038/jid.2008.6
6. Pincus LB, LeBoit PE, McCalmont TH, Ricci R, Buzio C, Fox LP, et al. Subcutaneous panniculitis-like T-cell lymphoma with overlapping clinicopathologic features of lupus erythematosus: coexistence of 2 entities? Am J Dermatopathol (2009) 31(6):520–6. doi: 10.1097/DAD.0b013e3181a84f32
7. Polprasert C, Takeuchi Y, Kakiuchi N, Yoshida K, Assanasen T, Sitthi W, et al. Frequent germline mutations of HAVCR2 in sporadic subcutaneous panniculitis-like T-cell lymphoma. Blood Adv (2019) 3(4):588–95. doi: 10.1182/bloodadvances.2018028340
8. Gayden T, Sepulveda FE, Khuong-Quang D-A, Pratt J, Valera ET, Garrigue A, et al. Germline HAVCR2 mutations altering TIM-3 characterize subcutaneous panniculitis-like T cell lymphomas with hemophagocytic lymphohistiocytic syndrome. Nat Genet (2018) 50(12):1650–7. doi: 10.1038/s41588-018-0251-4
9. Fernandez-Pol S, Costa HA, Steiner DF, Ma L, Merker JD, Kim YH, et al. High-throughput Sequencing of Subcutaneous Panniculitis-like T-Cell Lymphoma Reveals Candidate Pathogenic Mutations. Appl Immunohistochem Mol Morphol (2019) 27(10):740–8. doi: 10.1097/PAI.0000000000000683
10. Maliniemi P, Hahtola S, Ovaska K, Jeskanen L, Vakeva L, Jantti K, et al. Molecular characterization of subcutaneous panniculitis-like T-cell lymphoma reveals upregulation of immunosuppression- and autoimmunity-associated genes. Orphanet J Rare Dis (2014) 9:160. doi: 10.1186/s13023-014-0160-2
11. Sen F, Rassidakis GZ, Jones D, Medeiros LJ. Apoptosis and proliferation in subcutaneous panniculitis-like T-cell lymphoma. Mod Pathol (2002) 15(6):625–31. doi: 10.1038/modpathol.3880577
12. Szabo PA, Levitin HM, Miron M, Snyder ME, Senda T, Yuan J, et al. Single-cell transcriptomics of human T cells reveals tissue and activation signatures in health and disease. Nat Commun (2019) 10(1):4706. doi: 10.1038/s41467-019-12464-3
13. Wolf FA, Angerer P, Theis FJ. SCANPY: large-scale single-cell gene expression data analysis. Genome Biol (2018) 19(1):15. doi: 10.1186/s13059-017-1382-0
14. Lun AT, Bach K, Marioni JC. Pooling across cells to normalize single-cell RNA sequencing data with many zero counts. Genome Biol (2016) 17:75. doi: 10.1186/s13059-016-0947-7
15. Kotliar D, Veres A, Nagy MA, Tabrizi S, Hodis E, Melton DA, et al. Identifying gene expression programs of cell-type identity and cellular activity with single-cell RNA-Seq. eLife (2019) 8:e43803. doi: 10.7554/eLife.43803
16. Yu G, Wang L-G, Han Y, He Q-Y. clusterProfiler: an R Package for Comparing Biological Themes Among Gene Clusters. OMICS: A J Integr Biol (2012) 16(5):284–7. doi: 10.1089/omi.2011.0118
17. Hie B, Bryson B, Berger B. Efficient integration of heterogeneous single-cell transcriptomes using Scanorama. Nat Biotechnol (2019) 37(6):685–91. doi: 10.1038/s41587-019-0113-3
18. Tirosh I, Izar B, Prakadan SM, Wadsworth MH, Treacy D, Trombetta JJ, et al. Dissecting the multicellular ecosystem of metastatic melanoma by single-cell RNA-seq. Science (2016) 352(6282):189–96. doi: 10.1126/science.aad0501
19. Efremova M, Vento-Tormo M, Teichmann SA, Vento-Tormo R. CellPhoneDB: inferring cell–cell communication from combined expression of multi-subunit ligand–receptor complexes. Nat Protoc (2020) 15(4):1484–506. doi: 10.1038/s41596-020-0292-x
20. Li H, Durbin R. Fast and accurate short read alignment with Burrows-Wheeler transform. Bioinformatics (2009) 25(14):1754–60. doi: 10.1093/bioinformatics/btp324
21. McKenna A, Hanna M, Banks E, Sivachenko A, Cibulskis K, Kernytsky A, et al. The Genome Analysis Toolkit: a MapReduce framework for analyzing next-generation DNA sequencing data. Genome Res (2010) 20(9):1297–303. doi: 10.1101/gr.107524.110
22. Robinson JT, Thorvaldsdottir H, Winckler W, Guttman M, Lander ES, Getz G, et al. Integrative genomics viewer. Nat Biotechnol (2011) 29(1):24–6. doi: 10.1038/nbt.1754
23. Dixon KO, Das M, Kuchroo VK. Human disease mutations highlight the inhibitory function of TIM-3. Nat Genet (2018) 50(12):1640–1. doi: 10.1038/s41588-018-0289-3
24. Pardoll DM. The blockade of immune checkpoints in cancer immunotherapy. Nat Rev Cancer (2012) 12(4):252–64. doi: 10.1038/nrc3239
25. Willemze R, Jansen PM, Cerroni L, Berti E, Santucci M, Assaf C, et al. Subcutaneous panniculitis-like T-cell lymphoma: definition, classification, and prognostic factors: an EORTC Cutaneous Lymphoma Group Study of 83 cases. Blood (2008) 111(2):838–45. doi: 10.1182/blood-2007-04-087288
26. LeBlanc RE, Tavallaee M, Kim YH, Kim J. Useful Parameters for Distinguishing Subcutaneous Panniculitis-like T-Cell Lymphoma From Lupus Erythematosus Panniculitis. Am J Surg Pathol (2016) 40(6):745–54. doi: 10.1097/PAS.0000000000000596
27. Bosisio F, Boi S, Caputo V, Chiarelli C, Oliver F, Ricci R, et al. Lobular panniculitic infiltrates with overlapping histopathologic features of lupus panniculitis (lupus profundus) and subcutaneous T-cell lymphoma: a conceptual and practical dilemma. Am J Surg Pathol (2015) 39(2):206–11. doi: 10.1097/PAS.0000000000000307
28. Tang Y, He Y, Zhang P, Wang J, Fan C, Yang L, et al. LncRNAs regulate the cytoskeleton and related Rho/ROCK signaling in cancer metastasis. Mol Cancer (2018) 17(1):77. doi: 10.1186/s12943-018-0825-x
29. Kazanietz MG, Durando M, Cooke M. CXCL13 and Its Receptor CXCR5 in Cancer: Inflammation, Immune Response, and Beyond. Front Endocrinol (2019) 10:471. doi: 10.3389/fendo.2019.00471
30. Dupuis J, Boye K, Martin N, Copie-Bergman C, Plonquet A, Fabiani B, et al. Expression of CXCL13 by neoplastic cells in angioimmunoblastic T-cell lymphoma (AITL): a new diagnostic marker providing evidence that AITL derives from follicular helper T cells. Am J Surg Pathol (2006) 30(4):490–4. doi: 10.1097/00000478-200604000-00009
31. Kuai WX, Wang Q, Yang XZ, Zhao Y, Yu R, Tang XJ. Interleukin-8 associates with adhesion, migration, invasion and chemosensitivity of human gastric cancer cells. World J Gastroenterol (2012) 18(9):979–85. doi: 10.3748/wjg.v18.i9.979
32. Chen Q, Zhang XH, Massagué J. Macrophage binding to receptor VCAM-1 transmits survival signals in breast cancer cells that invade the lungs. Cancer Cell (2011) 20(4):538–49. doi: 10.1016/j.ccr.2011.08.025
33. Lin KY, Lu D, Hung CF, Peng S, Huang L, Jie C, et al. Ectopic expression of vascular cell adhesion molecule-1 as a new mechanism for tumor immune evasion. Cancer Res (2007) 67(4):1832–41. doi: 10.1158/0008-5472.Can-06-3014
34. Lu X, Mu E, Wei Y, Riethdorf S, Yang Q, Yuan M, et al. VCAM-1 promotes osteolytic expansion of indolent bone micrometastasis of breast cancer by engaging α4β1-positive osteoclast progenitors. Cancer Cell (2011) 20(6):701–14. doi: 10.1016/j.ccr.2011.11.002
35. Zhang Q, Wang H, Wu X, Liu B, Liu W, Wang R, et al. TIM-4 promotes the growth of non-small-cell lung cancer in a RGD motif-dependent manner. Br J Cancer (2015) 113(10):1484–92. doi: 10.1038/bjc.2015.323
36. Toda S, Hanayama R, Nagata S. Two-step engulfment of apoptotic cells. Mol Cell Biol (2012) 32(1):118–25. doi: 10.1128/MCB.05993-11
Keywords: single-cell RNA-seq (scRNA-seq), T cell malignancies, pediatric oncology, molecular diagnoses, subcutaneous panniculitis- like T-cell lymphoma
Citation: Li Z, Wang H, Dong R, Man J, Sun L, Qian X, Zhu X, Cao P, Yu Y, Le J, Fu Y, Wang P, Jiang W, Shen C, Ma Y, Chen L, Xu Y, Shi J, Zhang H, Qian M and Zhai X (2021) Single-Cell RNA-seq Reveals Characteristics of Malignant Cells and Immune Microenvironment in Subcutaneous Panniculitis-Like T-Cell Lymphoma. Front. Oncol. 11:611580. doi: 10.3389/fonc.2021.611580
Received: 29 September 2020; Accepted: 01 March 2021;
Published: 18 March 2021.
Edited by:
Yizhuo Zhang, Sun Yat-sen University Cancer Center (SYSUCC), ChinaReviewed by:
David Michonneau, Assistance Publique Hopitaux De Paris, FranceAdam Lamble, Seattle Children’s Hospital, United States
Copyright © 2021 Li, Wang, Dong, Man, Sun, Qian, Zhu, Cao, Yu, Le, Fu, Wang, Jiang, Shen, Ma, Chen, Xu, Shi, Zhang, Qian and Zhai. This is an open-access article distributed under the terms of the Creative Commons Attribution License (CC BY). The use, distribution or reproduction in other forums is permitted, provided the original author(s) and the copyright owner(s) are credited and that the original publication in this journal is cited, in accordance with accepted academic practice. No use, distribution or reproduction is permitted which does not comply with these terms.
*Correspondence: Xiaowen Zhai, emhhaXhpYW93ZW5keUAxNjMuY29t; Maoxiang Qian, bXhxaWFuQGZ1ZGFuLmVkdS5jbg==
†These authors have contributed equally to this work