 Changhong Yang
 Jialei Chen
 Zhe Yu3
 Ning Jiang
- 1Department of Bioinformatics, Chongqing Medical University, Chongqing, China
- 2Department of Otolaryngology, The First Affiliated Hospital of Chongqing Medical University, Chongqing, China
- 3School of Life Sciences, Peking University, Beijing, China
- 4Department of Pathology, Chongqing Medical University, Chongqing, China
- 5Department of Hepatobiliary Surgery, The First Affiliated Hospital of Chongqing Medical University, Chongqing, China
Gallbladder carcinoma (GBC), which has high invasion and metastasis risks, remains the most common biliary tract malignancy. Surgical resection for GBC is the only effective treatment, but most patients miss the opportunity for curative surgery because of a lack of timely diagnosis. The aim of this study was to identify and verify early candidate diagnostic and prognostic RNA methylation related genes for GBC via integrated transcriptome bioinformatics analysis. Lists of GBC-related genes and methylation-related genes were collected from public databases to screen differentially expressed genes (DEGs) by using the limma package and the RobustRankAggreg (RRA) package. The core genes were collected with batch effects corrected by the RRA algorithm through protein interaction network analysis, signaling pathway enrichment analysis and gene ranking. Four modules obtained from four public microarray datasets were found to be related to GBC, and FGA, F2, HAO1, CFH, PIPOX, ITIH4, GNMT, MAT1A, MTHFD1, HPX, CTH, EPHX2, HSD17B6, AKR1C4, CFHR3, ENNP1, and NAT2 were revealed to be potential hub genes involved in methylation-related pathways and bile metabolism-related pathways. Among these, FGA, CFH, F2, HPX, and PIPOX were predicted to be methylated genes in GBC, but POPIX had no modification sites for RNA methylation. Furthermore, survival analysis of TCGA (the Cancer Genome Atlas) database showed that six genes among the hub genes, FGA, CFH, ENPP1, CFHR3, ITIH4, and NAT2, were highly expressed and significantly correlated with worse prognosis. Gene correlation analysis revealed that the FGA was positively correlated with the ENPP1, NAT2, and CFHR3, while CFH was positively correlated with the NAT2, CFHR3, and FGA. In addition, the results of immunohistochemistry (IHC) showed that the expressions of FGA, F2, CFH, PIPOX, ITIH4, GNMT, MAT1A, MTHFD1, HPX, CFHR3, NAT2, and ENPP1 were higher in GBC tissues than that in control tissues. In conclusion, two genes, FGA and CFH, were identified as RNA methylation-related genes also involved in bile metabolism in GBC, which may be novel biomarkers to early diagnose and evaluate prognosis for GBC.
Introduction
Gallbladder carcinoma (GBC), which originates from the epithelia of bile ducts and the gallbladder, is the most common malignancy of the biliary tract and has a high possibility of metastasis (1). At present, the 5-year survival rate of patients with unresectable GBC is less than 5%, and complete surgical resection is still an effective curative therapy (2). However, due to a lack of specific signs and symptoms, it is very difficult to diagnose GBC at the early stage; thus, many patients miss the opportunity for surgery (3). A more in-depth understanding of the molecular mechanisms underlying the progression of gallbladder carcinoma will be advantageous for the development of treatment options. Thus, further exploration of GBC pathological development and identification of effective early prognostic biomarkers are important for GBC treatment.
RNA methylation is the most common modification of mRNAs (4) and is dynamic and reversible in mammalian cells (5). The dynamic regulation of RNA methylation has been indicated to be closely associated with gene expression (6, 7). Growing evidence has demonstrated that RNA methylation is involved in regulating RNA transcription (8), processing events (9), RNA stability (10), and translation (11). In addition, the clinical value of RNA methylation in cancers has become increasingly obvious. RNA methylation modification is reported to be associated with proliferation (12), tumorigenesis (13), invasion (13), and metastasis (14) in various cancers. In addition, RNA methylation not only affects the cleavage, transport, stability, and degradation of non-coding RNAs such as miRNAs, lncRNAs, and circRNAs but also regulates the biological functions of cells by regulating the levels of these non-coding RNAs (15). More importantly, non-coding RNAs can influence RNA-RNA or RNA-protein interactions to regulate particular biological functions (16). As a promising biomarker, RNA methylation has been increasingly utilized to detect and predict the occurrence of cancer, and its prognostic significance has been determined (17). Increasing numbers of studies have illustrated that RNA methylation may have potential clinical value as a therapeutic target for cancer patients (18). However, research on RNA methylation in GBC is still very scarce.
Previous studies on GBC have seemed to be limited and have focused mostly on either a single gene or a single omics data type (19, 20). However, the occurrence and development of GBC is a multifactorial and multistep process involving molecular changes at the transcriptional, posttranscriptional, and translational levels. Thus, there is an urgent need to comprehensively illustrate the gene interactions and molecular modulation network of GBC. With the rapid development of high-throughput technologies, bioinformatics has been widely applied to analyze massive amounts of biological data. Transcriptomics techniques include mainly microarrays and RNA sequencing, and microarrays include expression profile chips, lncRNA chips, miRNA chips, and methylation chips. Ma et al. (19) identified differentially expressed lncRNAs and mRNAs between GBC tissues and control tissues with chips and found that the lncRNA GCASPC could bind to miRNA-17-3 to negatively regulate the proliferation of GBC cells. Liang et al. (20) used a microRNA chip with high-throughput screening to discover that miRNA-143-3p inhibited the proliferation of GBC cells by binding to its target gene MYBL2. Currently, the most-studied pathways involved in GBC are the hedgehog pathway (21) and the PI3K/Akt pathway (22). Studies on RNA methylation in gallbladder carcinoma have not been reported, and integrated bioinformatics analysis using multiple public databases in gallbladder cancer is quite scarce.
In this study, we employed integrated transcriptome bioinformatics analysis based on four RNA microarray datasets (GSE45001, GSE31370, GSE26566, and GSE76633) to identify differentially expressed genes and RNA methylation-related genes in GBC. In addition, the core genes were collected through protein-protein interaction network analysis, signaling pathway enrichment analysis, and gene ranking. Moreover, the core genes were verified with the TCGA database, and posttranscriptional modifications, survival, a coexpression network, and the tumor microenvironment were predicted. Then, immunohistochemistry was used to detect the differences in the expression of the hub genes between the clinical GBC samples and control samples. The final screened genes could be novel biomarkers to early diagnose and evaluate prognosis for GBC.
Methods
GBC-related gene lists and related genetic data were collected from public databases. Methylation-related genes were also obtained to screen the differentially expressed genes. The core genes were collected through protein interaction network analysis, signaling pathway enrichment analysis, and gene ranking. They were verified with the TCGA database, and posttranscriptional modifications, survival, and a coexpression network were predicted. Then, immunohistochemistry was used to detect the expression of the core genes between the clinical GBC samples and control samples. The flow chart is shown in Figure 1.
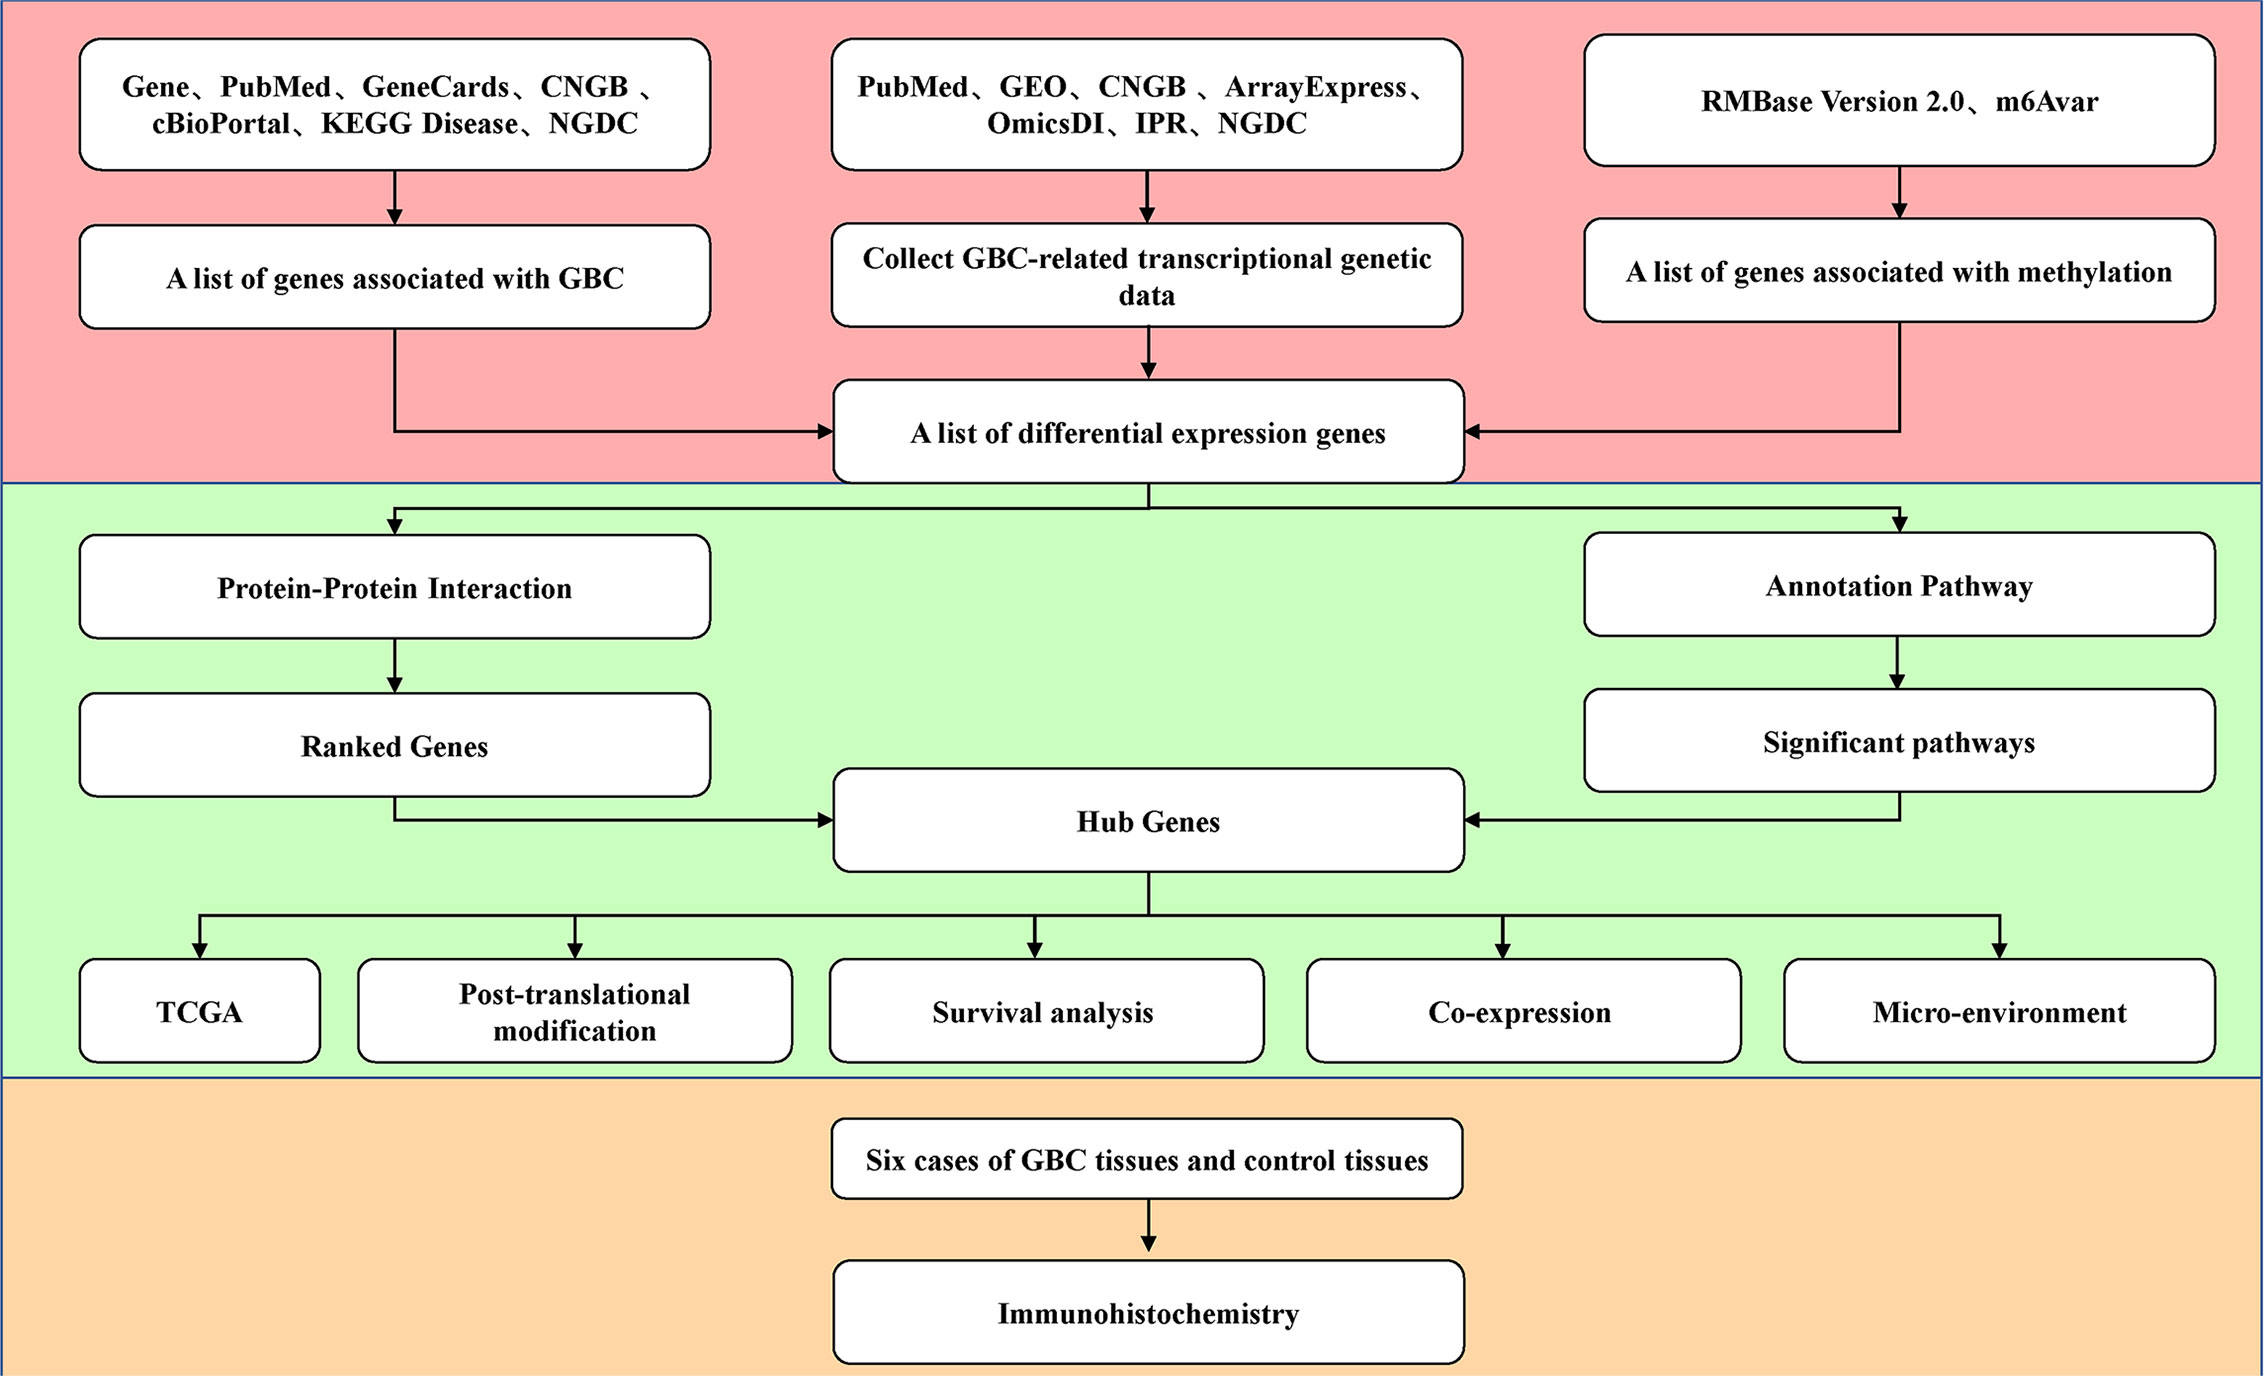
Figure 1 Workflow chart of mining of RNA methylation-related genes in gallbladder carcinoma.
Data Sources
GBC-related genes were collected with the search terms “((gallbladder cancer) OR (gallbladder carcinoma) OR (gallbladder neoplasms) OR (cholecystic carcinoma) OR (biliary tract cancer)) AND (Homo sapiens[Organism])” from the NCBI Gene database, the GeneCards database, the KEGG DISEASE database, cBioPortal database and the National Gene Bank. In addition, GBC-related genes were obtained from the literature with the keywords “(gallbladder cancer[Title/Abstract]) OR (gallbladder carcinoma[Title/Abstract])) OR (gallbladder neoplasms[Title/Abstract]) OR (cholecystic carcinoma[Title/Abstract])) OR (biliary tract cancer[Title/Abstract])) AND (biomarker[Title/Abstract])” from NCBI PubMed. Next, GBC-related microarray data were collected with the search terms “((gallbladder cancer) OR (gallbladder carcinoma) OR (gallbladder neoplasms) OR (cholecystic carcinoma) OR (biliary tract cancer)) AND (Homo sapiens[Organism])” from the GEO (Gene Expression Omnibus) database, PubMed, ArrayExpress of the EBI, the National Gene Bank, the National Genomics Science Data Center, OmicsDI, and Integrated Proteome Resources. Finally, all differentially methylated genes in GBC were obtained from the RMBase v2.0 database and the m6AVar database.
Methods for Identification of Differentially Expressed Genes
The Linear Models for Microarray Data (limma) package, which is a Bioconductor package of the R statistical language, was used to identify differentially expressed genes in six main steps. First, the expression matrix, grouping matrix and differential expression matrix were constructed. Second, the data were fitted to a linear model with the lmFit function. Third, the differences were calculated according to the contrast model with the contrasts.fit function. Fourth, the Bayesian test was conducted with the eBayes function. Fifth, test results were generated for all genes with the topTable function, and Benjamini and Hochberg test method was used to correct the P value. Finally, the results of differential analysis were screened according to a threshold of a corrected P value <0.050. RobustRankAggreg, another R package, is a tool that integrates differential expression analysis results from different platforms mainly with the RobustRank Aggregation (RRA) algorithm to obtain a comprehensive ranking list (23). To identify differentially expressed genes in this study, data were first downloaded from the GEO database. Limma software was then used to analyze the differentially expressed genes in each microarray dataset. The differentially expressed genes according to the fold change value were sorted. Finally, RobustRankAggreg software was used to integrate and analyze these results with the RRA algorithm.
Protein-Protein Interaction Network and Module Analysis
To better mine the core regulatory genes, protein-protein interaction analysis was used in this study. First, STRING (version 11, https://string-db.org/) software was used to analyze the protein interactions of the differentially expressed genes. Next, the CytoHubba plugin of Cytoscape software (version 3.7.2, https://cytoscape.org/) was used to rank the genes in the network with the Degree algorithm, and the top 25 ranked genes were considered the hub gene set. Simultaneously, the MCODE plugin was used to extract the core module from the protein interaction results with the following parameters: degree cutoff >=2, K -score >=2.
Functional Enrichment Analysis
ShinyGO V0.60 software was used to analyze the signaling pathways of the core module obtained from protein interaction analysis (24). ShinyGO software, a gene set enrichment analysis software program, is based on 55 kinds of databases, such as the Gene Ontology (GO), KEGG, Reactome, Panther, Biocarta, GeneSetDB EHMN, HumanCyc, NetPath, and MSigDB databases. ShinyGO software was used to functionally annotate genes or proteins with pathway databases, and the FDR (false discovery rate) values of the corresponding enriched pathways were obtained. The ggplot2 package was used to visualize the enrichment analysis results.
Annotation of Core Genes
The core genes in the hub module of the protein-protein interaction network that overlapped with genes involved in significant biological processes were annotated. An RNA sequencing dataset for CHOL including data on 36 patients with GBC and 9 controls were downloaded from the TCGA (25), and the limma package of the R language was used to analyze differentially expressed genes in order to verify the hub genes. In addition, the RMBase v2.0 database (26), which is a database of epigenetic modifications at the RNA level, and the m6AVar database (27), which predicts the impact of SNPs on RNA methylation modification, were used to predict the sites of RNA methylation modification of the core genes.
Survival Analysis of Hub Genes
Different endpoints that were stratified by mean and median, such as overall survival (OS), were used to analyze the prognosis of survival. Survival curves were assessed by the Kaplan-Meier method and Cox proportional hazards model. The hazard ratios (HRs) with 95% confidence intervals were determined.
Coexpression Network and Microenvironment Prediction
The GeneMANIA plug-in of Cytoscape software (version 3.7.2) was applied to analyze the gene coexpression network. The strength of regulation among genes was represented in the coexpression network through a weight value ranging from 0 to 1. The Tumor Immune Single-cell Hub (TISCH) database (http://tisch.comp-genomics.org/home/) (28) was used to analyze the tumor microenvironment.
Clinical Specimen Collection
Six samples of tumor tissues from patients with GBC and six samples of gallbladder tissues from patients with gallstones were obtained from the First Affiliated Hospital of Chongqing Medical University from 2019 to 2020, and all tissues were fixed with 4% paraformaldehyde. All patients agreed to provide informed consent, and the experimental protocols were approved by the local ethics committee.
Immunohistochemistry and Staining Result Determination
All specimens were paraffin-embedded and sectioned at 4 μm. The sections were baked at 60°C for 1 h, dewaxed, rehydrated in a graded alcohol series, and washed. The sections were boiled for 10 min antigen repair solution for antigen repair, and the remaining steps were carried out in accordance with the instructions. Primary antibodies against the following proteins were purchased: FGA (1:50, Boster, China), F2 (1:50, Boster, China), CFH (1:50, Boster, China), PIPOX (1:50, Absin, China), ITIH4 (1:50, Proteintech, USA), GNMT (1:50, Proteintech, USA), MAT1A (1:50, Fine Biotech, China), MTHFD1 (1:50, Proteintech, USA), HPX (1:50, Boster, China), CTH (1:50, Boster, China), CFHR3 (1:50, Fine Biotech, China), ENNP1 (1:50, Abcam, USA), and NAT2 (1:50, Abclonal, China). After DAB staining, the tablets were redyed with hematoxylin and sealed. The proportion of positive tumor cells was scored as follows: 1, 1–25%; 2, 26–50%; 3, 51–75%; and 4, 76–100%. The intensity of methylated protein staining in GBC was scored as follows: 0, no staining; 1, weak staining; and 2, strong staining. These two kinks of scores were multiplied to obtain a final score, and the expression of protein was determined to be low for scores <4 or high for scores ≥4.
Statistical Analysis
All statistical analyses were performed with R software (version 3.6.3). The threshold for screening of differentially expressed genes was an adjusted P value <0.05, an absolute fold change >1, and an RRA score <0.05. The methods of statistical analysis in this study included the hypergeometric test and Fisher’s exact test, and the false discovery rate method was used with Benjamini and Hochberg correction. Correlations were assessed using Pearson’s correlation coefficient.
Results
Construction of Lists of Related Genes
GBC-related genes were collected from the following sources: 415 from the Gene database of NCBI, 415 from the GeneCards database, 4 from the KEGG DISEASE database, 1,637 from the cBioPortal gene database, 100 from the National Gene Bank, and 151 from related literature in the PubMed database. After merging these gene sets and removing the redundancies, we obtained 6,026 genes related to GBC. Next, 9,569 RNA methylation-related genes were collected from the RMBase v2.0 database, while 3,472 RNA methylation-related genes were collected from the m6AVar database. Together, 11,581 RNA methylation-related genes were collected. The overlap of the above GBC-related genes and the RNA methylation-related genes was examined, and 3,072 GBC-related genes involved in RNA methylation were ultimately obtained, as shown in Figure 2. RNA microarray datasets (GSE45001, GSE31370, GSE26566, and GSE76633) were downloaded from GEO database (29), as shown in Table 1. There were 159 samples with transcriptomic data, including 129 GBC samples and 30 control samples.
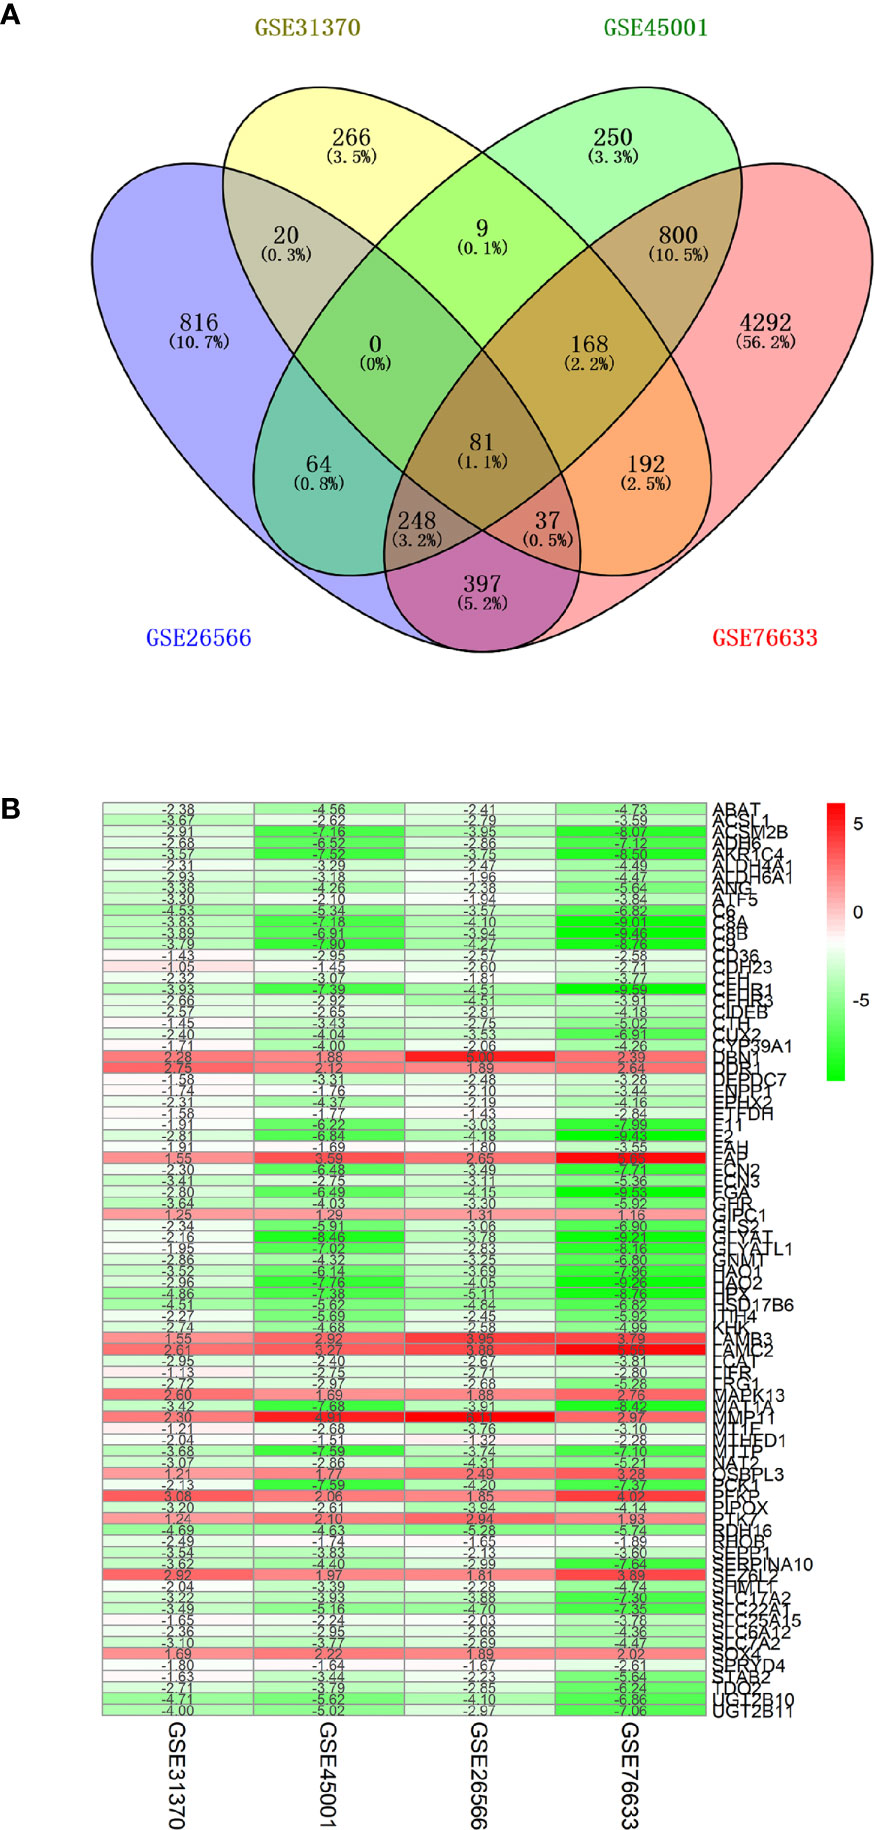
Figure 2 Collection of differentially expressed genes (DEGs) in GBC. (A) Venn diagram of four RNA microarray datasets (GSE45001, GSE31370, GSE26566, and GSE76633). (B) heat map of differentially expressed genes. Each column represents one dataset and each row represents one gene. Green represents a lower expression level, red represents higher expression levels, and white represents that there is no different expression amongst the genes. The number in each rectangle represents the normalized gene expression level.
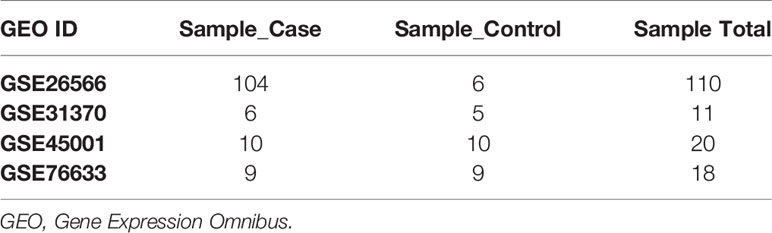
Table 1 Information of the four microarray datasets from GEO.
Collection of Differentially Expressed Genes (DEGs) in GBC
Four microarray datasets with group correction and normalization were used to analyze the differentially expressed genes. The specific numbers of upregulated and downregulated genes for each set are shown in Supplementary Table 1. The four datasets were intersected, and the genes were ranked according to the fold change value and integrated with the RRA algorithm of the RobustRankAggreg package to obtain 81 DEGs (score <0.050), including 13 upregulated genes and 68 downregulated genes (control vs GBC) (shown in Figure 2B).
Establishment of the PPI Network
Based on the STRING database, a PPI network of the above 81 DEGs was constructed and ranked with topological analysis on nodes. The top 25 genes were clustered with MCODE to finally obtain four modules, as shown in Table 2.
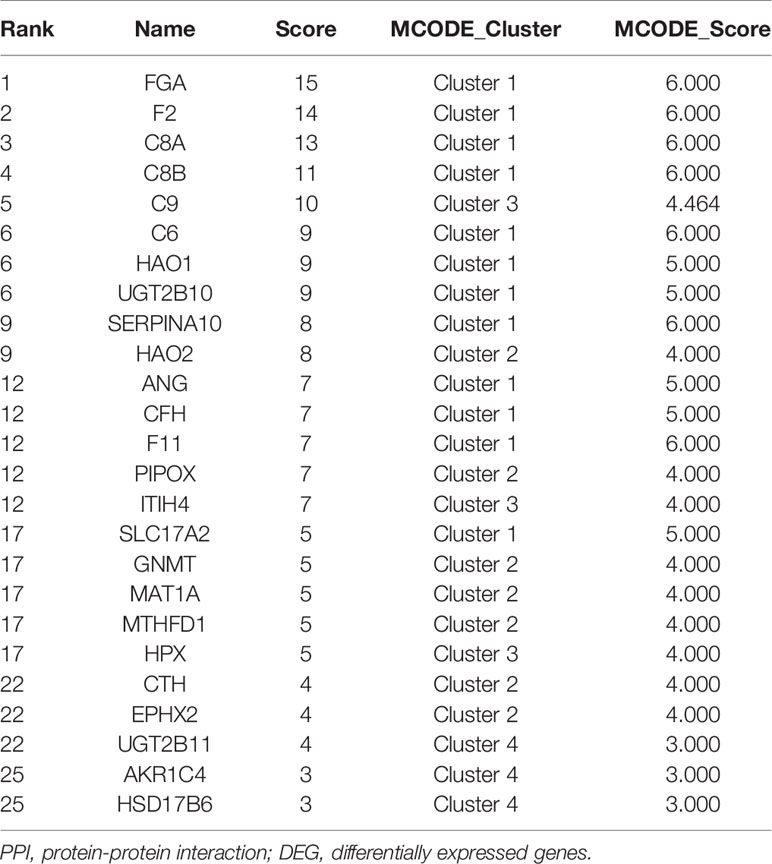
Table 2 Top 25 hub genes identified in PPI network for DEGs.
GO, KEGG, and Reactome Enrichment Analysis
Almost 2.30~48.28% of the gene products were found to be associated with 33 biological process terms, such as the extracellular, cell surface, and mitochondria terms (enrichment FDR: 2.683E-10 ~ 3.348E-02). Approximately 2.30~35.63% of the genes were found to be associated with 87 molecular biology terms, including the REDOX enzyme activity, drug binding, and signal receptor binding terms (enrichment FDR: 6.936E-06 ~ 4.886E-02). Nearly 2.30~42.53% of the genes were associated with 400 biological process terms, such as the cholic acid biosynthesis, cholic acid metabolism, JAK-stat cascade, vascular development, inflammatory response, and cell adhesion terms (enrichment FDR: 1.022E-16 ~ 4.950E-02), as shown in Figures 3A, B. Overall, we obtained 23 genes involved in biological processes related to RNA methylation, and 12 of those genes were involved in biological processes related to bile metabolism.
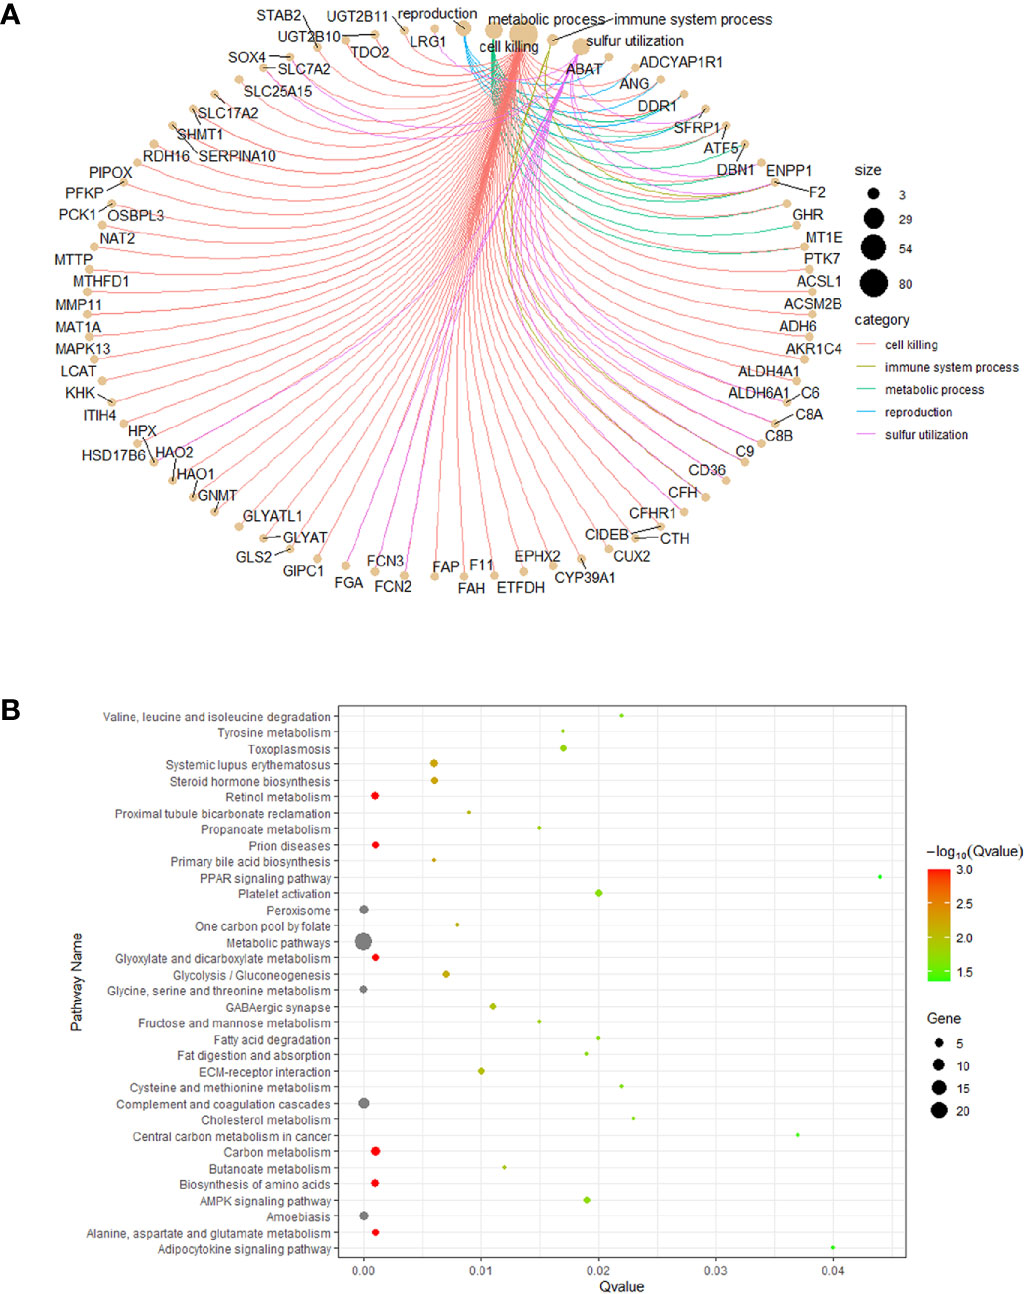
Figure 3 Functional enrichment analysis. (A) co-expression of the DEGs. (B) the DEGs enriched pathway analysis.
Annotation of Core Genes
Seventeen core genes were obtained via intersection of the PPI network, methylation-related signaling pathways, and bile-related biological processes, including FGA, F2, HAO1, CFH, PIPOX, ITIH4, GNMT, MAT1A, MTHFD1, HPX, CTH, EPHX2, HSD17B6, AKR1C4, CFHR3, ENNP1, and NAT2. The 17 core genes were verified in TCGA’s CHOL RNA-seq dataset, and all were significantly expressed. The fold change range of these 17 genes in the TCGA dataset was −184.580~−43.240, and the corrected P value range was 1.40E-04~1.24E-03, illustrating that the 17 core genes were all downregulated genes in control vs GBC samples, as shown in Figure 4A. Then, Spearman correlation coefficients and Spearman P value were used to analyze the correlations of the levels of methylation of hub genes between the control and GBC cases. The results showed that the genes CFH, F2, FGA, HPX, and PIPOX were highly methylated in GBC cases compared with control cases (Figure 4B). Next, the RMBase database was used to analyze the RNA methylation sites of core genes (as shown in Table 3). The results showed that the genes FGA, F2, HAO1, CFH, ITIH4, GNMT, MTHFD1, HPX, CTH, HSD17B6, and AKR1C4 had RNA methylation modification sites, but EPHX2, MAT1A, and PIPOX had no RNA methylation modification sites. Combining the above results, we came to the conclusion that the genes CFH, F2, FGA, and HPX are methylated genes in GBC.
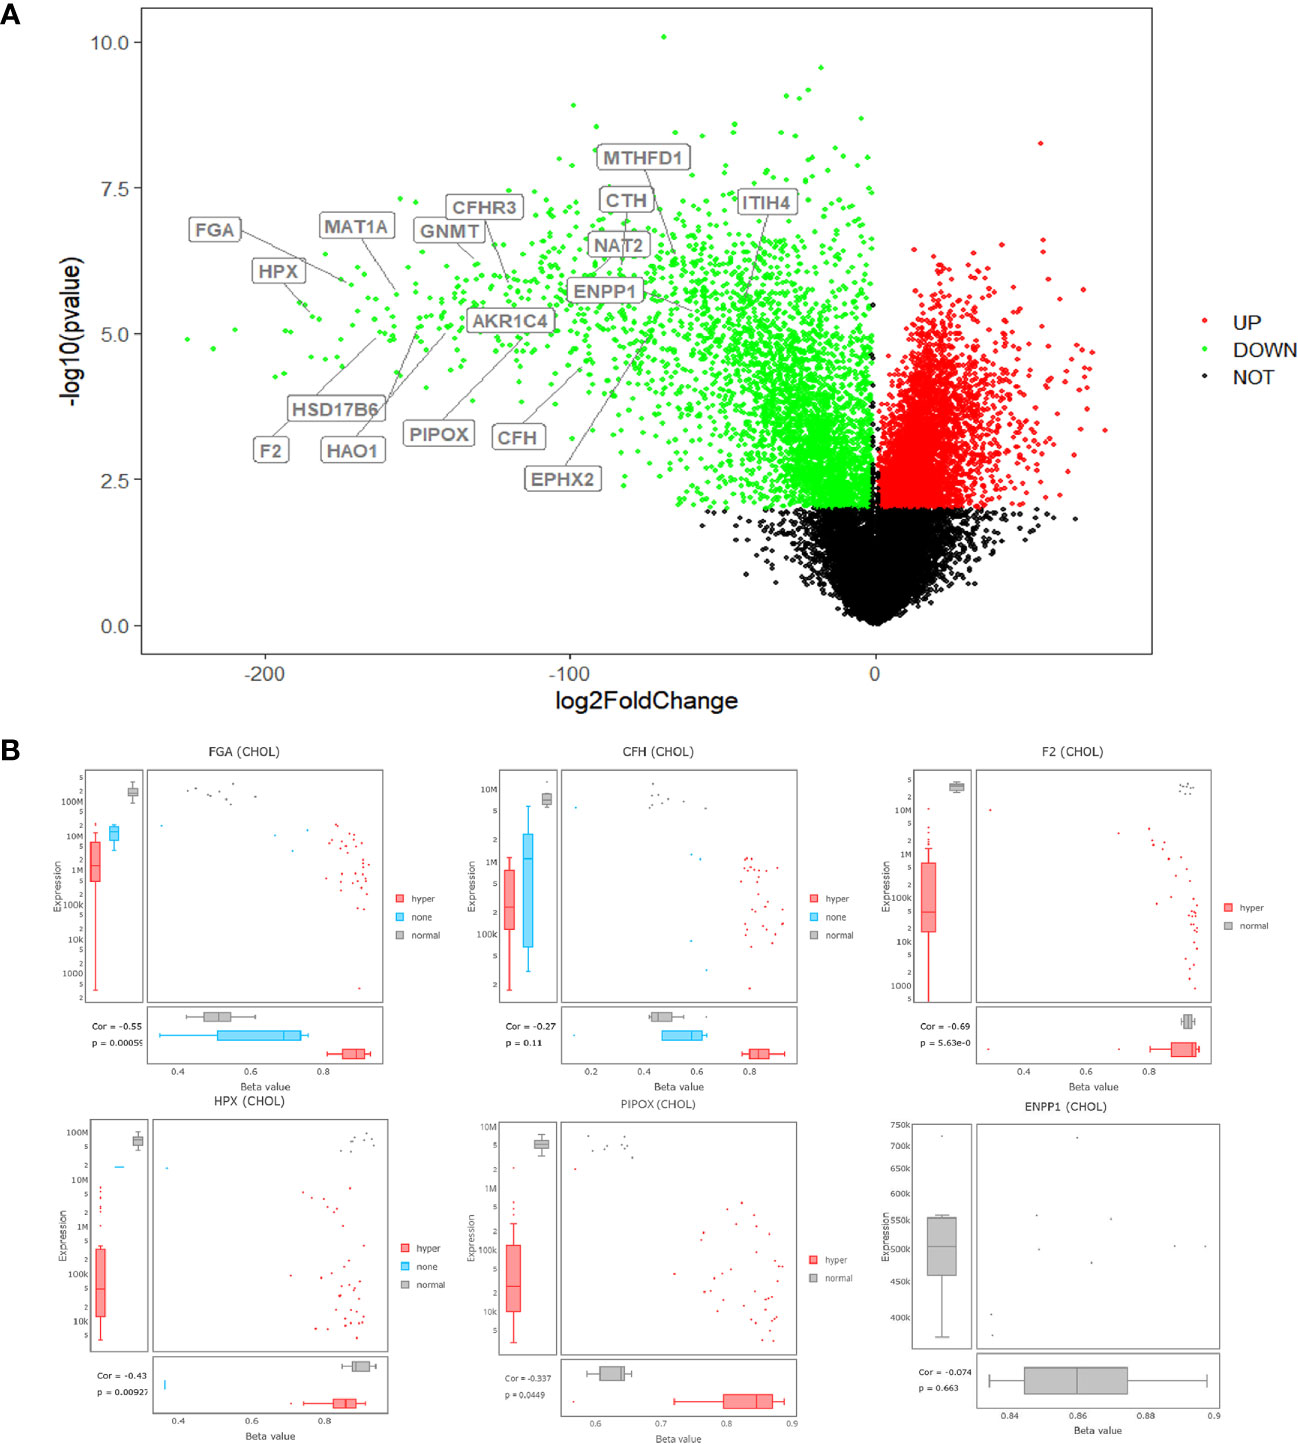
Figure 4 Annotation of core genes. (A) volcano plots for DECs in GBC based on the four microarray datasets from GEO. (B) the levels of methylation of hub genes between the control and GBC cases from TCGA database.
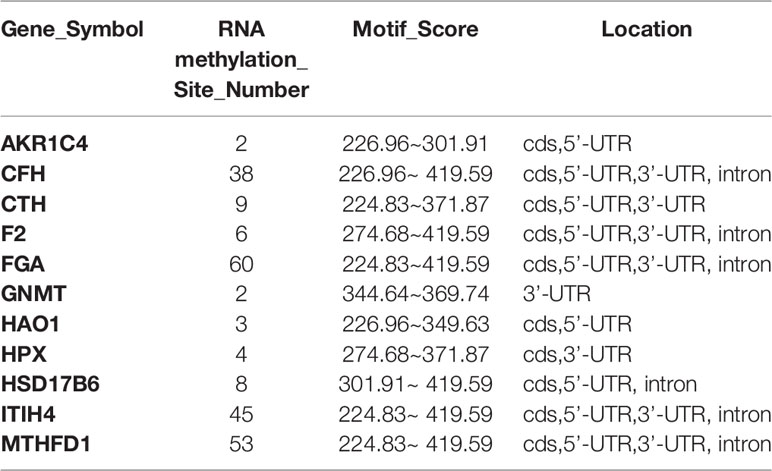
Table 3 RNA methylation sites of hub genes form RMBase database.
Survival Analysis
To illustrate whether any core genes affect the overall survival of GBC patients, survival analysis was used to assess prognostic markers in the TCGA database. The results demonstrated that highly expressed FGA, CFH, ENPP1, CFHR3, ITIH4, and NAT2 were associated with poor prognosis. Specifically, FGA was highly expressed in 14 samples but expressed at low levels in 22 samples. The 5-year overall survival HR was 2.680, and the log-rank P value was 0.037 (Figure 5A). CFH was highly expressed in 14 samples but expressed at low levels in 22 samples, and the 5-year overall survival HR was 3.490, with a log-rank P value of 0.007 (Figure 5B). ENPP1 was highly expressed in 18 samples but expressed at low levels in 18 samples, and the 5-year overall survival HR was 3.250, with a log-rank P value of 0.020 (Figure 5C). CFHR3 was highly expressed in 18 samples but expressed at low levels in 18 samples, and the 5-year overall survival HR was 4.660, with a log-rank P value of 0.003 (Figure 5D). ITIH4 was highly expressed in 18 samples but expressed at low levels in 18 samples; the 5-year overall survival HR was 3.520, and the log-rank P value was 0.004 (Figure 5E). NAT2 was highly expressed in 18 samples but expressed at low levels in 18 samples; the 5-year overall survival HR was 3.250, and the log-rank P value was 0.020 (Figure 5F). Moreover, survival analysis of the other 12 hub genes showed no significant differences (shown in Supplementary Figure 1). In addition, Pearson statistical analysis was performed to calculate the correlation coefficients among 17 core genes from the TCGA CHOL dataset, and the range of correlation coefficients between hub genes was −0.067~0.950, with a P value range of 4.8E-11~0.900 (details shown in Supplementary Table 2 and Figure 6A). The results showed that the FGA gene was positively correlated with ENPP1, NAT2, and CFHR3, while the CFH gene was positively correlated with FGA, NAT2, and CFHR3 (as shown in Figure 6B). Our results provide evidence for further research on RNA methylation in GBC.
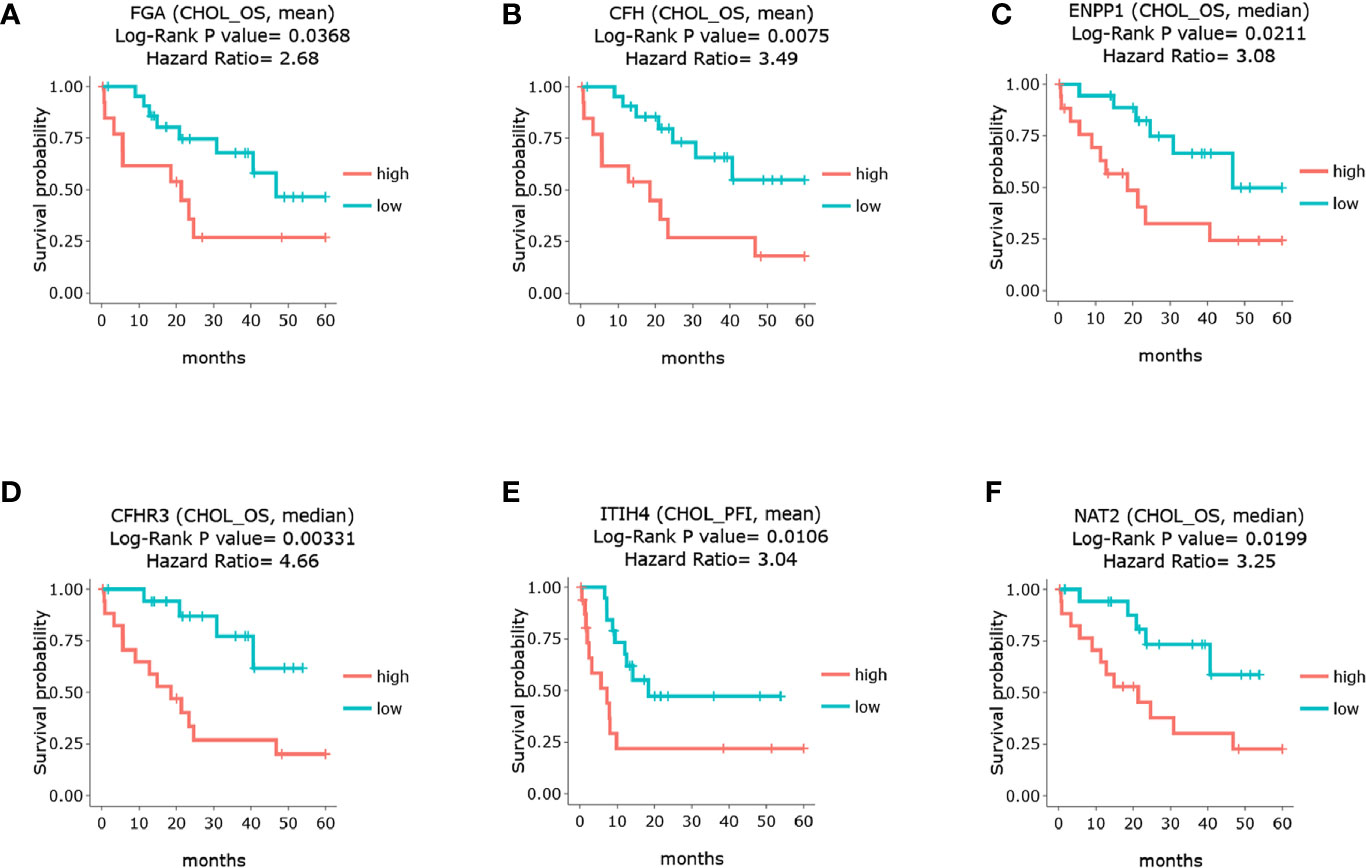
Figure 5 Survival analysis of the core genes in GBC patients through TCGA database. (A) survival analysis of FGA. (B) survival analysis of CFH. (C) survival analysis of ENPP1. (D) survival analysis of CFHR3. (E) survival analysis of ITIH4. (F) survival analysis of NAT2.
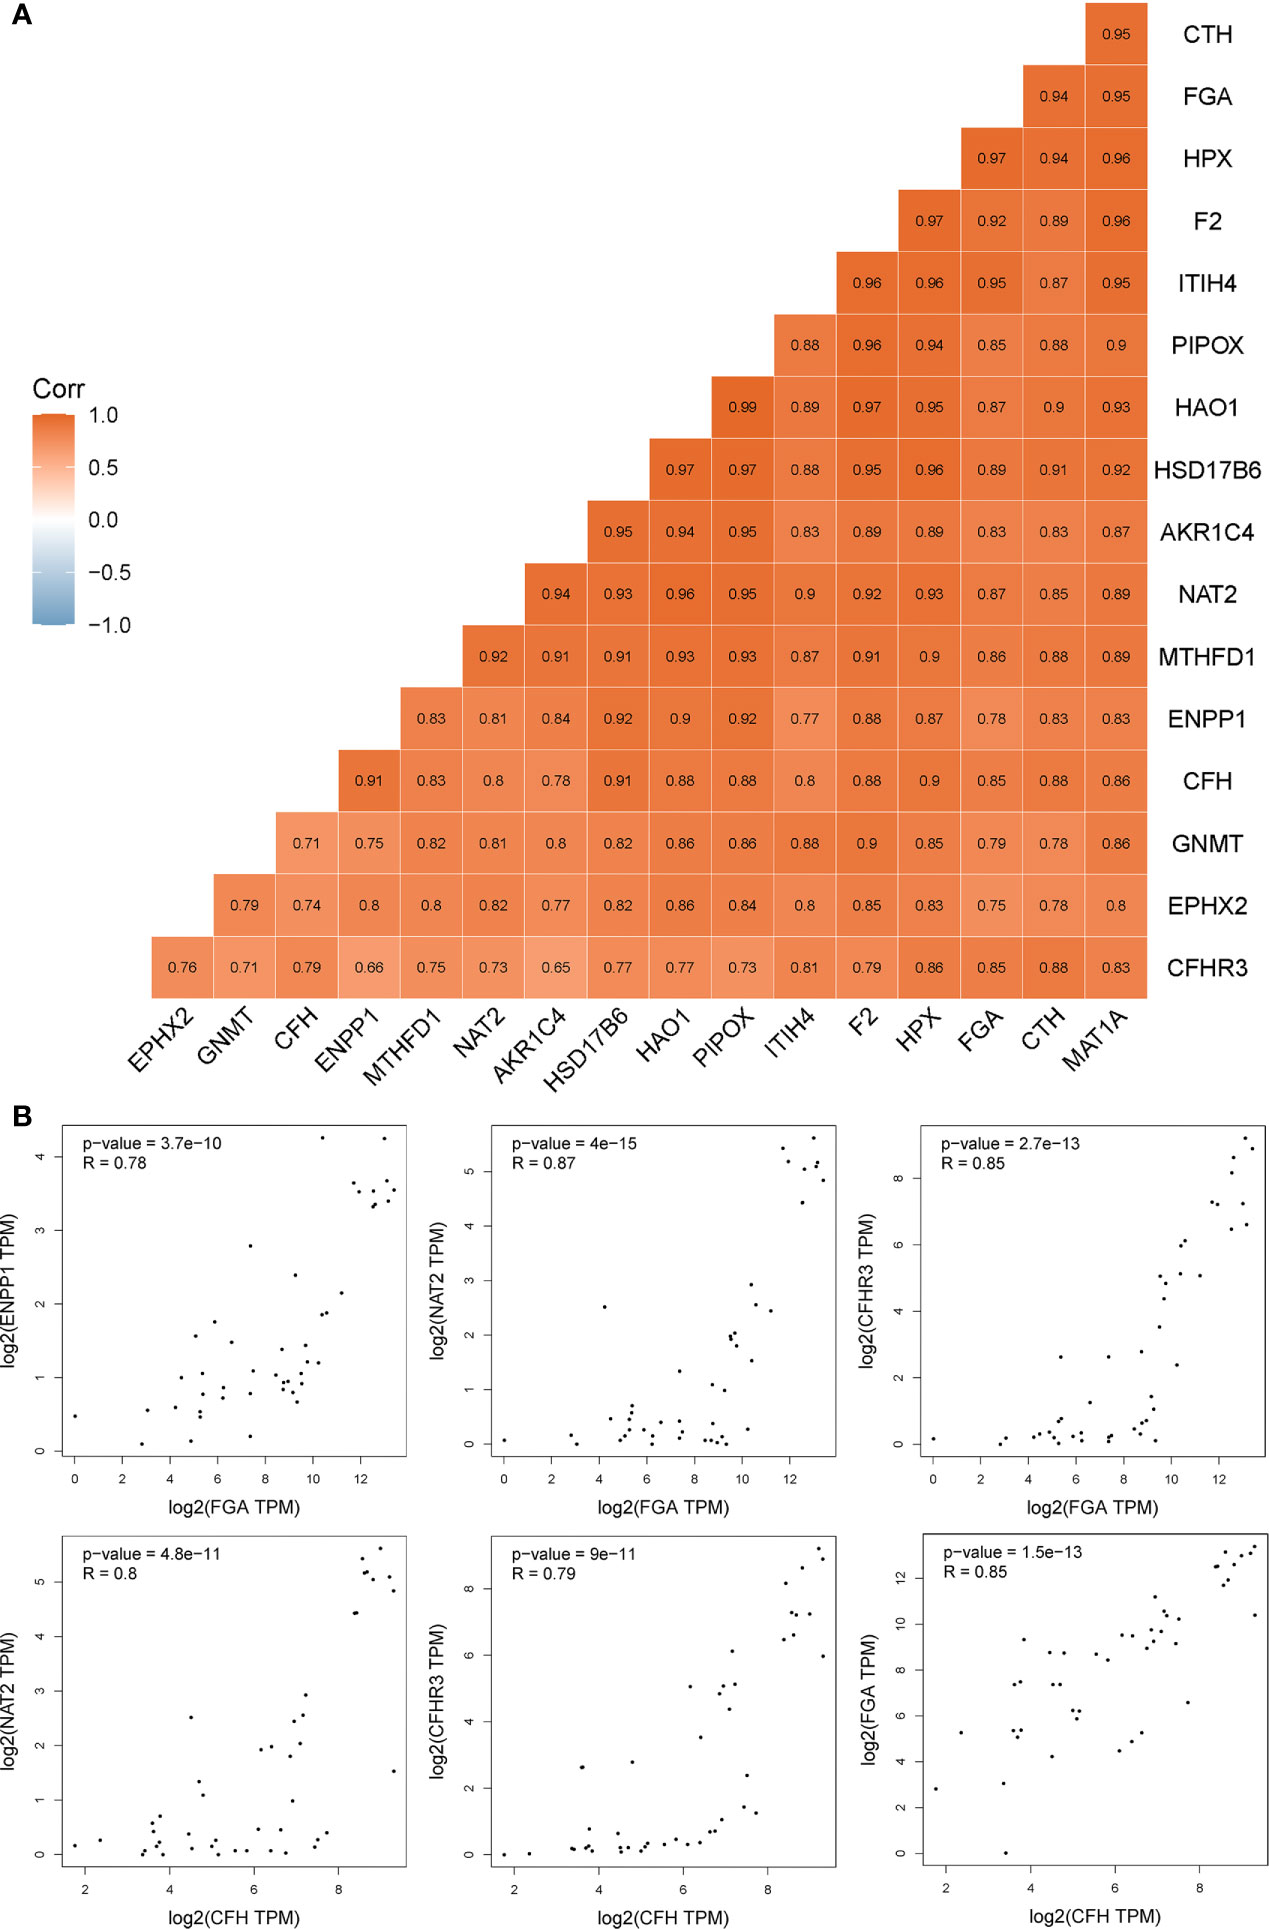
Figure 6 The correlation coefficients among 17 core genes from the TCGA CHOL dataset. (A) the details of correlation coefficients by Pearson statistical analysis among 17 core genes. (B) the genes positively correlated with FGA and CFH.
Coexpression Network and Tumor Microenvironment Prediction
Coexpression network analysis of six genes (FGA, CFH, CFHR3, NAT2, ENPP1, and ITIH4) was carried out through GeneMANIA, and the results are shown in Supplementary Figure 2A. A weighted network was constructed with the following weight values: FGA, 0.003~0.108; CFH, 0.005~0.012; CFHR3, 0.003~0.027; NAT2, 0.006~0.020; ENPP1, 0.004~0.021; and ITIH4, 0.003~0.008. These results indicated that FGA, CFH, CFHR3, NAT2, ENPP1, and ITIH4 had coexpression patterns. The TISCH database was used to predict the tumor microenvironment of these six genes, and the results revealed that the five genes other than NAT2 were specifically expressed in cells, as shown in Supplementary Figure 2A. FGA, CFH, and ITIH4 were expressed mainly in immune cells, malignant cells, and stromal cells, while CFHR3 and ENPP1 were expressed mainly in malignant cells and stromal cells. Our results further illustrated that these genes are closely associated and should be further studied.
Clinical Specimen Verification by Immunohistochemistry
To further verify the expression of hub genes in clinical samples, immunohistochemistry was used. According to the above findings, we screened 13 of the 17 hub genes for immunohistochemistry, including FGA, F2, CFH, PIPOX, ITIH4, GNMT, MAT1A, MTHFD1, HPX, CTH, CFHR3, ENNP1, and NAT2. As shown in Figure 7, the results showed that the expressions of FGA, CFH, PIPOX, GNMT, MAT1A, CFHR3, NAT2, and ENPP1 were higher in GBC tissues than in control tissues, and these proteins were mainly located in the cytoplasm of tumor cells. It is interesting to find that F2, ITIH4, and HPX proteins were mainly expressed in tumor cells of GBC tissues, but these proteins were located mainly in inflammatory cells of control tissues not normal gallbladder epithelium. Besides, MTHFD1 was expressed in both GBC tissues and control tissues, and there was no significant difference between tissue types. In addition, our results showed that CTH was not expressed in either GBC tissues or control tissues.
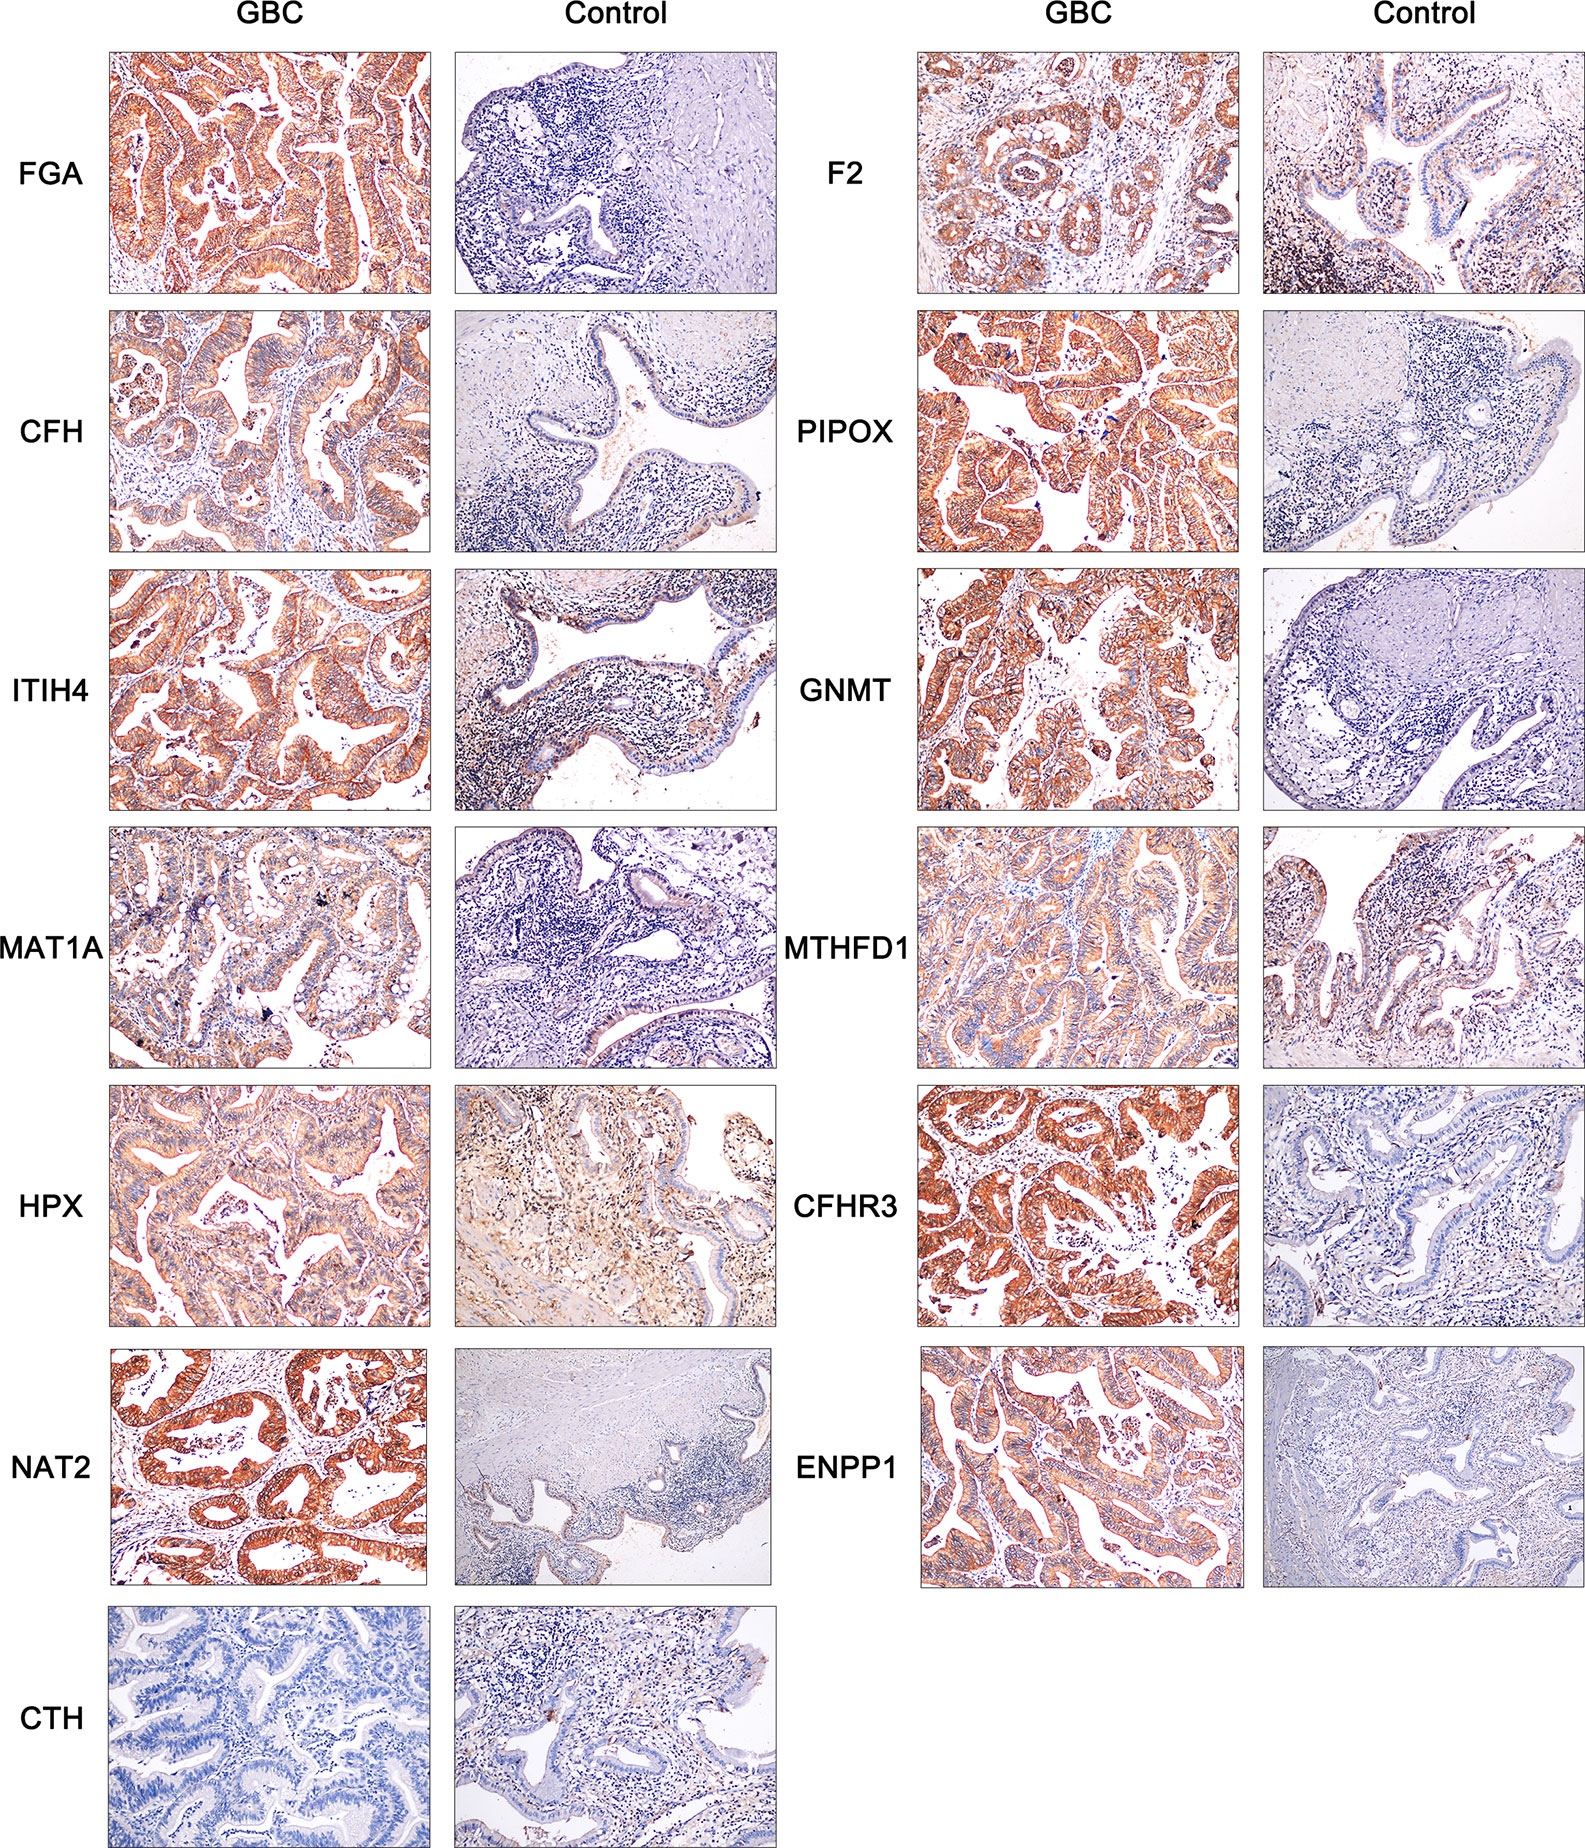
Figure 7 Immunohistochemistry of FGA, F2, CFH, PIPOX, ITIH4, GNMT, MAT1A, MTHFD1, HPX, CTH, CFHR3, ENNP1, and NAT2 in clinical GBC and control specimens.
Discussion
Although some advances in GBC research have been made, effective methods for the early diagnosis of GBC are still very scarce. In this study, 81 differentially expressed genes were identified from four array datasets from the GEO database through bioinformatics analysis and protein-protein interaction analysis. Among the ranked genes, 17 hub genes (FGA, F2, HAO1, CFH, PIPOX, ITIH4, GNMT, MAT1A, MTHFD1, HPX, CTH, EPHX2, HSD17B6, AKR1C4, CFHR3, ENNP1, and NAT2) involved in methylation signaling pathways and bile-related biological processes were confirmed. We performed pathway annotation, TCGA verification, posttranslational modification analysis, survival analysis, and IHC of these hub genes to finally obtain six candidates, including FGA, CFH, ENPP1, ITIH4, CFHR3, and NAT2, associated with GBC prognosis. Among these, FGA and CFH were identified as RNA methylation-related biomarkers in GBC, which may be novel biomarkers to early diagnose and evaluate prognosis for GBC.
The occurrence and progression of GBC is influenced by heredity and the environment, and epigenetic mechanisms, including histone modification (acetylation, methylation, and phosphorylation), have been reported to play important roles in the pathology of GBC (30). RNA methylation, which is one of the most common posttranscriptional modifications of RNAs, has recently been found to participate in tumorigenesis, invasion, metastasis, and drug resistance and could be a new diagnostic biomarker and therapeutic target (5). One study recently illustrated that NOP2/Sun domain family member 2 (NSUN2), a nuclear RNA methyltransferase catalyzing 5‐methylcytosine formation, closely interacts with RPL6 to participate in GBC (31). However, research on the role of RNA methylation in gallbladder cancer is still very rare. In our present study, we finally identified 17 hub genes, among which FGA, CFH, F2, HPX, and PIPOX were highly methylated in GBC tissues. Surprisingly, our bioinformatics results showed that PIPOX has no methylation modification site. Next, we used clinical samples for verification and discovered that FGA, CFH, F2, HPX, and PIPOX were more highly expressed in GBC tissues than in control tissues but that expression was not significantly different. FGA encodes the alpha subunit of the coagulation factor fibrinogen, and downregulation of FGA seems to be associated with poor prognosis in human lung cancer (32). However, in our study, we found that FGA was highly expressed in GBC tissues from patients with a poor prognosis. Thus, it will be interesting to further explore the effect and underlying mechanism of FGA in GBC and whether FGA could be an indicator of the specific diagnosis of GBC. Complement factor H (CFH) was recently found to regulate complement activation in the liver, which is associated with hepatocellular injury (33), but our results demonstrated that there was no significant difference in CFH expression between GBC and control tissues. F2, known as coagulation factor II, encoding the prothrombin protein, was recently reported to be aberrantly methylated in old Chinese rhesus macaques, which is similar to our findings (34). HPX (hemagglutinin) is a plasma acute-phase glycoprotein produced by the liver that binds with high affinity to equimolar heme, and it can counteract cardiac heme toxicity such as that caused by oxidative stress, disruption of cardiac Ca2+ homeostasis and contractile dysfunction (35). PIPOX, which is a sarcosine-metabolizing enzyme, is highly expressed in HER-2 type cancer (36) but expressed at low levels in prostate cancer (33). We found that PIPOX was more highly expressed in GBC tissues than in control gallbladder tissues but that it has no methylation site. Differences in PIPOX expression in different tumors may be related to sarcosine metabolism, which also needs further study.
Aside from the above five methylation-related genes, other genes involved in bile-related biological processes, including CTH, GNMT, HAO1, TIH4, MAT1A, and MTHFD1, were identified. Abnormalities in bile metabolism, including increased biliary secretion (37) and hyposecretion of biliary bile acids (38), are closely related to gallstones, which are known risk factors for GBC (39). Therefore, we believe that these hub genes may have important clinical significance in the pathogenesis, diagnosis, and treatment of GBC. Increased CTH (Cystathionine Gamma-Lyase) expression in patients with advanced prostate cancer is associated with poor survival, and H2S produced by CTH promotes the progression and metastasis of prostate cancer through the IL-1β/NF-κB signaling pathway (40). GNMT (Glycine N-Methyltransferase) catalyzes the methylation of glycine to form sarcosine, but in this study, we found that it mainly participates in bile metabolism and has little to do with the methylation of hub genes in the development of gallbladder cancer (41). HAO1, encoding the enzyme hydroxyacid oxidase 1, is expressed primarily in the liver and is related to primary hyperoxaluria type 1 (42). ITIH4, inter-alpha-trypsin inhibitor heavy chain 4, is an acute response protein that is secreted primarily by the liver and associated with hepatocellular carcinoma (43). It has been found that crosstalk between FOXM1/NF‐κB and MAT1A (methionine adenosyl transferase 1A) may affect tumorigenesis in liver cancer, but little is known about MAT1A in GBC (44). MTHFD1, methylenetetrahydrofolate dehydrogenase, cyclohydrolase, and formyltetrahydrofolate synthetase 1, has also been reported to be overexpressed in hepatocellular carcinoma and to predict poor survival and recurrence (45).
On account of the results above, FGA, CFH, ENPP1, ITIH4, CFHR3, and NAT2 were highly expressed in GBC tissues than control tissues, and associated with GBC prognosis. In addition, FGA and CFH were identified as RNA methylation-related biomarkers in GBC, which may be novel biomarkers to early diagnose and evaluate prognosis for GBC.
Conclusion
In conclusion, by utilizing a comprehensive strategy of big data mining and computational biology, we constructed a protein-protein interaction network and ranked genes, ultimately finding that the core genes FGA, F2, HAO1, CFH, PIPOX, ITIH4, GNMT, MAT1A, MTHFD1, HPX, CTH, EPHX2, HSD17B6, AKR1C4, CFHR3, ENNP1, and NAT2 are involved in methylation signaling pathways and bile-related biological processes in GBC. We performed pathway annotation, TCGA verification, posttranslational modification analysis, survival analysis, and IHC on these core genes to finally obtain six candidates, including FGA, CFH, ENPP1, ITIH4, CFHR3 and NAT2, associated with prognosis in GBC, and FGA and CFH were identified as RNA methylation-related biomarkers in GBC. Focusing on development and epigenetic changes such as RNA methylation may be helpful for early diagnosis of GBC, and we have reason to believe that detection of the RNA methylation levels of FGA and CFH could be used as a potential diagnostic and prognostic evaluation strategy. Moreover, whether the detection of circulating cell-free RNA of FGA and CFH is effective to diagnose the early stage of GBC will be further studied in our subsequent experiments.
Data Availability Statement
The original contributions presented in the study are included in the article/Supplementary Material. Further inquiries can be directed to the corresponding authors.
Ethics Statement
The studies involving human participants were reviewed and approved by the ethics committee of Chongqing Medical University. The patients/participants provided their written informed consent to participate in this study. Written informed consent was obtained from the individual(s) for the publication of any potentially identifiable images or data included in this article.
Author Contributions
CY and NJ conceived and designed this research. ZY, JL, and XL collected and downloaded the relative data. CY and JC analyzed the data and processed them. BZ collected clinical samples and performed histochemistry. NJ wrote the paper. All authors contributed to the article and approved the submitted version.
Funding
This work was supported by The National Natural Science Foundation of Chongqing of China (No. cstc2020jcyj-bshX0069).
Conflict of Interest
The authors declare that the research was conducted in the absence of any commercial or financial relationships that could be construed as a potential conflict of interest.
Abbreviation
GBC, gallbladder carcinoma; DEGs, differentially expressed genes; RRA, RobustRankAggreg; PPI, protein-protein interaction; IHC, immunohistochemistry; TCGA, the Cancer Genome Atlas; GEO, gene expression omnibus; NCBI, national coalition building institute; KEGG, Kyoto encyclopedia of genes and genomes; EBI, European bioinformatics institute; limma, the linear models for microarray data; GO, gene ontology; FDR, false discovery rate; CHOL, cholangio carcinoma; SNP, single nucleotide polymorphisms; OS, overall survival; HR, hazard ratio; TISCH, the Tumor Immune Single-cell Hub database; FGA, fibrinogen alpha chain; F2, coagulation factor II; HAO1, the enzyme hydroxyacid oxidase 1; CFH, complement factor H; PIPOX, pipecolic acid and sarcosine oxidase; ITIH4, inter-alpha-trypsin inhibitor heavy chain 4; GNMT, glycine N-methyltransferase; MAT1A, methionine adenosyl transferase 1A; MTHFD1, methylenetetrahydrofolate dehydrogenase, cyclohydrolase, and formyltetrahydrofolate synthetase 1; HPX, hemagglutinin; CTH, cystathionine gamma-Lyase; EPHX2, epoxide hydrolase 2; HSD17B6, hydroxysteroid 17-Beta Dehydrogenase 6; AKR1C4, Aldo-Keto reductase family 1 member C4; CFHR3, complement factor H related 3; ENNP1, ectonucleotide pyrophosphatase/phosphodiesterase 1; NAT2, N-acetyltransferase 2; NSUN2, NOP2/Sun domain family member 2.
Supplementary Material
The Supplementary Material for this article can be found online at: https://www.frontiersin.org/articles/10.3389/fonc.2021.621806/full#supplementary-material
References
1. Montalvo-Jave EE, Rahnemai-Azar AA, Papaconstantinou D, Deloiza ME, Tsilimigras DI, Moris D, et al. Molecular pathways and potential biomarkers in gallbladder cancer: A comprehensive review. Surg Oncol (2019) 31:83–9. doi: 10.1016/j.suronc.2019.09.006
2. Ashai N, Prasad P, Rajdev L. Multimodality Management of Localized Biliary Cancer. Curr Treat Options Oncol (2019) 20(7):58. doi: 10.1007/s11864-019-0655-0
3. Miller G, Jarnagin WR. Gallbladder carcinoma. Eur J Surg Oncol (2008) 34(3):306–12. doi: 10.1016/j.ejso.2007.07.206
4. Ma S, Chen C, Ji X, Liu J, Zhou Q, Wang G, et al. The interplay between m6A RNA methylation and noncoding RNA in cancer. J Hematol Oncol (2019) 12(1):121. doi: 10.1186/s13045-019-0805-7
5. Pan Y, Ma P, Liu Y, Li W, Shu Y. Multiple functions of m 6 A RNA methylation in cancer. J Hematol Oncol (2018) 11(1):48. doi: 10.1186/s13045-018-0590-8
6. Wang Y, Li Y, Yue M, Wang J, Kumar S, Wechsler-Reya RJ, et al. N 6-methyladenosine RNA modification regulates embryonic neural stem cell self-renewal through histone modifications. Nat Neurosci (2018) 21(2):195–206. doi: 10.1038/s41593-017-0057-1
7. Lichinchi G, Gao S, Saletore Y, Gonzalez GM, Bansal V, Wang Y, et al. Dynamics of the human and viral m(6)A RNA methylomes during HIV-1 infection of T cells. Nat Microbiol (2016) 1:16011. doi: 10.1038/nmicrobiol.2016.11
8. Barbieri I, Tzelepis K, Pandolfini L, Shi J, Millán-Zambrano G, Robson SC, et al. Promoter-bound METTL3 maintains myeloid leukaemia by m6A-dependent translation control. Nature (2017) 552(7683):126–31. doi: 10.1038/nature24678
9. Kasowitz SD, Ma J, Anderson SJ, Leu NA, Xu Y, Gregory BD, et al. Nuclear m6A reader YTHDC1 regulates alternative polyadenylation and splicing during mouse oocyte development. PloS Genet (2018) 14(5):e1007412. doi: 10.1371/journal.pgen.1007412
10. Shi H, Wang X, Lu Z, Zhao BS, Ma H, Hsu PJ, et al. YTHDF3 facilitates translation and decay of N6-methyladenosine-modified RNA. Cell Res (2017) 27(3):315–28. doi: 10.1038/cr.2017.15
11. Cheng M, Sheng L, Gao Q, Xiong Q, Zhang H, Wu M, et al. The m6A methyltransferase METTL3 promotes bladder cancer progression via AFF4/NF-κB/MYC signaling network. Oncogene (2019) 38(19):3667–80. doi: 10.1038/s41388-019-0683-z
12. Liu J, Eckert MA, Harada BT, Liu SM, Lu Z, Yu K, et al. m6A mRNA methylation regulates AKT activity to promote the proliferation and tumorigenicity of endometrial cancer. Nat Cell Biol (2018) 20(9):1074–83. doi: 10.1038/s41556-018-0174-4
13. Lin S, Choe J, Du P, Triboulet R, Gregory RI. The m6A methyltransferase METTL3 promotes translation in human cancer cells. Mol Cell (2016) 62(3):335–45. doi: 10.1016/j.molcel.2016.03.021
14. Ma JZ, Yang F, Zhou CC, Liu F, Yuan JH, Wang F, et al. METTL14 suppresses the metastatic potential of hepatocellular carcinoma by modulating N6 -methyladenosine-dependent primary MicroRNA processing. Hepatology (2017) 65(2):529–43. doi: 10.1002/hep.28885
15. Dai D, Wang H, Zhu L, Jin H, Wang X. N6-methyladenosine links RNA metabolism to cancer progression. Cell Death Dis (2018) 9(2):124. doi: 10.1038/s41419-017-0129-x
16. Patil DP, Chen CK, Pickering BF, Chow A, Jackson C, Guttman M, et al. m(6)A RNA methylation promotes XIST-mediated transcriptional repression. Nature (2016) 537(7620):369–73. doi: 10.1038/nature19342
17. Chen M, Wei L, Law CT, Tsang FH, Shen J, Cheng CL, et al. RNA N6-methyladenosine methyltransferase-like 3 promotes liver cancer progression through YTHDF2-dependent posttranscriptional silencing of SOCS2. Hepatology (2018) 67(6):2254–70. doi: 10.1002/hep.29683
18. Zhou S, Bai ZL, Xia D, Zhao ZJ, Zhao R, Wang YY, et al. FTO regulates the chemo-radiotherapy resistance of cervical squamous cell carcinoma (CSCC) by targeting β-catenin through mRNA demethylation. Mol Carcinog (2018) 57(5):590–7. doi: 10.1002/mc.22782
19. Ma MZ, Zhang Y, Weng MZ, Wang SH, Hu Y, Hou ZY, et al. Long noncoding RNA GCASPC, a target of miR-17-3p, negatively regulates pyruvate carboxylase-dependent cell proliferation in gallbladder cancer. Cancer Res (2016) 76(18):5361–71. doi: 10.1158/0008-5472.CAN-15-3047
20. Liang HB, Cao Y, Ma Q, Shu YJ, Wang Z, Zhang F, et al. MYBL2 is a potential prognostic marker that promotes cell proliferation in gallbladder cancer. Cell Physiol Biochem (2017) 41(5):2117–31. doi: 10.1159/000475454
21. Matsushita S, Onishi H, Nakano K, Nagamatsu I, Imaizumi A, Hattori M, et al. Hedgehog signaling pathway is a potential therapeutic target for gallbladder cancer. Cancer Sci (2014) 105(3):272–80. doi: 10.1111/cas.12354
22. Li M, Liu F, Zhang F, Zhou W, Jiang X, Yang Y, et al. Genomic ERBB2/ERBB3 mutations promote PD-L1-mediated immune escape in gallbladder cancer: a whole-exome sequencing analysis. Gut (2019) 68(6):1024–33. doi: 10.1136/gutjnl-2018-316039
23. Kolde R, Laur S, Adler P, Vilo J. Robust rank aggregation for gene list integration and meta-analysis. Bioinformatics (2012) 28(4):573–80. doi: 10.1093/bioinformatics/btr709
24. Ge SX, Jung D, Jung D, Yao R. ShinyGO: A graphical gene-set enrichment tool for animals and plants. Bioinformatics (2020) 36(8):2628–9. doi: 10.1093/bioinformatics/btz931
25. Deng M, Brägelmann J, Schultze JL, Perner S. Web-TCGA: an online platform for integrated analysis of molecular cancer data sets. BMC Bioinformatics (2016) 17:72. doi: 10.1186/s12859-016-0917-9
26. Xuan JJ, Sun WJ, Lin PH, Zhou KR, Liu S, Zheng LL, et al. RMBase v2.0: deciphering the map of RNA modifications from epitranscriptome sequencing data. Nucleic Acids Res (2018) 46(D1):D327–34. doi: 10.1093/nar/gkx934
27. Zheng Y, Nie P, Peng D, He Z, Liu M, Xie Y, et al. m6AVar: a database of functional variants involved in m6A modification. Nucleic Acids Res (2018) 46(D1):D139–45. doi: 10.1093/nar/gkx895
28. Sun D, Wang J, Han Y, Dong X, Ge J, Zheng, et al. TISCH: a comprehensive web resource enabling interactive single-cell transcriptome visualization of tumor microenvironment. Nucleic Acids Res (2021) 49(D1):D1420–30. doi: 10.1093/nar/gkaa1020
29. Clough E, Barrett T. The gene expression omnibus database. Methods Mol Biol. Springer (2016) 1418:93–110. doi: 10.1007/978-1-4939-3578-9_5
30. Tiwari PK. Epigenetic Biomarkers in Gallbladder Cancer. Trends Cancer (2020) 6(7):540–3. doi: 10.1016/j.trecan.2020.03.003
31. Gao Y, Wang Z, Zhu Y, Zhu Q, Yang Y, Jin Y, et al. NOP2/Sun RNA methyltransferase 2 promotes tumor progression via its interacting partner RPL6 in gallbladder carcinoma. Cancer Sci (2019) 110(11):3510–9. doi: 10.1111/cas.14190
32. Wang M, Zhang G, Zhang Y, Cui X, Wang S, Gao S, et al. Fibrinogen Alpha Chain Knockout Promotes Tumor Growth and Metastasis through Integrin-AKT Signaling Pathway in Lung Cancer. Mol Cancer Res (2020) 18(7):943–54. doi: 10.1158/1541-7786.MCR-19-1033
33. Khan AP, Rajendiran TM, Ateeq B, Asangani IA, Athanikar JN, Yocum AK, et al. The role of sarcosine metabolism in prostate cancer progression. Neoplasia (2013) 15(5):491–501. doi: 10.1593/neo.13314
34. Zhou M, Zhang L, Yang Q, Yan C, Jiang P, Lan Y, et al. Age-related gene expression and DNA methylation changes in rhesus macaque. Genomics (2020) 112(6):5147–56. doi: 10.1016/j.ygeno.2020.09.021
35. Ingoglia G, Sag CM, Rex N, De Franceschi L, Vinchi F, Cimino J, et al. Hemopexin counteracts systolic dysfunction induced by heme-driven oxidative stress. Free Radic Biol Med (2017) 108:452–64. doi: 10.1016/j.freeradbiomed.2017.04.003
36. Yoon JK, Kim DH, Koo JS. Implications of differences in expression of sarcosine metabolism-related proteins according to the molecular subtype of breast cancer. J Transl Med (2014) 7(11):7824–33. doi: 10.1186/1479-5876-12-149
37. Nepokroeff CM, Lakshmanan MR, Ness GC, Dugan RE, Porter JW. Regulation of the diurnal rhythm of rat liver beta-hydroxy-beta-methylglutaryl coenzmye A reductase activity by insulin, glucagon, cyclic AMP and hydrocortisone. Arch Biochem Biophys (1974) 160(2):387–96. doi: 10.1016/0003-9861(74)90412-3
38. Subbiah MT, Yunker RL. Cholesterol 7 alpha-hydroxylase of rat liver: an insulin sensitive enzyme. Biochem Biophys Res Commun (1984) 124(3):896–902. doi: 10.1016/0006-291X(84)91042-8
39. Lee DK, Jang SI. Pathogenesis and treatment of gallbladder stone. Diseases of the Gallbladder. (2020). p. 85–100. doi: 10.1007/978-981-15-6010-1_8
40. Wang YH, Huang JT, Chen WL, Wang RH, Kao MC, Pan YR, et al. Dysregulation of cystathionine γ-lyase promotes prostate cancer progression and metastasis. EMBO Rep (2019) 20(10):e45986. doi: 10.15252/embr.201845986
41. Chen M, Yang M-H, Chang M-M, Tyan Y-C, Chen Y-MA. Tumor suppressor gene glycine N-methyltransferase and its potential in liver disorders and hepatocellular carcinoma. Toxicol Appl Pharmacol (2019) 378:114607. doi: 10.1016/j.taap.2019.114607
42. Querbes W, Fitzgerald K, Bettencourt B, Liebow A, Erbe DV. Compositions and methods for inhibition of HAO1 (Hydroxyacid Oxidase 1 (Glycolate Oxidase)) gene expression. U.S. Patent and Trademark Office (2019) U.S. Patent 10,478,500.
43. Nakamura N, Hatano E, Iguchi K, Sato M, Kawaguchi H, Ohtsu I, et al. Elevated levels of circulating ITIH4 are associated with hepatocellular carcinoma with nonalcoholic fatty liver disease: from pig model to human study. BMC Cancer (2019) 19(1):621. doi: 10.1186/s12885-019-5825-8
44. Li Y, Lu L, Tu J, Zhang J, Xiong T, Fan W, et al. Reciprocal Regulation Between Forkhead Box M1/NF-κB and Methionine Adenosyltransferase 1A Drives Liver Cancer. Hepatology (2020) 72(5):1682–700. doi: 10.1002/hep.31196
Keywords: gallbladder carcinoma, bioinformatics, biomarkers, differentially expressed genes, RNA methylation, bile metabolism
Citation: Yang C, Chen J, Yu Z, Luo J, Li X, Zhou B and Jiang N (2021) Mining of RNA Methylation-Related Genes and Elucidation of Their Molecular Biology in Gallbladder Carcinoma. Front. Oncol. 11:621806. doi: 10.3389/fonc.2021.621806
Received: 27 October 2020; Accepted: 11 January 2021;
Published: 25 February 2021.
Edited by:
Yujun Shi, Sichuan University, ChinaReviewed by:
Zhengjun Zhou, Fudan University, ChinaChuang Zhou, First Affiliated Hospital of Zhengzhou University, China
Copyright © 2021 Yang, Chen, Yu, Luo, Li, Zhou and Jiang. This is an open-access article distributed under the terms of the Creative Commons Attribution License (CC BY). The use, distribution or reproduction in other forums is permitted, provided the original author(s) and the copyright owner(s) are credited and that the original publication in this journal is cited, in accordance with accepted academic practice. No use, distribution or reproduction is permitted which does not comply with these terms.
*Correspondence: Baoyong Zhou, c2RseXRjemh6aEAxNjMuY29t; Ning Jiang, amlhbmduaW5nQGNxbXUuZWR1LmNu