 Alix de Causans1,2,3†
 Alexandre Carré4,5†
 Alexandre Roux2,3,6Arnault Tauziède-Espariat2,3,7
 Samy Ammari8,9Edouard Dezamis2,3,6
 Frederic Dhermain4,5
 Sylvain Reuzé4,5
 Eric Deutsch4,5Catherine Oppenheim1,2,3Pascale Varlet2Johan Pallud2,3,6Myriam Edjlali1,2,3‡
 Charlotte Robert4,5*‡
- 1Neuroradiology Department, Hôpital Sainte-Anne, GHU-Paris Psychiatrie et Neurosciences, Paris, France
- 2Université de Paris, Paris, France
- 3Inserm, UMR1266, IMA-Brain, Institut de Psychiatrie et Neurosciences, Paris, France
- 4Radiothérapie Moléculaire et Innovation Thérapeutique, INSERM UMR1030, Gustave Roussy Cancer Campus, Université Paris Saclay, Villejuif, France
- 5Département de Radiothérapie, Gustave Roussy, Université Paris Saclay, Villejuif, France
- 6Service de Neurochirurgie, GHU Paris – Psychiatrie et Neurosciences – Hôpital Sainte-Anne, Paris, France
- 7Service de Neuropathologie, GHU Paris – Psychiatrie et Neurosciences – Hôpital Sainte-Anne, Paris, France
- 8Département de Radiologie, Gustave Roussy, Université Paris Saclay, Villejuif, France
- 9BioMaps UMR1281, Université Paris-Saclay, CNRS, INSERM, CEA, Orsay, France
Objectives: To differentiate Glioblastomas (GBM) and Brain Metastases (BM) using a radiomic features-based Machine Learning (ML) classifier trained from post-contrast three-dimensional T1-weighted (post-contrast 3DT1) MR imaging, and compare its performance in medical diagnosis versus human experts, on a testing cohort.
Methods: We enrolled 143 patients (71 GBM and 72 BM) in a retrospective bicentric study from January 2010 to May 2019 to train the classifier. Post-contrast 3DT1 MR images were performed on a 3-Tesla MR unit and 100 radiomic features were extracted. Selection and optimization of the Machine Learning (ML) classifier was performed using a nested cross-validation. Sensitivity, specificity, balanced accuracy, and area under the receiver operating characteristic curve (AUC) were calculated as performance metrics. The model final performance was cross-validated, then evaluated on a test set of 37 patients, and compared to human blind reading using a McNemar’s test.
Results: The ML classifier had a mean [95% confidence interval] sensitivity of 85% [77; 94], a specificity of 87% [78; 97], a balanced accuracy of 86% [80; 92], and an AUC of 92% [87; 97] with cross-validation. Sensitivity, specificity, balanced accuracy and AUC were equal to 75, 86, 80 and 85% on the test set. Sphericity 3D radiomic index highlighted the highest coefficient in the logistic regression model. There were no statistical significant differences observed between the performance of the classifier and the experts’ blinded examination.
Conclusions: The proposed diagnostic support system based on radiomic features extracted from post-contrast 3DT1 MR images helps in differentiating solitary BM from GBM with high diagnosis performance and generalizability.
Introduction
Brain Metastases (BM) and Glioblastomas (GBM) are the two most frequent intra-cranial brain tumors in adults (1–3). Currently, Magnetic Resonance Imaging (MRI) is the modality of choice for brain tumor characterization. Usually, BM present an encapsulated contrast enhancement, with regular and well-defined boundaries, whereas GBM have heterogeneous contrast enhancement with very irregular and fuzzy boundaries (4–6). Nonetheless, their morphological characteristics remain very similar on MRI as both are lesions with annular contrast enhancement, having a necrotic center and a peritumoral zone in T2-weighted and Fluid-Attenuated Inversion Recovery (FLAIR) sequences. Advanced neuroimaging techniques such as perfusion MRI and Magnetic Resonance Spectroscopy (MRS) provide additional information to distinguish between the two tumor types, based on differences in the peritumoral area (7–10). Although in the past decades, various studies (11–13) have evaluated the diagnostic performance of perfusion imaging and MRS, they have shown heterogeneous results in distinguishing these two tumor types, resulting in sensitivities and specificities ranging from 64 to 100% and 60 to 100% respectively. This high heterogeneity reflects the difficulty experienced in daily practice to differentiate the two brain tumors, even using advanced neuroimaging techniques, particularly in the case of differentiating a GBM from a solitary BM revealing an unknown primary cancer [5 to 12% of BM (14, 15)]. Even though the final diagnostic will be given by a histopathological examination and a biomolecular analysis of the tumor tissue relying on the 2016 WHO classification (16), the presurgical distinction between these two types of tumors is crucial for adapting treatment strategies: for metastases less than 3–4 cm, a bloc resection or stereotactic radiosurgery will be planned depending on the lesion location (17), while GBM (18) should be treated with maximal safe resection, and concurrent chemoradiotherapy. Radiomics (19–22) is a recent area of research based on the simple observation that the human eyes have limitations, even those trained for medical image interpretation. Radiomics consists of extracting large numbers of predefined quantitative features from medical images with the ultimate goal of identifying subgroups of biomarkers able to guide patient’s care and has shown promise in brain cancer detection, diagnosis, molecular mutation characterization, prognosis and outcome prediction (23–29). In our study, we hypothesized that the morphological differences observed on post-contrast 3DT1 MR images would lead to differences in radiomic features between the two tumor types. The aim of this study was to therefore develop a radiomic features-based Machine Learning (ML) classifier, to evaluate its diagnostic performance on an unseen test set of patients, and to compare it to the diagnosis performance of neuroradiologists. A strong emphasis was placed on favoring explainable classifiers to ease translation into clinic.
Materials and Methods
The steps of our study are summarized in Figure 1.
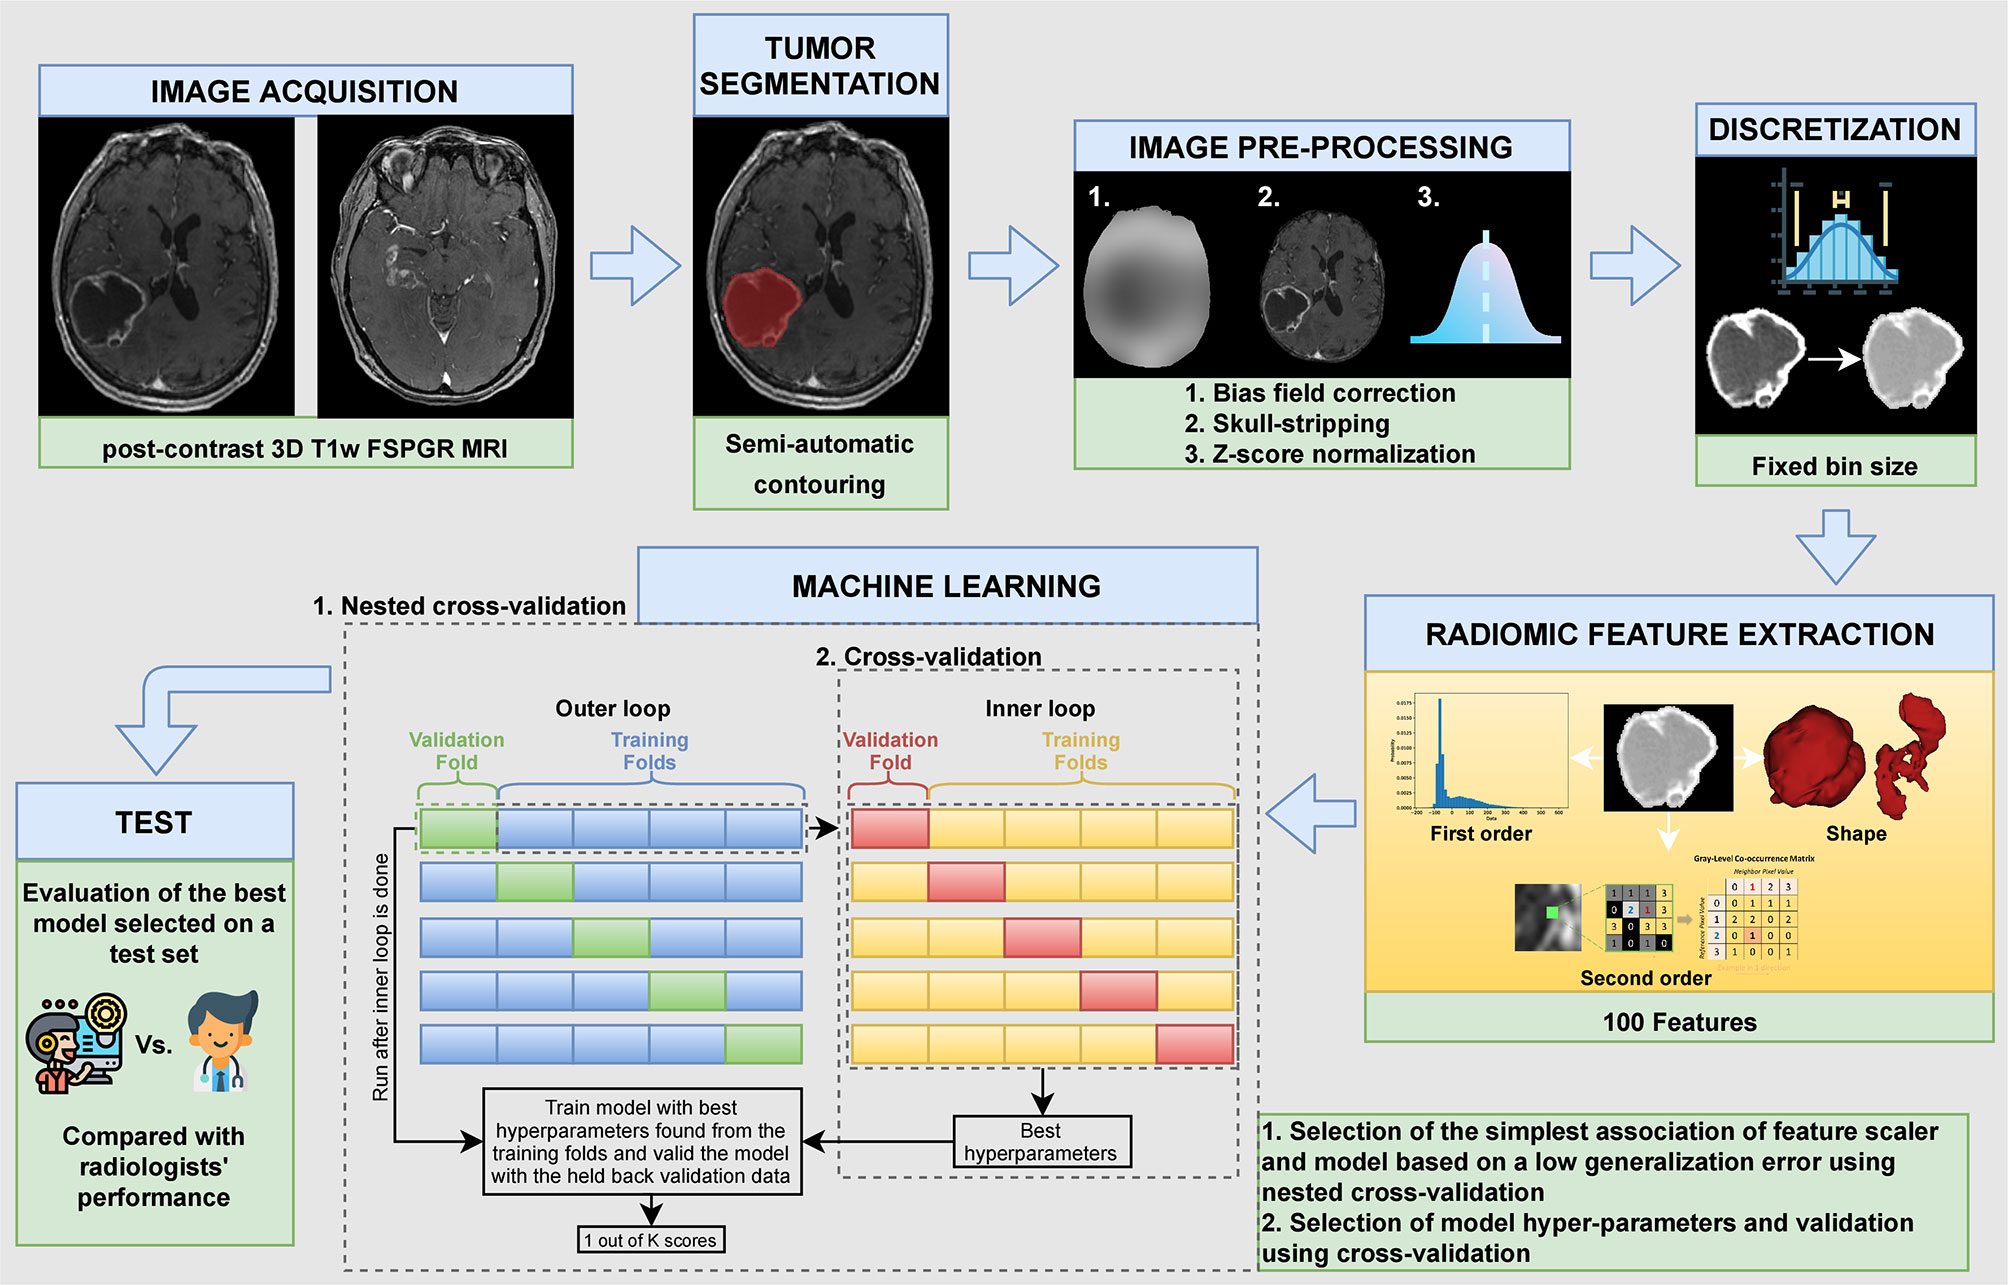
Figure 1 Different steps of the study.
Patients
This retrospective bicentric study was approved by the local institutional review board (n° IRB00011687 College de neurochirurgie IRB #1: 2020/29). The two Radiology Departments that participated in the study had the same 3 Tesla MRI scanners (MR 750, Discovery; General Electric Healthcare), with the same imaging parameters implemented. Medical records of patients who had histologically proven BM or GBM between January 2010 and May 2019 were screened in the two centers to constitute the training set. Inclusion criteria for the training set were: 1) patients more than 18 years of age, 2) with histologically-confirmed diagnosis of BM or GBM, and 3) and with pre-operative MRI. Exclusion criteria for the training set were: 1) lesions less than 2 cm, 2) extra-axial locations, 3) history of treatment before the MRI examination, 4) absence of 3D T1-weighted Fast SPoiled Gradient Recalled sequence, 5) image acquisition performed on a different machine to the 3 Tesla GE Discovery MR scanner, and 6) 3D T1-weighted sequence acquired with non-conventional parameters or inadequate quality (see section MRI data). The minimal size of 2 cm was chosen as GBM are usually >2 cm at the diagnosis. We therefore wanted to exclude small BM from the analysis, to avoid a bias of size. For BM, we included patients with one or more brain lesions. However in cases of multiple lesions, only the largest was segmented for radiomic feature extraction.
Secondly, a test set was constituted after completion of the model development process in order to evaluate the final performance of the radiomic classifier on unseen lesions. As well, the test set included patients from both centers. Inclusion criteria for the test set were the same as for the training set. All patients included in the test set were required to have solitary lesions so that neuroradiologists were not influenced in their final diagnosis. Exclusion criteria of the study were therefore the same as those of the training set plus patients having multifocal or infra-tentorial lesions. All inclusion and exclusion criteria are summarized in the flow chart (Figure 2).
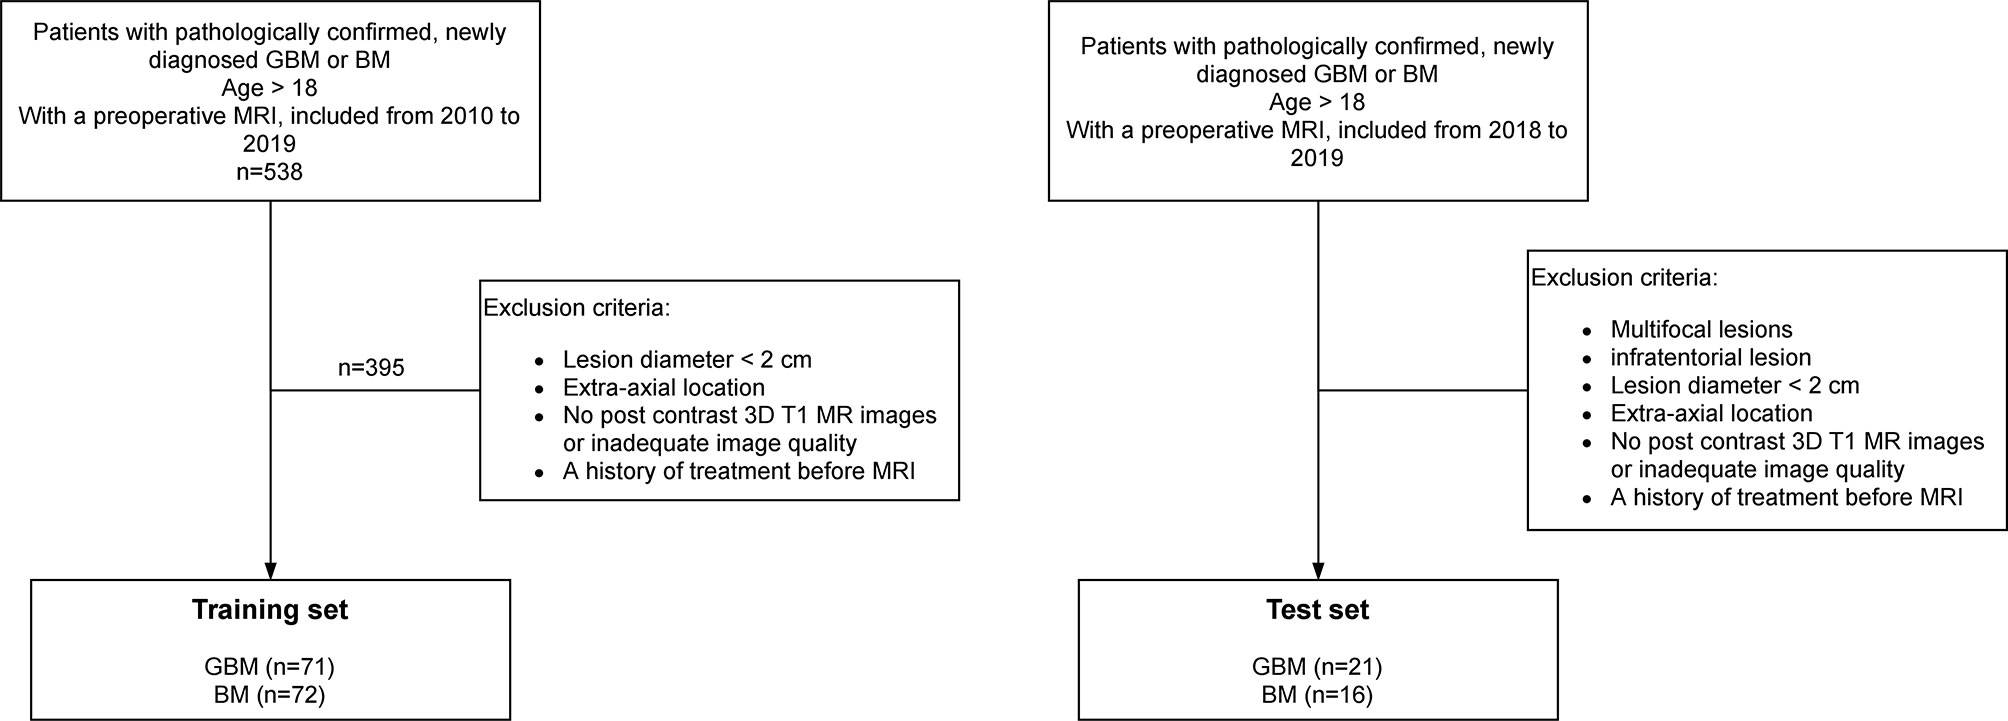
Figure 2 Flow chart of patient inclusion.
MRI Data
MR acquisitions were performed on the same 3 Tesla MR scanner, even if at two clinical sites. MRI data included at least a post-contrast (gadoterate meglumine [Dotarem; Guerbet Laboratory]) three-dimensional T1-weighed Fast SPoiled Gradient Recalled (FSPGR) acquisition (post-contrast 3DT1), with the following parameters: repetition time: 10.2 ms; echo time: 3.4 ms; field of view: 22 cm; voxel size: 0.8 mm × 0.8 mm × 1.2 mm. Patients were excluded from this study if other imaging protocols were followed. Post-contrast 3DT1 MR images were only used as inputs of the radiomic classifier. To compare the performance between the classifier and neuroradiologists, clinical conditions were mimicked, and all available sequences of the imaging exam were thus analyzed by the neuroradiologists, as routinely conducted in a clinical setting.
Image Analysis
Pre-Processing
MR image preprocessing included bias field correction using the N4ITK algorithm (30) from the Advanced Normalization Tools (ANTs) library (31), skull-stripping with the Brain Extraction Tool (BET) of the FSL software (FMRIB’s Software Library) (32) and Z-score normalization with a scaling factor of 100. No spatial resampling was performed due to data homogeneity. As well, no noise filtering was applied.
Tumor Segmentation
A segmentation of the volume of interest, including the contrast-enhanced and necrotic regions, was performed semi-automatically using Olea Sphere© (Olea Medical, La Ciotat, France). These two sub-regions corresponded to Labels 4 and 1 of the BraTS 2012–2016 challenge (33). Within a region of interest defined by a trained radiologist (AdC, 5 years of experience), threshold-based gray level contouring and manual correction were used for the segmentation so that the volume of interest was carefully drawn along the tumor enhancement.
Feature Extraction
One hundred radiomic features were extracted from the 3D MR images using the Python library PyRadiomics 2.1.2 (34) in which the feature definitions are consistent with the Image Biomarker Standardization Initiative (IBSI) (35). The only exception is that PyRadiomics and IBSI use different definitions of the Kurtosis first-order feature, where Kurtosis is calculated using −3 and +3 in the IBSI and PyRadiomics referentials respectively. For first order features, an intensity shifting of 300 (equal to three standard deviations) was applied to ensure that the majority of the voxel intensities were positive before feature extraction. An absolute discretization with a fixed bin size equal to 37 was chosen (36, 37). This leads to a bin number of 32 considering the mean of the intensity intervals computed for all volumes of interest of patients of the training set (min intensity: 575, max intensity: 2069, mean intensity range: 1190). Six feature classes were considered: 18 first-order statistics, 14 shape-based features, 22 Gray Level Co-occurrence Matrix features (GLCM), 16 Gray Level Run Length Matrix features (GLRLM), 16 Gray Level Size Zone Matrix features (GLSZM), and 14 Gray Level Dependence Matrix features (GLDM).
Model Building
The establishment of the classification model was based on the scikit-learn library version 0.23.2 (38) and included two steps applied to the training set: (1) selection of the ML classifier and feature scaling method and 2) optimization of the hyper-parameters. In step 1), a nested cross-validation was used given the moderately-sized dataset and 144 ML models combining nine feature scaling methods (No Scaler, MaxAbsScaler, MinMaxScaler, Normalizer, PowerTransformer-Yeo–Johnson, QuantileTransformer-normal, QuantileTransformer-uniform, RobustScaler, StandardScaler) and 16 classifiers (AdaBoostClassifier, BaggingClassifier, BernoulliNB, DecisionTreeClassifier, ExtraTreeClassifier, ExtraTreesClassifier, GaussianNB, GradientBoostingClassifier, KNeighborsClassifier, LinearSVC, LogisticRegression, MLPClassifier, QuadraticDiscriminantAnalysis, RandomForestClassifier, RidgeClassifier, SGDClassifier) were compared. The nested cross-validation considered a stratified 5-fold cross-validation in the inner loop for hyper-parameter tuning (grid search strategy) and a stratified 5-fold cross-validation in the outer loop for the evaluation of the performance of the model. In step 2), the model showing the lowest generalization error, as assessed by the balanced accuracy, was kept and a ten-repeated 5-fold cross-validation was performed. In this second step, a grid search method was implemented to optimize the final set of hyper-parameters. Mean sensitivity, specificity, balanced accuracy, and area under the receiver operating characteristic curve (AUC) and their associated variances and 95% confidence intervals were calculated as performance metrics. Research spaces for hyper-parameter tuning with grid search during nested cross-validation and cross-validation are described in Table S1.
Evaluation on the Test Set and Comparison to Human Performance
The final model was fitted using the entire training set and its performance evaluated on the test set including 37 patients (21 GBM and 16 BM). Images of the test set were then blindly analyzed by five neuroradiologists (R1, R2, R3, R4, and R5). Two were neuroradiologists with more than 10 years of experience and three were radiology residents with about 6 months of training and practice in neuroradiology. The neuroradiologists had access to all MR sequences acquired in a routine MR imaging protocol, including 3D FLAIR, 2D T2, perfusion imaging, and pre- and post-contrast 3DT1 sequences.
Statistics
Sensitivity, specificity, balanced accuracy and AUC were used to assess the diagnosis performance of the radiomic model. We applied a McNemar’s test and evaluated its p-value to assess if the differences were significant between the diagnostic performance of the radiomic classifier and the diagnostic performance of the readers. The threshold was set at 0.05.
Results
Patients
267 GBM and 271 BM were pre-selected for the training set, and 71 GBM and 72 BM met the inclusion criteria respectively (Figure 2). Median [minimum value–maximum value] 2D maximal diameter was equal to 53.39 mm [24.11–88.12 mm] for GBM and 41.40 mm [20.77–77.92 mm] for BM. The test set included 37 patients (21 GBM and 16 BM). In this set, the median 2D maximal diameter was equal to 54.93 mm [32.61–102.53 mm] and 33.85 mm [22.41–63.63 mm] for GBM and BM respectively. Patient characteristics and their repartition between Centers 1 and 2 are summarized in Table 1.
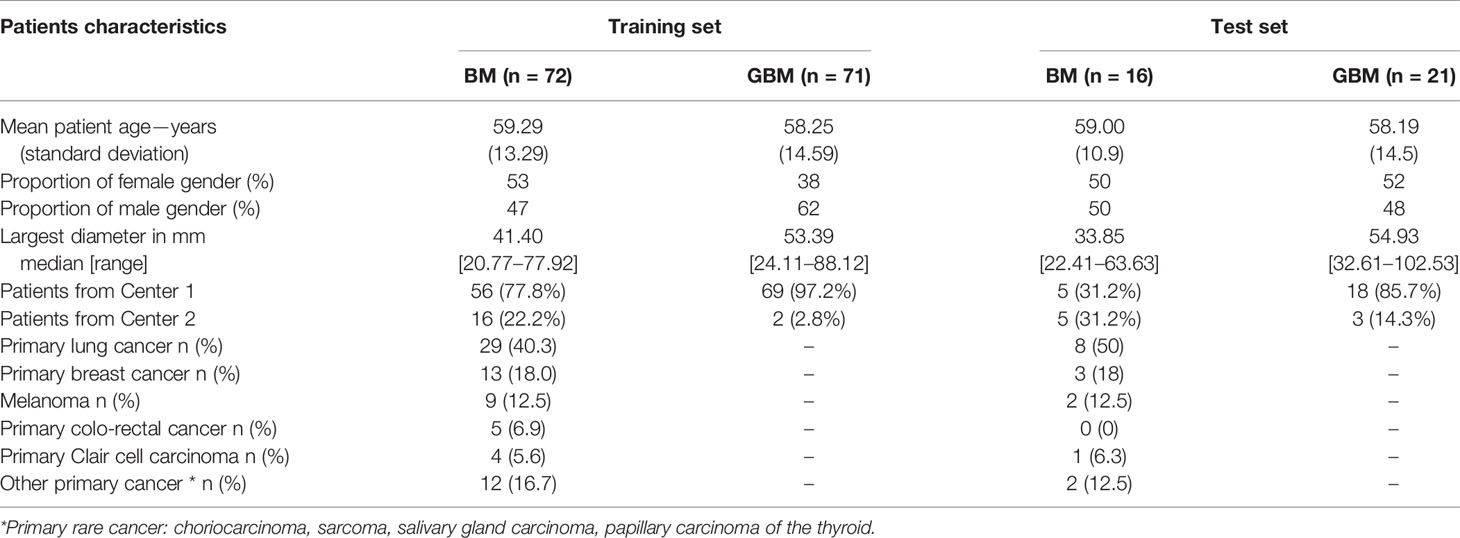
Table 1 Demographics and clinical characteristics at diagnosis of the patients included in the training set and in the test set.
Selected Machine Learning Classifier
Table S2 summarizes the mean balanced accuracies and their associated standard deviations obtained for all tested combinations (scaling method + classifier). Combinations are ranked considering the lowest generalization error. The ML classifier providing the better performance using the nested cross-validation was the logistic regression combined to the power transform Yeo–Johnson scaling feature method which corresponds to a zero-mean, unit-variance normalization with a power transform applied feature wise to make distribution of each radiomic feature Gaussian-like. To limit overfitting, the classifier encompassed a ridge regression for regularization (l2 penalty assignment) with a C value equal to 0.7. The final logistic regression-based established signature was a combination of the 100 input radiomics features, in which the feature with the highest coefficient in the decision function was sphericity, with a coefficient of 1.48. All other features had absolute coefficient less than 0.96. The 20 predominant features had absolute coefficients superior to 0.38. Among these features, five were shape features, two were first-order metrics, and 13 were based on texture matrices, with 6 extracted from the GLCM matrix (Figure 3).
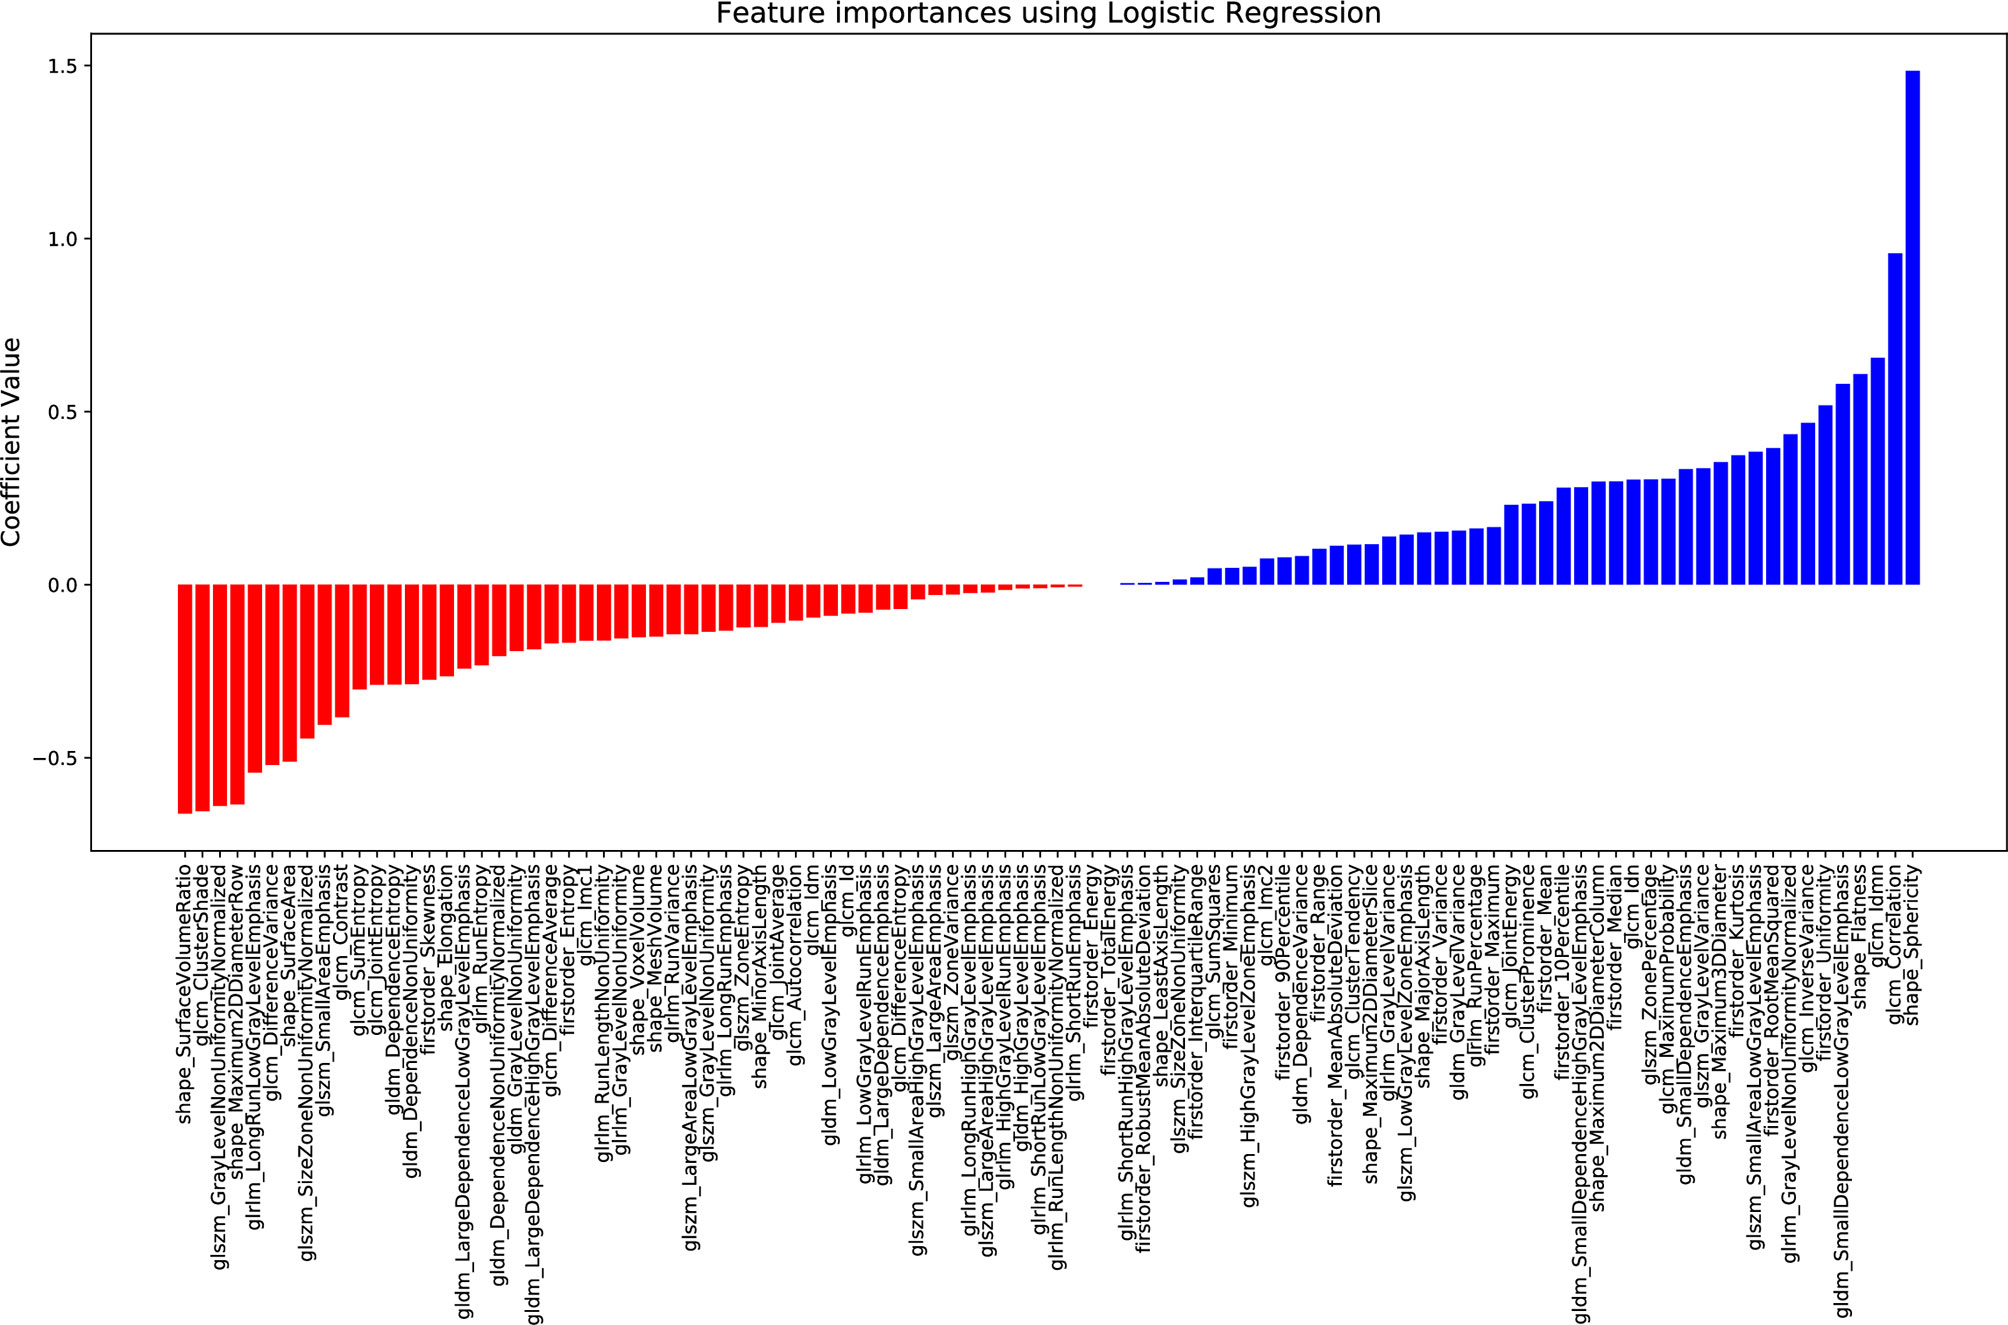
Figure 3 Coefficient of each radiomic feature in the decision function for the proposed logistic regression model.
Diagnosis Performance of the Classifier With a Ten-Repeated 5-Fold Cross-Validation
The model differentiated BM from GBM on the validation sets with a mean sensitivity of 85% [95% CI = (77%; 94%)], a specificity of 87% [95% CI = (78%; 97%)], a balanced accuracy of 86% [95% CI = (80%; 92%)], and an AUC of 92% [95% CI = (87%; 97%)] (Figure 4).
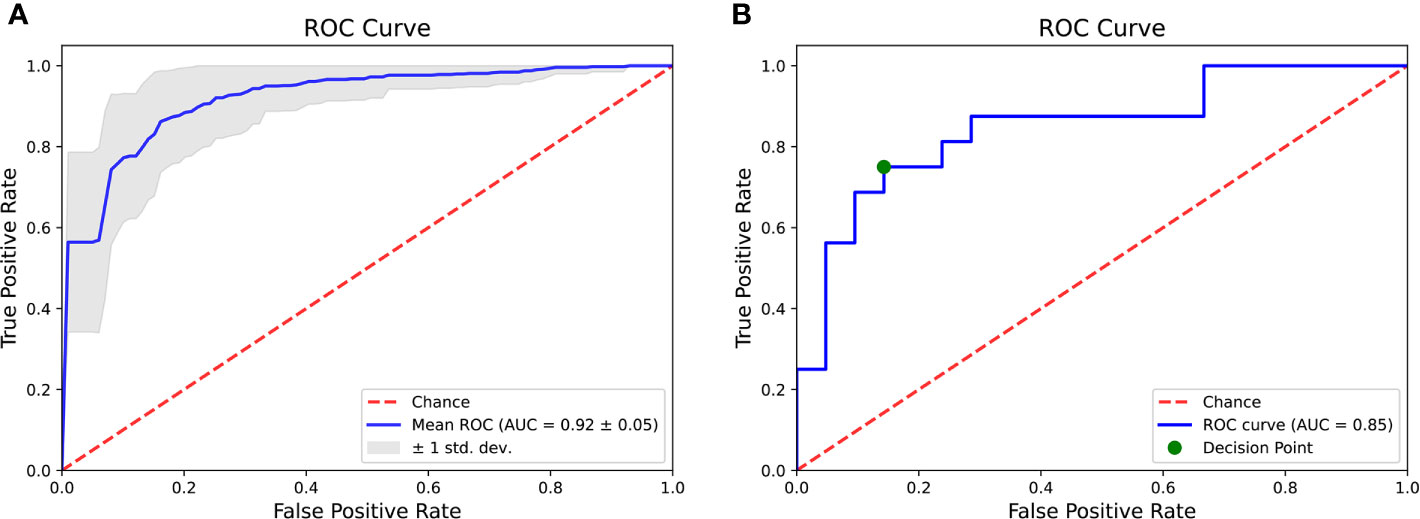
Figure 4 Areas under the receiver operating characteristics curve of the radiomic classifier after ten-repeated 5-fold cross-validation (A) and on the test set (B).
Diagnosis Performance of the Radiomic Classifier on the Test Set
The classifier correctly identified 12/16 BM and 18/21 GBM. Corresponding sensitivity, specificity, balanced accuracy and AUC were respectively equal to 75, 86, 80, and 85% (Figures 4 and 5).
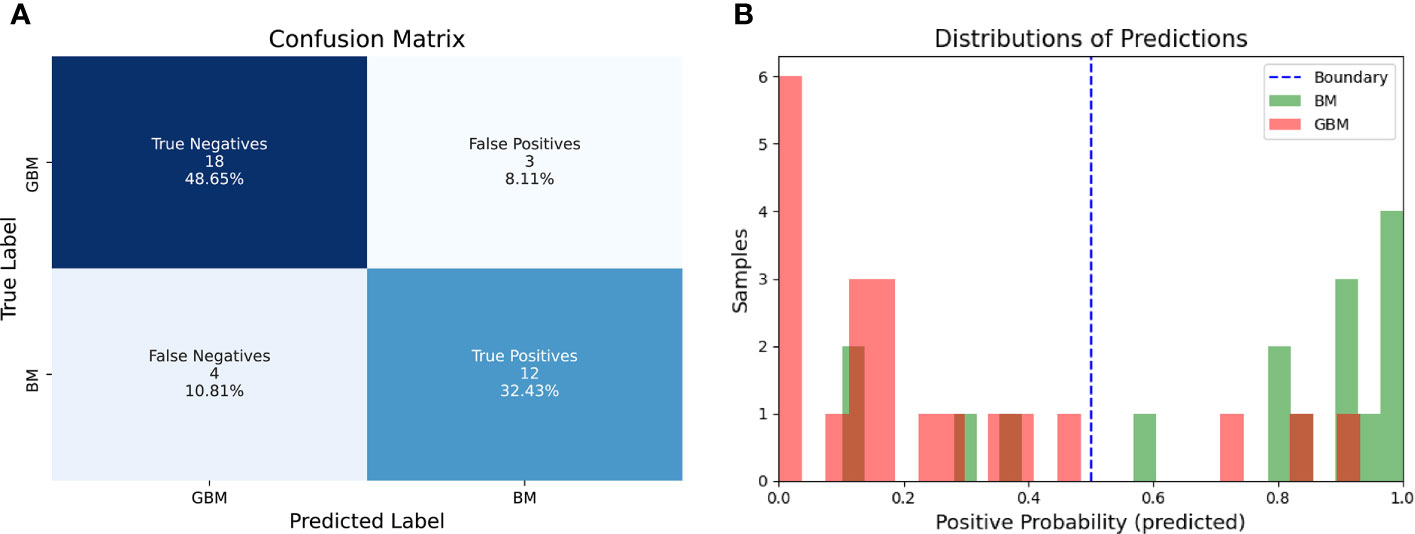
Figure 5 Confusion Matrix of the radiomic model on the test set (A) and distribution of probabilities as predicted by the logistic regression model compared to ground truth (B).
Performance of the Radiologists
The performances of the neuroradiologists are described in Table 2. Even though differences in diagnostic performance were not statistically significant, we can highlight the fact that two radiology residents (R3 and R4) had lower scores than the classifier (respective balanced accuracies of 72 and 72%) whereas the two neuroradiologists with 10 years of experience (R1 and R2) and one radiology resident (R5) had better scores than the classifier (respective balanced accuracies of 87, 94 and 88% versus balanced accuracy of 80% for the classifier).
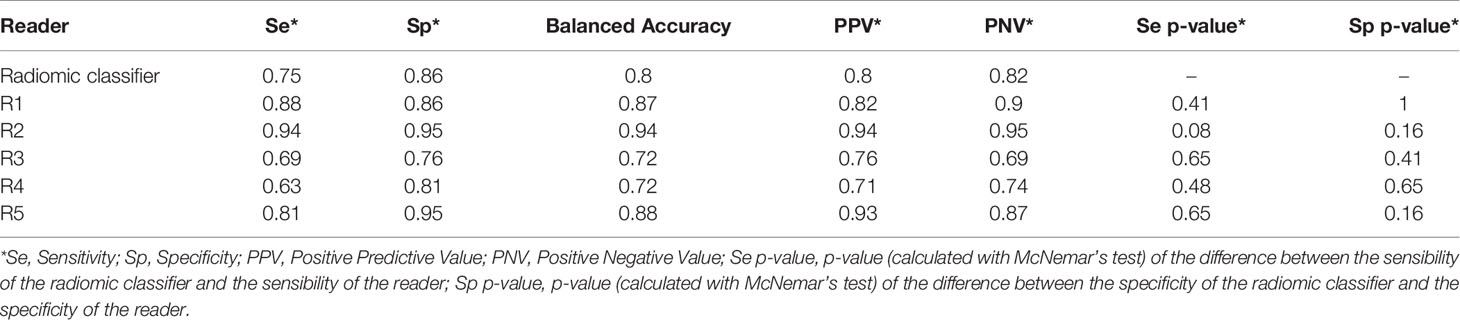
Table 2 Sensitivities, specificities, balanced accuracies, positive predictive values, negative predictive values of the radiomic classifier and of the neuroradiologists (R1, R2, R3, R4, R5) on the test set.
Discussion
We have developed a radiomic classifier to differentiate solitary BM and GBM based on post-contrast 3DT1 MR images with high diagnostic performances on the validation and test sets. There was no statistically significant difference between classifier predictions and human reading by five trained neuroradiologists (two neuroradiologists with 10 years of experience, and three radiology residents with about 6 months of training exclusively in neuroradiology in an expert center).
The radiomic classifier, a logistic regression combined to the power transform Yeo–Johnson scaling feature method, was chosen because of its high performance, simplicity, and because it allowed an interpretation of the underlying model. Indeed, the fact that the radiomic feature with the most important coefficient value in the classifier was a shape feature, i.e. sphericity, partly allows an explainability of our radiomic features-based classifier in contrast with the concept of the “black box” in some ML models, where even its designers cannot explain why the artificial intelligence reaches a decision (39). It introduces the notion of analyzing a tumor with its representation in 3D to differentiate solitary BM and GBM, which is usually not available during conventional reading of sectional imaging. Indeed, sphericity is a 3D shape feature representing a measure of roundness of the tumor, with a value ranging from 0 to 1, where 1 indicates a perfect sphere. The classifier showed that GBM have lower sphericity than BM (Figure 6), which was expected given the morphological characteristics of BM and GBM on histopathological slides. The more spherical the lesion is, the more likely it is to be a BM. Thus, the radiomic features-based classifier is consistent with current morphological characteristics between BM and GBM, also adding further information regarding tumor heterogeneity imperceptible to the human eye, as the radiomic classifier is also based on other texture and intensity features. This result is in line with a pioneering paper (40) that described in 2012 2D circularity as one of the best morphological features to differentiate BM from GBM on the basis of a cohort of 50 patients.
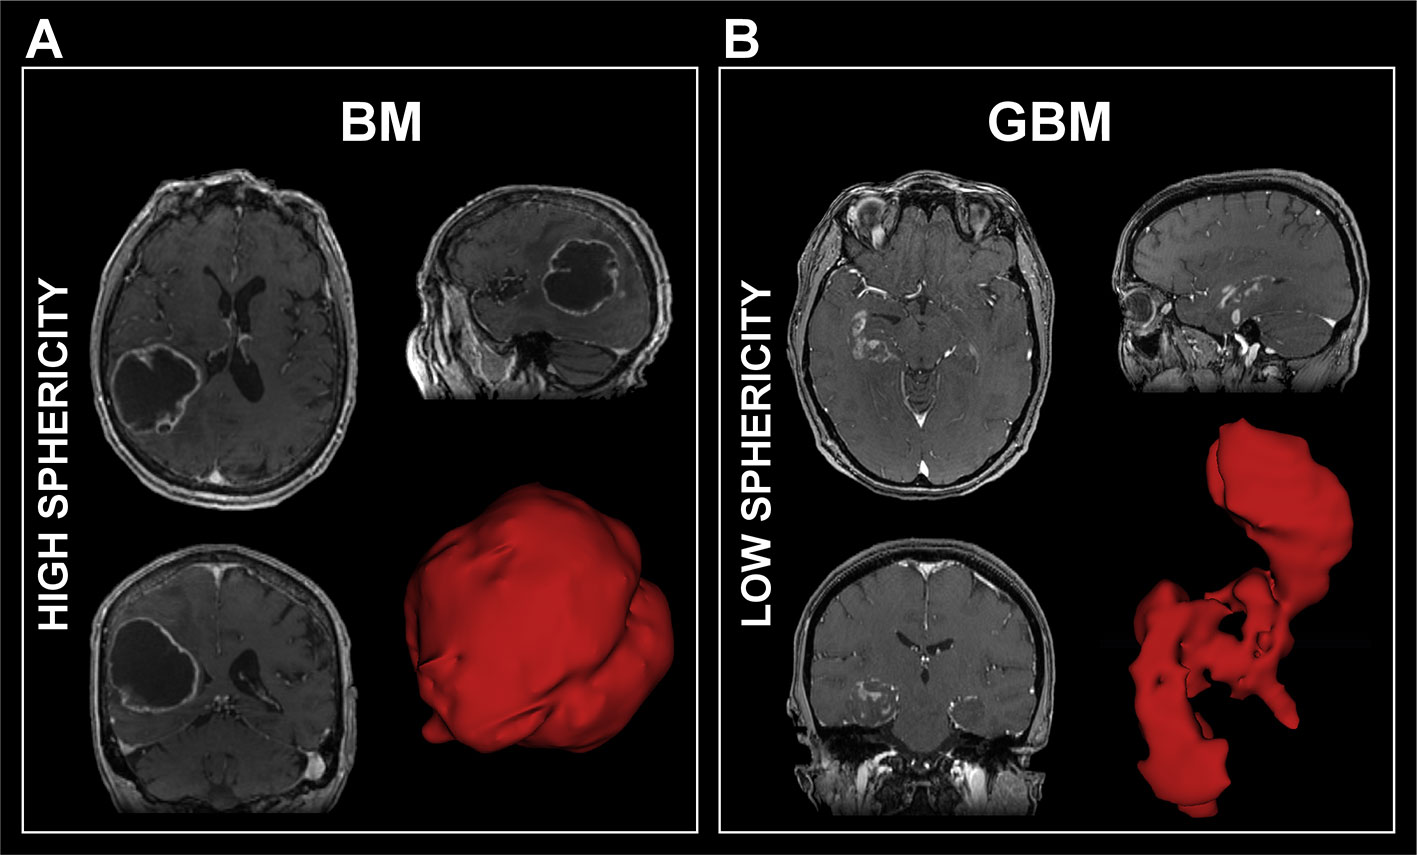
Figure 6 Examples of 3D representation of a brain metastasis (A) for which the sphericity was equal to 0.76 and a glioblastoma (B) for which the sphericity was equal to 0.45. GBM, Glioblastoma; BM, Brain Metastasis.
In our study, we trained the ML classifier using a nested cross-validation and a ten-repeated 5-fold cross-validation on the training set in order to minimize overfitting. In addition to limit the extraction to 100 features (shape, first order and second order features) that we thought to be the most meaningful and interpretable, we selected a classifier model which could embed feature selection. For this model, L1 and L2 regularization methods were tested as hyperparameters. The L2 method provided the best performance in the cross-validation (CV) process, validating the usefulness of the 100 features. The selected classifier was then applied on a test set of data, which demonstrates that the high performances obtained were not random but generalizable. In the test set, 12/16 BM were correctly classified leading to a sensitivity of 75%. Among the four BM incorrectly classified, two had leptomeningeal enhancement, one had ventriculitis adjacent to the lesion and the fourth one had a multilocular lesion (Figure 7). The first three elements were absent from BM of the training set, which might have misled the classifier, suggesting the need for a larger training set which extensively reproduces all clinical situations encountered in clinic.
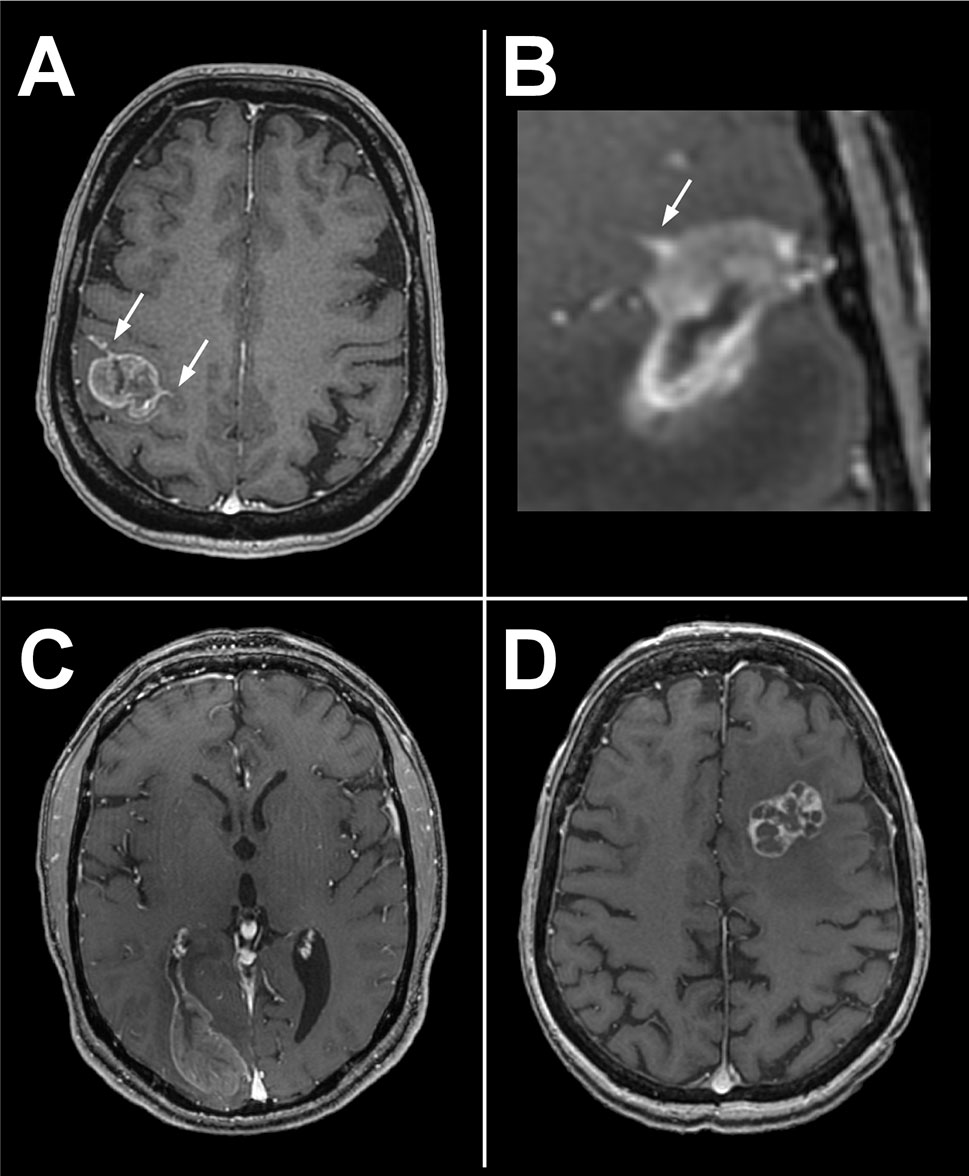
Figure 7 Four incorrectly classified BM of the test set. Two of them presented tumoral leptomeningitis (arrows, A, B), one a metastatic ventriculitis (C) and the forth one a multilocular lesion (D). Leptomeningitis and ventriculitis may have interfered with spatial delineation of tumor boundaries.
The results of our study are consistent with the results of three previous studies which also used radiomic features-based classifiers on post-contrast 3D T1 MR images to differentiate BM from GBM. Among these studies, Chen et al. (41) achieved diagnostic performance slightly lower than our on 134 patients, however without applying image pre-processing (42–44) nor evaluation on a test set. Artzi et al. (45) built a radiomics-based classifier on 358 patients and evaluated its performance on a test set of 88 patients. Excellent performances were achieved on the test set. However, the radiomic analysis was carried out on three central slices only to simplify the segmentation process, which did not allow 3D shape features such as sphericity, to be taken into account. Moreover, there was no comparison to human performance. In 2019, Qian et al. (46) used a cohort of 227 patients to train a ML classifier using cross-validation and evaluated it on an independent test set of 185 patients. Despite high diagnostic performances, there were biases in the study considering several radiomic features-based classifiers were evaluated on the test set. Finally, in 2020, Bae et al. (47) developed a Deep Neural Network (DNN) classifier based on post-contrast 3D T1-weighted and T2-weighted MR images, which outperformed the best-performing traditional machine learning model. Results showed excellent performance on an independent test set (AUC of 0.956 on the test set) and outperformed scores of two trained neuroradiologists. However, comparing the literature is not a trivial task due to the use of different data sets, each with varying degrees of complexity, suggesting the need for publicly available data sets.
Our study had a few limitations. First, we chose to build the radiomic features-based classifier on imaging data acquired on the same model of MR scanner with acquisitions performed with the same parameters in order to minimize inter-acquisition variability. This choice limited the number of patients included in the study. Several methods are available today to compensate for differences in image quality between scanners (36, 48), which should allow the applicability of our signature in other centers. In addition, no spatial resampling was applied to the MR images prior to feature extraction. Although this step is mandatory to obtain rotationally invariant features, no bias was introduced in the machine learning pipeline, as the entire cohort had exactly the same imaging parameters. The developed signature can finally be generalized to new patients with MR images of different voxel sizes by integrating an additional resampling step [resampling at a voxel size of (0.8 mm × 0.8 mm × 1.2 mm)]. Third, a semi-automatic method was used for tumor delineation and a single radiologist specialized in neurology performed the contouring of the lesions. Perturbation of the contours would have been an alternative to multiple segmentations to evaluate the robustness of the model developed to segmentation (49). However, the semi-automatic contouring process has been shown to be reliable between raters for brain tumors (50). An integrated diagnostic support system should include an automatic segmentation of the volumes of interest to be considered for radiomics analysis. The automation of this step is now possible with high performance as demonstrated by the recent results of the BRATS challenge (51). Then, the radiomic only features-based classifier takes into account imaging data. The addition of the patient’s age, gender, and medical history elements would lead to holistic models enabling to analyze the correlations between radiomic/non-radiomic features, and to better assess the added value of such a signature compared to more readily available clinical features (49). As well, only post-contrast 3DT1 MR images were considered. A more complex classifier combining data from other sequences such as FLAIR, T2 (47) or perfusion MR sequences may improve classification performance. Finally, a larger cohort of lesions studied would enable its generalizability.
In conclusion, we developed a radiomic features-based classifier based on post-contrast 3DT1 MR images that helps in differentiating GBM and solitary metastatic brain tumors with high diagnosis performance. The performance of the radiomic classifier equals that of neuroradiologists however needs to be improved in further studies including feature extraction applied on FLAIR and perfusion sequences. An interesting point is that the radiomic feature with the highest coefficient value in the classifier, namely sphericity, allows an explainability of the developed model. Future studies using this model on larger sets of patients may clarify its role and its benefit in differentiating these two lesions, particularly by a prospective study registered in a trial database.
Data Availability Statement
The data analyzed in this study is subject to the following licenses/restrictions: Data can be available on demand. Requests to access these datasets should be directed to CR Y2gucm9iZXJ0QGd1c3RhdmVyb3Vzc3kuZnI= and MEbXlyaWFtLmVkamxhbGlAZ21haWwuY29t.
Ethics Statement
The studies involving human participants were reviewed and approved by College de neurochirurgie, Paris. Written informed consent for participation was not required for this study in accordance with the national legislation and the institutional requirements.
Author Contributions
AdC, AC, ME, SA, SR, and CR designed the research. AdC, AC, ME, SA, SR, and CR performed the research, analyzed, and interpreted the data, and wrote the paper. AT-E and PV reviewed histopathological data. AR, EDez, JP, AT-E, PV, and FD took care of the patients and retrieved the data. AdC, AC, AR, AT-E, SA, EDez, FD, SR, EDeu, CO, PV, JP, ME, and CR revised and approved the paper. All authors contributed to the article and approved the submitted version.
Funding
This material is based upon work supported by ITMO PhysiCancer, the Fondation pour la Recherche Médicale (FRM; No. DIC20161236437), and Amazon Web Services (AWS). Amazon Web Services was not involved in the study design, collection, analysis, interpretation of data, the writing of this article or the decision to submit it for publication.
Conflict of Interest
The authors declare that the research was conducted in the absence of any commercial or financial relationships that could be construed as a potential conflict of interest.
The funder was not involved in the study design, collection, analysis, interpretation of data, the writing of this article or the decision to submit it for publication.
Acknowledgments
We would like to thank Armelle Lesaunier, MD; Violeta Fridjoi, MD; Philippe Beyssen, MD; Juliette Fayard, MD; Corentin Provost, MD-MSc; Marjorie Latrasse, MD; Céline Corcy, MD, Joseph Benzakoun, MD-MSc; Wagih Ben Hassen, MD-MSc, Grégoire Boulouis, MD-MSc, Emmanuèle Lechapt-Zalcman, MD-PhD and Jean-François Meder, MD-PhD; for their precious help and advice in this study. Figure 1 has been designed using resources from Flaticon.com.
Supplementary Material
The Supplementary Material for this article can be found online at: https://www.frontiersin.org/articles/10.3389/fonc.2021.638262/full#supplementary-material
References
1. Lemke DM. Epidemiology, Diagnosis, and Treatment of Patients With Metastatic Cancer and High-Grade Gliomas of the Central Nervous System. J Infus Nurs: Off Publ Infus Nurs Soc (2004) 27:263–9. doi: 10.1097/00129804-200407000-00012
2. Achrol AS, Rennert RC, Anders C, Soffietti R, Ahluwalia MS, Nayak L, et al. Brain Metastases. Nat Rev Dis Primers (2019) 5:5. doi: 10.1038/s41572-018-0055-y
3. Ostrom QT, Gittleman H, Farah P, Ondracek A, Chen Y, Wolinsky Y, et al. CBTRUS Statistical Report: Primary Brain and Central Nervous System Tumors Diagnosed in the United States in 2006-2010. Neuro-Oncology (2013) 15 Suppl 2:ii1–56. doi: 10.1093/neuonc/not151
4. Server A, Josefsen R, Kulle B, Maehlen J, Schellhorn T, Gadmar Ø, et al. Proton Magnetic Resonance Spectroscopy in the Distinction of High-Grade Cerebral Gliomas From Single Metastatic Brain Tumors. Acta Radiol (Stockholm Sweden: 1987) (2010) 51:316–25. doi: 10.3109/02841850903482901
5. Benzakoun J, Robert C, Legrand L, Pallud J, Meder JF, Oppenheim C, et al. Anatomical and Functional MR Imaging to Define Tumoral Boundaries and Characterize Lesions in Neuro-Oncology. Cancer Radiother: J la Soc Fr Radiother Oncol (2020) 24:453–62. doi: 10.1016/j.canrad.2020.03.005
6. Daumas-Duport C, Meder JF, Monsaingeon V, Missir O, Aubin ML, Szikla G. Cerebral Gliomas: Malignancy, Limits and Spatial Configuration. Comparative Data From Serial Stereotaxic Biopsies and Computed Tomography (a Preliminary Study Based on 50 Cases). J Neuroradiol = J Neuroradiol (1983) 10:51–80.
7. Petrella JR, Provenzale JM. MR Perfusion Imaging of the Brain: Techniques and Applications. AJR Am J Roentgenol (2000) 175:207–19. doi: 10.2214/ajr.175.1.1750207
8. Lin L, Xue Y, Duan Q, Sun B, Lin H, Huang X, et al. The Role of Cerebral Blood Flow Gradient in Peritumoral Edema for Differentiation of Glioblastomas From Solitary Metastatic Lesions. Oncotarget (2016) 7:69051–9. doi: 10.18632/oncotarget.12053
9. Blasel S, Jurcoane A, Franz K, Morawe G, Pellikan S, Hattingen E. Elevated Peritumoural rCBV Values as a Mean to Differentiate Metastases From High-Grade Gliomas. Acta Neurochirurg (2010) 152:1893–9. doi: 10.1007/s00701-010-0774-7
10. Galanaud D, Nicoli F, Figarella-Branger D, Roche P, Confort-Gouny S. Le Fur Y, Et al. Spectroscopie Par Résonance Magnétique Des Tumeurs Cérébrales. J Radiol (2006) 87:822–32. doi: 10.1016/S0221-0363(06)74090-2
11. Tsolaki E, Svolos P, Kousi E, Kapsalaki E, Fountas K, Theodorou K, et al. Automated Differentiation of Glioblastomas From Intracranial Metastases Using 3T MR Spectroscopic and Perfusion Data. Int J Comput Assist Radiol Surg (2013) 8:751–61. doi: 10.1007/s11548-012-0808-0
12. Tsougos I, Svolos P, Kousi E, Fountas K, Theodorou K, Fezoulidis I, et al. Differentiation of Glioblastoma Multiforme From Metastatic Brain Tumor Using Proton Magnetic Resonance Spectroscopy, Diffusion and Perfusion Metrics at 3 T. Cancer Imaging (2012) 12:423–36. doi: 10.1102/1470-7330.2012.0038
13. Suh CH, Kim HS, Jung SC, Choi CG, Kim SJ. Perfusion MRI as a Diagnostic Biomarker for Differentiating Glioma From Brain Metastasis: A Systematic Review and Meta-Analysis. Eur Radiol (2018) 28:3819–31. doi: 10.1007/s00330-018-5335-0
14. Nguyen LN, Maor MH, Oswald MJ. Brain Metastases as the Only Manifestation of an Undetected Primary Tumor. Cancer (1998) 83:2181–4. doi: 10.1002/(sici)1097-0142(19981115)83:10<2181::aid-cncr17>3.0.co;2-j
15. Rudà R, Borgognone M, Benech F, Vasario E, Soffietti R. Brain Metastases From Unknown Primary Tumour: A Prospective Study. J Neurol (2001) 248:394–8. doi: 10.1007/s004150170180
16. Louis DN, Perry A, Reifenberger G, von Deimling A, Figarella-Branger D, Cavenee WK, et al. The 2016 World Health Organization Classification of Tumors of the Central Nervous System: A Summary. Acta Neuropathol (2016) 131:803–20. doi: 10.1007/s00401-016-1545-1
17. Lin X, DeAngelis LM. Treatment of Brain Metastases. J Clin Oncol: Off J Am Soc Clin Oncol (2015) 33:3475–84. doi: 10.1200/JCO.2015.60.9503
18. Weller M, van den Bent M, Tonn JC, Stupp R, Preusser M, Cohen-Jonathan-Moyal E, et al. European Association for Neuro-Oncology (EANO) Guideline on the Diagnosis and Treatment of Adult Astrocytic and Oligodendroglial Gliomas. Lancet Oncol (2017) 18:e315–29. doi: 10.1016/S1470-2045(17)30194-8
19. Gillies RJ, Kinahan PE, Hricak H. Radiomics: Images Are More Than Pictures, They Are Data. Radiology (2016) 278:563–77. doi: 10.1148/radiol.2015151169
20. Lambin P, Rios-Velazquez E, Leijenaar R, Carvalho S, van Stiphout RGPM, Granton P, et al. Radiomics: Extracting More Information From Medical Images Using Advanced Feature Analysis. Eur J Cancer (Oxford England: 1990) (2012) 48:441–6. doi: 10.1016/j.ejca.2011.11.036
21. Limkin EJ, Sun R, Dercle L, Zacharaki EI, Robert C, Reuzé S, et al. Promises and Challenges for the Implementation of Computational Medical Imaging (Radiomics) in Oncology. Ann Oncol: Off J Eur Soc Med Oncol (2017) 28:1191–206. doi: 10.1093/annonc/mdx034
22. Gillies RJ, Anderson AR, Gatenby RA, Morse DL. The Biology Underlying Molecular Imaging in Oncology: From Genome to Anatome and Back Again. Clin Radiol (2010) 65:517–21. doi: 10.1016/j.crad.2010.04.005
23. Hajianfar G, Shiri I, Maleki H, Oveisi N, Haghparast A, Abdollahi H, et al. Noninvasive O6 Methylguanine-DNA Methyltransferase Status Prediction in Glioblastoma Multiforme Cancer Using Magnetic Resonance Imaging Radiomics Features: Univariate and Multivariate Radiogenomics Analysis. World Neurosurg (2019) 132:e140–61. doi: 10.1016/j.wneu.2019.08.232
24. Nicolasjilwan M, Hu Y, Yan C, Meerzaman D, Holder CA, Gutman D, et al. Addition of MR Imaging Features and Genetic Biomarkers Strengthens Glioblastoma Survival Prediction in TCGA Patients. J Neuroradiol = J Neuroradiol (2015) 42:212–21. doi: 10.1016/j.neurad.2014.02.006
25. Kotrotsou A, Zinn PO, Colen RR. Radiomics in Brain Tumors: An Emerging Technique for Characterization of Tumor Environment. Magnet Reson Imaging Clinics North America (2016) 24:719–29. doi: 10.1016/j.mric.2016.06.006
26. Lohmann P, Galldiks N, Kocher M, Heinzel A, Filss CP, Stegmayr C, et al. Radiomics in Neuro-Oncology: Basics, Workflow, and Applications. Methods (San Diego Calif) (2021) 188:112–21. doi: 10.1016/j.ymeth.2020.06.003
27. Kickingereder P, Neuberger U, Bonekamp D, Piechotta PL, Götz M, Wick A. Et al. Radiomic Subtyping Improves Disease Stratification Beyond Key Molecular, Clinical, and Standard Imaging Characteristics in Patients With Glioblastoma. Neuro-Oncology (2018) 20:848–57. doi: 10.1093/neuonc/nox188
28. Park JE, Kickingereder P, Kim HS. Radiomics and Deep Learning From Research to Clinical Workflow: Neuro-Oncologic Imaging. Korean J Radiol (2020) 21:1126–37. doi: 10.3348/kjr.2019.0847
29. Shboul ZA, Chen J, MIftekharuddin K. Prediction of Molecular Mutations in Diffuse Low-Grade Gliomas Using MR Imaging Features. Sci Rep (2020) 10:3711. doi: 10.1038/s41598-020-60550-0
30. Tustison NJ, Avants BB, Cook PA, Zheng Y, Egan A, Yushkevich PA, et al. N4ITK: Improved N3 Bias Correction. IEEE Trans Med Imaging (2010) 29:1310–20. doi: 10.1109/TMI.2010.2046908
31. Avants BB, Tustison NJ, Song G, Cook PA, Klein A, Gee JC. A Reproducible Evaluation of ANTs Similarity Metric Performance in Brain Image Registration. NeuroImage (2011) 54:2033–44. doi: 10.1016/j.neuroimage.2010.09.025
32. Smith SM. Fast Robust Automated Brain Extraction. Hum Brain Mapp (2002) 17:143–55. doi: 10.1002/hbm.10062
33. Bakas S, Reyes M, Jakab A, Bauer S, Rempfler M, Crimi A, et al. Identifying the Best Machine Learning Algorithms for Brain Tumor Segmentation, Progression Assessment, and Overall Survival Prediction in the BRATS Challenge. arXiv:1811.02629 [cs stat] (2019). doi: 10.17863/CAM.38755
34. van Griethuysen JJM, Fedorov A, Parmar C, Hosny A, Aucoin N, Narayan V, et al. Computational Radiomics System to Decode the Radiographic Phenotype. Cancer Res (2017) 77:e104–7. doi: 10.1158/0008-5472.CAN-17-0339
35. Zwanenburg A, Vallières M, Abdalah MA, Aerts HJWL, Andrearczyk V, Apte A, et al. The Image Biomarker Standardization Initiative: Standardized Quantitative Radiomics for High-Throughput Image-Based Phenotyping. Radiology (2020) 295:328–38. doi: 10.1148/radiol.2020191145
36. Carré A, Klausner G, Edjlali M, Lerousseau M, Briend-Diop J, Sun R, et al. Standardization of Brain MR Images Across Machines and Protocols: Bridging the Gap for MRI-Based Radiomics. Sci Rep (2020) 10:12340. doi: 10.1038/s41598-020-69298-z
37. Duron L, Balvay D, Vande Perre S, Bouchouicha A, Savatovsky J, Sadik JC, et al. Gray-Level Discretization Impacts Reproducible MRI Radiomics Texture Features. PloS One (2019) 14:e0213459. doi: 10.1371/journal.pone.0213459
38. Pedregosa F, Varoquaux G, Gramfort A, Michel V, Thirion B, Grisel O, et al. Scikit-Learn: Machine Learning in Python. arXiv:1201.0490 [cs] (2018).
39. Holzinger A, Langs G, Denk H, Zatloukal K, Müller H. Causability and Explainability of Artificial Intelligence in Medicine. WIREs Data Min Knowl Discovery (2019) 9:e1312. doi: 10.1002/widm.1312
40. Mouthuy N, Cosnard G, Abarca-Quinones J, Michoux N. Multiparametric Magnetic Resonance Imaging to Differentiate High-Grade Gliomas and Brain Metastases. J Neuroradiol (2012) 39:301–7. doi: 10.1016/j.neurad.2011.11.002
41. Chen C, Ou X, Wang J, Guo W, Ma X. Radiomics-Based Machine Learning in Differentiation Between Glioblastoma and Metastatic Brain Tumors. Front Oncol (2019) 9:806. doi: 10.3389/fonc.2019.00806
42. Kuo MD, Jamshidi N. Behind the Numbers: Decoding Molecular Phenotypes With Radiogenomics–Guiding Principles and Technical Considerations. Radiology (2014) 270:320–5. doi: 10.1148/radiol.13132195
43. Aerts HJWL. The Potential of Radiomic-Based Phenotyping in Precision Medicine: A Review. JAMA Oncol (2016) 2:1636–42. doi: 10.1001/jamaoncol.2016.2631
44. Reuzé S, Schernberg A, Orlhac F, Sun R, Chargari C, Dercle L, et al. Radiomics in Nuclear Medicine Applied to Radiation Therapy: Methods, Pitfalls, and Challenges. Int J Radiat Oncol Biol Phys (2018) 102:1117–42. doi: 10.1016/j.ijrobp.2018.05.022
45. Artzi M, Bressler I, Bashat DB. Differentiation Between Glioblastoma, Brain Metastasis and Subtypes Using Radiomics Analysis. J Magnet Reson Imaging (2019) 50:519–28. doi: 10.1002/jmri.26643
46. Qian Z, Li Y, Wang Y, Li L, Li R, Wang K, et al. Differentiation of Glioblastoma From Solitary Brain Metastases Using Radiomic Machine-Learning Classifiers. Cancer Lett (2019) 451:128–35. doi: 10.1016/j.canlet.2019.02.054
47. Bae S, An C, Ahn SS, Kim H, Han K, Kim SW, et al. Robust Performance of Deep Learning for Distinguishing Glioblastoma From Single Brain Metastasis Using Radiomic Features: Model Development and Validation. Sci Rep (2020) 10:12110. doi: 10.1038/s41598-020-68980-6
48. Orlhac F, Lecler A, Savatovski J, Goya-Outi J, Nioche C, Charbonneau F, et al. How Can We Combat Multicenter Variability in MR Radiomics? Validation of a Correction Procedure. Eur Radiol (2021) 31:2272–80. doi: 10.1007/s00330-020-07284-9
49. Lambin P, Leijenaar RTH, Deist TM, Peerlings J, de Jong EEC, van Timmeren J, et al. Radiomics: The Bridge Between Medical Imaging and Personalized Medicine. Nat Rev Clin Oncol (2017) 14:749–62. doi: 10.1038/nrclinonc.2017.141
50. Tixier F, Um H, Young RJ, Veeraraghavan H. Reliability of Tumor Segmentation in Glioblastoma: Impact on the Robustness of MRI-Radiomic Features. Med Phys (2019) 46:3582–91. doi: 10.1002/mp.13624
Keywords: radiomics, machine learning, glioblastoma, brain metastasis, diagnostic decision support system
Citation: de Causans A, Carré A, Roux A, Tauziède-Espariat A, Ammari S, Dezamis E, Dhermain F, Reuzé S, Deutsch E, Oppenheim C, Varlet P, Pallud J, Edjlali M and Robert C (2021) Development of a Machine Learning Classifier Based on Radiomic Features Extracted From Post-Contrast 3D T1-Weighted MR Images to Distinguish Glioblastoma From Solitary Brain Metastasis. Front. Oncol. 11:638262. doi: 10.3389/fonc.2021.638262
Received: 05 December 2020; Accepted: 17 June 2021;
Published: 13 July 2021.
Edited by:
Sebastian Cerdan, Autonomous University of Madrid, SpainReviewed by:
Sung Soo Ahn, Yonsei University Health System, South KoreaIsaac Shiri, Geneva University Hospitals (HUG), Switzerland
Copyright © 2021 de Causans, Carré, Roux, Tauziède-Espariat, Ammari, Dezamis, Dhermain, Reuzé, Deutsch, Oppenheim, Varlet, Pallud, Edjlali and Robert. This is an open-access article distributed under the terms of the Creative Commons Attribution License (CC BY). The use, distribution or reproduction in other forums is permitted, provided the original author(s) and the copyright owner(s) are credited and that the original publication in this journal is cited, in accordance with accepted academic practice. No use, distribution or reproduction is permitted which does not comply with these terms.
*Correspondence: Charlotte Robert, Y2gucm9iZXJ0QGd1c3RhdmVyb3Vzc3kuZnI=
†These authors have contributed equally to this work and share first authorship
‡These authors have contributed equally to this work and share senior authorship