 Elena Bertelli1*†
 Laura Mercatelli1†
 Chiara Marzi2†
 Eva Pachetti3,4
 Michela Baccini5,6
 Andrea Barucci2
 Sara Colantonio3
 Luca Gherardini5
 Lorenzo Lattavo1
 Maria Antonietta Pascali3
 Simone Agostini1
 Vittorio Miele1
- 1Department of Radiology, Careggi University Hospital, Florence, Italy
- 2“Nello Carrara” Institute of Applied Physics (IFAC), National Research Council of Italy (CNR), Sesto Fiorentino, Italy
- 3“Alessandro Faedo” Institute of Information Science and Technologies (ISTI), National Research Council of Italy (CNR), Pisa, Italy
- 4Department of Information Engineering (DII), University of Pisa, Pisa, Italy
- 5“Giuseppe Parenti” Department of Statistics, Computer Science, Applications(DiSIA), University of Florence, Florence, Italy
- 6Florence Center for Data Science, University of Florence, Florence, Italy
Prostate cancer (PCa) is the most frequent male malignancy and the assessment of PCa aggressiveness, for which a biopsy is required, is fundamental for patient management. Currently, multiparametric (mp) MRI is strongly recommended before biopsy. Quantitative assessment of mpMRI might provide the radiologist with an objective and noninvasive tool for supporting the decision-making in clinical practice and decreasing intra- and inter-reader variability. In this view, high dimensional radiomics features and Machine Learning (ML) techniques, along with Deep Learning (DL) methods working on raw images directly, could assist the radiologist in the clinical workflow. The aim of this study was to develop and validate ML/DL frameworks on mpMRI data to characterize PCas according to their aggressiveness. We optimized several ML/DL frameworks on T2w, ADC and T2w+ADC data, using a patient-based nested validation scheme. The dataset was composed of 112 patients (132 peripheral lesions with Prostate Imaging Reporting and Data System (PI-RADS) score ≥ 3) acquired following both PI-RADS 2.0 and 2.1 guidelines. Firstly, ML/DL frameworks trained and validated on PI-RADS 2.0 data were tested on both PI-RADS 2.0 and 2.1 data. Then, we trained, validated and tested ML/DL frameworks on a multi PI-RADS dataset. We reported the performances in terms of Area Under the Receiver Operating curve (AUROC), specificity and sensitivity. The ML/DL frameworks trained on T2w data achieved the overall best performance. Notably, ML and DL frameworks trained and validated on PI-RADS 2.0 data obtained median AUROC values equal to 0.750 and 0.875, respectively, on unseen PI-RADS 2.0 test set. Similarly, ML/DL frameworks trained and validated on multi PI-RADS T2w data showed median AUROC values equal to 0.795 and 0.750, respectively, on unseen multi PI-RADS test set. Conversely, all the ML/DL frameworks trained and validated on PI-RADS 2.0 data, achieved AUROC values no better than the chance level when tested on PI-RADS 2.1 data. Both ML/DL techniques applied on mpMRI seem to be a valid aid in predicting PCa aggressiveness. In particular, ML/DL frameworks fed with T2w images data (objective, fast and non-invasive) show good performances and might support decision-making in patient diagnostic and therapeutic management, reducing intra- and inter-reader variability.
1 Introduction
Prostate cancer (PCa) is the most frequent male malignancy and the third cause of cancer death in European men with significant consequences for healthcare systems (1). In biopsy-naïve men the clinical suspicion of PCa is based on an elevated serum prostate-specific antigen (PSA) level and/or an abnormal digital rectal examination. However, multiparametric (mp) MRI is strongly recommended before biopsy (2, 3), because the latter procedure, if it’s not targeted, has low sensitivity and specificity, thus leading to underdiagnosis of clinically significant PCa and to overdiagnosis of non clinically significant PCa.
Indeed, over the last decades, mpMRI has become increasingly valuable for the detection and staging of PCa, gaining a key role in the diagnostic pathway (4) and apparent advantages compared to the systematic transrectal ultrasonography-guidedbiopsy (TRUSGB) (5). Firstly, it can rule out non clinically significant (cs) PCa, thus reducing the number of unnecessary prostate biopsies and overdiagnosis. Secondly, it also enables targeted biopsies of suspected lesions, allowing better risk stratification (6, 7). However, performing many mpMRI acquisitions and reporting is an essential challenge for the uroradiological community. Efforts have been made in creating and constantly updating the Prostate Imaging Reporting and Data System (PI-RADS) guidelines that recommend a systematized mpMRI acquisition and define a global standardization of reporting (8). In particular, the PI-RADS score assigns a numerical value in the interval [1 - 5] to the suspected lesion, correlated with the probability of the lesion being a cs malignancy. However, there is still a lack of consensus on the detailed aspects of mpMRI acquisition protocols and the radiologists’ requirements for reading the examinations (e.g., experience prerequisites for independent reporting are still absent) (9). For these reasons, the assessment of csPCa is still based on visual, qualitative evaluation with individual level reports, and the diagnostic process is relatively slow, subjective, and dependent on the experience level of the radiologist. For example, fewer cases with PI-RADS score equal to 3, which corresponds to an indeterminate probability of csPCa, have been reported from expert readers compared to non-expert ones (6, 10). Additionally, the PI-RADS score measures the probability of malignancy and not the PCa aggressiveness. Thus, the biopsy is still needed to assess the csPCa aggressiveness by measuring the International Society of Urological Pathology (ISUP) Grade Group (GG) and the Gleason Score (GS) (11). The assessment of PCa aggressiveness is fundamental for patient management because lower-grade cancers grow more slowly and are less likely to spread toward other organs than high-grade cancers (4, 12–18). Therefore, assessing the tumor aggressiveness is an essential step in guiding the urologist’s therapeutic choice, together with the TNM stage and other factors, e.g., individual life expectancy, general state and health and preference of the individual patient. Quantitative assessment of lesion aggressiveness on mpMRI might reinforce MRI importance, role, and value in PCa diagnostic, prognostic and monitoring pathway, providing the radiologist with an objective and noninvasive tool and thus decreasing intra- and inter-reader variability (19). This would permit the urologist to accordingly choose and/or modify the management approach, optimizing quality of life of many patients. In biopsy naïve patients, those with non clinically significant PCa may directly avoid or postpone any treatment or may begin active surveillance, thus reducing the number of biopsies and lessening the risk of overdiagnosis and overtreatment. During active surveillance, in a protocol-mandated future perspective, together with PSA and clinical data, quantitative mpMRI and relative analyses could actively bring out lesion progression, maybe reducing the need of re-biopsies.
In this view, radiomics deals with the extraction of high-dimensional quantitative features from clinical images using advanced mathematical algorithms (20, 21). These imaging features can be related to physiological and clinical outcomes to identify possible associations (22). Due to their high dimensionality, Machine Learning (ML) methods are increasingly being incorporated into radiomic studies (22). At the same time, Deep Learning (DL) algorithms can learn valuable features from raw images directly showing promising results in various computer vision tasks and are emerging as a disruptive alternative to feature engineering-based techniques (23). In recent years, many studies used radiomics in combination with ML/DL models on mpMRI data of PCa patients with the ultimate goal of assisting the radiologist in the diagnostic workflow (19). The frontrunners focused primarily on the proof of concept of radiomics and ML/DL techniques to detect prostate lesions or differentiate malign from benign lesions (24–35). More recent literature investigated the clinically relevant problem of identifying high-grade vs. low-grade tumors (19). Despite the promising results, previous literature presents critical issues that prevent a direct comparison among the different results and a reliable application in daily clinical practice. Specifically, from a clinical point of view, the outcomes have been obtained by predicting at the MR slice level (28, 36–38) rather than at the lesion level, as it is good practice in clinical reporting. These results, therefore, can not be deployed in a real clinical context. Moreover, only a few studies have used an independent cohort to evaluate the obtained models on external data (27, 39–45). Methodologically, previous works usually lack sufficient details to make them reproducible and seem to suffer from data leakage, reporting overly optimistic results (28, 36–38, 44–51). In mpMRI of PCa, the most common data leakage causes are i) inappropriate validation schemes, where the data split is based on the single MRI slice and not on the whole lesion and/or patient (37, 38), ii) the absence of a nested process for the hyperparameters optimization (28, 36, 37, 44–51). Moreover, in previous works the authors trained a small number of specific algorithms, the selection of which is not been adequately motivated (36, 38, 44–46, 49–51).
For these reasons, in this paper, we have investigated the potential role of several ML and DL frameworks in predicting PCa aggressiveness from mpMRI data, using a computational workflow that prevents the previously mentioned issues. Indeed, we trained, validated, and tested ML/DL frameworks (i.e., the concatenation of preprocessing steps and the actual classification models) using a patient-based nested validation scheme, to perform, at the same time, hyperparameters optimization, models selection, and the estimation of generalization performance on unseen data, without data leakage, at lesion level. Our cohorts contained overall 112 PCa patients, whose peripheral lesions obtained a PI-RADS score ≥ 3. All the ML and DL frameworks have been developed on data acquired following PI-RADS 2.0 guidelines. To evaluate the learning capabilities of ML/DL frameworks on data acquired with different protocols, a PI-RADS 2.1 cohort has been used as additional test set and the entire ML/DL analysis workflow has been repeated on a multi-PI-RADS dataset, constructed by merging images acquired following the PI-RADS 2.0 and 2.1 guidelines.
2 Material and Methods
2.1 Participants and MRI Examinations
Our study is monocentric and observational. Between June 2018 and December 2019, we enrolled 112 histopathologically confirmed peripheral zone PCa patients who underwent free-hand transperineal MRI/US fusion-guided targeted biopsy based on a positive/indeterminate mpMRI result, i.e., PI-RADS score ≥ 3. All mpMRI examinations were performed using a 1.5 T MR scanner equipped with an anterior pelvic phased-array 18-channel coil and a posterior spine phased-array 16-channel coil (Magnetom Aera, Siemens Medical Systems, Erlangen, Germany). Eighty-five patients have been acquired following the PI-RADS 2.0 guidelines, while the other 27 have been examined with mpMRI protocols according to the latest guidelines of PI-RADS 2.1. Aware that the PI-RADS 2.1 guidelines did not change the requirements for T2w acquisitions, in this study, the T2w image acquisition protocol was also changed, to obtain a better quality image while adhering to the guidelines (details in Supplementary Section 1.1). In our study, we focused on the most clinically relevant images, i.e., T2w images and ADC maps derived from multi-b Diffusion Weighted (DW) images. Three uro-radiologists (SA, EB, LM) with, respectively, 10, 6, and 2 years of experience in prostatic radiology, evaluated all MRI exams and assigned the PI-RADS scores in consensus. The lesions were manually segmented on T2w images and ADC maps. We show examples of mpMR images and segmentations in Figures 1–3. Histopathological examination, performed on the specimen taken during biopsy, provided the PCa aggressiveness by measuring the GS and the ISUP GG, which better reflects PCa biology (52). Because of different prognostic significance, we have identified low-grade (LG) lesions [i.e., with ISUP GG ≤ 2 and GS ≤ 7 (3 + 4)] and high-grade (HG) lesions [i.e., with ISUP GG≥3 and GS≥7 (4 + 3)]. Our final PI-RADS 2.0 cohort was composed of 85 patients and 103 lesions, while PI-RADS 2.1 cohort was formed by 27 patients and 29 lesions (details in Table 1).
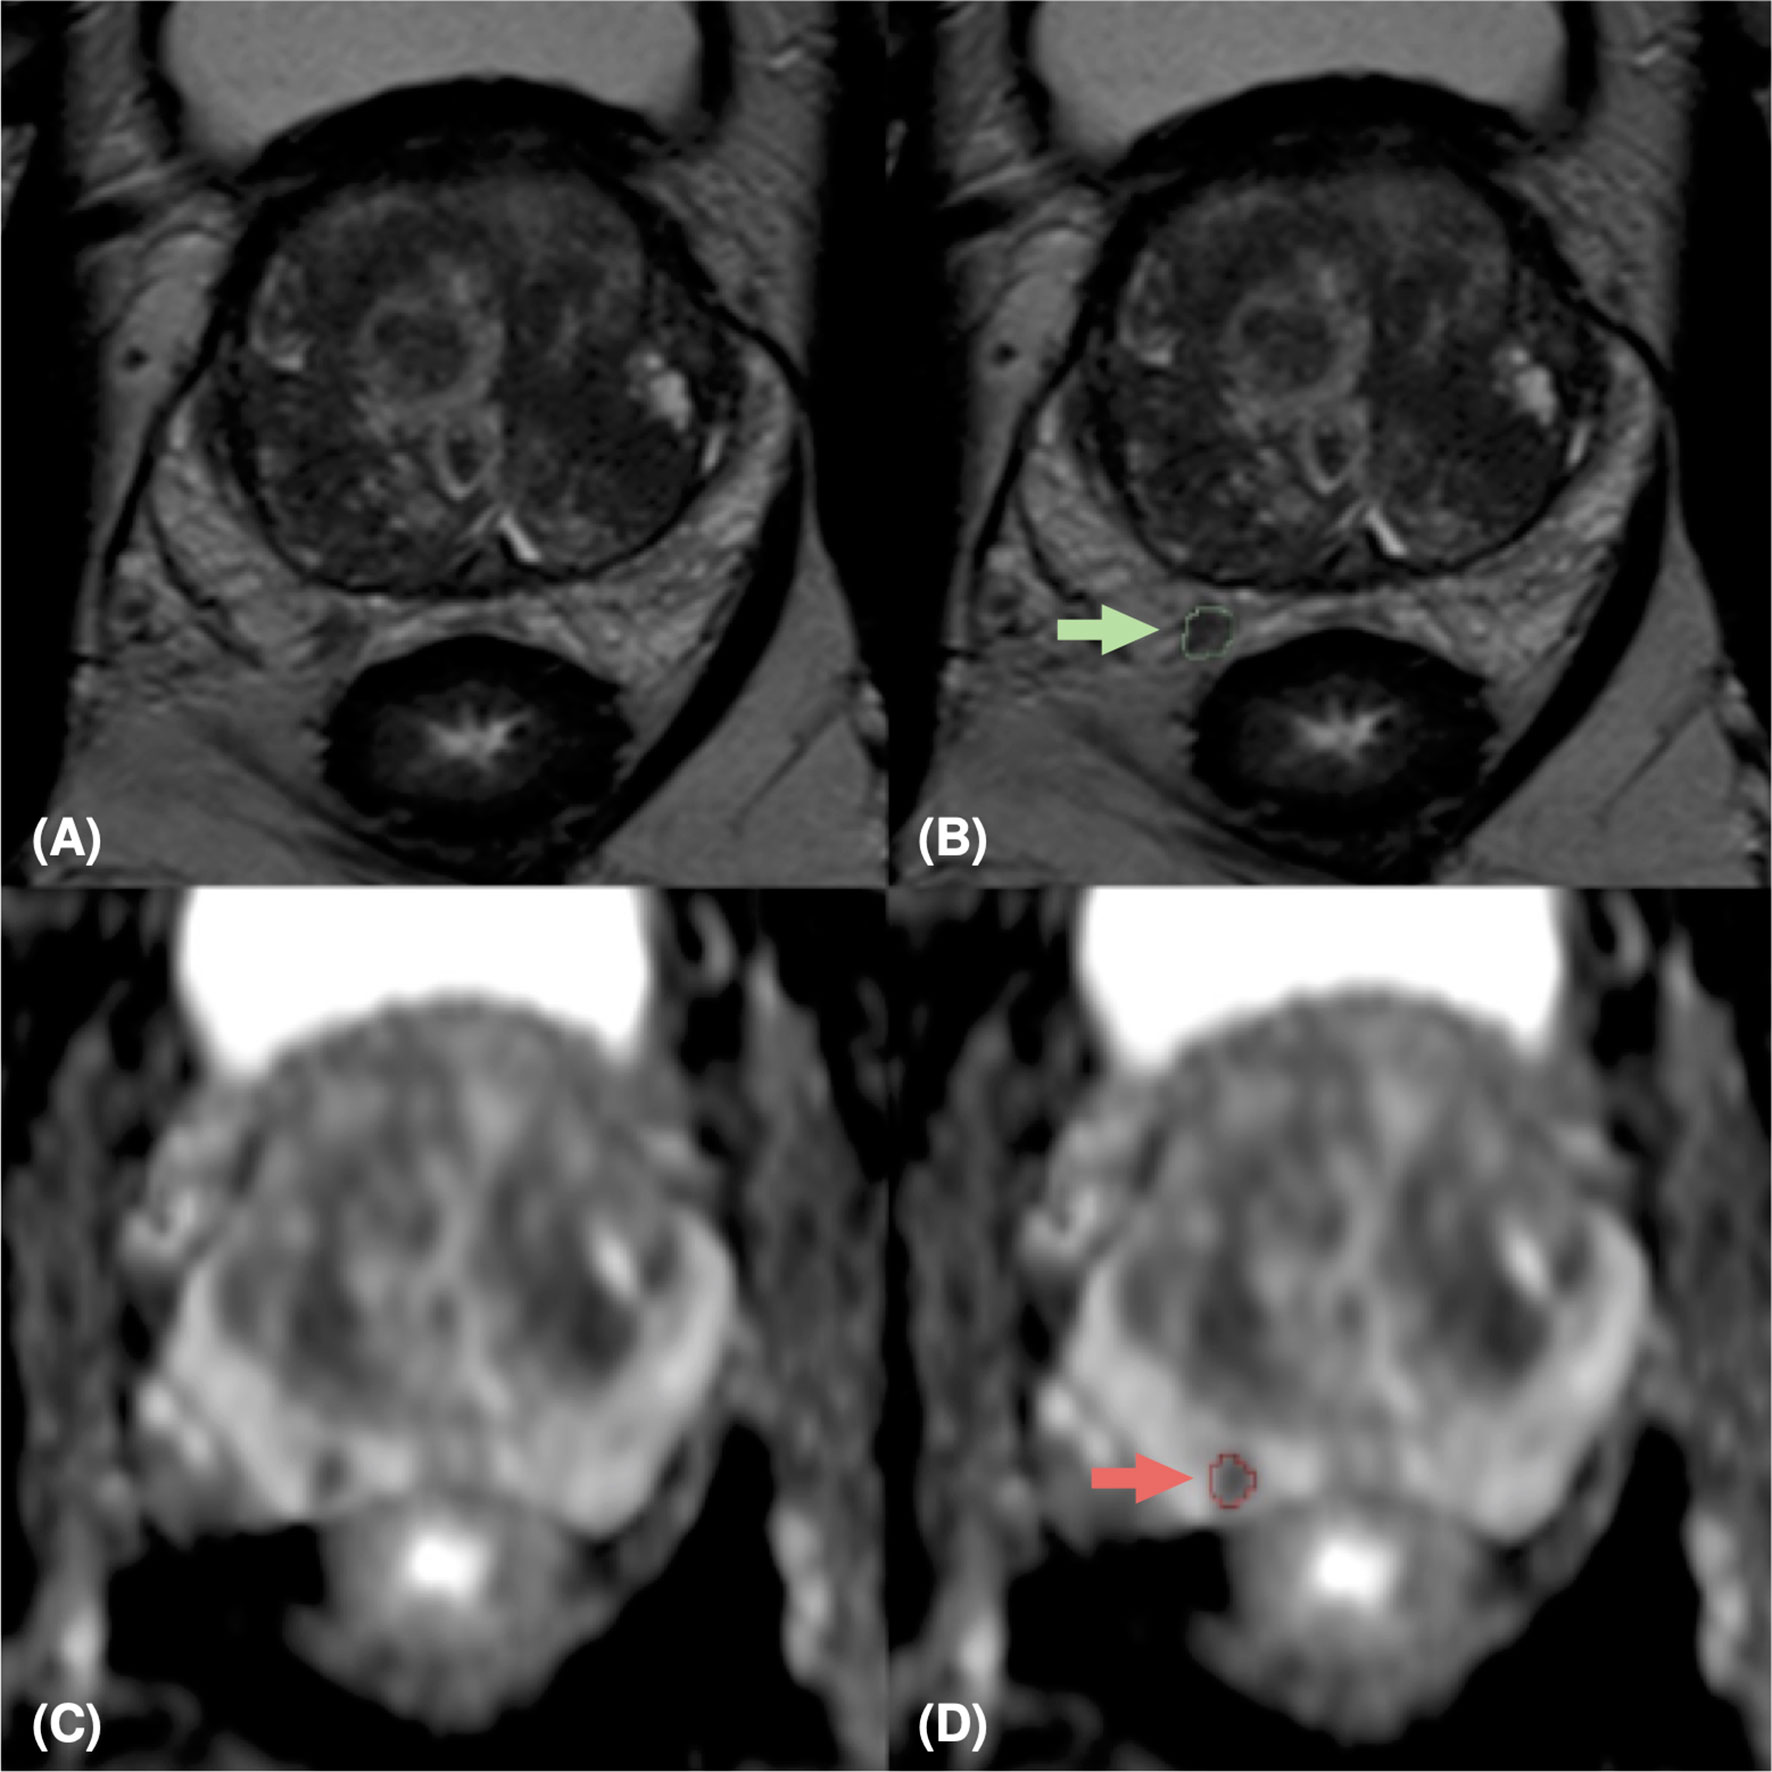
Figure 1 MpMRI of a 76-years old patient with indeterminate mpMRI result (PI-RADS=4), PSA=14 ng/ml, GS=4+4 (ISUP 4). MpMRI zoomed images containing the target lesion, respectively axial T2-weighted image (A), ADC map (C), and their relative lesion segmentations (B, D). The green (B) and red (D) arrows point out the segmented lesion in T2 and ADC images, respectively.
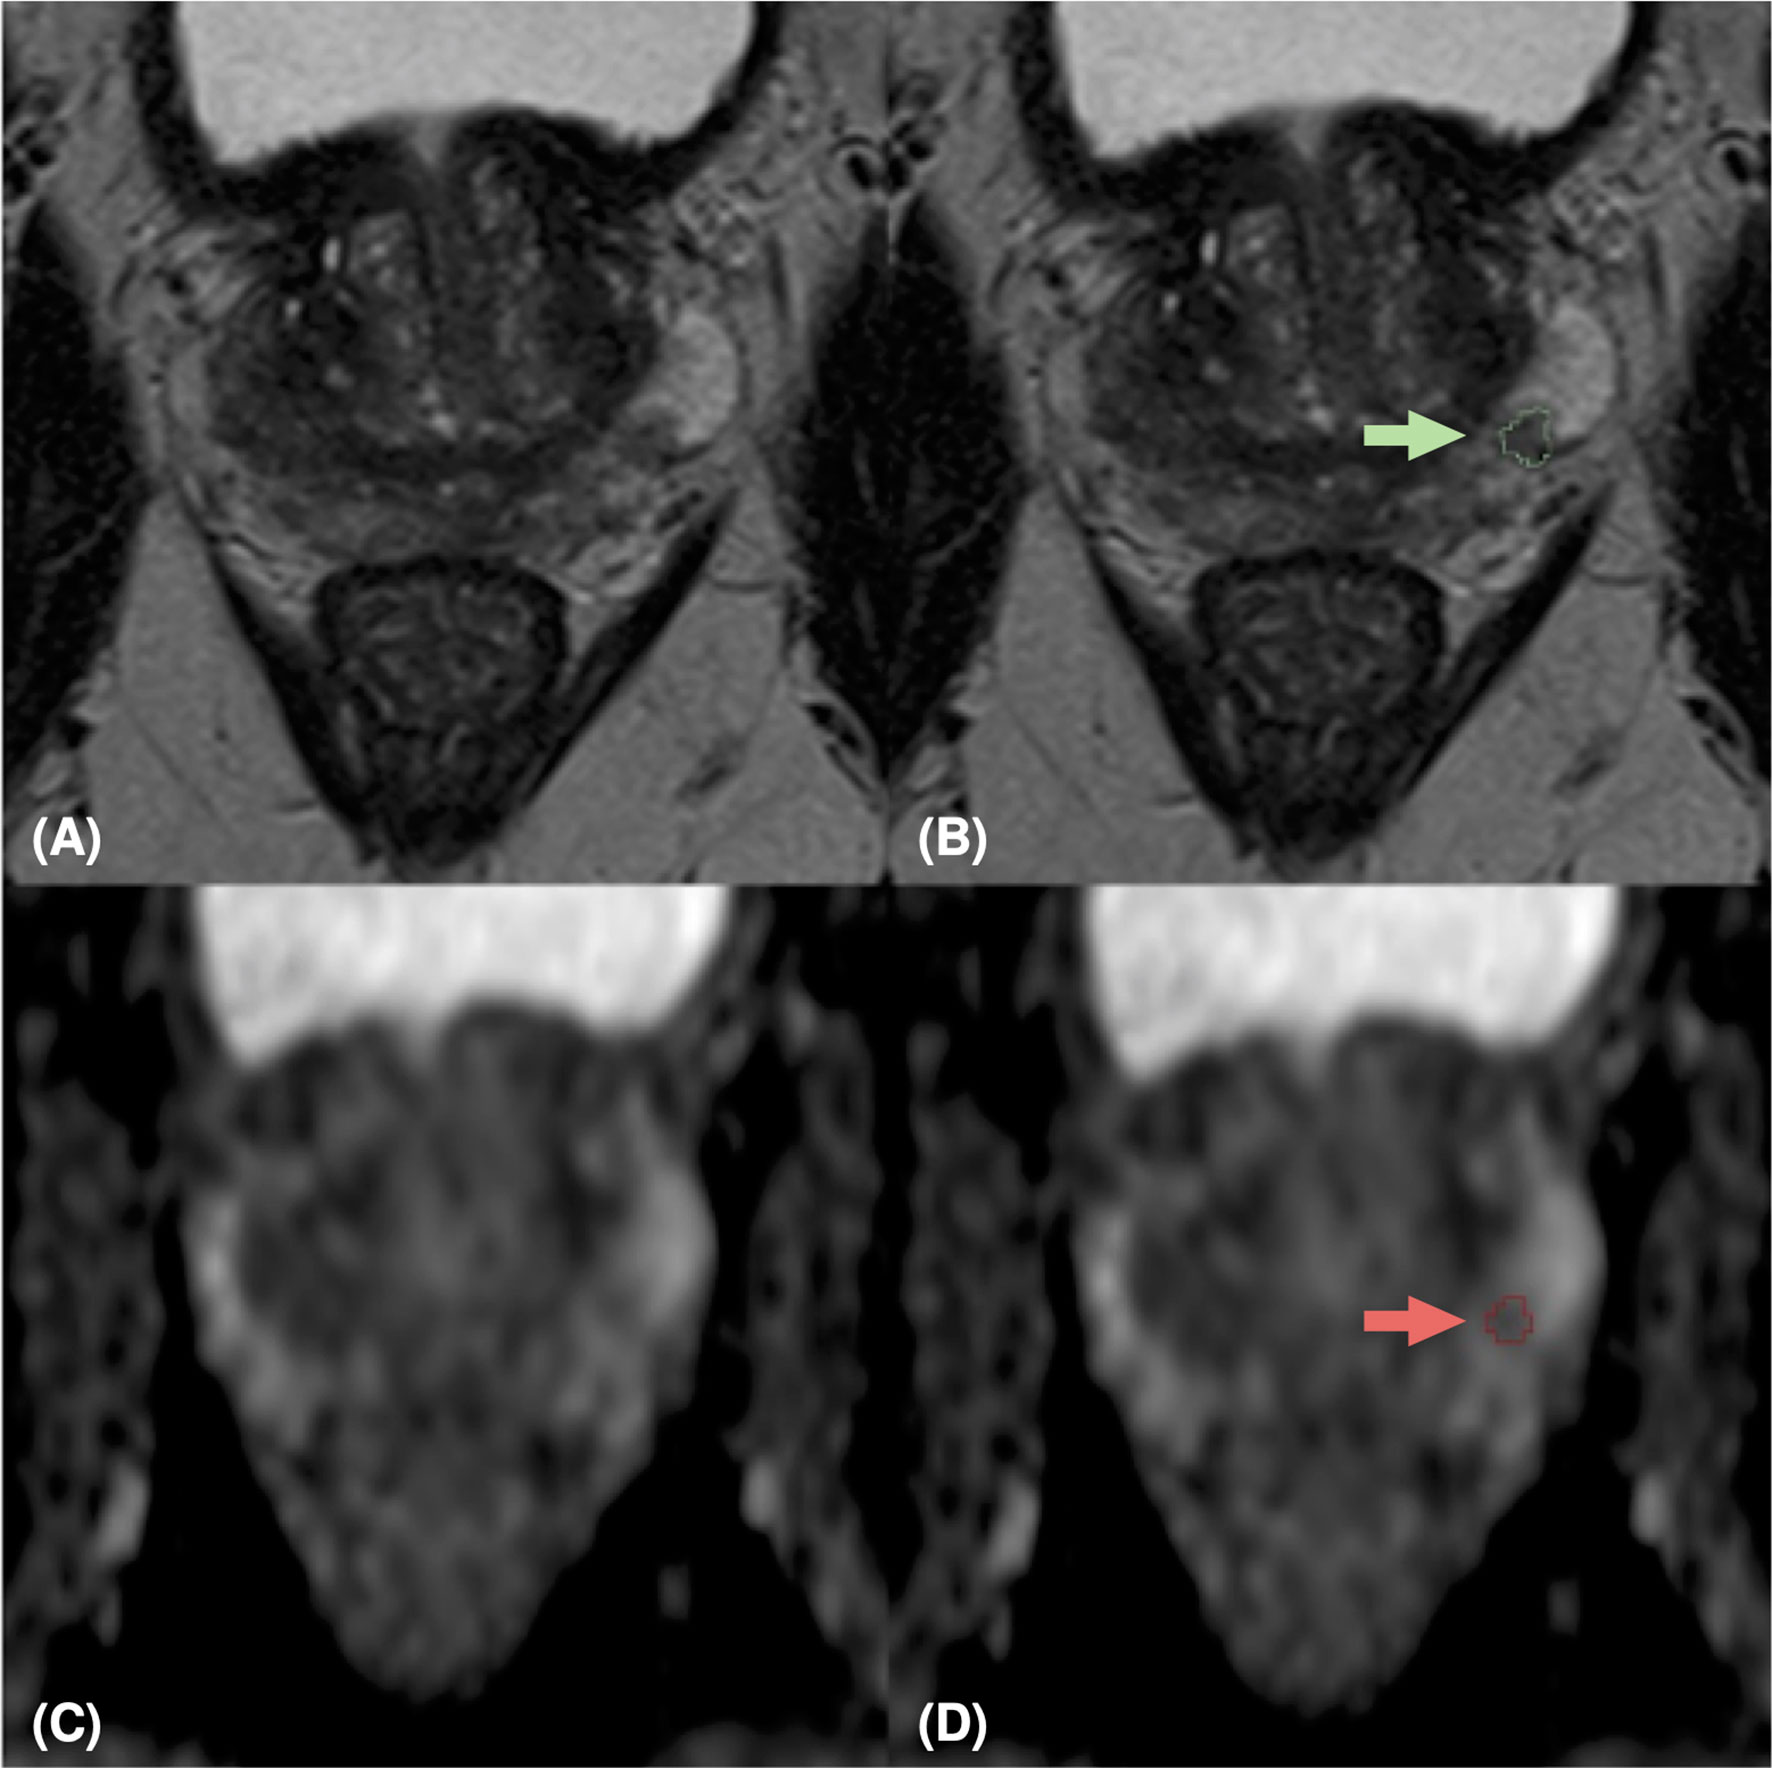
Figure 2 MpMRI of a 65-years old patient with indeterminate mpMRI result (PI-RADS=3), PSA=5.49 ng/ml, GS=3+4 (ISUP 2). MRI zoomed images containing the target lesion, respectively axial T2-weighted image (A), ADC map (C), and their relative lesion segmentations (B, D). The green (B) and red (D) arrows point out the segmented lesion in T2 and ADC images, respectively.
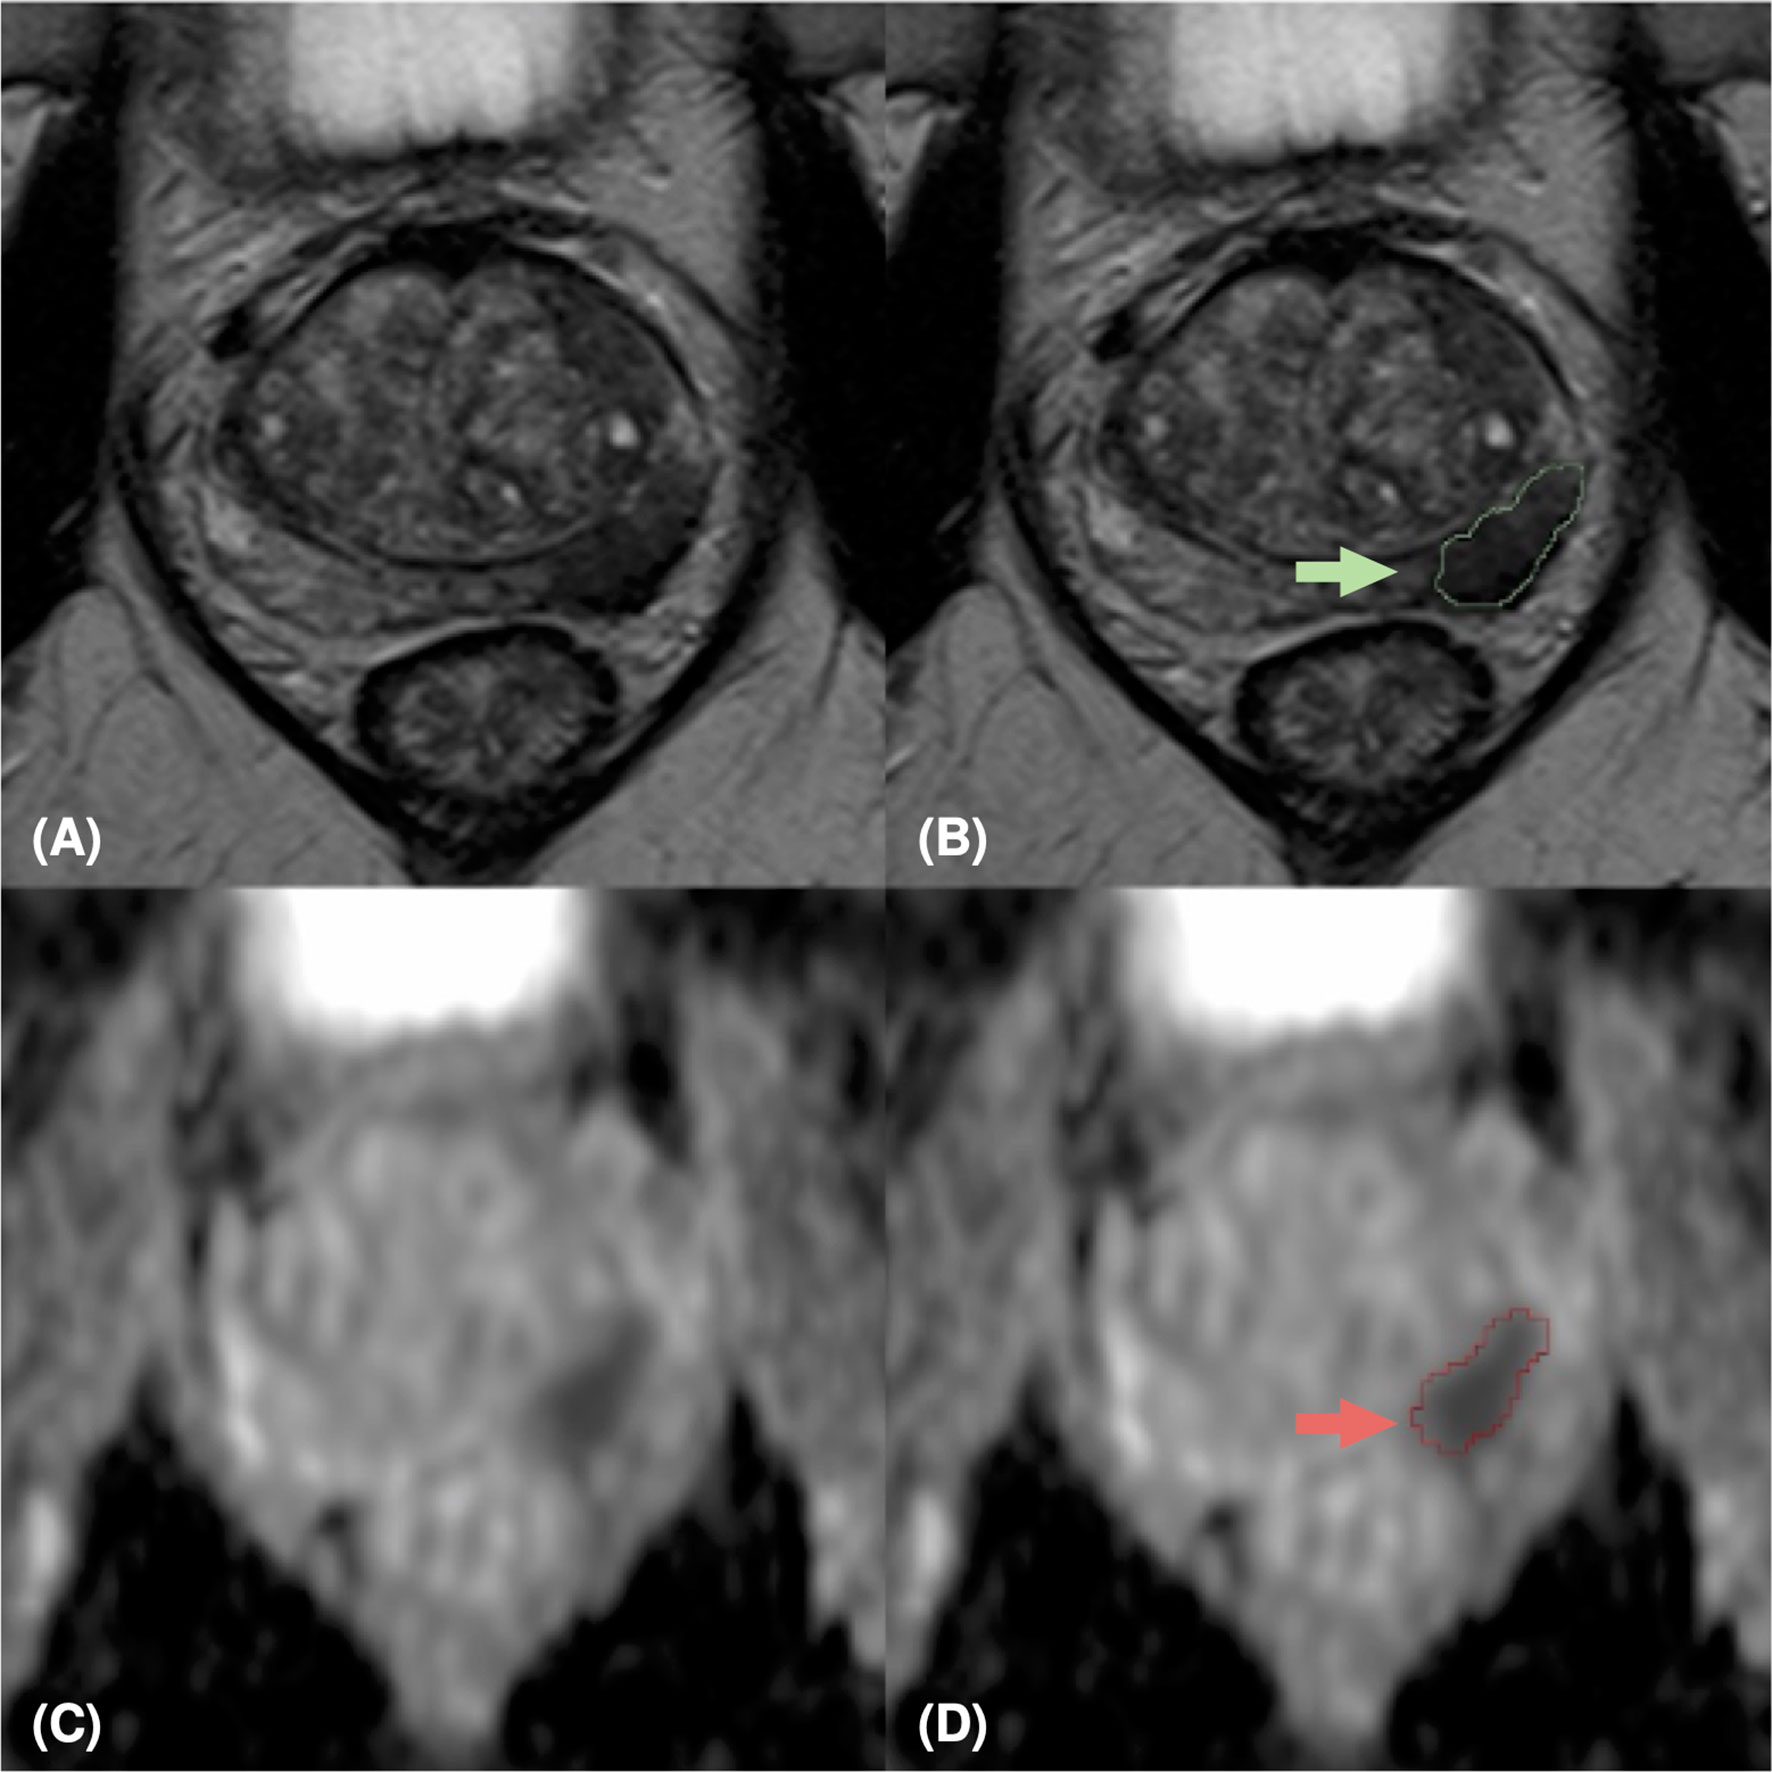
Figure 3 MpMRI of a 69-years old patient with positive mpMRI result (PI-RADS=5), PSA level=7 ng/ml, GS=4+4 (ISUP 4). MRI zoomed images containing the target lesion, respectively axial T2-weighted image (A), ADC map (C), and their relative lesion segmentations (B, D). The green (B) and red (D) arrows point out the segmented lesion in T2 and ADC images, respectively.
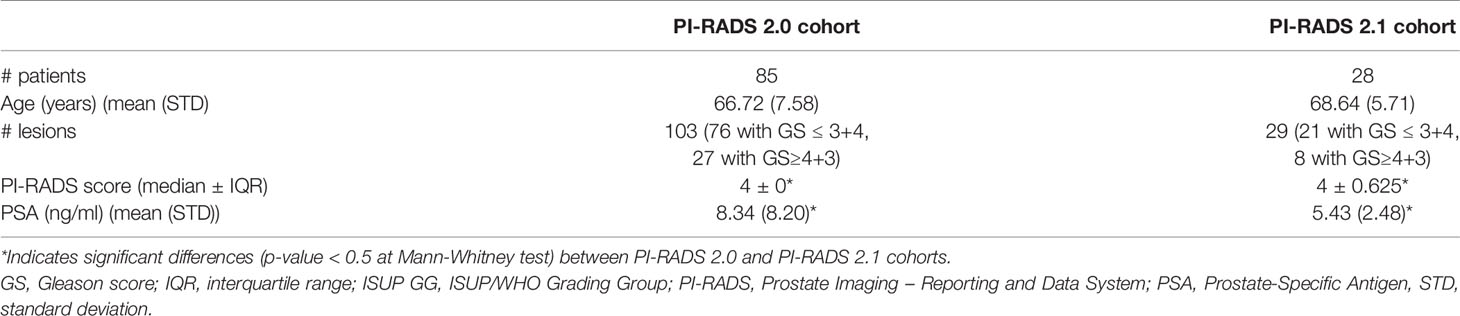
Table 1 Descriptive statistics of our cohorts. GS ≤ 3+4 is equivalent to ISUP GG ≤ 2, and GS≥4+3 corresponds to ISUP GG≥3.
2.2 Prediction of PCa Aggressiveness Using Machine Learning Techniques
In this study, we predicted the lesion aggressiveness (i.e., LG vs. HG) from T2w images and ADC maps. In particular, we exploited two different strategies: (i) conventional ML techniques to identify the predictive power of the radiomic features extracted from each lesion; (ii) DL architectures to extract complex and aggressiveness-related features directly from raw images. All the frameworks presented below were trained, validated, and tested starting from either T2w images only, ADC maps only, or the combination of the two acquisition modalities, from now on referred as T2w/ADC/T2w+ADC. We have detailed the experimental tests of ML/DL analysis in Supplementary Section 1.2.
2.2.1 ML Analysis: Radiomics Features Extraction and Models
For each slice, we computed a total of 95 2D radiomics features in compliance with the Image Biomarker Standardisation Initiative (IBSI) (details in Supplementary Section 1.3 and Tables S1, S2). In the training set only, we performed a data augmentation by oversampling the minority class (i.e., the HG group) to reduce the effect of the imbalanced dataset (ratio LG : HG=2:1). Accordingly, we applied either Adaptive Synthetic (ADASYN) (53) or Synthetic Minority Oversampling TEchnique (SMOTE) (54) and its variants, i.e., the BorderlineSMOTE (55), SVMSMOTE (56) with default parameters.
Since, in general, it is not possible to define a priori the best class of ML models in a given problem (57), we used several popular and powerful supervised classes of ensemble classifiers. They are able to combine the predictions of several base classifiers with the aim of improving generalizability and robustness over a single ML classifier. In particular, we used three averaging methods, i.e., Bagging (58), Random Forests (59), and randomized decision trees (a.k.a. extra-trees) (60). Also, we employed three boosting methods, i.e., AdaBoost (61), Gradient Boosting (62), and eXtreme Gradient Boosting (XGBoost) (63). A grid consisting of different combinations of hyperparameters to optimize has been defined for each algorithm (Table S3). We detailed the training, validation and testing of the ML frameworks in Section 2.2.3.
2.2.2 DL Analysis: Data Preprocessing and CNN Architectures
In this study, we designed Convolutional Neural Networks (CNN) working on 2D data. We cropped each slice containing the tumor tissue around the center of the lesion yielding T2w images of 64 x 64 pixels and ADC maps of 44 x 44 pixels. Hereinafter, we will name C-DS (Cropped-Dataset) this dataset of 2D images. In addition, from these cropped images, we generated the L-DS (Lesion-Dataset) obtained by exploiting the segmentation mask provided by radiologists (i.e., setting to zero the intensity of pixels not belonging to the tumor lesion). The former dataset was intended to provide a model robust against segmentation inaccuracies, and to assess whether the tissue around the lesion contributed with helpful information (e.g., exploiting the contrast between tumor and benign tissue as a potentially significant feature). The latter allowed a consistent comparison with radiomics-based analysis and ML approach. We adopted data augmentation techniques to compensate for class-imbalance. In the training set only, we added new instances of original HG images, generated by rotation (angle randomly sampled in the range [-25, 25] degrees), translation (horizontal and vertical shift randomly sampled in the range [-0.02, 0.02] image width/height, respectively), and vertically and horizontally flip.
Since it is not possible to define a priori the architecture of the CNN that best performs a specific task, a two-step optimization strategy has been completed: a grid search to select the most promising network architecture and a random search to optimize the hyperparameters (details in Supplementary Section 1.4 and Tables S4–S6). The output of the grid and random searches was a set of six CNN architectures with their best hyperparameters: three of them trained with L-DS T2w/ADC/T2w+ADC images and the others trained with C-DS T2w/ADC/T2w+ADC images. Moreover, we added two Attention Gates (AGs) to the three optimal architectures trained on C-DS T2w/ADC/T2w+ADC images (64). AGs help the CNN to focus on target structures by suppressing irrelevant regions and highlighting important ones with the goal of improving prediction performance (64). Also, AGs showed to be more efficient when placed on layers handling higher-level and more specific features (64). Hence, we tested different placements for the AGs, considering only the middle and the final layers of the architecture (details in Supplementary Section 1.4).
2.2.3 Training, Validation, and Test of ML/DL Frameworks
In this work we used the term framework to refer to concatenation of the different steps of our analysis. Indeed, ML approach involved data standardization, data augmentation, and classifier estimation. At the same time, DL consisted of the data augmentation followed by the network that performs the classification (Figure S1).
For each acquisition modality, the ML/DL frameworks have been trained, validated, and tested using the following approach (Figure 4): 87% of the entire PI-RADS 2.0 cohort was considered as the development set 2.0, and the remaining 13% as the independent test set 2.0. The PI-RADS 2.1 cohort has been used in two different ways: firstly, we have considered the entire cohort as an independent test set, and, secondly, we have split it in development set 2.1, containing images of 19 PCa patients, and test set 2.1, with images of eight patients. This last division allowed to create two new multi PI-RADS datasets. The multi PI-RADS development set consisted of the development 2.0 merged with development 2.1 and multi PI-RADS test set, composed of test set 2.0 and test set 2.1.
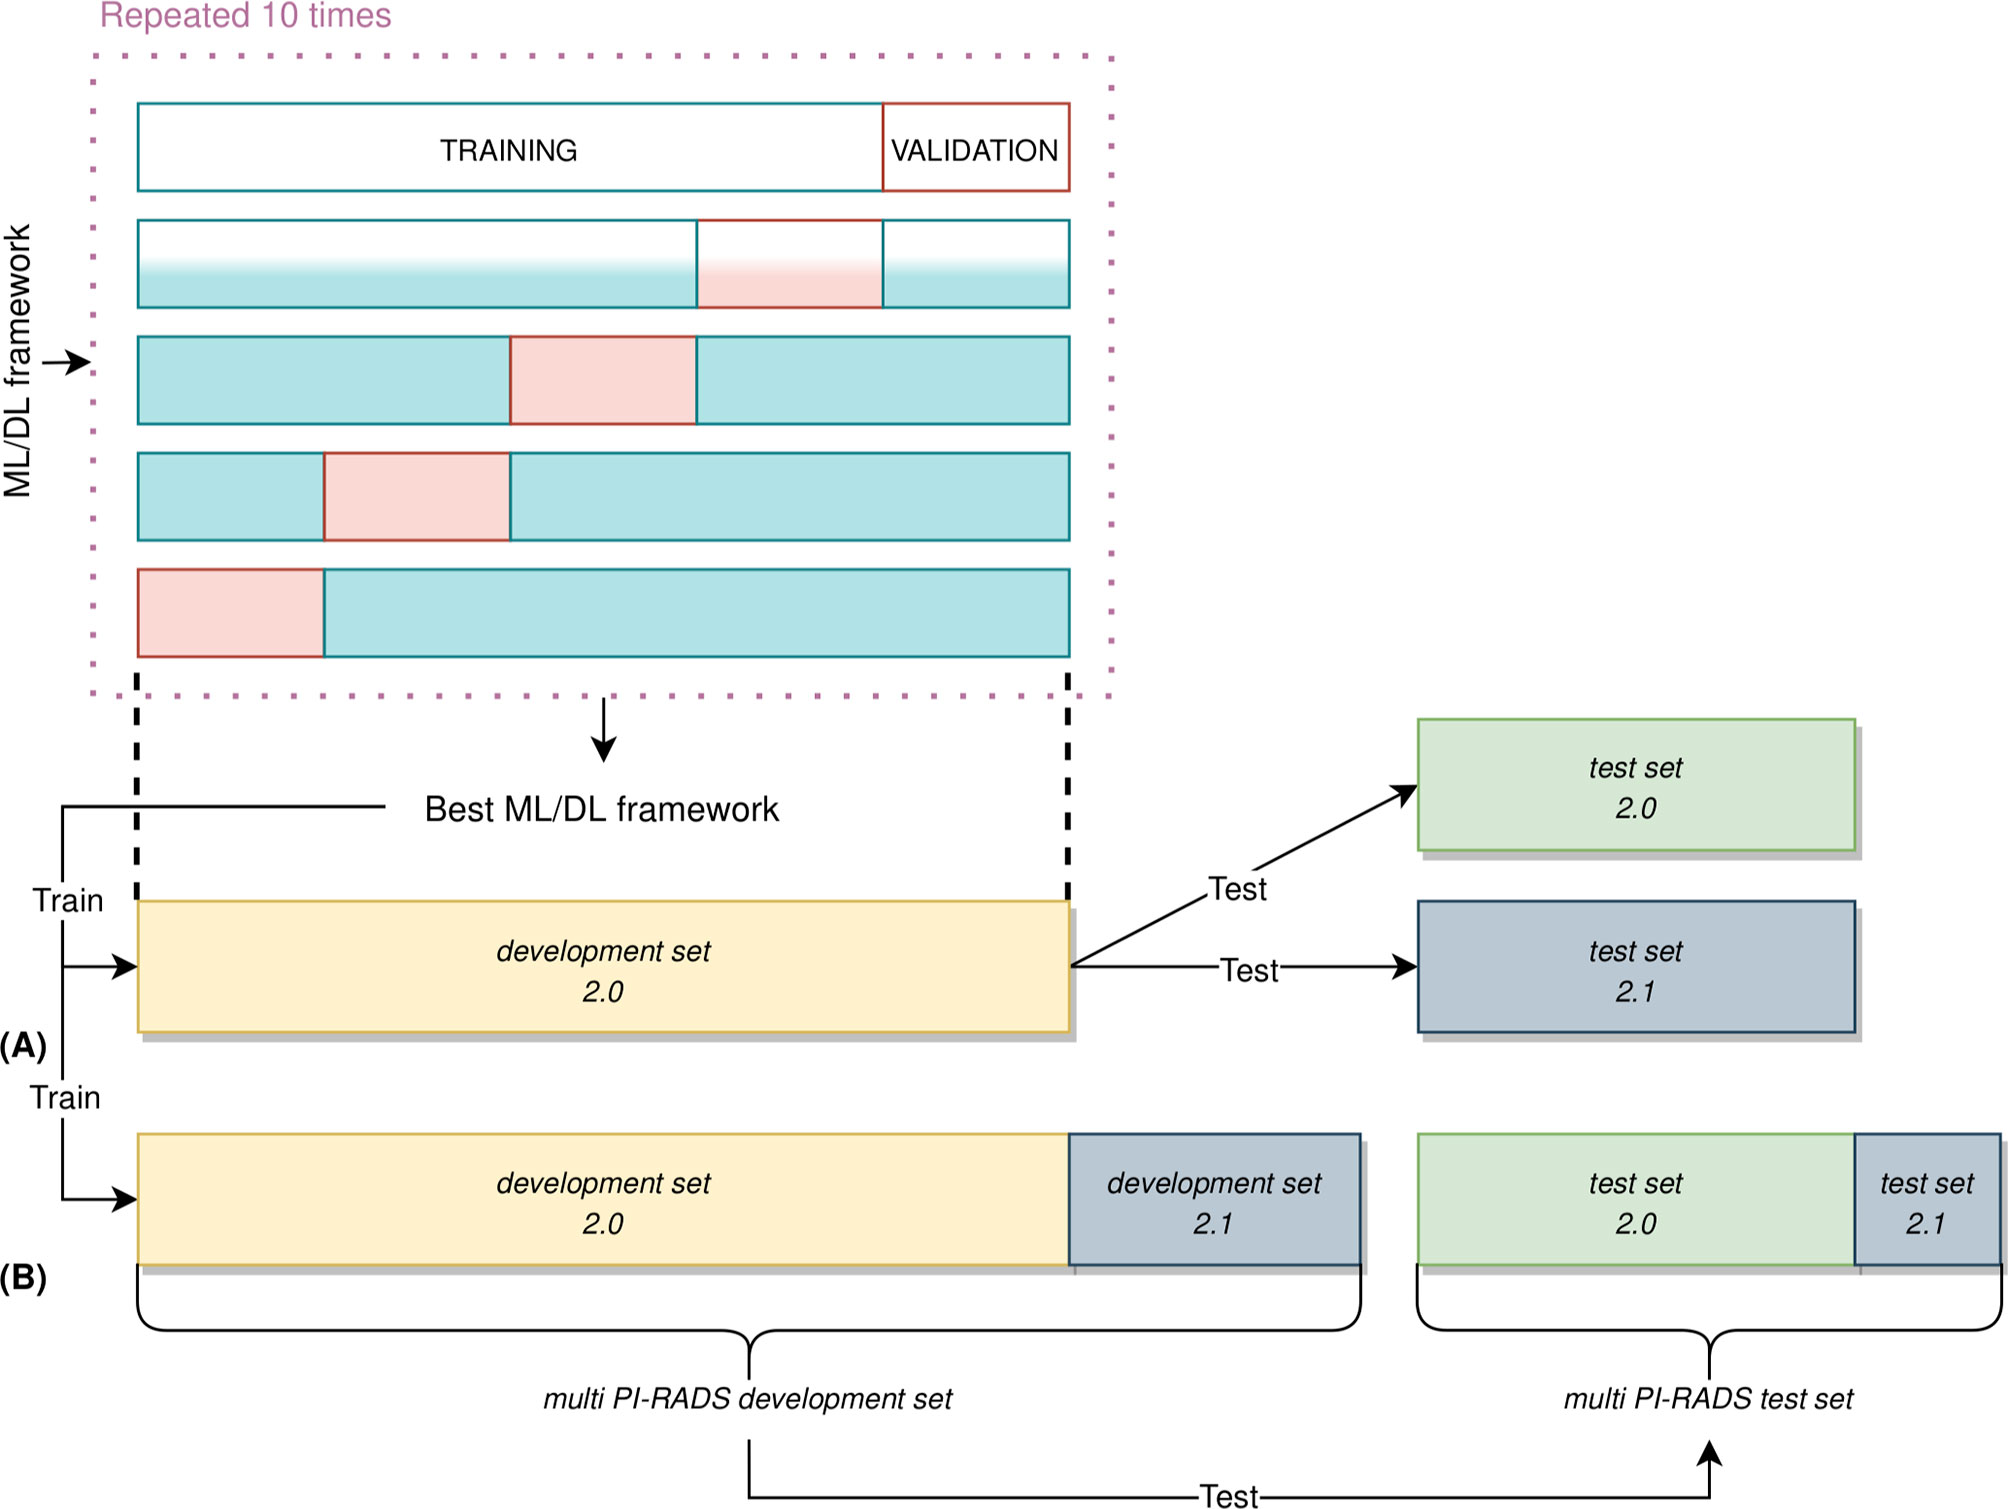
Figure 4 Nested validation scheme in our ML/DL analysis. (A) On development set 2.0 only, 5-fold CV was used to identify the best performing framework, along with performing hyperparameters optimization. The best performing ML/DL framework was then used to train the final framework on the entire development set 2.0. This framework was then evaluated on an unseen test set 2.0 and test set 2.1, independently. (B) The best performing framework was still trained on multi PI-RADS development set (i.e., the union of development set 2.0 and development set 2.1 and evaluated on unseen multi PI-RADS test set (i.e., the union of test set 2.0 and test set 2.1).
On the development set 2.0, each model has been trained and validated using a patient-level, stratified 5-fold cross-validation (CV) strategy to perform framework selection along with hyperparameters optimization (65). In the 5-fold CV, 4 folds were used as training set while the other one as the validation set (details in Supplementary Section 1.5). The CV procedure has been repeated ten times using different random splits to deal with the variability in framework and hyperparameters selection derived from a specific data split (66). We have computed the average and standard deviation of the Area Under the Receiver Operating curve (AUROC) across all repetitions to get the final scores. The best frameworks were chosen based on the average AUROC scores in the validation set. Finally, the best frameworks were retrained on the whole development set 2.0 and tested on the unseen test set 2.0 and test set 2.1, independently. Moreover, the same ML/DL framework has been trained on the multi PI-RADS development set and evaluated on the multi PI-RADS test set. In order to consider the variability in the AUROC measurement due to the randomness of our test data, we drew additional bootstrap test sets of size equal to the original test set’s one (67, 68). Briefly, we randomly sampled, with replacement, the original test set data at the lesion level. The bootstrap sampling was repeated 1000 times, and the optimal ML/DL framework was then tested on each of these new additional bootstrap sample test sets, resulting in a series of AUROC values. We computed the median, 5th and 25th percentiles of AUROC values. Details about DL frameworks retraining has been reported in Supplementary Section 1.5.
3 Results
In the following, we report the performance of the best ML/DL frameworks selected in the validation set in terms of median AUROC for T2w/ADC/T2w+ADC data. Table 2 and Figures 5A–H summarizes all the prediction performances.
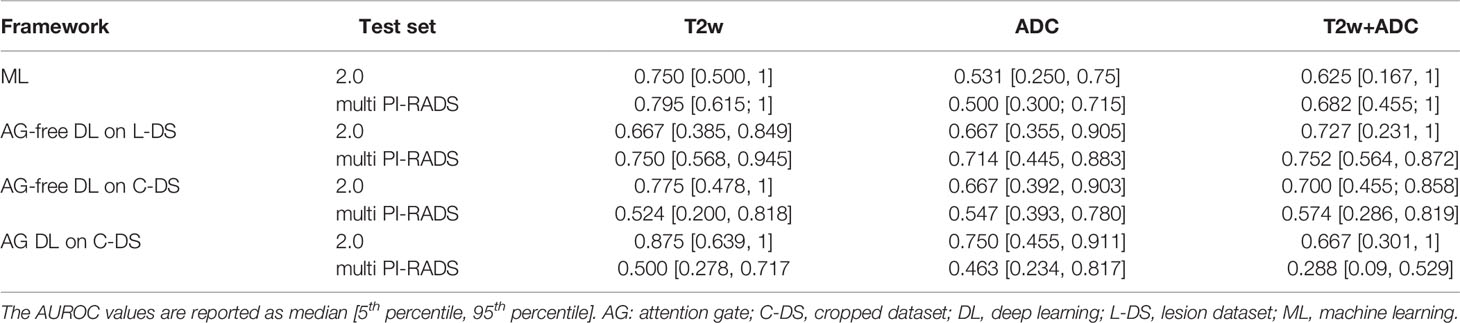
Table 2 AUROC values of ML and DL analyses for T2w/ADC/T2w+ADC.
3.1 ML Analysis
On the test set 2.0, the framework trained with radiomic features extracted from T2w images showed the best AUROC value, i.e., 0.750. In particular, for specificity = 0.833, sensitivity was 0.750 (Figure 5A). On the other hand, the framework trained on ADC maps gave an AUROC no better than the chance level. The framework trained on T2w+ADC data obtained AUROC = 0.625). Notably, for specificity = 0.727, sensitivity was 0.667 (Figure 5A). However, this performance did not exceed that achieved by the framework trained on T2w data alone. All these frameworks, trained on radiomics features extracted from PI-RADS 2.0 T2w/ADC/T2w+ADC images, were tested also using radiomics features extracted from PI-RADS 2.1 T2w/ADC/T2w+ADC images. They all achieved AUROC values no better than the chance level (details in Table S7 and Figure S2A). For the ML frameworks trained, validated and tested un the multi PI-RADS test set, the behaviour of the performance was similar to that observed on the test set 2.0. Indeed, the framework trained with radiomic features extracted from T2w images showed the best AUROC value, i.e., 0.795. In particular, for specificity = 1.000, sensitivity was 0.666 (Figure 5B). Conversely, the framework trained on ADC maps gave an AUROC no better than the chance level. The framework trained on T2w+ADC data showed good performances (i.e., AUROC = 0.682). Notably, for specificity = 0.883, sensitivity was 0.600 (Figure 5B). However, this performance was not better than that obtained by training the framework on T2w images only.
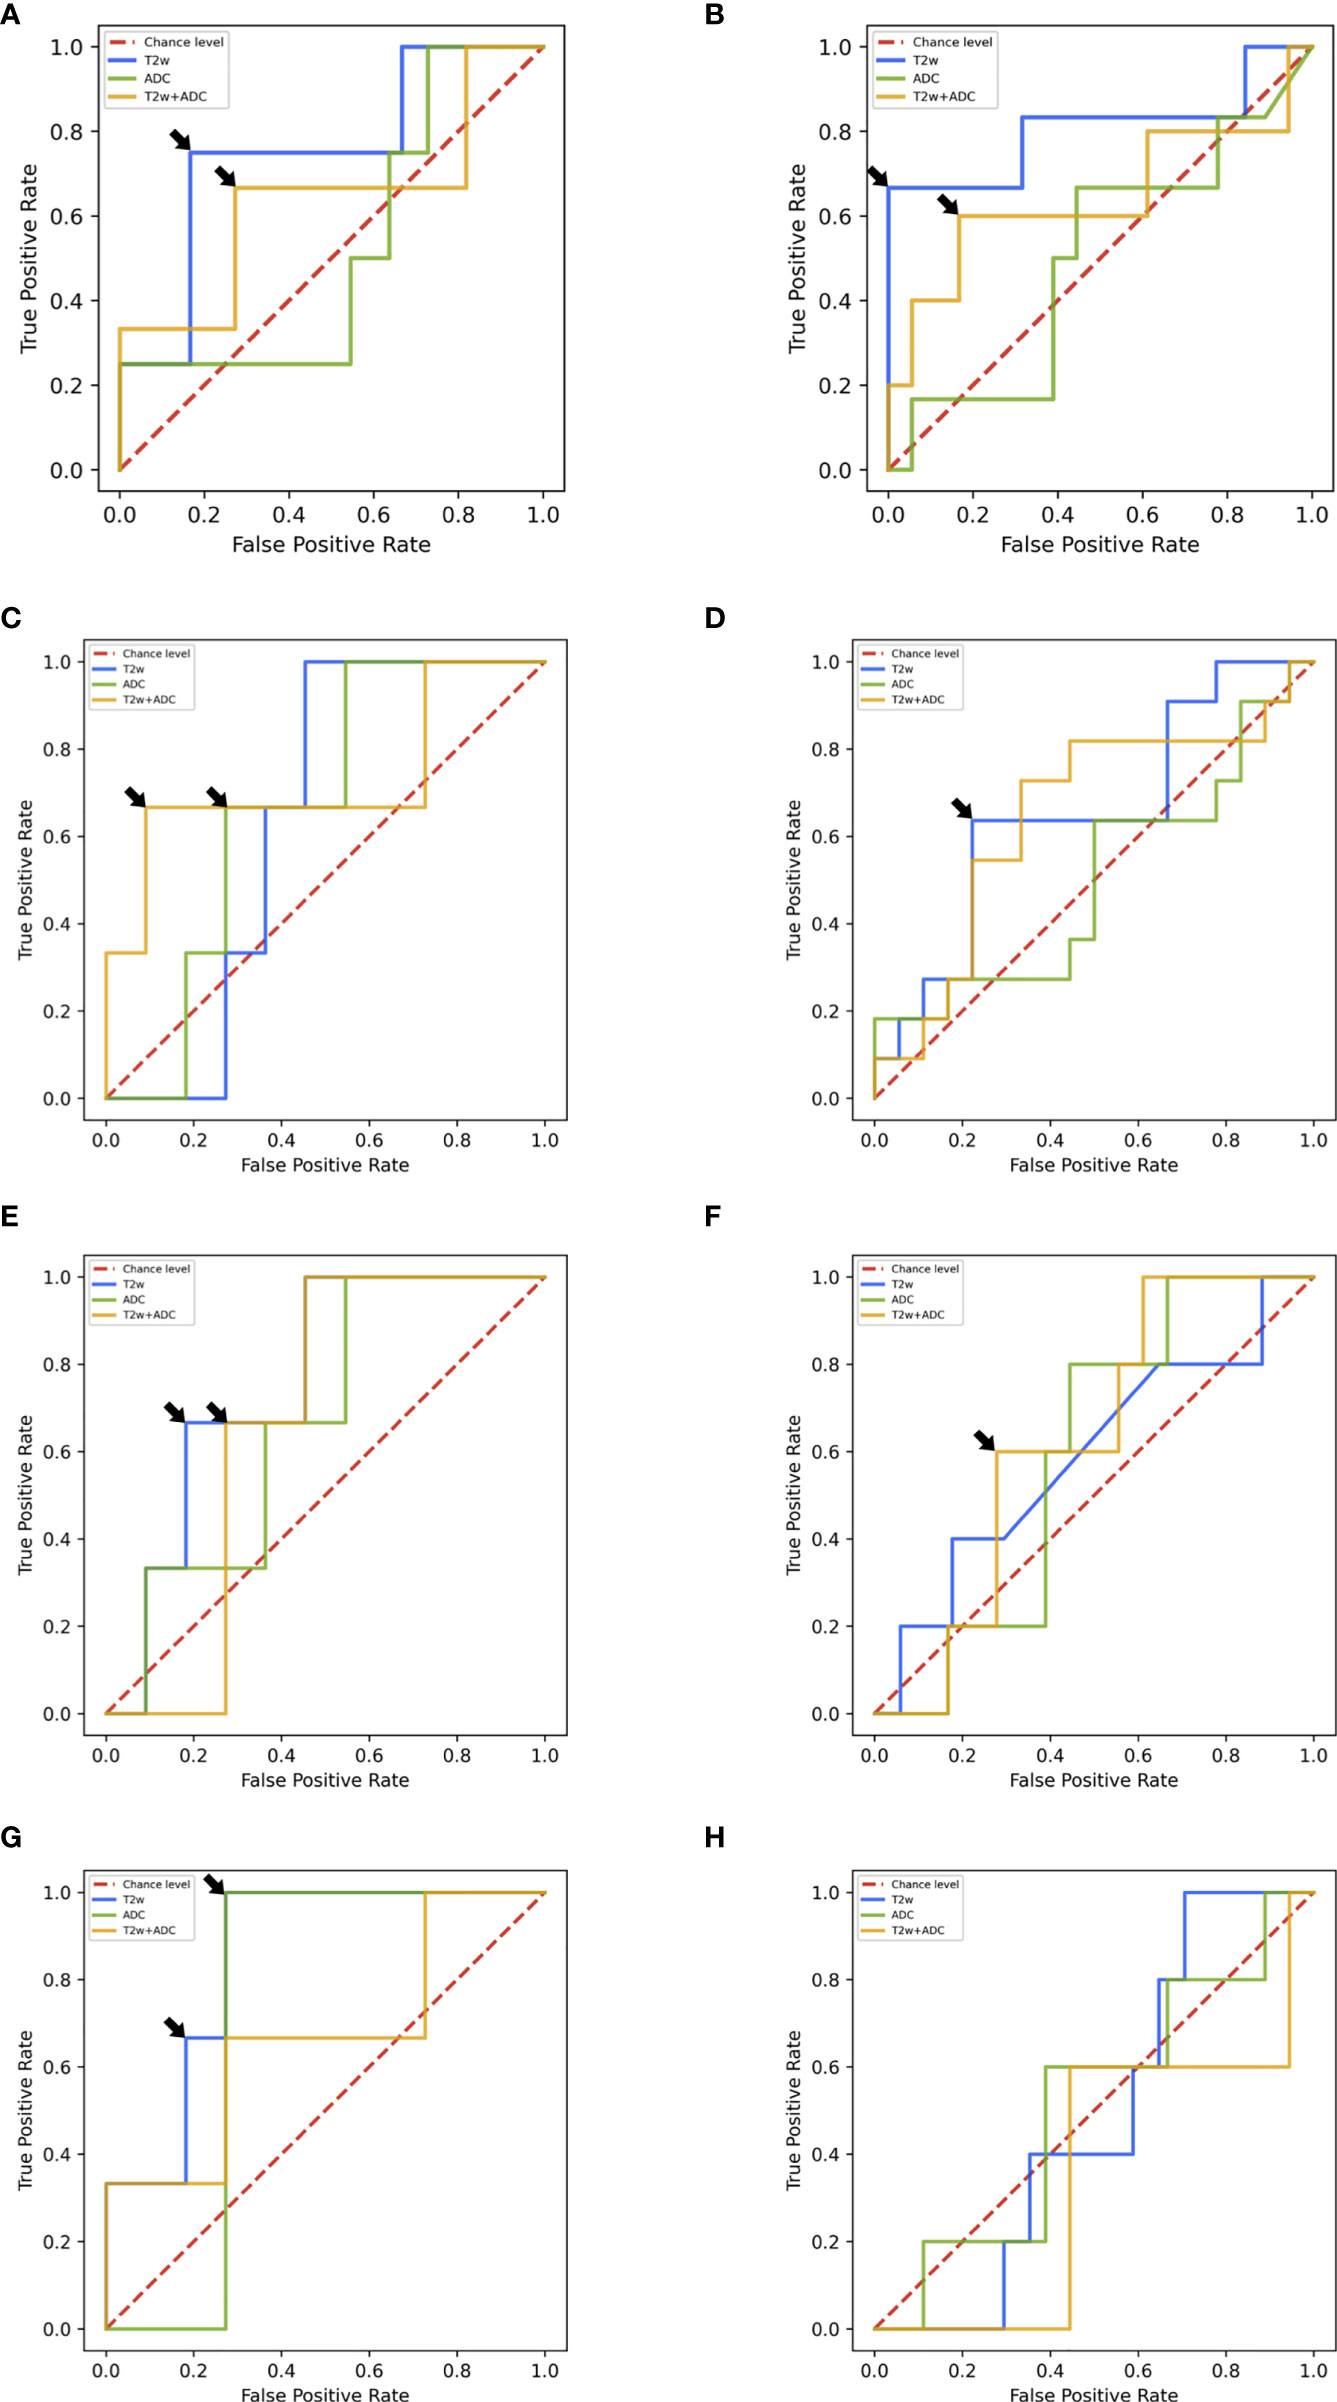
Figure 5 (A) ROC curves of ML frameworks on the test set 2.0. (B) ROC curves of ML frameworks on the multi PI-RADS test set. (C) ROC curves of DL AG-free CNN trained on L-DS test set 2.0. (D) ROC curves of DL AG-free CNN trained on L-DS multi PI-RADS test set. (E) ROC curves of DL AG-free CNN trained on C-DS test set 2.0. (F) ROC curves of DL AG-free CNN trained on C-DS multi PI-RADS test set. (G) ROC curves of DL AG CNN trained on C-DS test set 2.0. (H) ROC curves of DL AG CNN trained on C-DS multi PI-RADS test set.
Eventually, in Table S8, we detailed the characteristics of the best performing ML frameworks, along with their optimal hyperparameters.
3.2 DL Analysis
On the test set 2.0, the AG framework trained with the C-DS T2w images achieved the best performance, i.e., AUROC = 0.875. In particular, for specificity = 0.727, sensitivity was 1.000 (Figure 5G). For ADC maps, the best framework was the AG CNN trained with the C-DS, and achieved AUROC = 0.727. Notably, for specificity = 0.727, sensitivity was 1.000 (Figure 5G). Conversely, for T2w+ADC images, the best framework was the AG-free CNN trained on the L-DS, and achieved AUROC = 0.750. In particular, for specificity = 0.909, sensitivity was 0.667 (Figure 5C). In line with ML results, the DL framework trained on T2w images achieved the overall best performance. Consistently with ML results, the frameworks trained on PI-RADS 2.0 T2w/ADC/T2w+ADC images and tested on PI-RADS 2.1 T2w/ADC/T2w+ADC images gave an AUROC around the chance level (details in Table S7 and Figures S2B–D). The best performing DL framework trained, validated and tested on the multi PI-RADS test set was the AG-free CNN fed with L-DS T2w+ADC images, achieving AUROC = 0.752, but the AG-free CNN trained with L-DS T2w images only showed good performance equally (i.e., AUROC = 0.750). In particular, for specificity = 0.778, sensitivity was 0.600 (Figure 5D).
Finally, in Table S9, we reported the characteristics of the best performing DL architectures, along with their optimal hyperparameters. The optimal AG-free and AG CNN architectures trained with C-DS T2w images, and the AG-free CNN fed with C-DS T2w+ADC images have been represented in Figures S3–S5 respectively.
4 Discussion
This study aims to predict PCa aggressiveness using ML/DL techniques on quantitative mpMRI data. In particular, we focused on peripheral lesions considered radiologically indeterminate or malignant (i.e., with PI-RADS ≥ 3), and examined according to PI-RADS 2.0 and 2.1 guidelines. Firstly, we extracted radiomic features from T2w images and ADC maps of lesions and fed them to various ML models. Then, we trained several DL architectures to directly analyze raw images. Both workflows were carried out following a rigorous validation scheme for hyperparameters optimization and estimation of the generalization capabilities on unseen data.
The performances achieved by both ML and DL frameworks trained on T2w data were higher than those obtained by training on ADC maps or T2w+ADC data. The best ML framework gave a median AUROC equal to 0.795. Notably, for specificity = 1.000, sensitivity was 0.666, while the best DL architecture showed an AUROC equal to 0.875. In particular, for specificity = 0.727, sensitivity was 1.000. The better performances on T2w images may be due to the higher spatial resolution and dynamic range of T2w images, compared to ADC maps. Conversely, information derived from ADC maps seems to be potentially confounding for ML/DL frameworks. Although extremely useful for visual assessment, the combination of the two acquisition modalities does not appear to improve the training of ML/DL frameworks. Intriguingly, the best performance of the ML framework was obtained on the multi PI-RADS test set. To the best of our knowledge, this is the first time that a ML framework has been trained and tested on mpMRI data acquired with different acquisition protocols without any data harmonization. Our results suggest that differences introduced in radiomic features due to different T2w image acquisition protocols do not hinder the ML models learning. In contrast, the performance of DL frameworks on the multi PI-RADS test set was worse (except for AG-free CNN trained with L-DS data), likely due to the fewer PI-RADS 2.1 images compared to those according to PI-RADS 2.0. Indeed, DL frameworks might need more PI-RADS 2.1 images during the training phase to improve performance on the multi PI-RADS test set. The best performance of the DL framework was obtained by an AG CNN architecture trained on T2w images containing both the lesion and the surrounding tissue. The inclusion of AGs layers seems, in most cases, to focus the attention of the entire architecture on the contour of the lesion, i.e., in the transition zone between the tumor and healthy tissue (Figure 6). The additional information provided by the out-of-lesion tissue might has improved the learning of the DL framework, since it is known that MRI consistently underestimates the size and extent of PCa lesions (69, 70). The ML/DL frameworks trained on PI-RADS 2.0 T2w/ADC/T2w+ADC data were tested on images acquired following PI-RADS 2.1 guidelines, but all the performances were around the chance level. Arguably, the features extracted are strictly related to the image acquisition parameters making these frameworks immature for a direct large-scale clinical use.
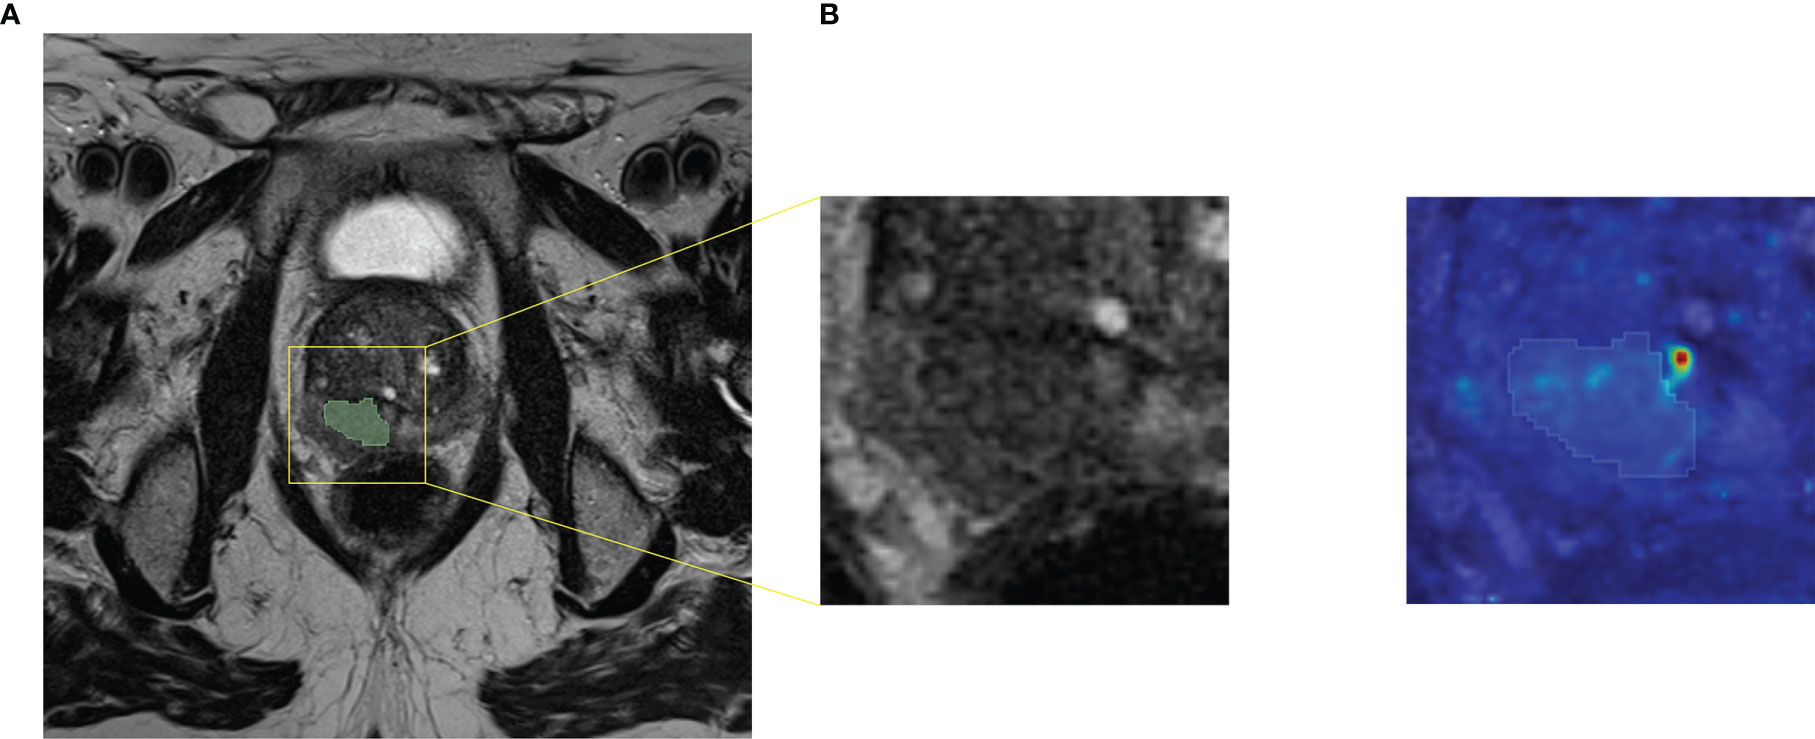
Figure 6 Axial T2w MR image of a PCa lesion with PI-RADS=5 and GS=4+5. (A) Original image together with its cropped version of size 64x64. We fed AG DL frameworks with the cropped images, i.e. the C-DS images. (B) Attention map obtained from the best performing AG DL framework fed with T2w C-DS images, superimposed to the original cropped version of the T2w image and its segmentation.
The results of our study are in line with previous works, which report ML/DL models’ AUROC values in the interval [0.70 - 0.93] (28, 38, 44, 46–51). Albeit feature selection is out of the scope of our work because it would be necessary to study also its stability to vary training data and model selection, we analyzed radiomic feature importance, providing insight into the data and the models. For the ML frameworks trained with radiomic features extracted from T2w images, those who got a better AUROC value, the highest predictors of PCa were textural features (see Supplementary Figures S6 and S7 for details). This result confirms that the analysis of quantitative features (not visible to the radiologist’s naked eye) by ML techniques effectively contributes to the prediction of PCa aggressiveness and could, in the future, be performed in a clinical context.
From a methodological point of view, we worked with 2D data (i.e., 2D radiomic features and single axial slices for T2w/ADC/T2w+ADC images) because some lesions were so small as to be visible on only one axial slice. Considering the lesion a 3D volume, regardless of the actual space occupied by the segmentation as other authors have done (39–42, 44, 71), seemed to be an overly forced assumption in most cases. In addition, though, we reported the test sets’ performance on a lesion level. This choice allowed us to obtain results that are in line with the radiologist assessment in a clinical context (19). Some authors worked with 2D data, but reported the final performance on slice level, making their results difficult to compare to ours (36, 72–75). It is well-known that ML/DL techniques perform better when trained on large and balanced datasets (76, 77). We addressed the imbalance problem of our datasets by using methods of randomly oversampling the minority class for tabular and imaging data (78). The most frequent algorithms used in the literature for PCa aggressiveness prediction were ML logistic regression and DL CNN, but without enough details about why those models were chosen (19). Previous literature showed insufficient awareness of the impact of the selected framework and hyperparameters on the generalizability of the results (79). Since it is not possible to define a priori which is the best performing ML/DL framework in a specific case (57), we opted for a data-driven approach. We reduced the potential overfitting caused by developing the ML/DL frameworks on a relatively small cohort by adopting a rigorous validation setup. We split T2/ADC/T2w+ADC data into two groups: the development and the test set. The development set was then further divided into training and validation set to perform framework selection along with hyperparameters optimization using a stratified 5-fold CV scheme. We repeated the 5-fold CV ten times to compensate for the sampling bias issue. It is essential to underline that, unlike other works (74, 75), we performed a patient-based splitting, and thus avoiding results inflated by the phenomenon of data leakage (80). We used the average value of the AUROC in the validation set to select the best ML/DL frameworks, and evaluated the generalizability on test sets allocated in the hold-out procedure. A strict comparison between ML and DL approaches was out of the scope of our work. It is true that DL techniques have more significant potential than the combination of hand-crafted features extraction and ML analysis for extensive datasets with thousands or even millions of instances. However, this is rarely the case of medical image analyses, where datasets are usually made up of hundreds/thousands of patients at best (81).
Our study has some limitations. Firstly, due to our rigorous approach to collect MRI data with PI-RADS score within the range [3 - 5] of peripheral zone PCa only, our sample size was relatively small, though similar to previous studies (72, 82, 83). Secondly, our study was monocentric. Given the complexity of assessing PCa aggressiveness from radiological images, monocentric acquisitions allowed us to keep the quantitative imaging as comparable as possible across patients. Experience showed that in PCa mpMRI, larger and multicenter/multi-scanner/multi-protocols datasets are difficult to find (84). Therefore, it is not surprising that the images used by most previous studies were generated using a single scanner or two scanners of the same vendor in one center.
In conclusion, the quantitative assessment of mpMRI might provide the radiologist with an objective and noninvasive tool for supporting the imaging work-up of patients affected by PCa. Actually, both ML and DL techniques applied on mpMRI seem to be a valid aid in predicting PCa aggressiveness. In particular, ML/DL frameworks fed with T2w images data (objective, fast and non-invasive) show good performances and might support decision-making in patient diagnostic and therapeutic management, decreasing intra- and inter-reader variability.
Data Availability Statement
The raw data supporting the conclusions of this article will be made available by the authors, without undue reservation.
Ethics Statement
The studies involving human participants were reviewed and approved by the Comitato Etico Area Vasta Centro (CEAVC). The patients/participants provided their written informed consent to participate in this study.
Author Contributions
EB, CM, AB, and SC contributed to the conception and design of the study. EB, LM, LL, and SA enrolled, acquired, and preprocessed data for the work. CM and EP executed the ML and the DL analyses, respectively. EB, LM, CM, and EP wrote the first draft of the manuscript. MB, AB, SC, LG, MAP, and VM revised it critically for important intellectual content. All authors contributed to manuscript revision, read, and approved the submitted version.
Funding
This work received fundings for open access publication fees from NAVIGATOR project, Bando Ricerca Salute 2018, Regione Toscana (http://navigator.med.unipi.it/).
Conflict of Interest
The authors declare that the research was conducted in the absence of any commercial or financial relationships that could be construed as a potential conflict of interest.
The handling editor declared a past co-authorship with one of the authors VM.
Publisher’s Note
All claims expressed in this article are solely those of the authors and do not necessarily represent those of their affiliated organizations, or those of the publisher, the editors and the reviewers. Any product that may be evaluated in this article, or claim that may be made by its manufacturer, is not guaranteed or endorsed by the publisher.
Supplementary Material
The Supplementary Material for this article can be found online at: https://www.frontiersin.org/articles/10.3389/fonc.2021.802964/full#supplementary-material
References
1. European Commission. ECIS - European Cancer Information System. Available at: https://ecis.jrc.ec.europa.eu/explorer.php (Accessed 04-October-2021).
2. Van Poppel H, Hogenhout R, Albers P, van den Bergh RC, Barentsz JO, Roobol MJ. Early Detection of Prostate Cancer in 2020 and Beyond: Facts and Recommendations for the European Union and the European Commission. Eur Urol (2021) 79(3):327–9. doi: 10.1016/j.eururo.2020.12.010
3. Ahmed HU, Bosaily AES, Brown LC, Gabe R, Kaplan R, Parmar MK, et al. Diagnostic Accuracy of Multi-Parametric Mri and Trus Biopsy in Prostate Cancer (Promis): A Paired Validating Confirmatory Study. Lancet (2017) 389:815–22. doi: 10.1016/S0140-6736(16)32401-1
4. Mottet N, Bellmunt J, Bolla M, Briers E, Cumberbatch MG, De Santis M, et al. Eau-Estro-Siog Guidelines on Prostate Cancer. Part 1: Screening, Diagnosis, and Local Treatment With Curative Intent. Eur Urol (2017) 71:618–29. doi: 10.1016/j.eururo.2016.08.003
5. Fütterer JJ, Briganti A, De Visschere P, Emberton M, Giannarini G, Kirkham A, et al. Can Clinically Significant Prostate Cancer Be Detected With Multiparametric Magnetic Resonance Imaging? A Systematic Review of the Literature. Eur Urol (2015) 68:1045–53. doi: 10.1016/j.eururo.2015.01.013
6. Kasivisvanathan V, Stabile A, Neves JB, Giganti F, Valerio M, Shanmugabavan Y, et al. Magnetic Resonance Imaging-Targeted Biopsy Versus Systematic Biopsy in the Detection of Prostate Cancer: A Systematic Review and Meta-Analysis. Eur Urol (2019) 76:284–303. doi: 10.1016/j.eururo.2019.04.043
7. Drost FJH, Osses D, Nieboer D, Bangma CH, Steyerberg EW, Roobol MJ, et al. Prostate Magnetic Resonance Imaging, With or Without Magnetic Resonance Imaging-Targeted Biopsy, and Systematic Biopsy for Detecting Prostate Cancer: A Cochrane Systematic Review and Meta-Analysis. Eur Urol (2020) 77:78–94. doi: 10.1016/j.eururo.2019.06.023
8. Turkbey B, Rosenkrantz AB, Haider MA, Padhani AR, Villeirs G, Macura KJ, et al. Prostate Imaging Reporting and Data System Version 2.1: 2019 Update of Prostate Imaging Reporting and Data System Version 2. Eur Urol (2019) 76:340–51. doi: 10.1016/j.eururo.2019.02.033
9. de Rooij M, Israël B, Tummers M, Ahmed HU, Barrett T, Giganti F, et al. Esur/esui Consensus Statements on Multi-Parametric Mri for the Detection of Clinically Significant Prostate Cancer: Quality Requirements for Image Acquisition, Interpretation and Radiologists’ Training. Eur Radiol (2020) 30:5404–16. doi: 10.1007/s00330-020-06929-z
10. Stabile A, Giganti F, Kasivisvanathan V, Giannarini G, Moore CM, Padhani AR, et al. Factors Influencing Variability in the Performance of Multiparametric Magnetic Resonance Imaging in Detecting Clinically Significant Prostate Cancer: A Systematic Literature Review. Eur Urol Oncol (2020) 3:145–67. doi: 10.1016/j.euo.2020.02.005
11. Penzias G, Singanamalli A, Elliott R, Gollamudi J, Shih N, Feldman M, et al. Identifying the Morphologic Basis for Radiomic Features in Distinguishing Different Gleason Grades of Prostate Cancer on Mri: Preliminary Findings. PloS One (2018) 13:e0200730. doi: 10.1371/journal.pone.0200730
12. Cuocolo R, Cipullo MB, Stanzione A, Ugga L, Romeo V, Radice L, et al. Machine Learning Applications in Prostate Cancer Magnetic Resonance Imaging. Eur Radiol Exp (2019) 3:1–8. doi: 10.1186/s41747-019-0109-2
13. Drost FJH, Osses DF, Nieboer D, Steyerberg EW, Bangma CH, Roobol MJ, et al. Prostate Mri, With or Without Mri-Targeted Biopsy, and Systematic Biopsy for Detecting Prostate Cancer. Cochrane Database Systematic Rev (2019) 4(4):CD012663. doi: 10.1002/14651858.CD012663.pub2
14. Schoots IG, Roobol MJ, Nieboer D, Bangma CH, Steyerberg EW, Hunink MM. Magnetic Resonance Imaging–Targeted Biopsy may Enhance the Diagnostic Accuracy of Significant Prostate Cancer Detection Compared to Standard Transrectal Ultrasound-Guided Biopsy: A Systematic Review and Meta-Analysis. Eur Urol (2015) 68:438–50. doi: 10.1016/j.eururo.2014.11.037
15. Albertsen PC. Prostate Cancer Screening and Treatment: Where Have We Come From and Where are We Going? BJU Int (2020) 126:218–24. doi: 10.1111/bju.15153
16. Arif M, Schoots IG, Tovar JC, Bangma CH, Krestin GP, Roobol MJ, et al. Clinically Significant Prostate Cancer Detection and Segmentation in Low-Risk Patients Using a Convolutional Neural Network on Multi-Parametric Mri. Eur Radiol (2020) 30:6582–92. doi: 10.1007/s00330-020-07008-z
17. Van Poppel H, Roobol MJ, Chapple CR, Catto JW, N’Dow J, Sønksen J, et al. Prostate-Specific Antigen Testing as Part of a Risk-Adapted Early Detection Strategy for Prostate Cancer: European Association of Urology Position and Recommendations for 2021. Eur Urol (2021) 80(6):703–11. doi: 10.1016/j.eururo.2021.07.024
18. Twilt JJ, van Leeuwen KG, Huisman HJ, Fütterer JJ, de Rooij M. Artificial Intelligence Based Algorithms for Prostate Cancer Classification and Detection on Magnetic Resonance Imaging: A Narrative Review. Diagnostics (2021) 11:959. doi: 10.3390/diagnostics11060959
19. Castillo T JM, Arif M, Niessen WJ, Schoots IG, Veenland JF. Automated Classification of Significant Prostate Cancer on Mri: A Systematic Review on the Performance of Machine Learning Applications. Cancers (2020) 12:1606. doi: 10.3390/cancers12061606
20. Gillies RJ, Kinahan PE, Hricak H. Radiomics: Images are More Than Pictures, They are Data. Radiology (2016) 278:563–77. doi: 10.1148/radiol.2015151169
21. Aerts HJ, Velazquez ER, Leijenaar RT, Parmar C, Grossmann P, Carvalho S, et al. Decoding Tumour Phenotype by Noninvasive Imaging Using a Quantitative Radiomics Approach. Nat Commun (2014) 5:1–9. doi: 10.1038/ncomms5006
22. Comelli A, Stefano A, Coronnello C, Russo G, Vernuccio F, Cannella R, et al. Radiomics: A New Biomedical Workflow to Create a Predictive Model. In: Papież B, Namburete A, Yaqub M, Noble J, eds. Medical Image Understanding and Analysis. MIUA 2020, Oxford. Communications in Computer and Information Science, vol. 1248. Cham: Springer. doi: 10.1007/978-3-030-52791-4_22
23. Arvaniti E, Fricker KS, Moret M, Rupp NJ, Hermanns T, Fankhauser C, et al. Automated Gleason Grading of Prostate Cancer Tissue Microarrays via Deep Learning. Sci Rep (2018) 8(1):12054. doi: 10.1101/280024
24. Shah V, Turkbey B, Mani H, Pang Y, Pohida T, Merino MJ, et al. Decision Support System for Localizing Prostate Cancer Based on Multiparametric Magnetic Resonance Imaging. Med Phys (2012) 39:4093–103. doi: 10.1118/1.4722753
25. Kwak JT, Sankineni S, Xu S, Turkbey B, Choyke PL, Pinto PA, et al. Correlation of Magnetic Resonance Imaging With Digital Histopathology in Prostate. Int J Comput Assist Radiol Surg (2016) 11:657–66. doi: 10.1007/s11548-015-1287-x
26. McGarry SD, Hurrell SL, Iczkowski KA, Hall W, Kaczmarowski AL, Banerjee A, et al. Radio-Pathomic Maps of Epithelium and Lumen Density Predict the Location of High-Grade Prostate Cancer. Int J Radiat Oncol Biol Phys (2018) 101:1179–87. doi: 10.1016/j.ijrobp.2018.04.044
27. Wang J, Wu CJ, Bao ML, Zhang J, Wang XN, Zhang YD. Machine Learning-Based Analysis of Mr Radiomics can Help to Improve the Diagnostic Performance of Pi-Rads V2 in Clinically Relevant Prostate Cancer. Eur Radiol (2017) 27:4082–90. doi: 10.1007/s00330-017-4800-5
28. Bonekamp D, Kohl S, Wiesenfarth M, Schelb P, Radtke JP, Götz M, et al. Radiomic Machine Learning for Characterization of Prostate Lesions With MRI: Comparison to Adc Values. Radiology (2018) 289:128–37. doi: 10.1148/radiol.2018173064
29. Ginsburg SB, Algohary A, Pahwa S, Gulani V, Ponsky L, Aronen HJ, et al. Radiomic Features for Prostate Cancer Detection on Mri Differ Between the Transition and Peripheral Zones: Preliminary Findings From a Multi-Institutional Study. J Magn Reson Imaging (2017) 46:184–93. doi: 10.1002/jmri.25562
30. Wu M, Krishna S, Thornhill RE, Flood TA, McInnes MD, Schieda N. Transition Zone Prostate Cancer: Logistic Regression and Machine-Learning Models of Quantitative Adc, Shape and Texture Features are Highly Accurate for Diagnosis. J Magn Reson Imaging (2019) 50:940–50. doi: 10.1002/jmri.26674
31. Bleker J, Kwee TC, Dierckx RA, de Jong IJ, Huisman H, Yakar D. Multiparametric Mri and Auto-Fixed Volume of Interest-Based Radiomics Signature for Clinically Significant Peripheral Zone Prostate Cancer. Eur Radiol (2020) 30:1313–24. doi: 10.1007/s00330-019-06488-y
32. Sidhu HS, Benigno S, Ganeshan B, Dikaios N, Johnston EW, Allen C, et al. Textural Analysis of Multiparametric Mri Detects Transition Zone Prostate Cancer. Eur Radiol (2017) 27:2348–58. doi: 10.1007/s00330-016-4579-9
33. Cameron A, Khalvati F, Haider MA, Wong A. Maps: A Quantitative Radiomics Approach for Prostate Cancer Detection. IEEE Trans Biomed Eng (2016) 63:1145–56. doi: 10.1109/TBME.2015.2485779
34. Khalvati F, Zhang J, Chung AG, Shafiee MJ, Wong A, Haider MA. Mpcad: A Multi-Scale Radiomics-Driven Framework for Automated Prostate Cancer Localization and Detection. BMC Med Imaging (2018) 18:1–14. doi: 10.1186/s12880-018-0258-4
35. Wibmer A, Hricak H, Gondo T, Matsumoto K, Veeraraghavan H, Fehr D, et al. Haralick Texture Analysis of Prostate Mri: Utility for Differentiating Non-Cancerous Prostate From Prostate Cancer and Differentiating Prostate Cancers With Different Gleason Scores. Eur Radiol (2015) 25:2840–50. doi: 10.1007/s00330-015-3701-8
36. Yuan Y, Qin W, Buyyounouski M, Ibragimov B, Hancock S, Han B, et al. Prostate Cancer Classification With Multiparametric Mri Transfer Learning Model. Med Phys (2019) 46:756–65. doi: 10.1002/mp.13367
37. Le MH, Chen J, Wang L, Wang Z, Liu W, Cheng KTT, et al. Automated Diagnosis of Prostate Cancer in Multi-Parametric Mri Based on Multimodal Convolutional Neural Networks. Phys Med Biol (2017) 62:6497. doi: 10.1088/1361-6560/aa7731
38. Toivonen J, Montoya Perez I, Movahedi P, Merisaari H, Pesola M, Taimen P, et al. Radiomics and Machine Learning of Multisequence Multiparametric Prostate Mri: Towards Improved non-Invasive Prostate Cancer Characterization. PloS One (2019) 14:e0217702. doi: 10.1371/journal.pone.0217702
39. Nketiah GA, Elschot M, Scheenen TW, Maas MC, Bathen TF, Selnæs KM. Utility of T2-Weighted Mri Texture Analysis in Assessment of Peripheral Zone Prostate Cancer Aggressiveness: A Single-Arm, Multicenter Study. Sci Rep (2021) 11:1–13. doi: 10.1038/s41598-021-81272-x
40. Aldoj N, Lukas S, Dewey M, Penzkofer T. Semi-Automatic Classification of Prostate Cancer on Multi-Parametric Mr Imaging Using a Multi-Channel 3d Convolutional Neural Network. Eur Radiol (2020) 30:1243–53. doi: 10.1007/s00330-019-06417-z
41. Deniffel D, Abraham N, Namdar K, Dong X, Salinas E, Milot L, et al. Using Decision Curve Analysis to Benchmark Performance of a Magnetic Resonance Imaging–Based Deep Learning Model for Prostate Cancer Risk Assessment. Eur Radiol (2020) 30:6867–76. doi: 10.1007/s00330-020-07030-1
42. Reda I, Khalil A, Elmogy M, Abou El-Fetouh A, Shalaby A, Abou El-Ghar M, et al. Deep Learning Role in Early Diagnosis of Prostate Cancer. Technol Cancer Res Treat (2018) 17:1533034618775530. doi: 10.1177/1533034618775530
43. Yoo S, Gujrathi I, Haider MA, Khalvati F. Prostate Cancer Detection Using Deep Convolutional Neural Networks. Sci Rep (2019) 9(1):19518. doi: 10.1038/s41598-019-55972-4
44. Zhong X, Cao R, Shakeri S, Scalzo F, Lee Y, Enzmann DR, et al. Deep Transfer Learning-Based Prostate Cancer Classification Using 3 Tesla Multi-Parametric Mri. Abdominal Radiol (2019) 44:2030–9. doi: 10.1007/s00261-018-1824-5
45. Fehr D, Veeraraghavan H, Wibmer A, Gondo T, Matsumoto K, Vargas HA, et al. Automatic Classification of Prostate Cancer Gleason Scores From Multiparametric Magnetic Resonance Images. Proc Natl Acad Sci (2015) 112:E6265–73. doi: 10.1073/pnas.1505935112
46. Li J, Weng Z, Xu H, Zhang Z, Miao H, Chen W, et al. Support Vector Machines (Svm) Classification of Prostate Cancer Gleason Score in Central Gland Using Multiparametric Magnetic Resonance Images: A Cross-Validated Study. Eur J Radiol (2018) 98:61–7. doi: 10.1016/j.ejrad.2017.11.001
47. Abraham B, Nair MS. Computer-Aided Grading of Prostate Cancer From Mri Images Using Convolutional Neural Networks. J Intell Fuzzy Syst (2019) 36:2015–24. doi: 10.3233/JIFS-169913
48. Antonelli M, Johnston EW, Dikaios N, Cheung KK, Sidhu HS, Appayya MB, et al. Machine Learning Classifiers can Predict Gleason Pattern 4 Prostate Cancer With Greater Accuracy Than Experienced Radiologists. Eur Radiol (2019) 29:4754–64. doi: 10.1007/s00330-019-06244-2
49. Chaddad A, Niazi T, Probst S, Bladou F, Anidjar M, Bahoric B. Predicting Gleason Score of Prostate Cancer Patients Using Radiomic Analysis. Front Oncol (2018) 8:630. doi: 10.3389/fonc.2018.00630
50. Chen T, Li M, Gu Y, Zhang Y, Yang S, Wei C, et al. Prostate Cancer Differentiation and Aggressiveness: Assessment With a Radiomic-Based Model vs. pi-rads v2. J Magn Reson Imaging (2019) 49:875–84. doi: 10.1002/jmri.26243
51. Dikaios N, Alkalbani J, Abd-Alazeez M, Sidhu HS, Kirkham A, Ahmed HU, et al. Zone-Specific Logistic Regression Models Improve Classification of Prostate Cancer on Multi-Parametric Mri. Eur Radiol (2015) 25:2727–37. doi: 10.1007/s00330-015-3636-0
52. Epstein JI, Egevad L, Amin MB, Delahunt B, Srigley JR, Humphrey PA. The 2014 International Society of Urological Pathology (Isup) Consensus Conference on Gleason Grading of Prostatic Carcinoma. Am J Surg Pathol (2016) 40:244–52. doi: 10.1097/PAS.0000000000000530
53. He H, Bai Y, Garcia EA, Li S. (2008). Adasyn: Adaptive Synthetic Sampling Approach for Imbalanced Learning. In: 2008 IEEE International Joint Conference on Neural Networks (IEEE World Congress on Computational Intelligence). p. 1322–8. Hong Kong: IEEE. doi: 10.1109/IJCNN.2008.4633969
54. Bowyer KW, Chawla NV, Hall LO, Kegelmeyer WP. SMOTE: Synthetic Minority Over-Sampling Technique. J Artif Intell Res (2011) 16:321–357. doi: 10.1613/jair.953
55. Han H, Wang WY, Mao BH. (2005). Borderline-Smote: A New Over-Sampling Method in Imbalanced Data Sets Learning. In: International Conference on Intelligent Computing. p. 878–87. Hefei, China: Springer.
56. Nguyen HM, Cooper EW, Kamei K. Borderline Over-Sampling for Imbalanced Data Classification. Int J Knowledge Eng Soft Data Paradigms (2011) 3:4–21. doi: 10.1504/IJKESDP.2011.039875
57. Adam SP, Alexandropoulos SAN, Pardalos PM, Vrahatis MN. No Free Lunch Theorem: A Review. Approximation Optimization (2019) 145:57–82. doi: 10.1007/978-3-030-12767-1_5
60. Geurts P, Ernst D, Wehenkel L. Extremely Randomized Trees. Mach Learn (2006) 63:3–42. doi: 10.1007/s10994-006-6226-1
61. Freund Y. Schapire RE. A Decision-Theoretic Generalization of on-Line Learning and an Application to Boosting. J Comput System Sci (1997) 55:119–39. doi: 10.1006/jcss.1997.1504
62. Friedman JH. Stochastic Gradient Boosting. Comput Stat Data Anal (2002) 38:367–78. doi: 10.1016/S0167-9473(01)00065-2
63. Chen T, Guestrin C. (2016). Xgboost: A Scalable Tree Boosting System. In: Proceedings of the 22nd Acm Sigkdd International Conference on Knowledge Discovery and Data Mining. San Francisco California, USA. p. 785–94.
64. Schlemper J, Oktay O, Schaap M, Heinrich M, Kainz B, Glocker B, et al. Attention Gated Networks: Learning to Leverage Salient Regions in Medical Images. Med Image Anal (2019) 53:197–207. doi: 10.1016/j.media.2019.01.012
65. Varma S, Simon R. Bias in Error Estimation When Using Cross-Validation for Model Selection. BMC Bioinf (2006) 7:1–8. doi: 10.1186/1471-2105-7-91
66. Krstajic D, Buturovic LJ, Leahy DE, Thomas S. Cross-Validation Pitfalls When Selecting and Assessing Regression and Classification Models. J Cheminformatics (2014) 6(1):10. doi: 10.1186/1758-2946-6-10
67. DiCiccio TJ, Efron B. Bootstrap Confidence Intervals. Stat Sci (1996) 11:189–228. doi: 10.1214/ss/1032280214
68. Ramachandran KM, Tsokos CP. Mathematical Statistics With Applications in R. Cambridge, MA, USA: Academic Press (2020).
69. Pooli A, Johnson DC, Shirk J, Markovic D, Sadun TY, Sisk AE Jr., et al. Predicting Pathological Tumor Size in Prostate Cancer Based on Multiparametric Prostate Magnetic Resonance Imaging and Preoperative Findings. J Urol (2021) 205:444–51. doi: 10.1097/JU.0000000000001389
70. Priester A, Natarajan S, Khoshnoodi P, Margolis DJ, Raman SS, Reiter RE, et al. Magnetic Resonance Imaging Underestimation of Prostate Cancer Geometry: Use of Patient Specific Molds to Correlate Images With Whole Mount Pathology. J Urol (2017) 197:320–6. doi: 10.1016/j.juro.2016.07.084
71. Bernatz S, Ackermann J, Mandel P, Kaltenbach B, Zhdanovich Y, Harter PN, et al. Comparison of Machine Learning Algorithms to Predict Clinically Significant Prostate Cancer of the Peripheral Zone With Multiparametric Mri Using Clinical Assessment Categories and Radiomic Features. Eur Radiol (2020) 30:6757–69. doi: 10.1007/s00330-020-07064-5
72. Varghese B, Chen F, Hwang D, Palmer SL, Abreu ALDC, Ukimura O, et al. Objective Risk Stratification of Prostate Cancer Using Machine Learning and Radiomics Applied to Multiparametric Magnetic Resonance Images. Sci Rep (2019) 9(1):1570. doi: 10.1038/s41598-018-38381-x
73. Brunese L, Mercaldo F, Reginelli A, Santone A. Radiomics for Gleason Score Detection Through Deep Learning. Sensors (2020) 20:5411. doi: 10.3390/s20185411
74. Iqbal S, Siddiqui GF, Rehman A, Hussain L, Saba T, Tariq U, et al. Prostate Cancer Detection Using Deep Learning and Traditional Techniques. IEEE Access (2021) 9:27085–100. doi: 10.1109/ACCESS.2021.3057654
75. Abbasi AA, Hussain L, Awan IA, Abbasi I, Majid A, Nadeem MSA, et al. Detecting Prostate Cancer Using Deep Learning Convolution Neural Network With Transfer Learning Approach. Cogn Neurodynamics (2020) 14:523–33. doi: 10.1007/s11571-020-09587-5
76. Halevy A, Norvig P, Pereira F. The Unreasonable Effectiveness of Data. IEEE Intell Syst (2009) 24:8–12. doi: 10.1109/MIS.2009.36
77. Sun C, Shrivastava A, Singh S, Gupta A. (2017). Revisiting Unreasonable Effectiveness of Data in Deep Learning Era. In: Proceedings of the IEEE International Conference on Computer Vision. Venice, Italy. p. 843–52.
78. Chawla NV. Data Mining for Imbalanced Datasets: An Overview. Data Min Knowledge Discovery Handbook. Maimon O, Rokach L, eds. Boston, MA: Springer (2009). p. 875–86. doi: 10.1007/978-0-387-09823-4_45
79. Wildeboer RR, van Sloun RJ, Wijkstra H, Mischi M. Artificial Intelligence in Multiparametric Prostate Cancer Imaging With Focus on Deep-Learning Methods. Comput Methods Programs Biomed (2020) 189:105316. doi: 10.1016/j.cmpb.2020.105316
80. Yagis E, Atnafu SW, García Seco de Herrera A, Marzi C, Scheda R, Giannelli M, et al. Effect of Data Leakage in Brain Mri Classification Using 2d Convolutional Neural Networks. Sci Rep (2021) 11:1–13. doi: 10.1038/s41598-021-01681-w
81. Cuocolo R, Cipullo MB, Stanzione A, Romeo V, Green R, Cantoni V, et al. Machine Learning for the Identification of Clinically Significant Prostate Cancer on Mri: A Meta-Analysis. Eur Radiol (2020) 30:6877–87. doi: 10.1007/s00330-020-07027-w
82. Stoyanova R, Takhar M, Tschudi Y, Ford JC, Solórzano G, Erho N, et al. Prostate Cancer Radiomics and the Promise of Radiogenomics. Trans Cancer Res (2016) 5:432. doi: 10.21037/tcr.2016.06.20
83. Algohary A, Viswanath S, Shiradkar R, Ghose S, Pahwa S, Moses D, et al. Radiomic Features on Mri Enable Risk Categorization of Prostate Cancer Patients on Active Surveillance: Preliminary Findings. J Magn Reson Imaging (2018) 48:818–28. doi: 10.1002/jmri.25983
Keywords: prostate cancer, mpMRI prostate cancer aggressiveness, deep learning, machine learning, radiomics
Citation: Bertelli E, Mercatelli L, Marzi C, Pachetti E, Baccini M, Barucci A, Colantonio S, Gherardini L, Lattavo L, Pascali MA, Agostini S and Miele V (2022) Machine and Deep Learning Prediction Of Prostate Cancer Aggressiveness Using Multiparametric MRI. Front. Oncol. 11:802964. doi: 10.3389/fonc.2021.802964
Received: 27 October 2021; Accepted: 07 December 2021;
Published: 13 January 2022.
Edited by:
Antonella Santone, University of Molise, ItalyReviewed by:
Sanjay Aneja, Yale University, United StatesWeiwei Zong, Henry Ford Health System, United States
Copyright © 2022 Bertelli, Mercatelli, Marzi, Pachetti, Baccini, Barucci, Colantonio, Gherardini, Lattavo, Pascali, Agostini and Miele. This is an open-access article distributed under the terms of the Creative Commons Attribution License (CC BY). The use, distribution or reproduction in other forums is permitted, provided the original author(s) and the copyright owner(s) are credited and that the original publication in this journal is cited, in accordance with accepted academic practice. No use, distribution or reproduction is permitted which does not comply with these terms.
*Correspondence: Elena Bertelli, YmVydGVsbGllQGFvdS1jYXJlZ2dpLnRvc2NhbmEuaXQ=
†These authors have contributed equally to this work and share the first authorship