 Enrico Capobianco1
 Vanessa McGaughey2
 Gerbenn Seraphin2John Heckel2Sandra Rieger2,3
 Thomas S. Lisse2,3,4*
- 1The Jackson Laboratory, Farmington, CT, United States
- 2Department of Biology, University of Miami, Coral Gables, FL, United States
- 3Sylvester Comprehensive Cancer Center, Miller School of Medicine, University of Miami, Miami, FL, United States
- 4iCURA DX, Malvern, PA, United States
Osteosarcomas are immune-resistant and metastatic as a result of elevated nonsense-mediated RNA decay (NMD), reactive oxygen species (ROS), and epithelial-to-mesenchymal transition (EMT). Although vitamin D has anti-cancer effects, its effectiveness and mechanism of action against osteosarcomas are poorly understood. In this study, we assessed the impact of vitamin D and its receptor (VDR) on NMD-ROS-EMT signaling in in vitro and in vivo osteosarcoma animal models. Initiation of VDR signaling facilitated the enrichment of EMT pathway genes, after which 1,25(OH)2D, the active vitamin D derivative, inhibited the EMT pathway in osteosarcoma subtypes. The ligand-bound VDR directly downregulated the EMT inducer SNAI2, differentiating highly metastatic from low metastatic subtypes and 1,25(OH)2D sensitivity. Moreover, epigenome-wide motif and putative target gene analysis revealed the VDR’s integration with NMD tumorigenic and immunogenic pathways. In an autoregulatory manner, 1,25(OH)2D inhibited NMD machinery genes and upregulated NMD target genes implicated in anti-oncogenic activity, immunorecognition, and cell-to-cell adhesion. Dicer substrate siRNA knockdown of SNAI2 revealed superoxide dismutase 2 (SOD2)-mediated antioxidative responses and 1,25(OH)2D sensitization via non-canonical SOD2 nuclear-to-mitochondrial translocalization leading to overall ROS suppression. In a mouse xenograft metastasis model, the therapeutically relevant vitamin D derivative calcipotriol inhibited osteosarcoma metastasis and tumor growth shown for the first time. Our results uncover novel osteosarcoma-inhibiting mechanisms for vitamin D and calcipotriol that may be translated to human patients.
Introduction
Osteosarcoma (OS) is the most common primary malignant bone tumor in children and adolescents, affecting >1,000 patients annually in the United States alone (1–4). Osteosarcomas are characterized by a loss of mineralization (5); moreover, the majority of OS patients have subclinical micrometastases, whereas 30-40% have full-blown metastatic disease (6, 7). Currently, the standard OS treatments consist of surgical removal of the tumor followed by adjuvant chemotherapy, which causes severe side effects and chemoresistance in patients (3, 4, 8–11). Several clinical trials evaluating nonconventional OS therapies that combine immunotherapy and cytostatic drug treatments are currently underway in an effort to address this problem (11). However, despite current treatment options, 30 to 40% of OS patients still die within 5 years of diagnosis (10). The prognosis for osteosarcoma patients depends on whether it has metastasized at the time of diagnosis, which involves induction of the epithelial-to-mesenchymal transition (EMT), a process that is not only activated in cancer but also in disease-induced fibrosis (12), and non-disease processes like wound re-epithelialization and embryonic mesoderm formation (13).
Immunotherapy has thus far been ineffective against OS due to its ability to evade the immune system (14–17). It is unknown how resistance develops, but it may result from the complex immunological and/or epigenetic reprogramming of OS that creates a tumor permissive environment to support malignancy (3, 4, 10). In addition, recent studies have shown that the OS microenvironment contains activated cancer associated fibroblasts (CAFs) that can influence desmoplasia, a process in which excessive fibrosis leads to chemoresistance and metastasis of malignant cancer cells, and inhibition of immune cell infiltration that increases tumor burden (18). Furthermore, genome-wide association studies have linked genetic variations within a neurotransmitter receptor gene to increased risk of OS development, suggesting neuronal-tumor interactions in the manifestation of the disease (19). Evidence also suggests that nonsense-mediated RNA decay (NMD) is uniquely increased in OS, which, for example, decreases the number of NMD-target neoantigens on OS tumor cells that are required to elicit the cytotoxic killing of cancer cells by immune cells (14–17). NMD is part of the post-transcriptional RNA surveillance pathway to clear aberrant transcripts harboring premature termination codons (PTCs) often generated by abnormal or ineffective biogenesis of mRNAs or by somatic mutations in cancers (15, 20–23). To date, the selective targeting and modulation of the NMD pathway to overcome OS resistance for therapeutic considerations has not been reported.
Anti-cancer properties of vitamin D have been studied in major cancer types, however our knowledge of vitamin D’s impact on OS is still very limited. Vitamin D deficiency is a global health issue, with the lowest levels linked to more advanced cancers (24–32). Clinical randomized studies have demonstrated that vitamin D supplementation reduces the risk of invasive cancer and/or mortality in subgroups of people (25, 26, 33–38), suggesting that increased circulating vitamin D plays a protective role. Vitamin D is composed of two major forms, vitamin D2 (ergocalciferol) and vitamin D3 (cholecalciferol) (30). In humans, vitamin D3 is synthesized in the skin in response to UVB exposure, while vitamin D2 is obtained from plant sources in our diets with lower efficacy. Both forms of vitamin D are biologically inert and must be converted and hydroxylated to 25(OH)D by vitamin D-25-hydroxylase in the liver, which is the primary measurement of vitamin D status (39). 25(OH)D is further hydroxylated in the kidneys or within specialized cell types by 25(OH)D-1-OHase (CYP27B1) to produce 1-alpha, 25-dihydroxyvitamin D (also known as 1,25(OH)2D), the biologically active derivative of vitamin D (30, 40–44). The 1,25(OH)2D effects are mediated by the vitamin D receptor (VDR), an intracellular nuclear receptor superfamily member, that can promote cell cycle arrest and apoptosis via post-transcriptional and gene regulatory means (40, 44–54). In mammals, the physiological and molecular effects of vitamin D3 on bone health and function have been experimentally and clinically validated (30). Vitamin D3 is known to directly promote the differentiation of normal bone-forming osteoblast-lineage cells and primary human and murine osteoblast cells in vivo (55) and in vitro (48, 51), respectively. Although numerous studies have implicated a suppressive role for vitamin D3 in invasive cancer development (e.g., breast, prostate) and improved cancer patient and animal survival (1–4, 26–30), the functional role of vitamin D3 and the VDR in OS is unclear. Uncertain is whether vitamin D3 can be utilized to address a number of crucial concerns about OS biology and therapy, such as the regulation of transformation, cancer fibrosis, NMD, and metastasis. Using both in vitro and in vivo systems, this work examined the influence of the VDR and vitamin D3 on the regulation and pathogenesis of OS through impact on OS growth, migration and potential cancer cell immunorecognition.
Results
1,25(OH)2D promotes the enrichment of the EMT pathway in MG63 osteosarcoma cells
Gene set enrichment analysis (GSEA) (56) was used to identify novel pathways using RNAseq data from MG63 OS cells treated with 1,25(OH)2D (GEO accession: GSE220948). Using the annotated gene set file M5930 from the Molecular Signatures Database (MSigDB), the EMT gene set was identified as being significantly enriched (Figure 1A) (57). Using a physiologically-relevant concentration range (10-100nM) (58), 1,25(OH)2D inhibited the expression of EMT inducers and regulators such as SNAI2 (also known as the transrepressor SLUG), CD44, and MMP3, as confirmed by quantitative PCR (qPCR) (Figure 1B). Higher 1,25(OH)2D concentrations increased MMP3, both of which are known to induce apoptosis(47,48,27). In addition, 1,25(OH)2D downregulated and upregulated, respectively, VIM and CLDN1, which were not annotated in M5930, indicating that vitamin D3 may inhibit EMT via downregulation of intermediate filaments and the promotion of cell-to-cell adhesion (Figure 1C) (59, 60). ATACseq was used to assess 1,25(OH)2D-dependent genome-wide chromatin accessibility of genes (Figure 1D), and potential promoter regulatory regions were identified within CD44 and SNAI2, but not MMP3, VIM, and CLDN1 (Figures 1E, S1A). Intriguingly, 1,25(OH)2D did not regulate the major epithelial cadherin, CDH1, which is known to be repressed by SNAI2 (61), indicating that other essential cell-cell mediators (such as claudins) are involved in OS (Figure 1E). Moreover, after 1,25(OH)2D treatment, the protein expression of SNAI2, MMP3, and CD44 all decreased (Figures 1F-H, S1B). Surprisingly, 1,25(OH)2D treatment decreased CD44 nuclear localization, indicating that 1,25(OH)2D may inhibit the proteolytic processing of CD44’s intracellular cytoplasmic carboxy-terminal domain in order to limit tumor progression and metastasis via alternative genomic interactions (Figure 1I) (62).
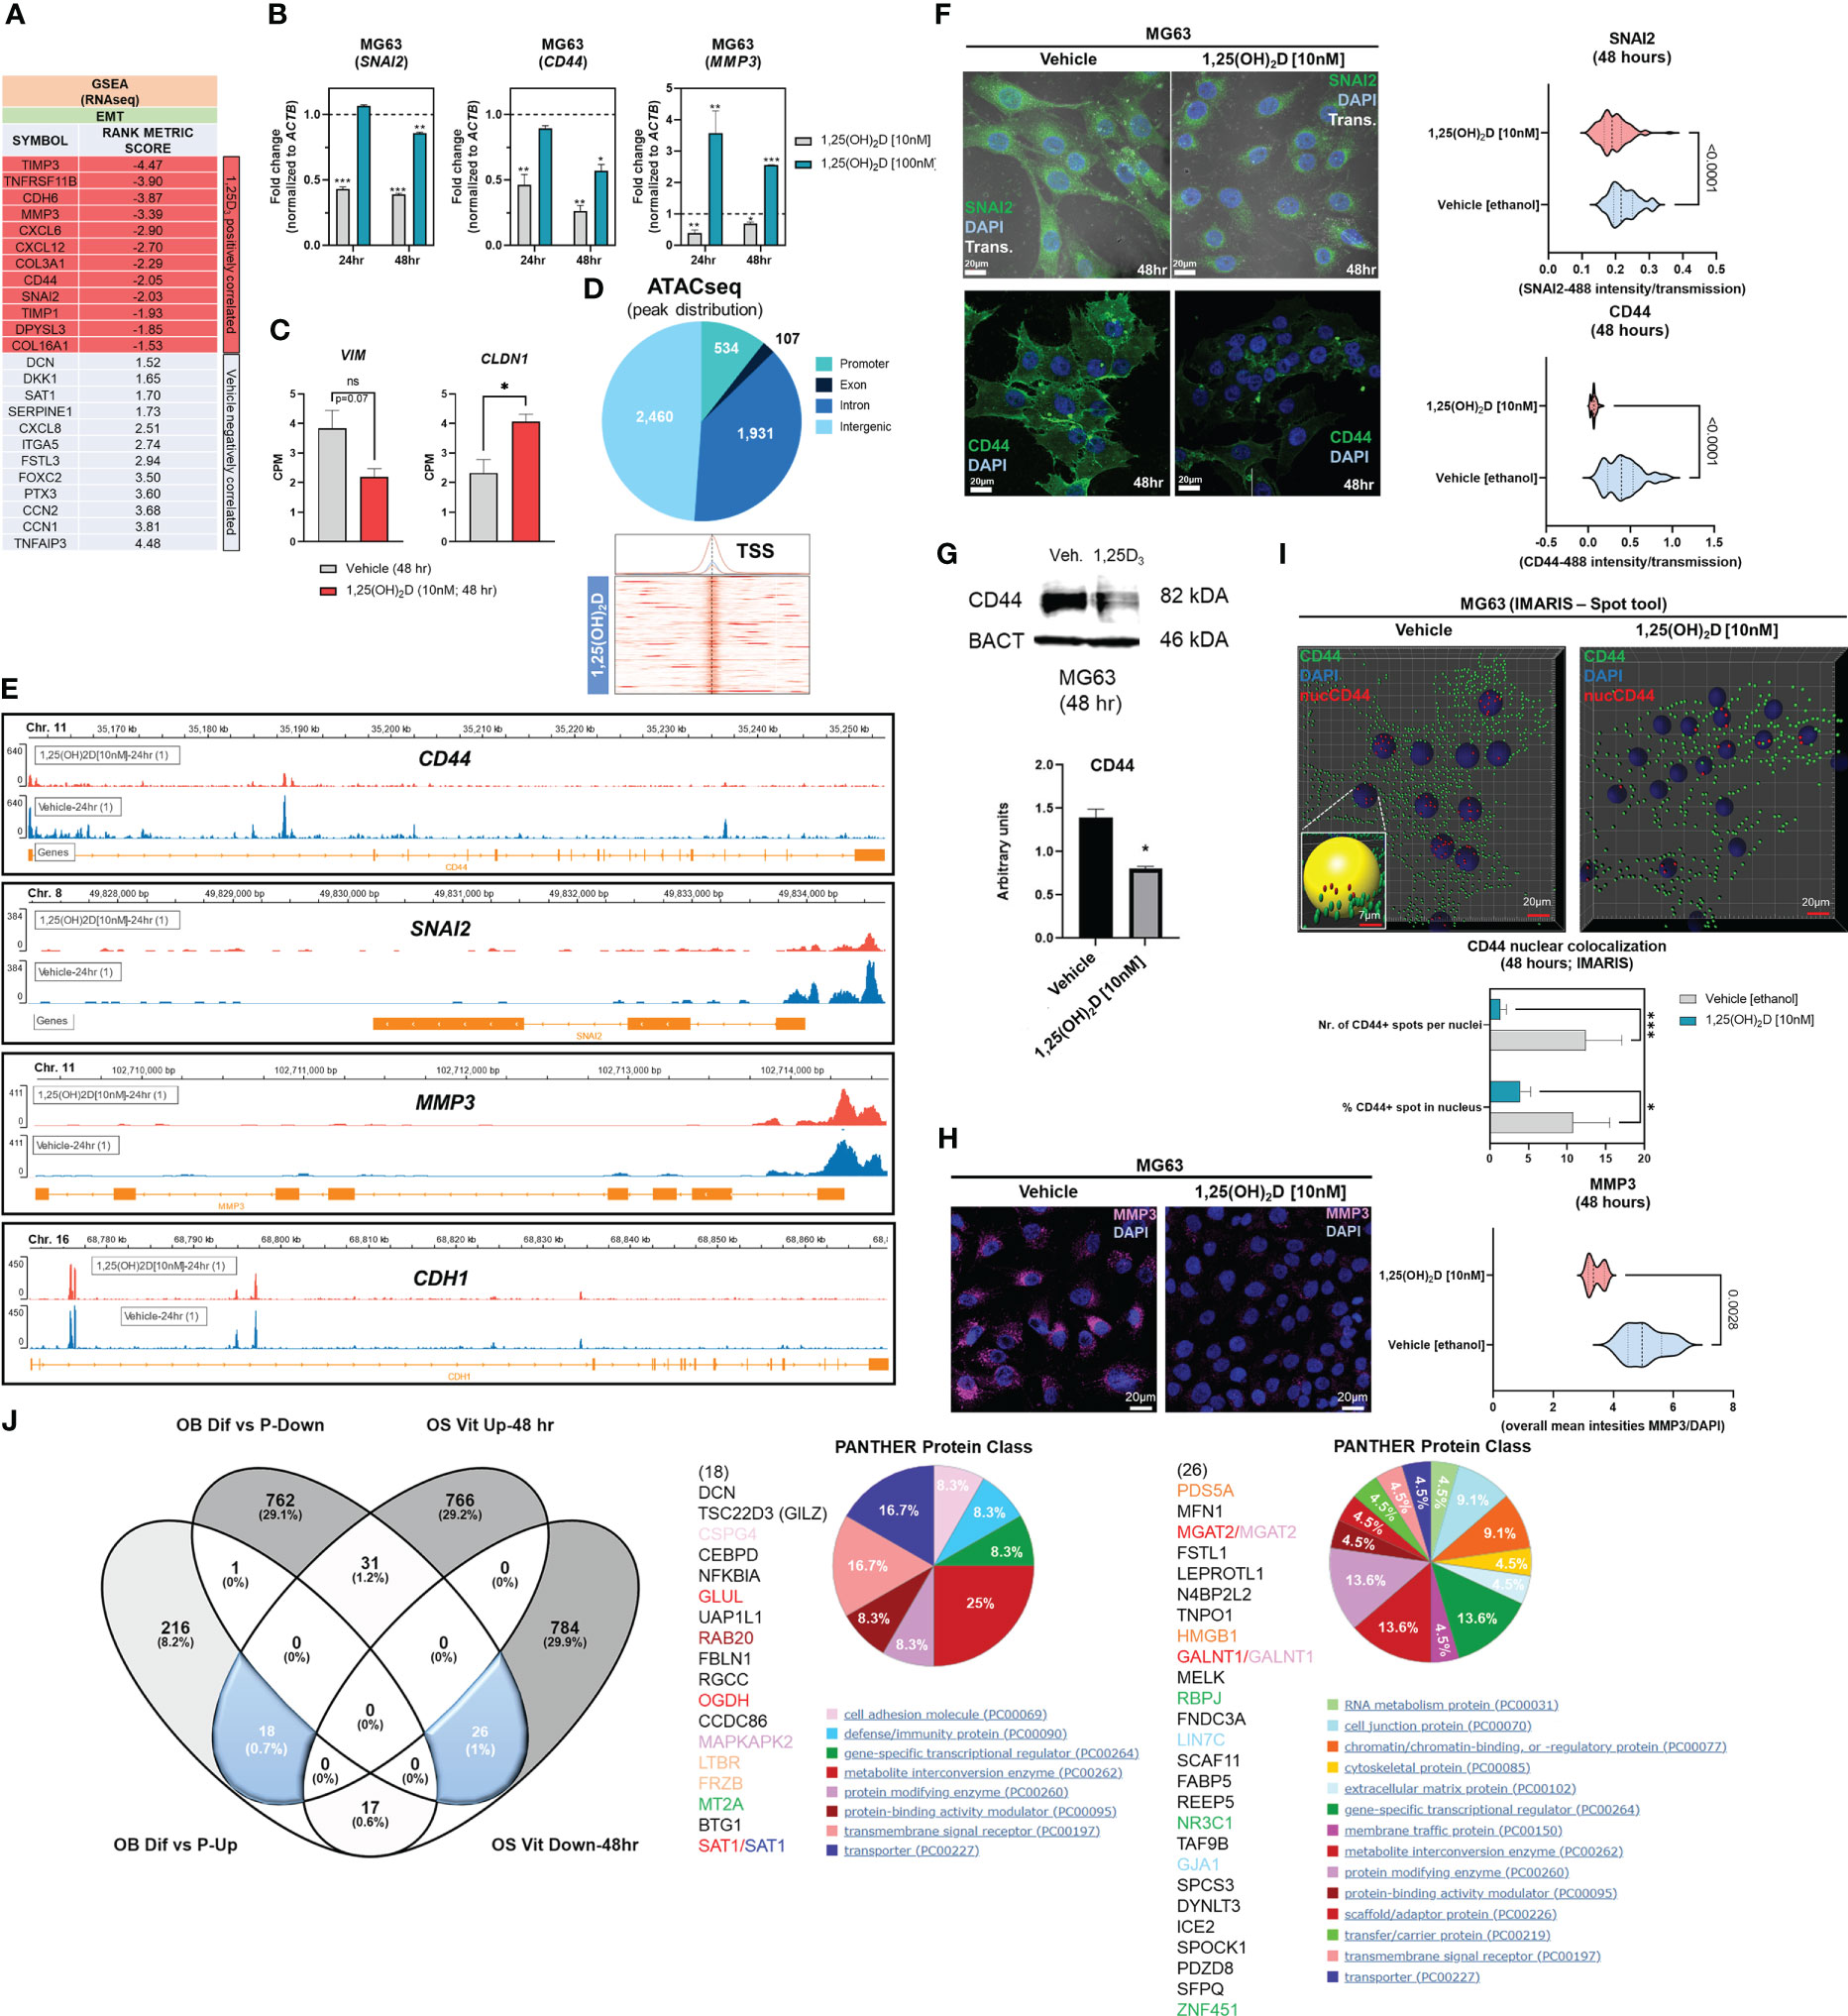
Figure 1 1,25(OH)2D treatment of MG63 cells results in enrichment of EMT pathway genes. (A) Gene set enrichment analysis (GSEA) was performed to identify a collection of a priori EMT-related genes that were over-represented in our RNAseq experiment and may be associated with 1,25(OH)2D anti-cancer effects. The MSigDB database was utilized for GSEA at http://www.broadinstitute.org/gsea. (B) Quantitative PCR (qPCR) study of genes associated with EMT. Tukey’s multiple comparison test, two-way ANOVA; p ≤ ****0.0001, ***0.001, **0.01, *0.05 (n=3). (C) MG63 RNA-seq study of EMT genes that are not contained in the MSigDB database. Test of independence (T); p ≤ *0.05 (n=1). (D) Top: ATAC-seq analysis and peak distribution of MG63 cells treated for 24 hours with 1,25(OH)2D. Bottom: ATAC-seq heatmap of 1,25(OH)2D regulated genes about the transcription start sites (TSS). (E) Visualization of ATAC-seq tracks utilizing the IGV genome browser in order to identify accessible chromatin areas and read peaks. Data represents 24 hours of treatment with 10nM 1,25(OH)2D in MG63 cells. All scales indicate the minimum and maximum reads in that window using IGV auto-scale. (F) Left: Immunofluorescence study of SNAI2 and CD44 in MG63 cells 48 hours after treatment with 1,25(OH)2D. Bars = 20µm. Right: Quantitative study of SNAI2 and CD44-coupled fluorescence intensities in MG63 samples treated with 1,25(OH)2D versus vehicle. Individual cell areas and transmitted light were used to equalize intensities. Between the vehicle and treatment data sets, an unpaired t test was conducted, with two-tailed p-value summaries displayed in the graphs. The violin plots (n=4) depict the quartiles and medians (darker dashes). (G) Western blot study of CD44 utilizing MG63 cells treated for 24 hours with 10nM 1,25(OH)2D. To facilitate comparisons, LiCOR band intensities were converted to arbitrary units. Test of independence; p ≤ *0.05 (n=3). (H) Left: Immunofluorescence confocal imaging study of MG63 cells reveals a decrease in MMP3 expression 48 hours after treatment with 10nM 1,25(OH)2D. Right: The violin plots reflect n=4 experimental conditions with an average of 20-40 cells (Unpaired T test). (I) An IMARIS colocalization analysis of MG63 cells treated for 48 hours with 10nM 1,25(OH)2D. Compared to 1,25(OH)2D-treated controls, CD44 nuclear localized expression was more prevalent in untreated controls. Two-way ANOVA Multiple comparisons using Tukey’s test; p ≤ ***0.001, *0.05 (n=3). (J) Left: A comparative transcriptome study of differentiated (Dif) and proliferating (P) normal osteoblasts in comparison to 1,25(OH)2D-treated MG63 OS cells. Normal osteoblast gene set generated from GSE39262. Set expression value (A) to 4 and cut-off to 2-fold change. Right: Panther analysis of subsets of up- and down-regulated genes. NS, not significant.
A comparison to normal osteoblast states (differentiation versus proliferation) was conducted to determine the relative biological effects of 1,25(OH)2D on OS. We compared the normal osteoblast transcriptomic data from GSE39262 with our RNAseq data from MG63 OS cells (Figure 1J). Compared to MG63 genes that were either upregulated or downregulated in response to 1,25(OH)2D, there was little overlap (0.7% and 1%, respectively) between the genes that define differentiated normal osteoblasts (Figure 1J left). Except for decorin (DCN), the remaining genes regulated by 1,25(OH)2D did not overlap with either normal proliferation or differentiation genes, indicating that one of vitamin D3’s function toward OS may involve other processes such as EMT regulation (Figure 1J middle). 1,25(OH)2D upregulated the cell adhesion factor CSPG4 and the WNT antagonist FRZB, but a greater proportion of genes (>29%) were excluded from differentiation or proliferation pathways. Similarly, several cell proliferation/DNA replication cancer-inducing genes, such as PDS5A, HMGB1, FABP5, and TAF9B, were downregulated in differentiated osteoblasts, but they represented less than 1% of the downregulated 1,25(OH)2D-dependent genes in MG63 cells, indicating that the majority of vitamin D’s effects on OS may involve functional regulation of processes such as EMT (>29%) instead (Figure 1J right).
1,25(OH)2D inhibits wound induced EMT and migration of osteosarcoma cells
Despite the findings of the GSEA, the biological effects of 1,25(OH)2D on EMT was unclear. To determine the effect of 1,25(OH)2D on cell migration, we performed an in vitro scratch assay on OS cell models MG63 and LM7, which are low and highly metastatic, respectively (63). After 72 hours of 10nM 1,25(OH)2D treatment, MG63 cell migration from the leading edge was reduced by approximately 50% compared to vehicle (Figures 2A–C). In contrast, after 72 hours of treatment with 10nM 1,25(OH)2D, scratch migration of LM7 cells was inhibited by 26% (Figures 2D, E), indicating relative resistance. The Boyden Chamber assay, which quantifies the number of invading cells atop a cell-permeable polyester porous membrane over a larger well containing osteogenic media, was also used to examine the response to 1,25(OH)2D. MG63 cells remained on the surface of the membrane regardless of treatment conditions, confirming their low metastatic potential (Figure 2F). In contrast, metastatic LM7 cells invaded the membrane after 24 hours, with a statistically significant reduction in the number of invading cells after 1,25(OH)2D treatment compared to vehicle control (Figure 2G). The results indicate that 1,25(OH)2D inhibits EMT in both OS cell models to varying degrees.
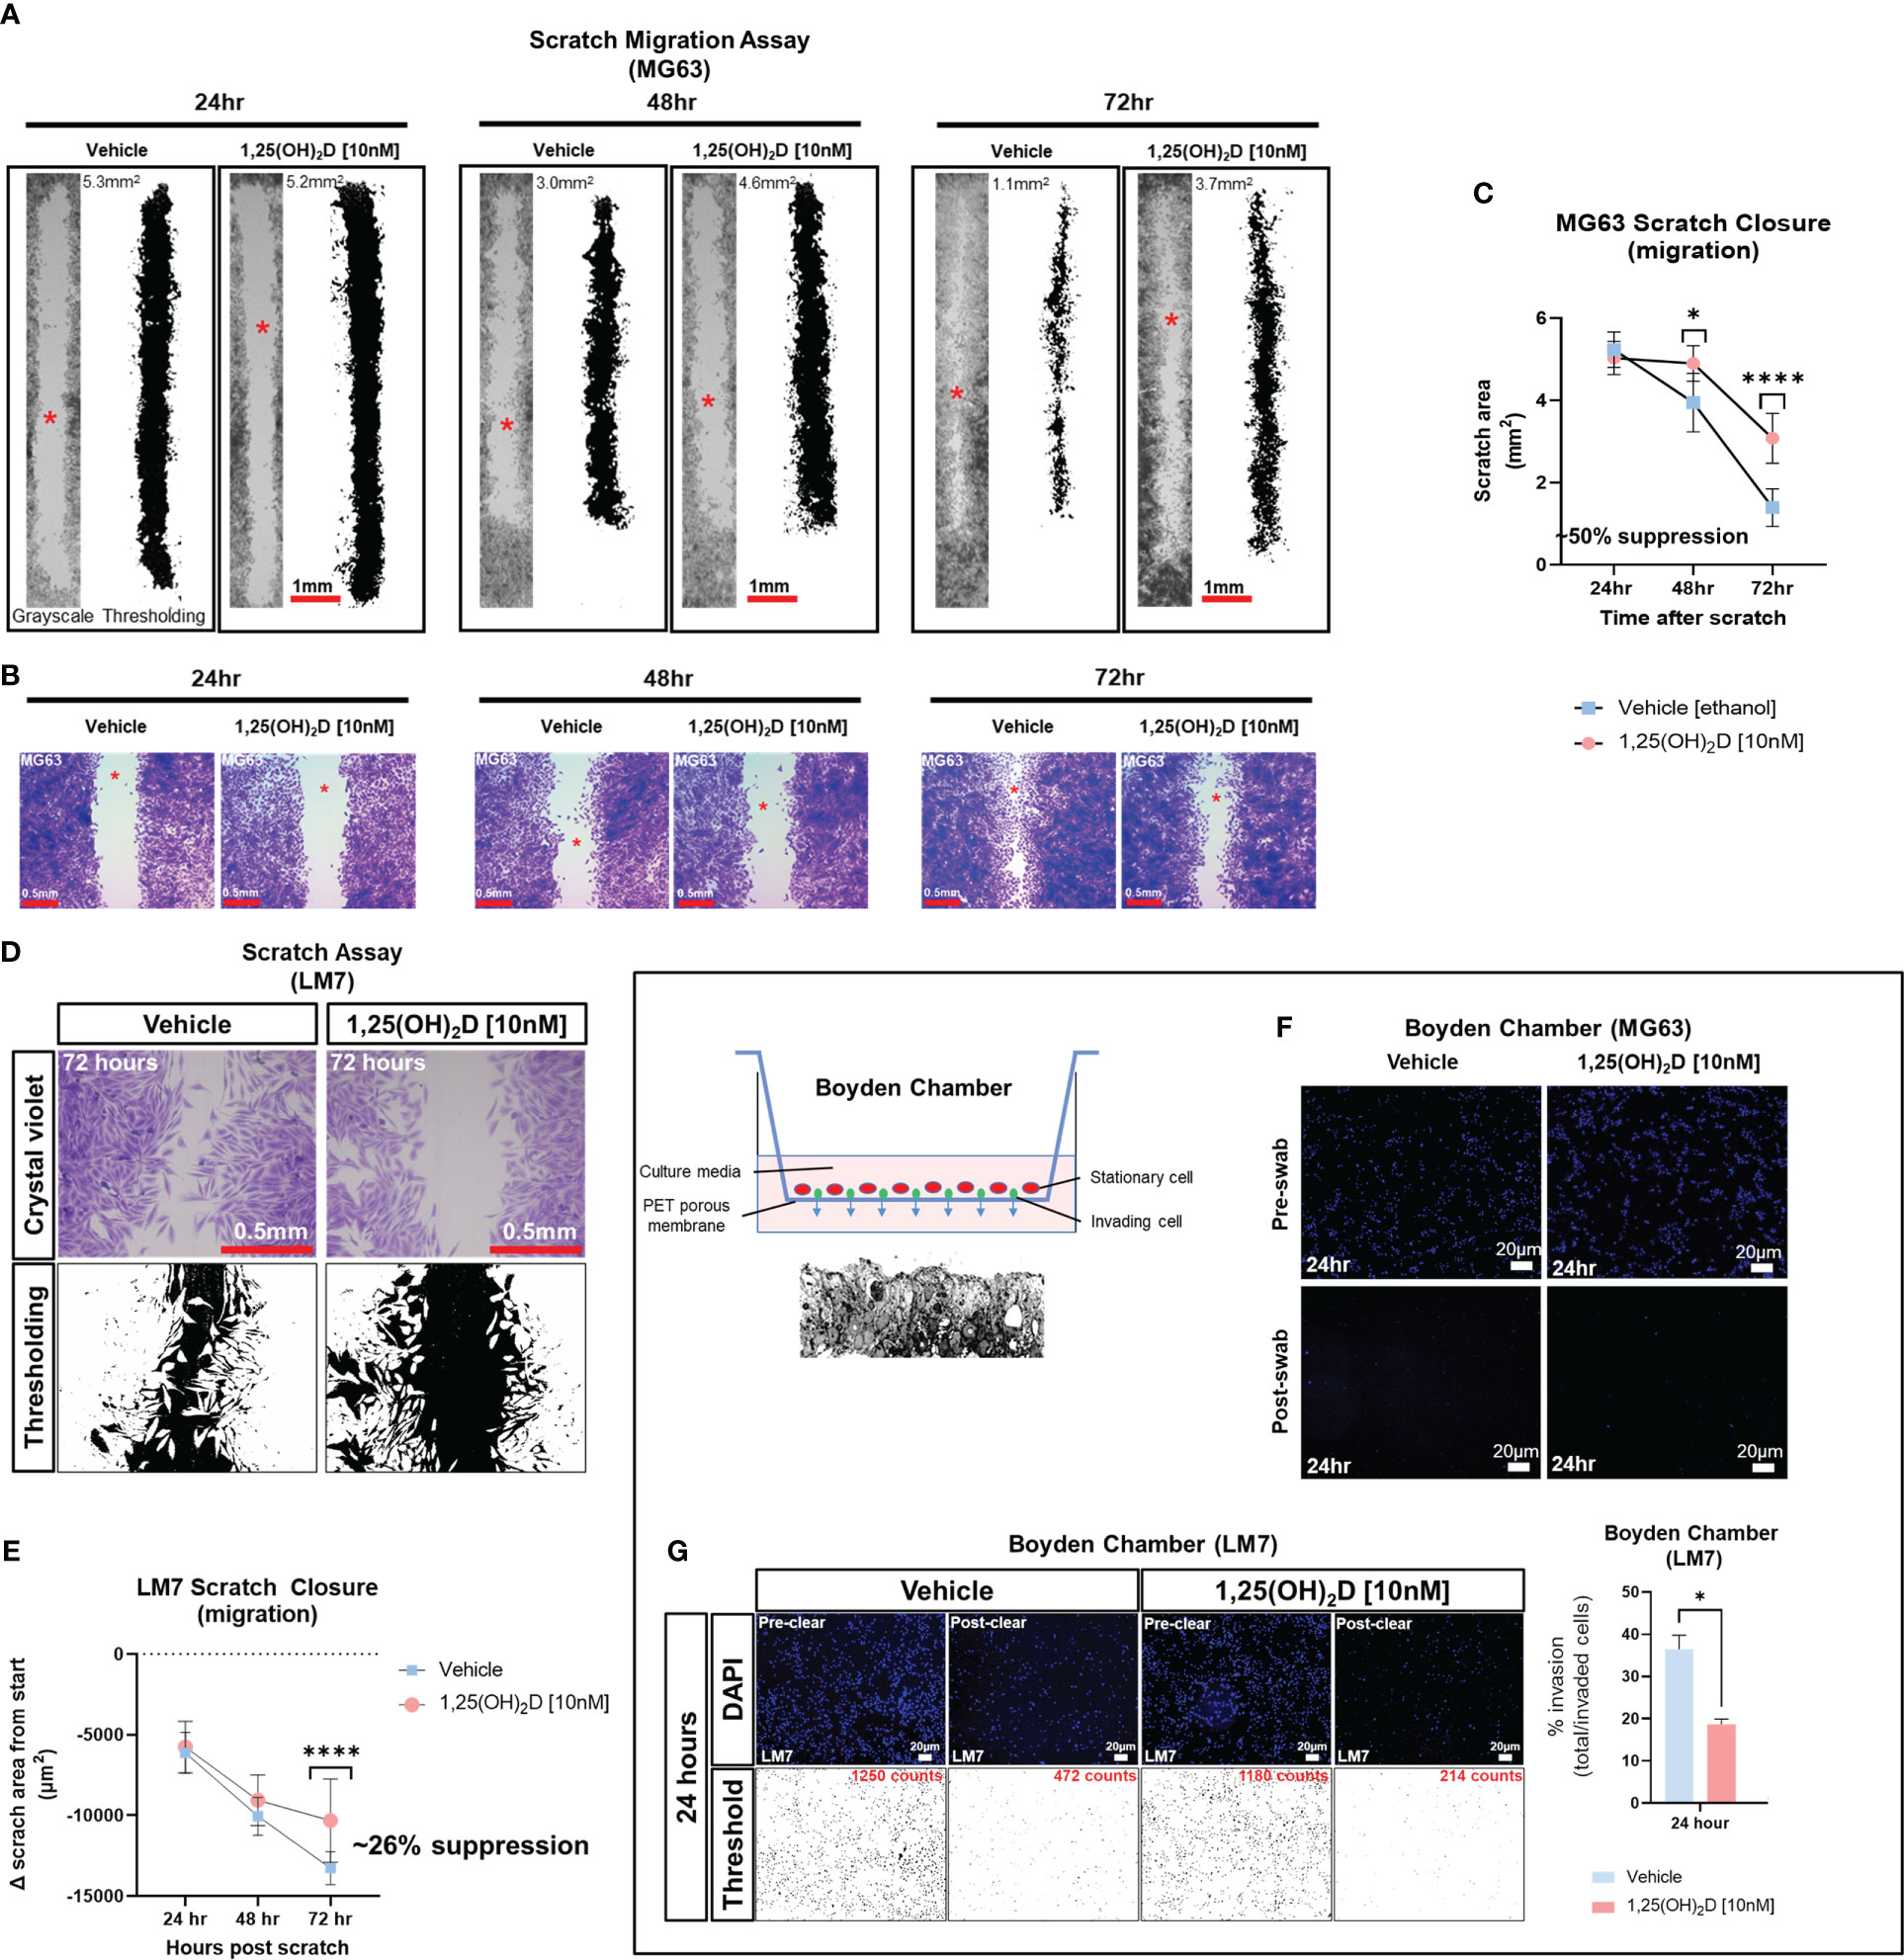
Figure 2 1,25(OH)2D inhibits osteosarcoma cell migration and invasion. (A) MG63 cells were subjected to scratch assays for 24-72 hours in the presence of vehicle or 10nM 1,25(OH)2D. ImageJ thresholding was employed to compute surface areas. The red asterisks indicate the region of increased magnification and crystal violet staining depicted in (B). (B) Staining with crystal violet of migratory MG63 cells. (C) Analysis of the MG63 scratch assay. The graph illustrates n=4 experimental setups for each condition, along with the average scratch area. Two-way ANOVA Multiple comparisons using Tukey’s test; p ≤ *0.05 and ****0.0001. (D) Metastatic LM7 cells were subjected to scratch studies for 24-72 hours with vehicle or 10nM 1,25(OH)2D. (E) Analysis of the LM7 scratch assay. The graph illustrates n=4 experimental setups for each condition, with the average scratch area indicated. Two-way ANOVA Tukey’s multiple comparison test; p ≤ ****0.0001. (F) Boyden chamber assay performed using MG63 cells. Right, overview of assay setup. Below is a sectional view of the membrane. (G) Boyden chamber assay using metastatic LM7 cells after 24 hours. Thresholding performed with ImageJ. Right: Quantitative analysis with Student’s t test; p ≤ *0.05 (n=3).
Experimentally induced EMT of mouse hair follicle stem cells reveals that Vdr signaling inhibits cell migration during normal cutaneous wound healing
The role of the VDR in OS migration prompted us to analyze whether migration is also affected in a different context such as skin wound repair. In addition to in vitro scratch assays of OS cells, we investigated cell migration of bulge stem cells in hair follicles, which is a well-established model whereby progenitor cells undergo EMT to repair wounds at distant regions (Figure 3A) (13). We used a lineage tracing approach to quantify the number of bulge stem cell progenitors that reside in the wound epicenter over time as a proxy for migration. To carry out these experiments, the RU486 inducible keratin 15 (K15)-crePR1:Vdrflox/flox:Confetti reporter mouse line was created, and lineage traced for four days after wounding to capture the early stage of the process (Figure 3B). Ablation of the Vdr within bulge stem cells increased the number of Confetti-labeled progenitors localized to the epicenter of wounds but not in individual hair follicles, resulting in enhanced wound closure (Figure 3C, upper left and lower panels; Figure 3D). Furthermore, bulge stem cell specific Vdr ablation resulted in thicker wound neoepidermis, an indication of increased EMT and fibrosis occurring following Vdr ablation. Mice with functional Vdr within bulge stem cells, on the other hand, had contiguous clonal streaks of Confetti-positive cells within individual hair follicles, indicating commitment of bulge stem cell progenitors down the hair follicle lineage (Figure 3C, upper left panel). Furthermore, a subset of bulge stem cell progenitors was fate restricted to the epidermal lineage but only migrated to the wound periphery four days after injury. These findings suggest that the Vdr regulates the fate of bulge stem cells and inhibits the migration of progenitor cells in healthy animals, which are consistent with its role in blocking migration of cancer cells.
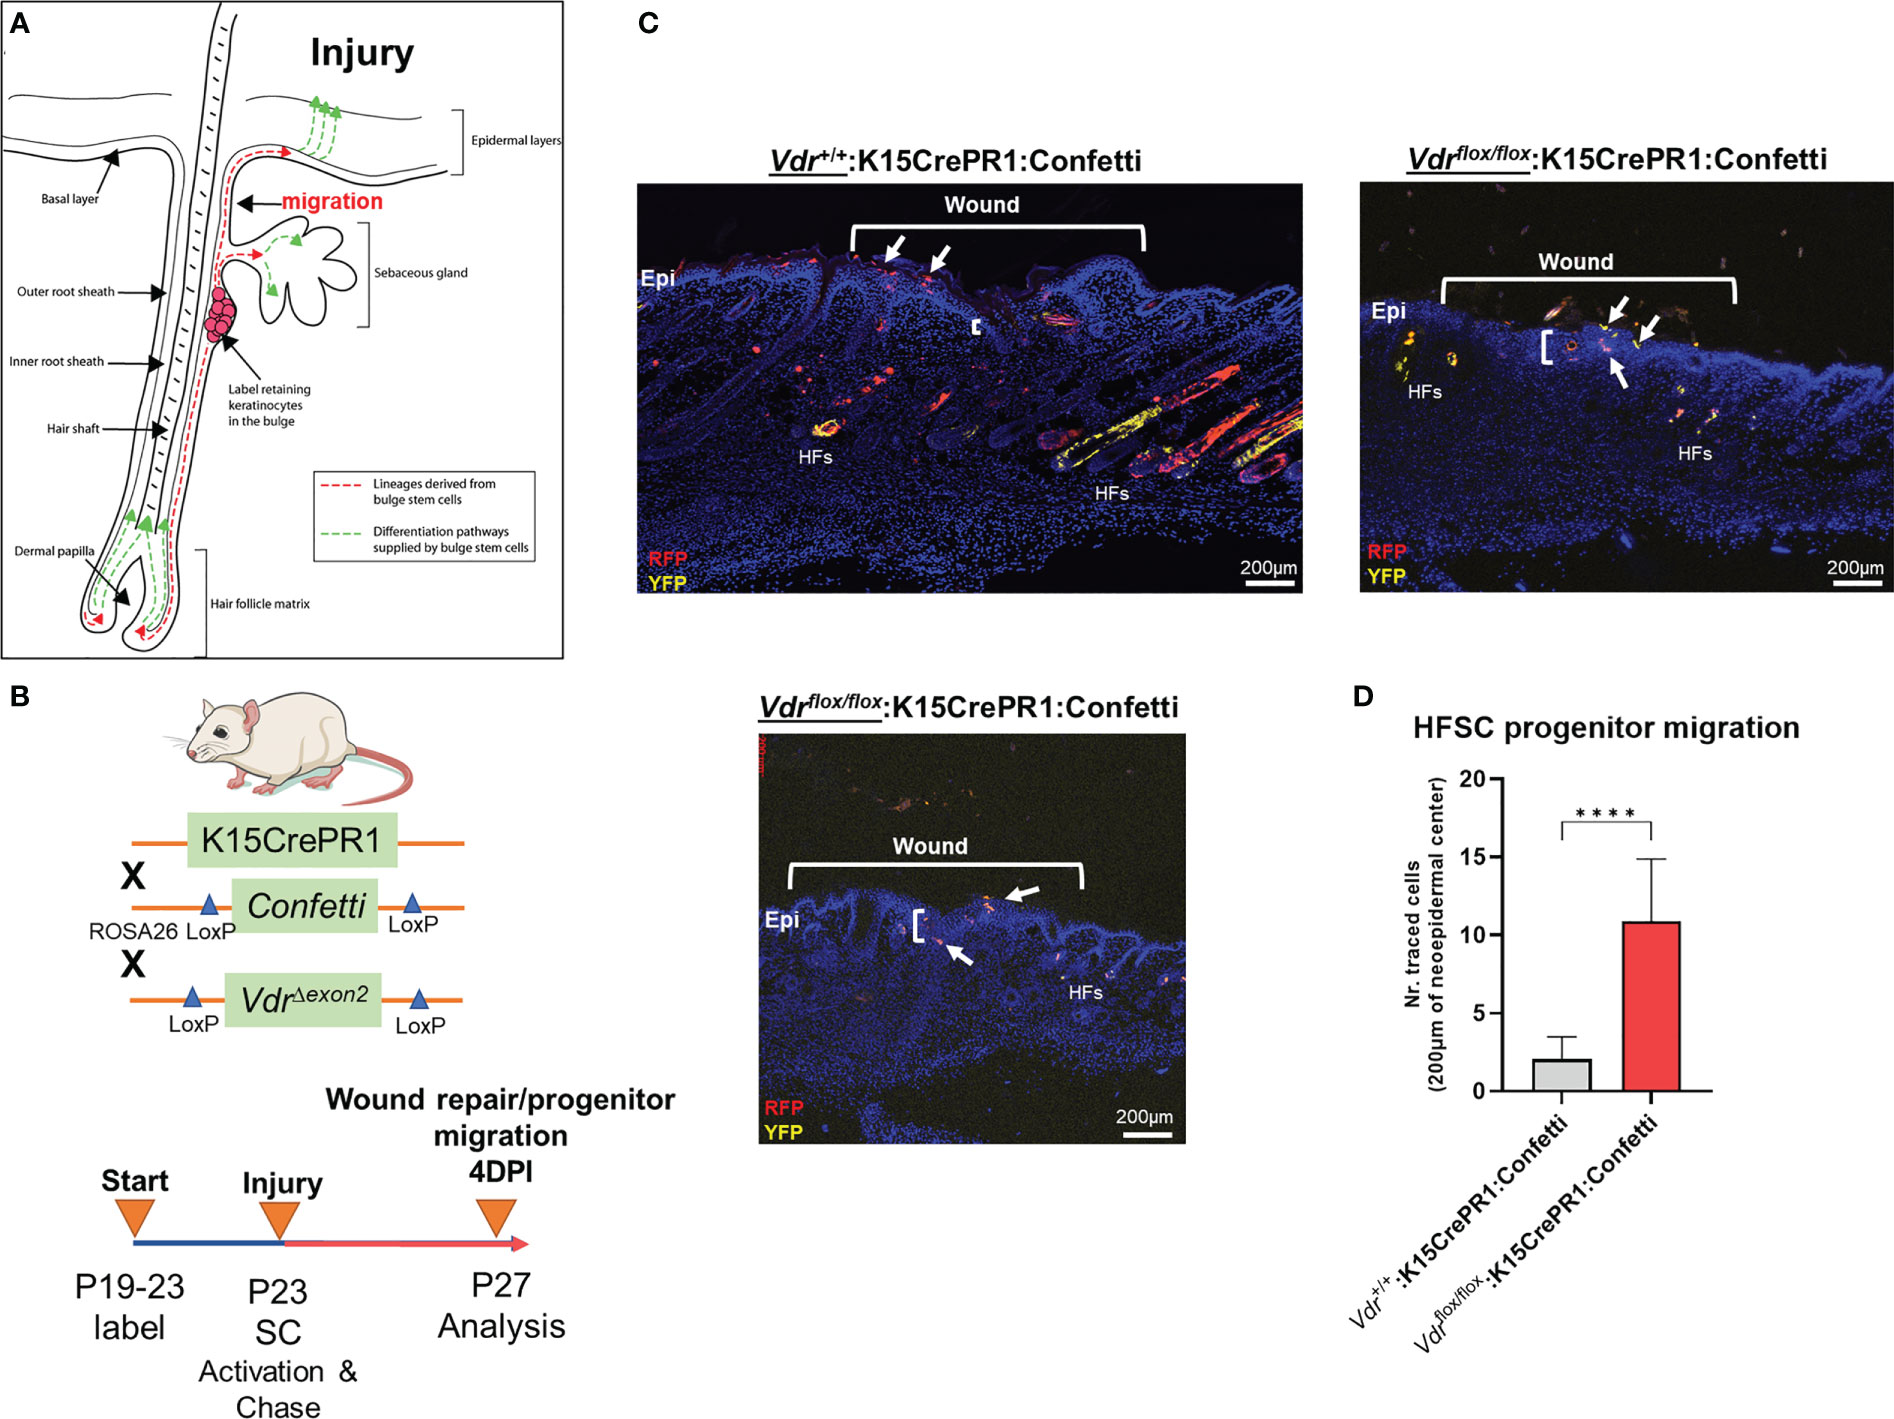
Figure 3 Vdr signaling inhibits cell migration in vivo. (A) Hair follicles include oligopotent stem cells that, in response to environmental stimuli such as injury, can create hair follicle and/or epithelial progenitor cells. These cells can move to their final destinations to accomplish specific functions, such as fibrosis-based wound healing and hair follicle development. (B) Top: In order to explore the involvement of the Vdr in injury-induced cell migration in vivo, a conditional Vdr ablation and hair stem cell Confetti reporter mice was developed. Bottom: Male experimental mice were treated topically with RU486 between the post-natal (P) ages of 19 and 23 days to activate Cre recombinase and label the initial pool of keratin 15 (K15)-positive hair follicle stem cells. Following 3-mm full-thickness skin lesions to activate stem cells (SCs), the animals were tracked for four days to assess the lineage and migration of progenitor cells (YFP, yellow fluorescent protein; RFP, red fluorescent protein). (C) Left: At 4 days post-injury (DPI), the control animals’ wounds had not fully healed, as evidenced by the thin neo-epidermis, the neo-epidermal gap, and the migration of tagged progenitor cells to the wound margin. Right and Bottom: Experimental animals with Vdr ablation exhibit quicker wound closure, increased thickness (fibrosis) of the neo-epidermis, and the presence of tagged progenitor cells in the center of the neo-epidermis, indicating accelerated migration and improved tissue healing. In addition, Vdr deletion in hair stem cells hindered the development and contribution of progenitor cells to individual hair follicles, demonstrating that the Vdr plays an essential role in hair formation. (D) Quantification of hair follicle stem cell progenitors in the wound’s epicenter. Student t test; p ≤ ***0.001 (n=4-5).
Epigenomic and putative target gene and activity analysis reveals the integration of the VDR with neurotransmitter pathways in osteosarcoma cell models
Given the distinct features of the OS subtypes, we sought to better define molecular and epigenetic regulators within the models. We re-analyzed epigenomic data obtained from MG63 and LM7 cells, as well as data obtained from primary patient OS samples and those that had spread to lung tissues (GSE74230), by focusing on transcription factor (TF) motif binding, differential peaks, and gene ontology (GO) analysis of acetylated (ac) H3K27 histone modifications that reflect active transcription (Figure 4A) (64). TF factor motif analysis within H3K27ac peaks revealed 29 MG63-specific TF binding sites, including those for EOMES, PRDM1, EPAS1 (HIF2A), E2F6, and MYC/MAX, which reflect known early development, tumor-initiation, and stemness factors (Figure 4B, Worksheet 1) (65). GO analysis of motif-binding TFs confirmed their role in embryonic development, including brain development, in part due to the function of EOMES (also known as T box transcription factor 2, TBR2) in stem cell mediated neurogenesis (Figure 4C) (66). In addition, pathway analysis revealed the involvement of oxidative stress responses, a known regulator of cell migration (67), and the PDGF signaling pathway, which integrates major signaling hubs to promote stem cell self-renewal (68). Eighteen TF binding sites specific to LM7 were identified for TEAD, TR4, MYOG, SOX2, and E2F7, which support mesenchymal gene expression to disrupt ECM and cell-cell adhesions to promote cell migration (Figure 4B) (69–71). Of note, fibroblasts can transform into skeletal muscle cells via myogenin (MYOG) (45), indicating a potential regulatory link between metastatic OS and other musculoskeletal cancers such as rhabdomyosarcoma (72), as revealed by the GO analysis (Figure 4C). RUNX binding was observed in both OS cell lines, which is particularly important in OS development in its aberrant transcriptional control of osteoblast commitment (73). Importantly, H3K27ac modifications were linked to VDR and RXR heterodimeric vitamin D response element (VDRE) binding in both cell models, indicating that 1,25(OH)2D regulates multiple functions of OS subtypes (Figure 4B). Interestingly, GO Disease analysis revealed that subtype-specific TFs were strictly associated with cancers, whereas shared TFs were associated with a variety of cancer types as well as diseases such as type 2 diabetes mellitus, a risk factor for cancer development. In addition, by comparing H3K27ac with H3K4me1 (i.e., histone changes associated with enhancers) modifications and DNase I hypersensitive sites, the degree of active versus poised enhancer utilization within the OS subtypes was determined at the epigenome-wide level. In MG63 cells, there was a weaker correlation between H3K27ac and H3K4me1 than in LM7 cells (0.14 versus 0.44), indicating that enhancer elements are poised to help define a more undifferentiated cell state (Figure 4D left) (74). This was also shown by comparing overall H3K27ac marks between LM7 and MG63 cells, showing more gene activity in LM7 cells (Figure 4D right).
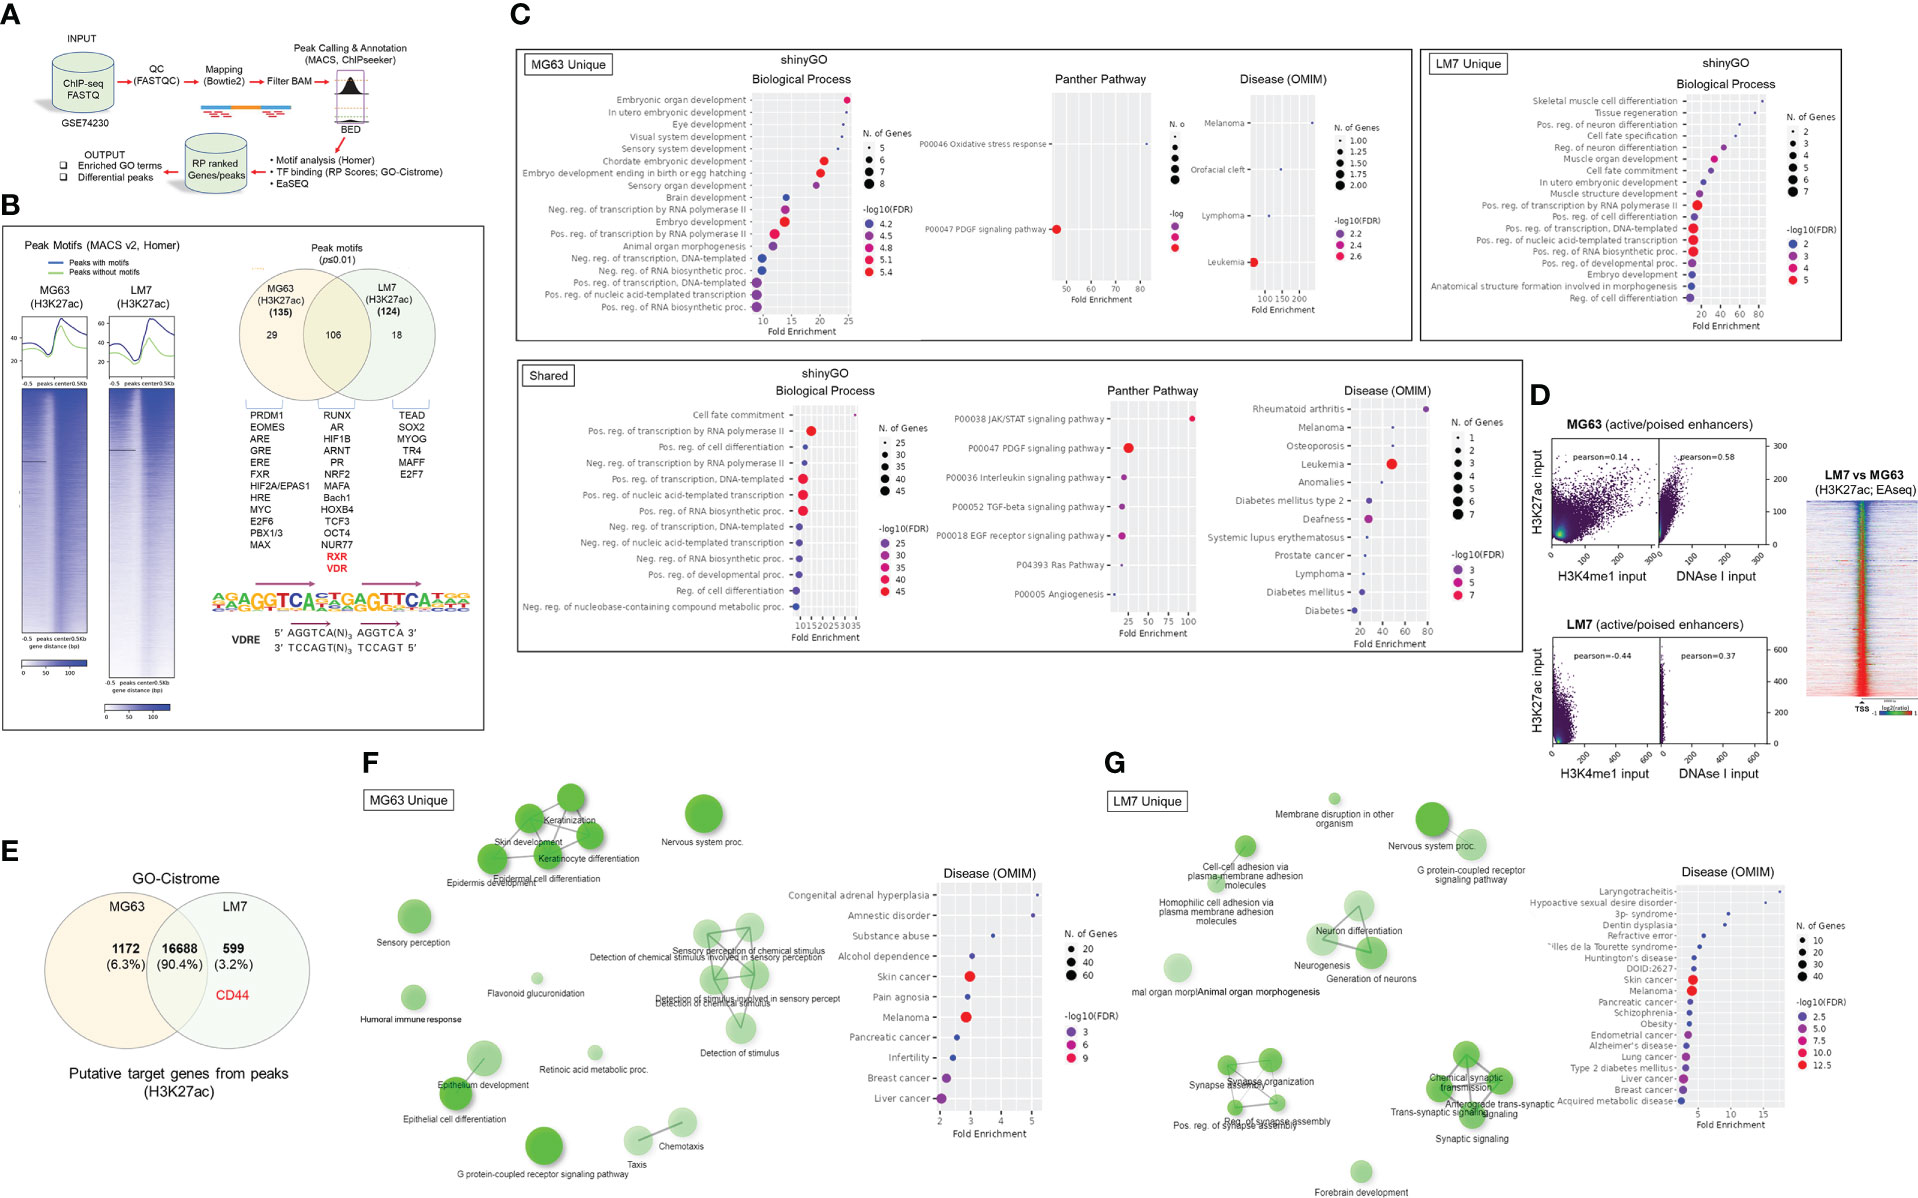
Figure 4 Epigenomic and putative target gene analysis of osteosarcoma cell models. (A) Framework for ChIP-seq analysis and peak calling across MG63 and LM7 OS cell lines derived from GSE74230. Data quality specifications for FASTQ files processed with the Peak calling and Annotation pipeline. Using enriched GO keywords based on differential peaks, biological process, route, and disease functional annotations were generated. Using Homer and GO-Cistrome, motif analysis and transcription factor regulatory potential (RP) scores were obtained. Utilizing EaSeq, heatmaps and differential peaks were generated. (B) Left: Homer was utilized to identify histone modification peaks (H3K27ac) and motif discovery between LM7 and MG63 cells. In HOMER, Summits.bed files from MACS2 (Model-based analysis of ChIP-Seq) were utilized to identify recognized motifs. The x-axis analysis utilized fixed-size peak discovery on histone markers. Right: A subset of peak motifs that are enriched in the LM7 and MG63 cell lines. Motifs having a p-value 0.01 are displayed. Below: Sequence of the consensus VDR direct repat 3 response element (VDRE) is shown. (C) Gene ontology enrichment analysis of OS motifs with ShinyGo version 0.75. The x- axis represents fold enrichment, which indicates the extent to which genes of a certain pathway/biological process/disease are overrepresented. Fold enrichment is defined as the proportion of genes in the list that belong to a pathway divided by the proportion of genes in the background. The hues show the magnitude of the negative log10 of the false discovery rate (FDR), which indicates the likelihood that the enrichment occurred by coincidence (larger value means smaller FDR). (D) Assessing epigenome-wide poised or active enhancers between MG63 and LM7 cells. Right: BED files were used to perform Pearson correlation analysis between H3K27ac/H3K4me1/DNase I peaks. Left: Heat map showing comparison of H3K27ac peaks between cell lines. (E) Probable target genes generated from H3K27ac peaks identified using GO-Cistrome. (F) Gene ontology enrichment analysis of MG63 OS H3K27ac mapped genes using ShinyGo version 0.75, with network analysis shown in green. (G) Gene ontology enrichment analysis of identified LM7 OS H3K27ac genes utilizing ShinyGo version 0.75 Green depiction of network analysis.
Next, using GO-Cistrome, candidate target genes mediated by H3K27ac were identified and assessed (Figure 4E) (75). Approximately 13.3% and 9.3% of the H3K27ac peaks in LM7 and MG63 were located within 1KB of the promoter regions of genes (Figure S2). There were 1172 and 599 H3K27ac-defining MG63 and LM7 specific gene signatures, with CD44 identified as an active LM7 target gene (Worksheets 2, 3). The GO Network and Disease analysis of MG63 putative genes was consistent with the motif analysis, which found correlations with epidermal differentiation, neuronal/sensory systems, and invasive malignancies (Figures 4F, S3, File S1). Compared to MG63 cells, LM7 H3K27ac-linked genes were significantly associated with neurogenesis and neurological disorders, as well as cell-cell adhesion molecules (Figures 4G, S3, File S2). Given the likelihood that osteosarcomas may act as neuroendocrine carcinoids, we examined transcription of ionotropic and metabotropic glutamate receptors following 1,25(OH)2D treatment of MG63 cells. Only three of the available 24 mammalian receptors and subunits were expressed in MG63 cells (i.e., GIRK3, GRIN3A, and GRIN2D), with two of the three receptors downregulated by 1,25(OH)2D (Figure S4) (GSE220948). The ionotropic glutamate [kainate] receptor 3 (GIRK3) was downregulated at both time points following 1,25(OH)2D treatment, whereas the ionotropic glutamate [NMDA] receptor subunit epsilon-4 (GRIN2D) was only downregulated after 48 hours and was identified as a putative H3K27ac-target gene in LM7 cells (Worksheet 3). These results imply that vitamin D3 may decreased tumor burden by inhibiting OS-nerve interactions.
Vitamin D modulates MG63 tumorigenicity by inhibiting nonsense-mediated RNA decay in a SMG6-SMG7-dependent manner
To gain insights into the biological aspects of epigenetic modifications that are differentially represented in the OS subtypes, we utilized EaSeq (Figure 5A). There were approximately 2,634 more H3K27ac gene-associated peaks than H3K4me1 peaks due to the fine-tuning regulatory effects of enhancers (Worksheets 4, 5). By comparing 1,25(OH)2D resistant LM7 to MG63 cells, overrepresented target genes of H3K27 acetylation implicated the involvement of the mRNA surveillance pathway, but underrepresented genes engaged the HIF-1 and TNF signaling pathways, indicating a putative decrease in immunogenicity and immunosurveillance of LM7 metastatic cells (Figure 5B). LM7 cells overexpressed NMD machinery components involved in the assembly of the surveillance complex at aberrant PTCs (e.g., eRF1, UPF2, UPF3) and cleavage of RNA templates involving exo/endonucleolytic pathways (SMG5, SMG6, SMG7) (Figure 5C). Interestingly, the RNA-binding protein MUSASHI (encoded by MSI1), which lies upstream of the surveillance complex, was increased in LM7 cells indicating the regulation of translation of defective transcripts vulnerable to nonsense-mediated translation repression (NMTR) (76).

Figure 5 Differential peak analysis of osteosarcoma lines reveals overrepresentation of the NMD pathway. (A) Predicting distinct H3K27ac and H3K4me1 peaks in OS cells using the EaSeq software. Greater differential peaks between cell lines and histone markers based on Log2 fold variations inside designated regions relative to the transcription start site (TSS). (B) Gene ontology enrichment analysis of LM7 OS H3K27ac overrepresented and underrepresented putative target genes with ShinyGo version 0.75. The mRNA surveillance pathway is highlighted among shown biological processes. (C) Pathview visualization of the nonsense-mediated RNA decay (NMD) pathway in relation to the H3K27ac target genes affected in LM7 cells. Targets that were overrepresented at the exon junction and surveillance and cleavage complexes are shown in red. (D) RNA-Seq evaluation of nonsense-mediated translation suppression and NMD machinery genes in MG63 cells. Notable was SMG6, which is responsible for the cleavage of pre-mRNA, resulting in its degradation. (E) In MG63 OS cells, 1,25(OH)2D selectively upregulates known NMD target genes. MG63 cells treated with 10nM 1,25(OH)2D for 48 hours exhibited an elevated 3:1 ratio of upregulated known NMD target genes relative to non-NMD target genes. The RNA-seq data set’s statistically significant genes (FDR ≤ 0.05) were compared. The symmetry of the data distribution was also characterized by descriptive statistics (skewness/kurtosis). (F) In MG63 OS cells, 1,25(OH)2D does not selectively upregulate non-NMD target genes. After treatment with 1,25(OH)2D, the ratio of upregulated to downregulated genes in a random sample of non-NMD target genes is 1:1. (G) Analysis of the receiver operating characteristic (ROC) curve for statistical comparisons and identification of NMD or non-NMD target gene classes. To compare the two classifiers, the area under the ROC curve (AUC) was computed, which quantifies the overall performance of the test to discriminate between genes in the presence of 1,25(OH)2D that are NMD-target or non-NMD target genes relative to the null hypothesis (0.5). (H) Phosphorylated UPF1S1127 expression in MG63 cells after 24 hours of 10nM 1,25(OH)2D. Bar = 20µm. (I) NDM inhibitor 14 (NMDI-14) treatment of MG63 for 24 hours. Two-way ANOVA test with Tukey’s multiple comparisons (n=3); ***p ≤ 0.001, ****p ≤ 0.0001. (J) DsiRNA SMG6 knockdown of MG63 cells for 24 hours. Negative control (NC) duplexes used for comparisons. All conditions were compared to transfection reagent (BioT) only treatments. Two-way ANOVA test with Tukey’s multiple comparisons (n=3); **p ≤ 0.01, ****p ≤ 0.0001. NS, not significant.
We next investigated vitamin D3 regulation of NMD in MG63 and LM7 cells. We observed a statistically significant downregulation of autoregulatory NMD machinery as well as NMTR genes following 10nM 1,25(OH)2D treatment of MG63 cells (Figure 5D) (77). Interestingly, there was a statistically significant downregulation of SMG5 among a subset of detectable NMD genes in LM7 cells treated with 10nM 1,25(OH)2D for 48 hours as well (Figure S5A). Next, we examined the impact of 1,25(OH)2D on known NMD target genes. On the basis of four investigations in which NMD effectors were inhibited in human cervical cancer cells (77–80), we compiled a list of NMD-target and non-NMD-target genes (Figure S6). Based on this analysis, more than 4,000 genes were identified as NMD nontarget genes, whereas more than 900 genes were recognized as NMD targets by at least one study; whereby, 50 genes were classified as NMD core targets by all studies. These curated NMD-target and nontarget genes were used to analyze the RNA-seq dataset generated from MG63 cells. Thirty nine of the 50 core NMD-target genes were mapped to MG63 cells, and overexpressed in a 3:1 ratio (-0.6 skewness and 2.2 kurtosis) relative to those that were downregulated in response to 1,25(OH)2D treatment (Figure 5E). TSC22 Domain Family Member 3 (TSC22D3), also known as GILZ, which encodes a glucocorticoid-inducible anti-proliferation transcription factor, was the most elevated NMD target in MG63 OS cells (81). Stanniocalcin-2 (STC2), which is involved in normal osteoblast differentiation (82), was the second most elevated NMD-target gene in response to 1,25(OH)2D, as well as CLDN15 and BTN2A1, which may promote cell-to-cell adhesion to limit migration (83) and the expression of a phosphoantigen to enhance T cell activity (84), respectively. In contrast, a multiple-comparison study of NMD nontarget genes demonstrated a 1:1 (-0.3 skewness and 0.4 kurtosis) association between overexpressed and downregulated genes (Figure 5F). In addition to the descriptive statistics, a receiver operating characteristic (ROC) curve analysis was performed to investigate the capacity to distinguish between genes that are one of two classifiers (i.e., NMD target or non-target genes) in the presence of 1,25(OH)2D relative to the null hypothesis (area under the curve, 0.5). The C statistics revealed statistical significance (p = 0.03) between the two classifiers based on ROC curve analysis (Figure 5G).
To gain a better understanding of how 1,25(OH)2D controls the NMD pathway in MG63 cells, we investigated UPF1, which is a key RNA helicase that assembles the upstream surveillance complex at the exon junction complex of aberrant mRNAs dictated by its phosphorylation status (Figure 5C) (85, 86). After 24 hours of 1,25(OH)2D treatment, there was no significant change in UPF phosphorylation compared to vehicle treated MG63 cells (Figure 5H), suggesting that changes in UPF2/UPF3 expression may be the key NMD upstream factors regulated by 1,25(OH)2D (Figure 5D). To better understand the role of downstream NMD pathway factors on regulation of NMD-target (e.g., GILZ, STC2) and non-target (e.g., FKBP5) genes in MG63 cells, we pharmacologically and genetically ablated components of the RNA degradation complex. First, we utilized the small molecule NMD inhibitor, NDMI-14, which prevents SMG7-UPF1 interactions (87), and observed a modest increase in GILZ after 24 hours of treatment (Figure 5I). There was a small, yet significant increase in FKBP5, which may reflect stress responses of high NMDI-14 concentrations, given its function as a Hsp90-associated co-chaperone (88). Next, we utilized dicer-substrate short interfering RNAs (DsiRNA) to knockdown (KD) SMG6 in MG63 cells and observed a modest increase in STC2, as well as a statistically significant, yet small increase in GILZ (Figures 5J, S4B). Among the conditions tested, the findings suggest that GILZ is dependent on both SMG7 and SMG6, while STC2 is modulated by SMG6 only, and that 1,25(OH)2D exhibited a greater impact on NMD target genes likely reflecting its simultaneous effects on multiple upstream and downstream components of the NMD pathway to suppress OS.
LM7 resistance to 1,25(OH)2D is dictated by high SNAI2 and low VDR levels
To better understand the functional role of 1,25(OH)2D on metastasis, the transcriptional responses of EMT genes on highly metastatic LM7 cells were compared to those of MG63 cells. The decrease in expression of SNAI2 in MG63 cells was less pronounced in LM7 cells following 1,25(OH)2D treatment, while CD44 expression was unaffected (Figure 6A). There was a concentration-dependent effect to 1,25(OH)2D on MMP3 expression 24 hours after treatment, with 10nM increasing MMP3 levels, suggestive of resistance. In addition, the dose and duration of 1,25(OH)2D in LM7 cells resulted in a maximal 2-fold overexpression of SOD2, a potent antioxidative enzyme that inhibits tumor progression via reduced free radical production, which was less pronounced compared to MG63 cells (Figure 6B). Interestingly, there was significant overexpression of the mitochondrial monooxygenase, CYP24A1, which catabolizes and deactivates 1,25(OH)2D via 24-hydroxlation, in LM7 cells after 1,25(OH)2D treatment (Figure 6B). Also, by evaluating the relative levels of VDR and SNAI2 transcripts, MG63 cells were characterized as VDRhighSNAI2low whereas LM7 cells were VDRlowSNAI2high, providing more evidence for 1,25(OH)2D resistance in LM7 cells (Figure 6C). By increasing the duration of 1,25(OH)2D from 48 to 96 hours, LM7 cells overcame the resistance as depicted by a significant decrease in CD44 protein expression levels (Figure 6D).
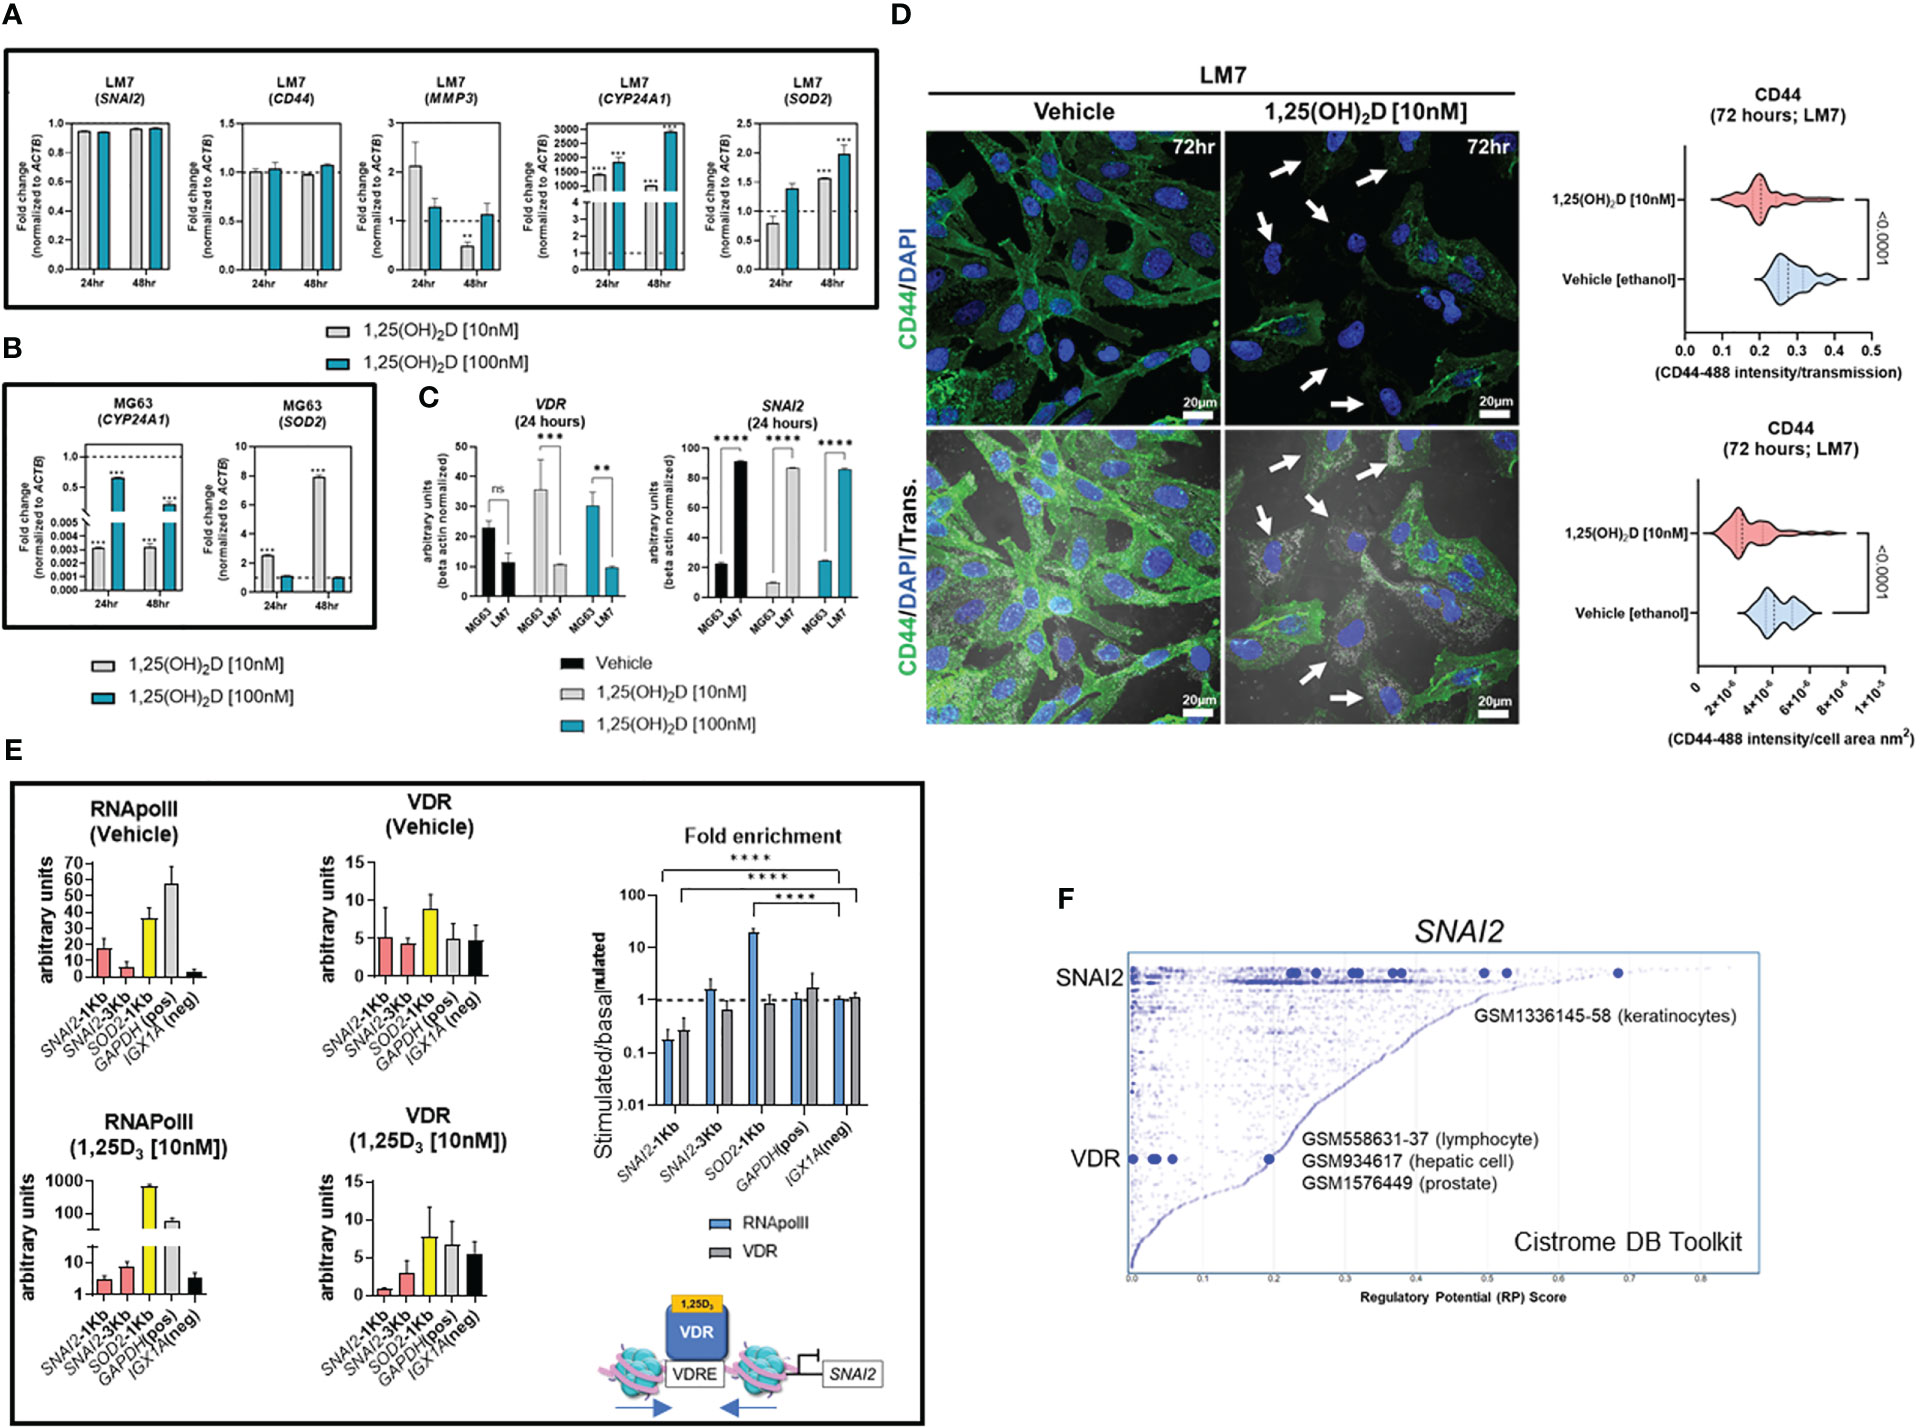
Figure 6 LM7 metastatic cells are resistant to 1,25(OH)2D and SNAI2 is a VDR-target gene. (A) qPCR study of EMT, vitamin D, and anti-oxidative transcripts in LM7 cells following treatment with 1,25(OH)2D. Two-way ANOVA Multiple comparisons using Tukey’s test; p ≤ **0.01, ***0.001 (n=3). (B) qPCR study of vitamin D and anti-oxidative transcripts in MG63 cells following treatment with 1,25(OH)2D. Two-way ANOVA Tukey’s test for multiple comparisons; p ≤ 0.001 (n=3). (C) Normalized VDR and SNAI2 gene expression in LM7 and MG63 cells. Two-way ANOVA Test for multiple comparisons using Tukey’s method; p ≤ **0.01, ***0.001, ****0.0001 (n=3). (D) 96 hours of 10nM 1,25(OH)2D treatment decreases CD44 expression levels in LM7 cells. Arrows depict cells with largest differences in CD44 expression. Unpaired T test (n=4). (E) ChIP study of VDR-RNApol2 chromatin interactions in 1,25(OH)2D-treated MG63 cells. A two-way ANOVA was performed on the fold-change between stimulated and baseline states. Dunnett’s multiple comparison test relative to IGX1A; p ≤ ****0.0001 (n=3). (F) Analysis of transcription factors that regulate SNAI2 using the Cistrome DB Toolkit. The static plot with RP scores on the X- and Y-axes depicts transcription factors, whereas the blue dots represent individual public ChIP-seq data sets. Listed next to each transcription factor are public GEO data series. NS, not significant.
VDR-mediated suppression of the EMT transcriptional repressor SNAI2 occurs via chromatin condensation
Based on the ATACseq and qPCR data we hypothesized that SNAI2 is a direct VDR target gene. Using NUBIscan (89), a putative VDRE direct repeat (DR3) binding site was found within 1KB upstream of the transcriptional start site (TSS) exclusively in the SNAI2 locus, but not in the SOD2 locus (Figure S7). MG63 cells treated with 1,25(OH)2D or vehicle were subjected to conventional chromatin immunoprecipitation quantitative PCR (ChIP-qPCR) to measure VDR binding and transcriptional activity mediated by RNAPolII at the SNAI2 distal and proximal promoter regions (Figure 6E). After 1,25(OH)2D treatment, there was decreased enrichment of the VDR and RNAPolII in the proximal promoter region of SNAI2 compared to the intergenic control (IGX1A). After 1,25(OH)2D treatment, SOD2 transcriptional activity increased, although this was not VDR-dependent. Given the likelihood that VDR regulates SNAI2 transcriptional activity directly, the Cistrome DB toolset was used to identify additional VDR : SNAI2 chromatin interactions (90). Three GEO datasets were identified when the 1KB domain of the SNAI2 TSS was investigated for potential VDR binding in lymphocytes, hepatocytes, and prostate cancer cells (Figure 6F). The identification of putative SNAI2 binding sites in keratinocytes, which are highly migratory cells of the body (Figure 6F) (67), also suggests the possibility of intracrine feedback effects that maintain high SNAI2 levels in LM7 cells. Overall, LM7 cells are more resistant to 1,25(OH)2D than MG63 cells, which may be a direct result of CYP24A1 catabolic effects on ligand and decrease VDR responses at the SNAI2 locus.
H3K27 is differentially acetylated at the SNAI2 and VDR loci in highly metastatic and low metastatic osteosarcomas
To gain a better understanding of SNAI2 and VDR regulation in osteosarcomas, we evaluated H3K27ac and H3K4me1 epigenetic alterations in a panel of highly metastatic and low metastatic human OS cell lines (GSE74230) (64). Compared to low metastatic cell lines MG63, HOS, and Hu09, the highly metastatic OS cell lines LM7, MNNG, and M112 had higher average H3K27ac peak values at the SNAI2 TSS (Figures 7A, C), which corresponded to the degree of DNase hypersensitivity (lower tracks). Intriguingly, there were no differences in SNAI2 H3K27ac peak values when comparing two OS patient primary bone and metastasized lung tumor samples (Figures 7B, C), possibly due to reduced migration in the lung tumor microenvironments compared to in vitro conditions of cell lines. In contrast, the low metastatic cell lines revealed greater H3K27ac peaks at the VDR TSS than the highly metastatic cell lines (Figure 7D). Similarly, there were no differences in H3K27ac and H3K4me1 epigenetic modifications at the VDR TSS and distal 5kb regions between OS patient primary bone or lung tumors (Figure 7E). These findings show that metastasizing OS cells exhibit increased SNAI2 H3K27ac, but low metastatic lines exhibit increased VDR H3K27ac, potentially making them more responsive to 1,25(OH)2D, a pattern that was abolished in metastasized patient lung tumor samples.
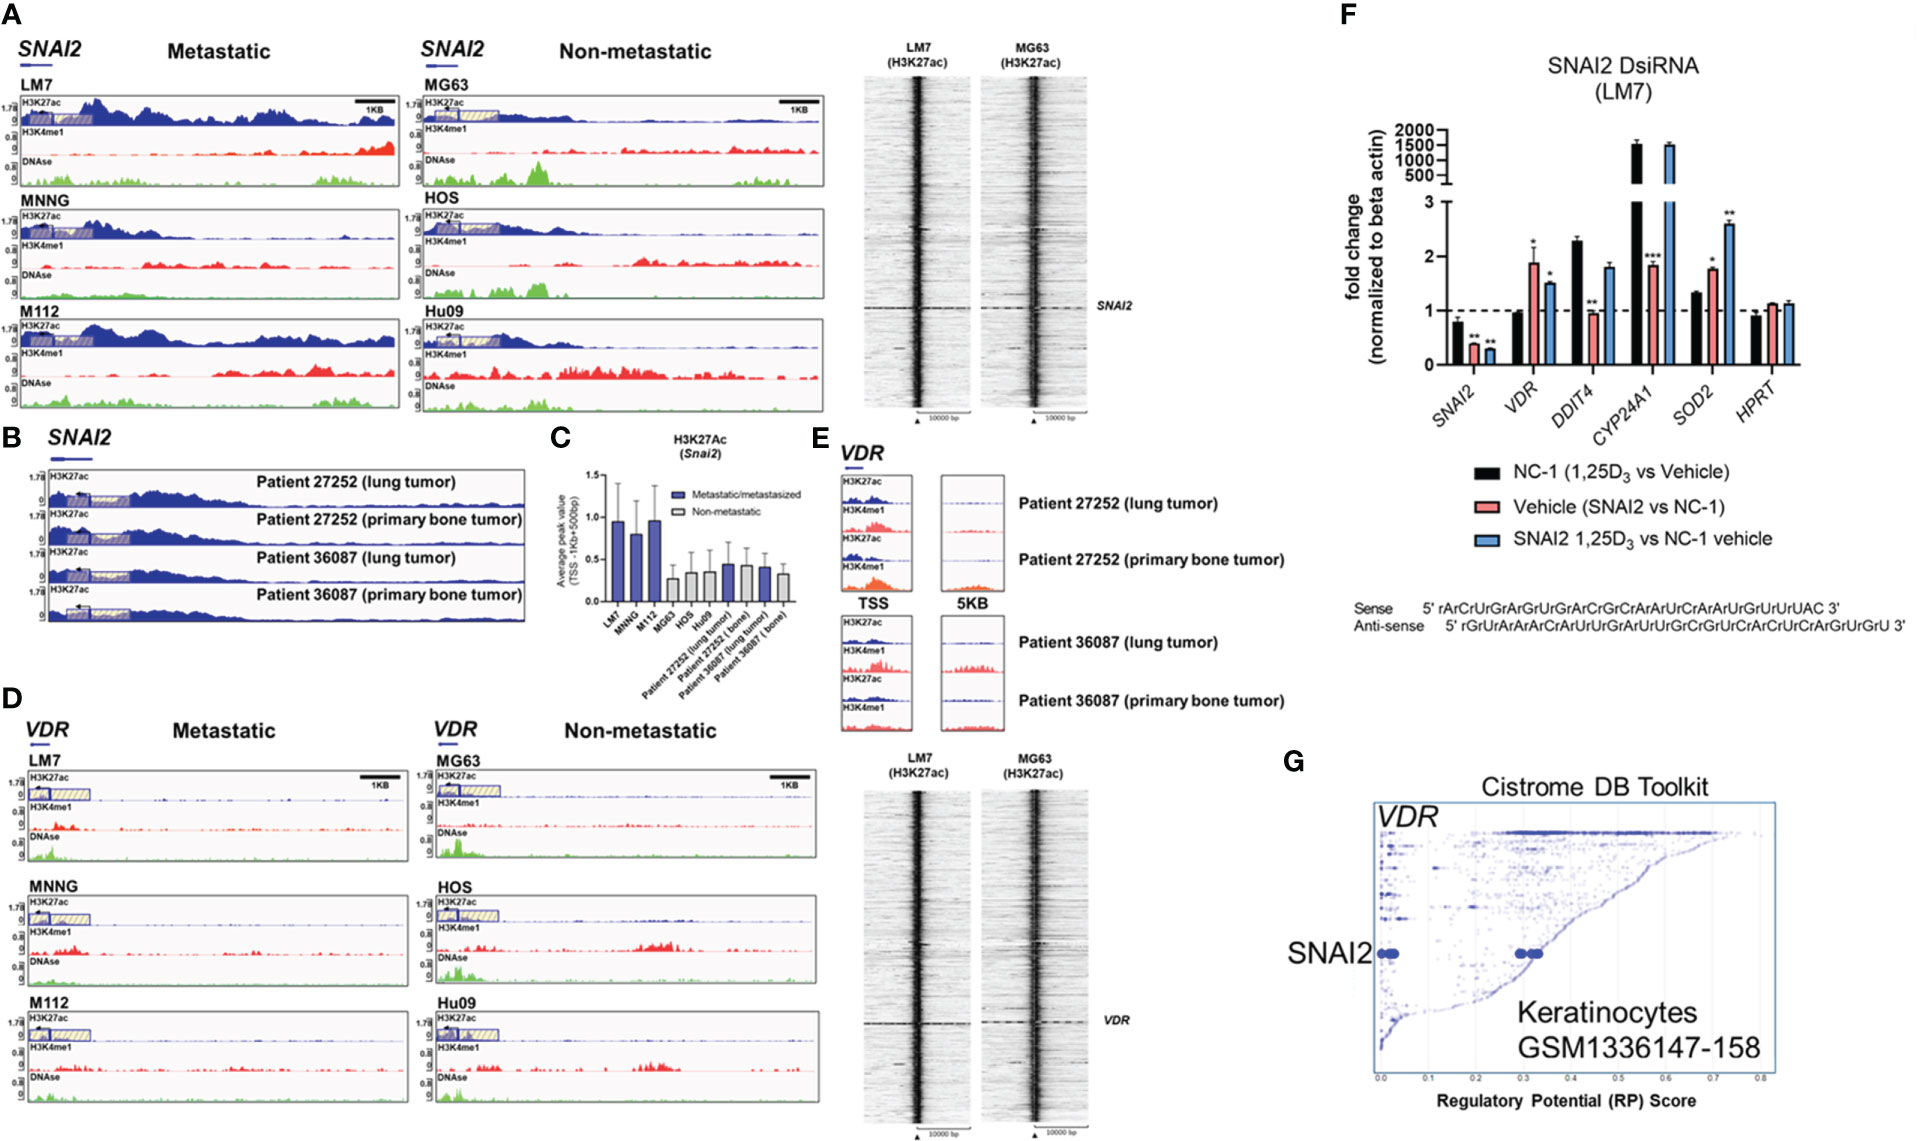
Figure 7 Differential H3K27 acetylation at the SNAI2 and VDR loci between OS subtypes and mediation of antioxidative pathways by vitamin D and SNAI2. (A) ChIP-seq studies and peak calling for the SNAI2 gene in metastatic and non-metastatic OS lines from GSE74230. Evaluation of H3K27ac, H3K4me1, and DNase I hypersensitive sites 500bp downstream and 1000bp upstream of the transcription start site (TSS). Quantification of peak values in (H) Right: Using EaSeq, a heat map of H3K27ac was created at the TSS. Using IGV’s auto-scale of BED files, all scales reflect the minimum and maximum reads in that window. (B) ChIP-seq study of H3K27ac changes at the SNAI2 gene in primary bone and lung tumor tissues from OS patients. Samples generated from GSE74230. (C) Quantification of the average peak values of OS cell lines that are poorly metastatic, metastatic, and patient samples. (D) ChIP-seq studies and peak calling for the VDR gene in metastatic and non-metastatic OS lines from GSE74230. Evaluation of H3K27ac, H3K4me1, and DNase I hypersensitive sites 500bp downstream and 1000bp upstream of the transcription start site (TSS). Using IGV’s auto-scale of BED files, all scales reflect the minimum and maximum reads in that window. Using EaSeq, a heat map of H3K27ac was created at the TSS. (E) ChIP-seq study of H3K27ac changes at the VDR gene in primary bone and lung tumor tissues from OS patients. Derived samples from GSE74230. (F) Gene responses to DsiRNA-mediated SNAI2 knockdown in LM7 cells. The sense and antisense DsiRNA SNAI2 sequences are displayed below. Tukey’s multiple comparison test for two-way ANOVA; p ≤ *0.05, **0.01, ***0.001 (n=4). (G) Cistrome DB Toolkit study of VDR-regulating transcription factors such as SNAI2. The static plot with RP scores on the X- and Y-axes depicts transcription factors, whereas the blue dots represent individual public ChIP-seq data sets. Listed next to each transcription factor are the public GEO data series.
DsiRNA knockdown of SNAI2 reveals antioxidative responses mediated by vitamin D3
To better comprehend the plausibility of VDR-SNAI2 reciprocal regulation, we utilized DsiRNA to KD SNAI2 in LM7 cells (Figures S8, S9). In order to explore the transcriptional consequences of DsiRNA KD of SNAI2 in LM7 cells, a comparative qPCR analysis was conducted. Negative control (NC-1) DsiRNA treated samples exhibited the predicted responses to 1,25(OH)2D, notably the downregulation of SNAI2 and the overexpression of DDIT4 (a potent VDR-dependent inhibitor of mTOR (51)), CYP24A1, and SOD2 (Figure 7F, black bars). Comparing vehicle treatment across SNAI2 and NC-1 DsiRNA KD samples, the expected >60% KD of SNAI2 and an intriguing elevation of VDR, CYP24A1 and SOD2 were detected, indicating direct dependence and negative regulation by SNAI2 (Figure 7F, red bar). To provide additional evidence of potential SNAI2 interactions at the VDR promoter site, we re-evaluated the Cistrome DB Toolkit and identified the datasets GSM1336147-158, which illustrate putative interactions in highly motile skin keratinocytes (Figure 7G) (91). In contrast, SNAI2 DsiRNA KD had no effect on DDIT4, suggesting SNAI2-independent signaling. The effect of SNAI2 DsiRNA KD on 1,25(OH)2D responses revealed further SNAI2 downregulation, providing additional evidence that SNAI2 is VDR-dependent (Figure 7F, blue bar). Due to an absence of autocrine VDR signaling, there was no significant difference in VDR expression between vehicle (Figure 7F, pink bar) and 1,25(OH)2D SNAI2 DsiRNA KD (Figure 7F, blue bar) responses. After 1,25(OH)2D treatment, both DDIT4 and CYP24A1 levels returned to NC-1 levels when SNAI2 was inhibited, demonstrating once again that DDIT4 is independent of SNAI2, but CYP24A1 was found to be co-dependent on VDR and SNAI2. Intriguingly, given the maximal effect of most genes following SNAI2 DsiRNA KD and 1,25(OH)2D treatment relative to the control, SOD2 levels continued to increase (Figure 7F, blue bar), indicating a repressive effect of SNAI2 on VDR expression. Overall, SNAI2 can modulate 1,25(OH)2D responses, thereby linking EMT, ROS, and vitamin D3 signaling into a novel OS network (92, 93).
Vitamin D3 modulates SOD2 intracellular localization to inhibit osteosarcoma mitochondrial oxidative stress
Given that ROS regulates cell migration and vitamin D3 induces SOD2 expression (67), the epigenomic regulation of SOD2 in OS cell lines was evaluated. At rest, LM7 cells displayed increased H3K27 acetylation at the SOD2 TSS compared to MG63 cells, with augmentation of intronic and intergenic H3K4me1 modification (Figure 8A), indicating a pronounced antioxidative response mediated by active enhancer elements. ATACseq analysis indicated similar degree of chromatin accessibility at the SOD2 TSS in MG63 cells treated with 1,25(OH)2D or vehicle (Figure 8B), suggesting that SOD2 mRNA levels are likely regulated by post-transcriptional mechanisms (48). In addition, we analyzed SOD2 protein and observed that it was mainly located in the nucleus of MG63 cells under basal conditions and was seldom associated with VDAC1-positive mitochondria (Figure 8C). In contrast, 1,25(OH)2D directed the mitochondrial localization of SOD2, possibly allowing it to perform its primary ROS detoxifying functions (Figures 8C, D). Because of these OS subtype differences, we investigated ROS responses to 1,25(OH)2D treatment. Pentafluorobenzenesulfonyl fluorescein, a hydrogen peroxide (H2O2) reporter dye, revealed that 10nM 1,25(OH)2D for 24 hours promoted efficient scavenging of H2O2 in MG63 cells (Figures 8E, F) (67). Interestingly, in agreement with the epigenetics of SOD2, LM7 metastatic cells had an 18-fold increase in H2O2 compared to MG63 cells (Figure 8G), whereas 1,25(OH)2D was also able to suppress H2O2 levels, implying that anti-oxidative pathways regulated by vitamin D3 are shared in both OS subtypes (Figure 8H).
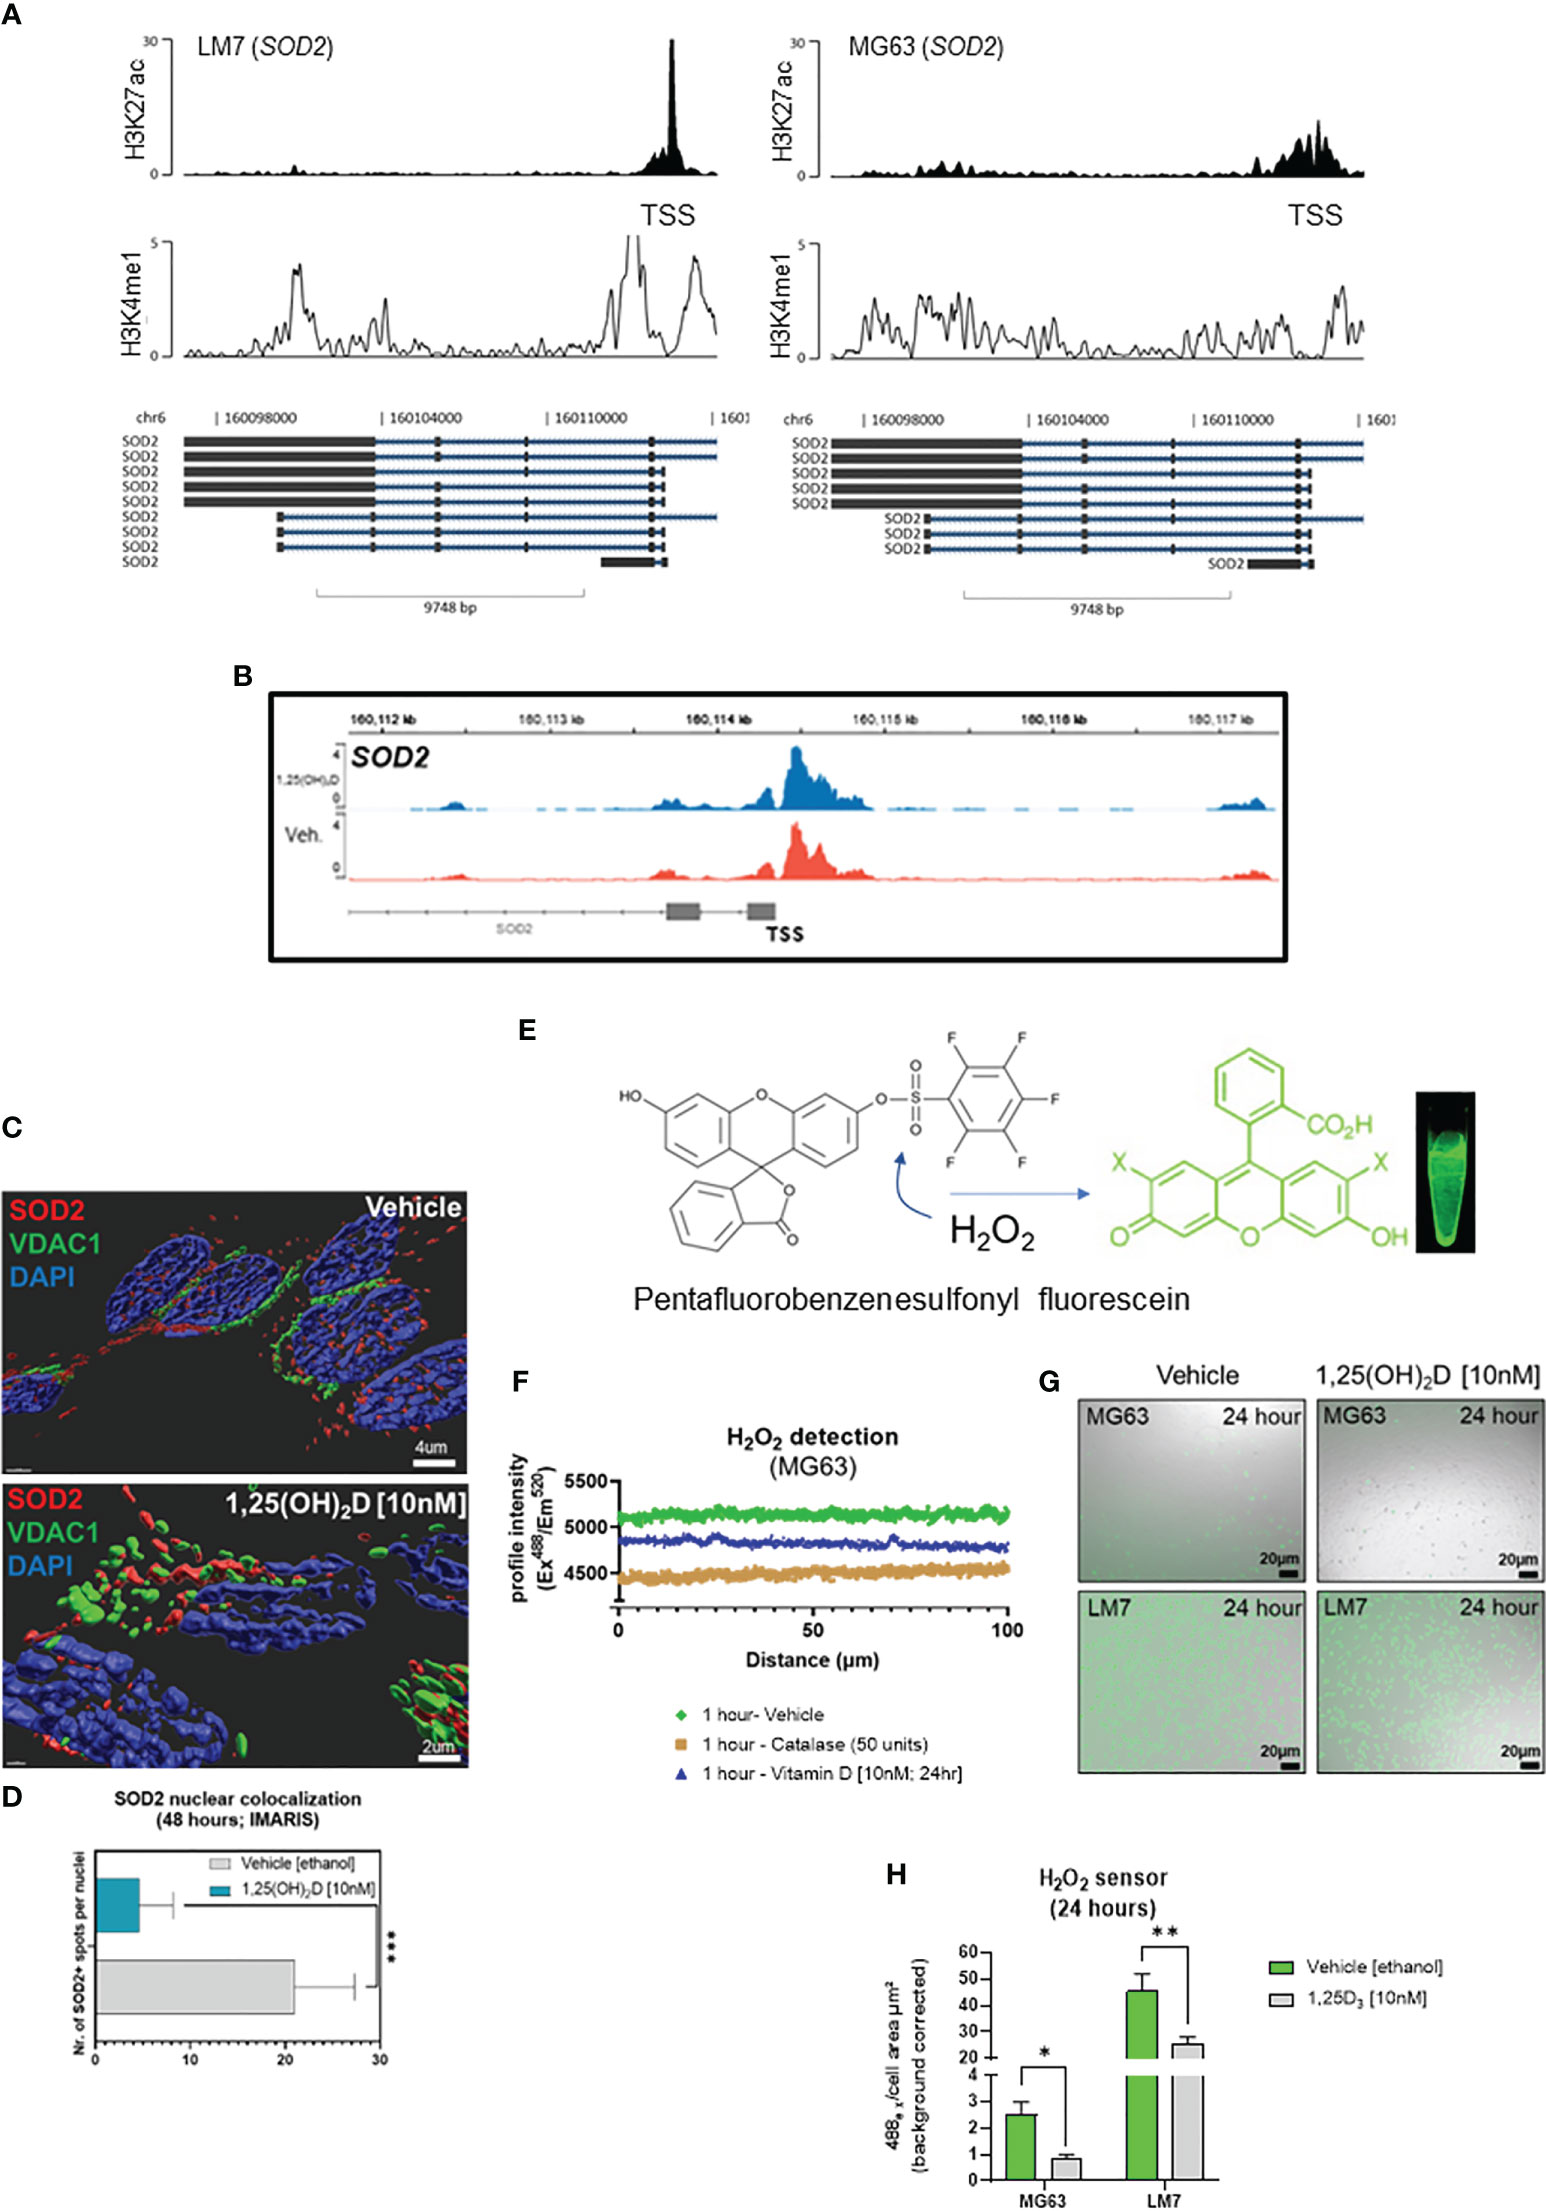
Figure 8 Vitamin D modulates nuclear-localized SOD2-to-SOX2 axis to antagonizes osteosarcoma oxidative stress, iron transport and pluripotency to dictate migratory status. (A) ChIP-seq study of the SOD2 region in LM7 and MG63 cells. (B) ATAC-seq study of MG63 cells at the SOD2 gene in the presence or absence of 1,25(OH)2D (10nM, 24 hours). (C) Confocal imaging of MG63 OS cells with SOD2 and mitochondrial VCAC1. Imaris surfaces for rendering 3D surfaces. (D) Quantitative analysis of nuclear SOD2. Student T test; p ≤ ***0.001 (n=5). (E) Schematic of the sensor pentafluorobenzenesulfonyl fluorescein for hydrogen peroxide (CAS 728912-45-6). (F) Intensity of the pentafluorobenzenesulfonyl fluorescein confocal profile over MG63 cells. Vehicle, catalase (to breakdown hydrogen peroxide), and 1,25(OH)2D were used to treat cells. (G) Representative confocal images demonstrating the formation of hydrogen peroxide by MG63 and LM7 cells under various circumstances. (H) Quantification of the presence of hydrogen peroxide in MG63 and LM7 cells. Tukey’s multiple comparison test, two-way ANOVA; p ≤ *0.05, **0.01 (n=4).
Vitamin D suppresses free radical generation and desmoplasia in low metastatic osteosarcoma and promotes MET of highly metastatic osteosarcoma in soft agar spheroids
Next, we used soft agar spheroids to determine if the antioxidative responses of 1,25(OH)2D are retained in the 3D environment. MG63 cells grew as round, well-circumscribed spheroids in soft agar for up to 14 days in culture (Figure 9A). When spheroids were treated with 10-50nM 1,25(OH)2D, there was a significant dose-dependent shrinkage (Figure 9B). Vehicle-treated MG63 spheroids exhibited a necrotic core (i.e. Zombie Aqua-positive), commonly seen in intact tumors, and surrounding cells with high 4-hydroxynonenal (4-HNE) expression, a marker for lipid peroxidation and free radicals (Figure 9C, bottom orthogonal views). In contrast, 1,25(OH)2D reduced the expression of 4-HNE in spheroids as well as cells expressing Zombie Aqua, indicating the presence of viable cells (Figure 9D). Given that vitamin D3 can elicit anti-fibrotic responses and that cancer is a fibrotic disease known to obstruct, in part, immune cell infiltration (12, 94), we examined collagen protein and mRNA expression in MG63 spheroids and cells. There are 28 types of human collagens encoded by 43 genes, and 22 collagen genes were expressed in MG63 cells. 1,25(OH)2D inhibited the transcription of half of the collagen types detected (11 out of 22), and suppressed mature type 1 collagen within spheroids (Figures 9E, F). Unlike MG63 cells, LM7 metastatic cells grown in soft agar did not form spheroids but instead remained as single viable cells with minimal growth after 14 days (Figure 9G). In contrast to MG63 cells, 1,25(OH)2D promoted the clustering of Zombie Aqua-negative LM7 cells in soft agar, implying the induction of mesenchyme-to-epithelial transition (MET) as a means of inhibiting metastasis (Figure 9H). Overall, the findings indicate that vitamin D3 inhibits free radical and collagen production in a cell intrinsic manner, and initiates cell-cell adhesion in a highly metastatic OS model.
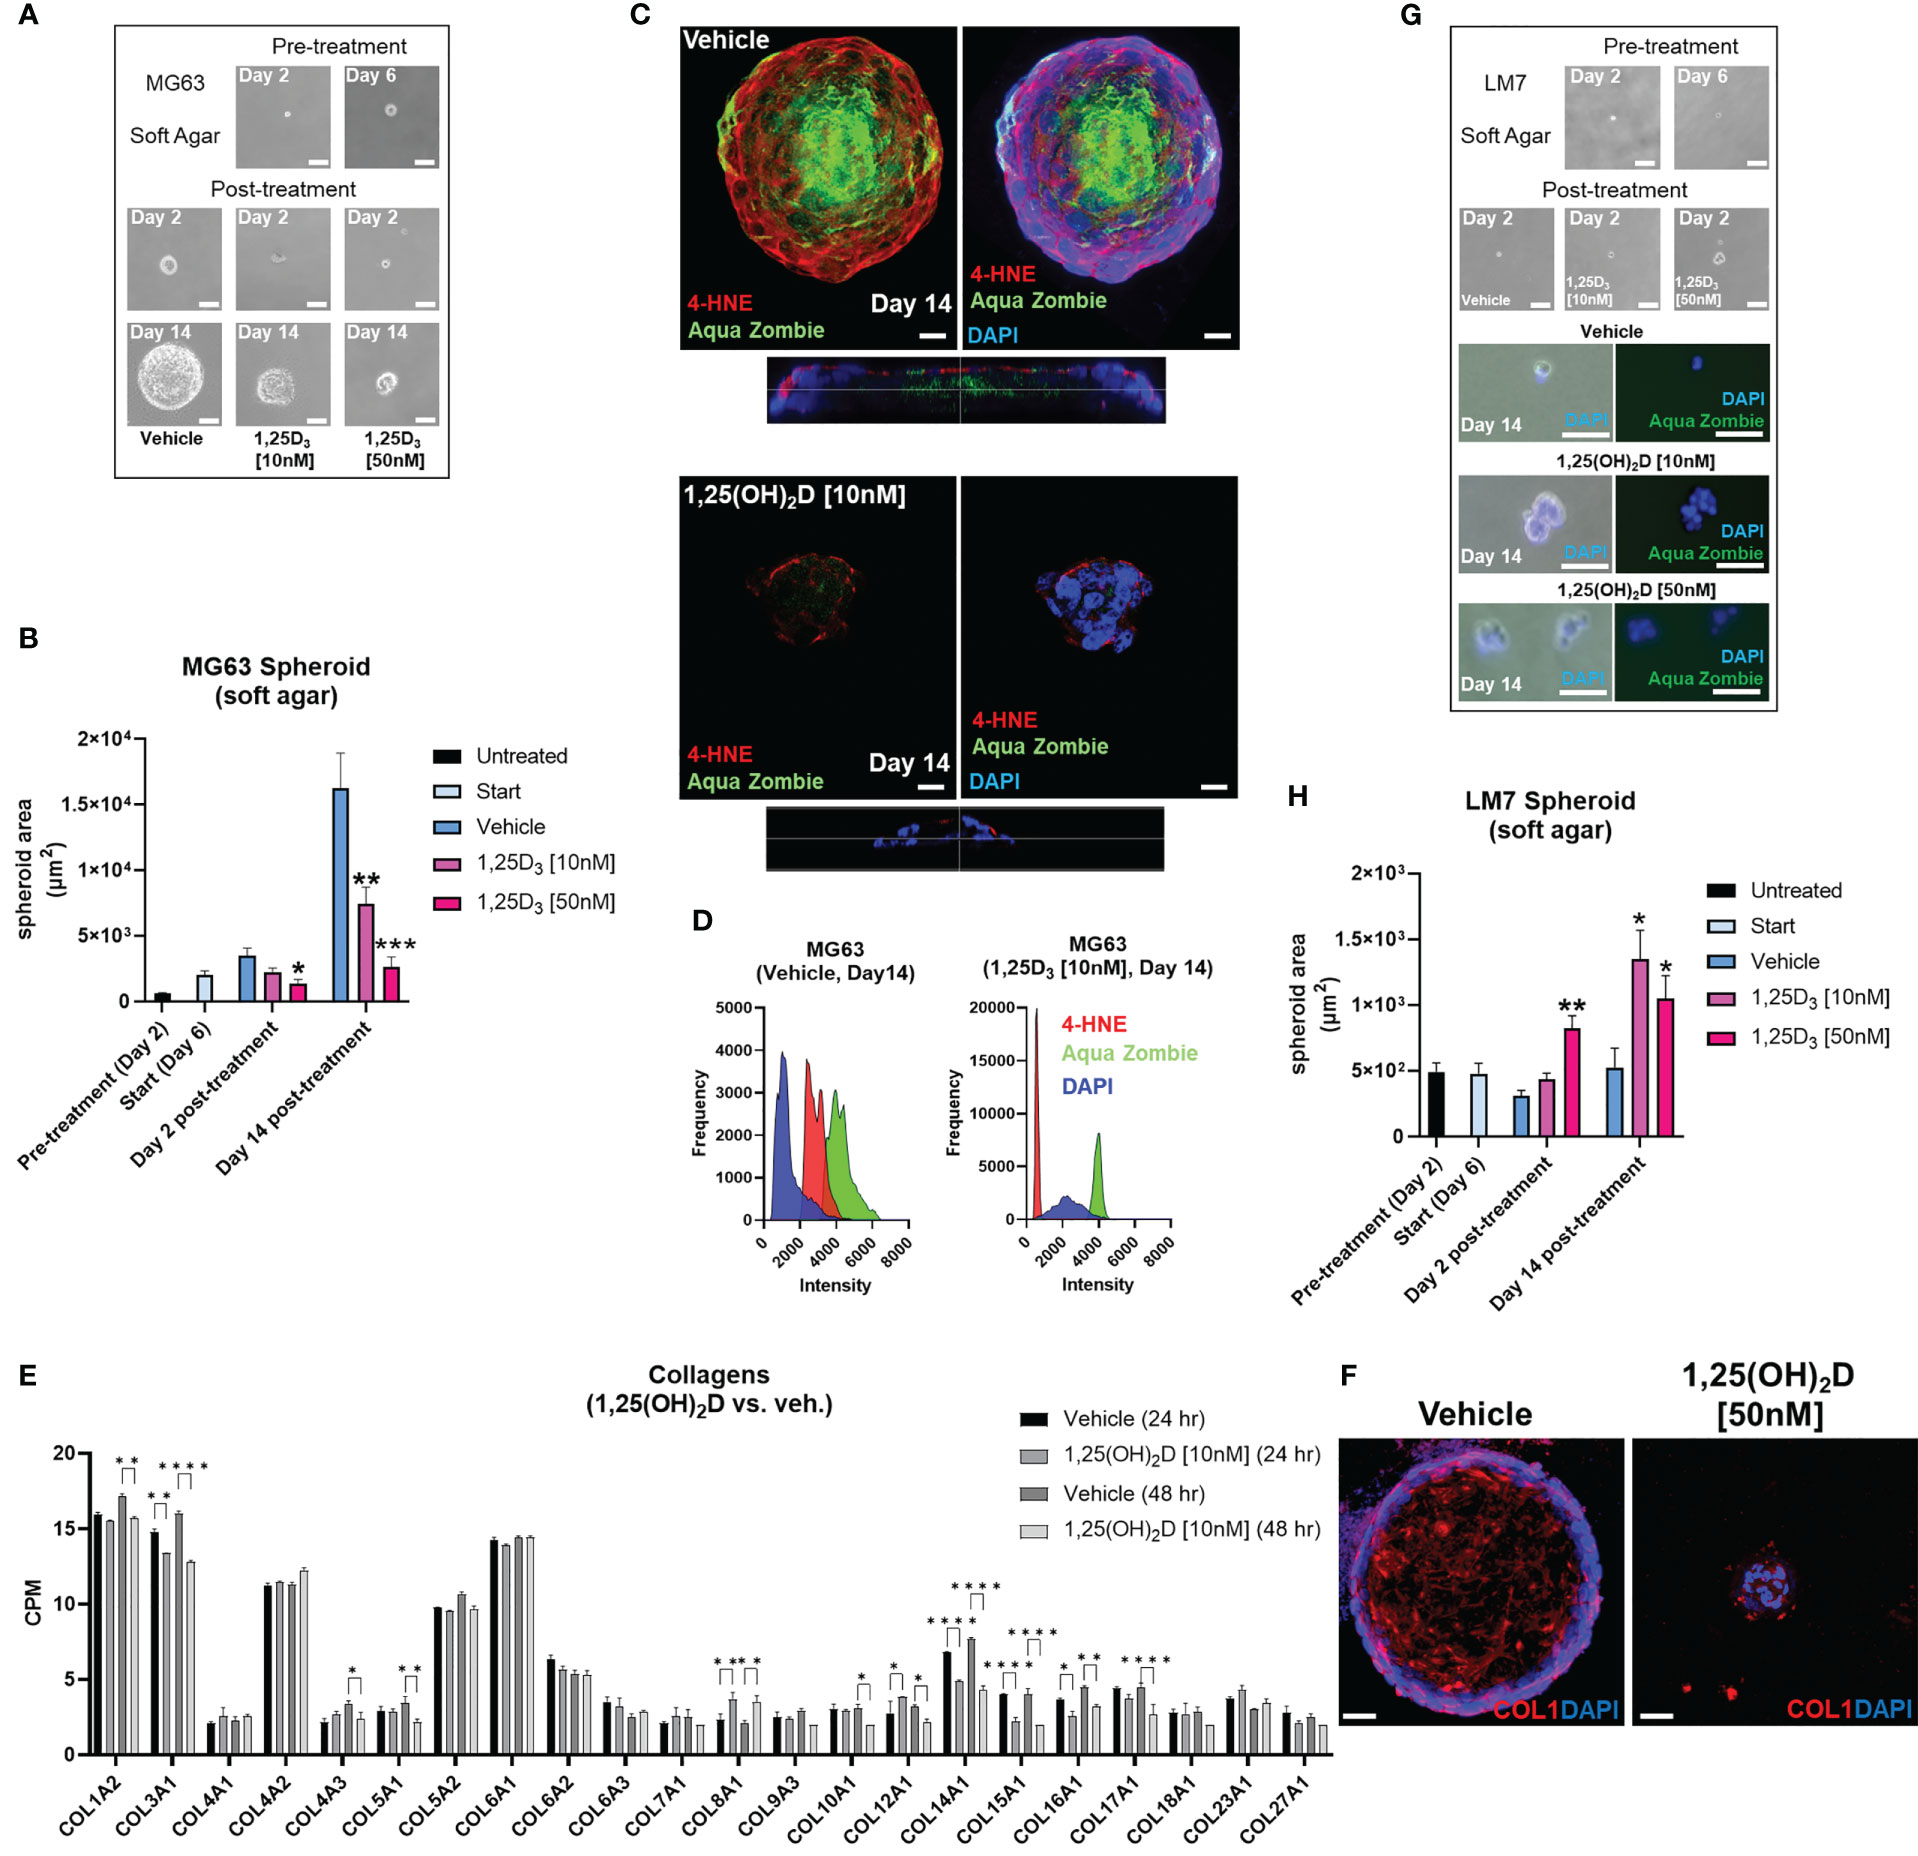
Figure 9 Vitamin D reduces free radical production, desmoplasia, and lipid peroxidation in non-metastatic osteosarcoma spheroids, while promoting MET in metastatic osteosarcoma spheroids in soft agar. (A) MG63 cell spheroid assay with soft agar. Bar = 100µm. (B) Measurement of (A) Tukey’s multiple comparison test for two-way ANOVA; p ≤ *0.05, **0.01, ***0.001 (n=4). (C) Confocal imaging of MG63 spheroids with the lipid peroxidation indicator 4-HNE and the dead cell dye Zombie Aqua. Orthogonal perspective on the base of each composite. Bar = 20µm (D) Quantification of C by evaluating the frequency and intensity of every marker. (E) RNA-seq study of collagen expression before and after 1,25(OH)2D treatment in MG63 cells. Tukey’s multiple comparison test; p ≤ *0.05, **0.01, ****0.0001 (n=2). (F) Type 1 collagen protein expression in MG63 spheroids. Bar = 40µm (G) Spheroid assay with soft agar for LM7 cells. 2-day bar = 100µm; 14-day bar = 20µm (H) Measurement of (F) Tukey’s multiple comparison test, two-way ANOVA; p ≤ *0.05, **0.01 (n=4).
Calcipotriol, a clinically relevant vitamin D3 analogue, inhibits osteosarcoma migration, desmoplasia and growth
Because of its lower calcemic activity in regulating calcium metabolism for clinical application, we investigated the effects of calcipotriol, a synthetic analogue of vitamin D3 (Figure 10A) (58). The effects on cell proliferation were first assessed using the MTT assay, which revealed that calcipotriol inhibited MG63 cell proliferation starting at 1nM lasting 48 hours (Figure 10B). On the other hand, calcipotriol had no effect on LM7 proliferation during the treatment period. Instead, calcipotriol significantly inhibited LM7 migration compared to 1,25(OH)2D treatment (i.e., a ~50 vs 26% suppression; Figures 10C, 2E). Moreover, when compared to 1,25(OH)2D, calcipotriol significantly inhibited the growth of MG63 spheroids in soft agar (Figure 10D), with concomitant suppression of desmoplasia through decreased type 1 and 3 collagen production (Figure 10E). Interestingly, 1,25(OH)2D and calcipotriol both inhibited the laminar deposition of both types of fibrillar collagens, removing the outer surface of collagen “tracks” known to aid in EMT, metastasis, and the blocking of immune cells (Figure 10E, arrows) (95). The magnitude of calcipotriol effects on MG63 was not as pronounced as for 1,25(OH)2D, according to qPCR analysis (Figure 10F, upper). For example, after 48 hours, the SOD2 level induced by 1,25(OH)2D was close to 8-fold in MG63 cells (Figure 6B), but never exceeded 1.8-fold after calcipotriol treatment. Furthermore, calcipotriol treatment had no effect on SNAI2 in the study’s concentration range or duration when compared to 1,25(OH)2D treatment of MG63 cells (Figure 1B), reflecting its function as an unique VDR agonist. In contrast, qPCR analysis of LM7 cells revealed that the transcriptional readout was significantly enhanced after calcipotriol treatment compared to 1,25(OH)2D-treated cells (Figure 10F, lower). Calcipotriol, for example, reduced SNAI2 expression by half, a significant reduction compared to 1,25(OH)2D responses (Figure 6A). Similarly, calcipotriol stimulated a large transcriptional increase of GILZ 24 hours after treatment, indicating that the NMD pathway may have dynamic and rapid effects on aberrant gene expression. Overall, these findings show that calcipotriol can enhance the EMT and growth suppression of OS subtypes.
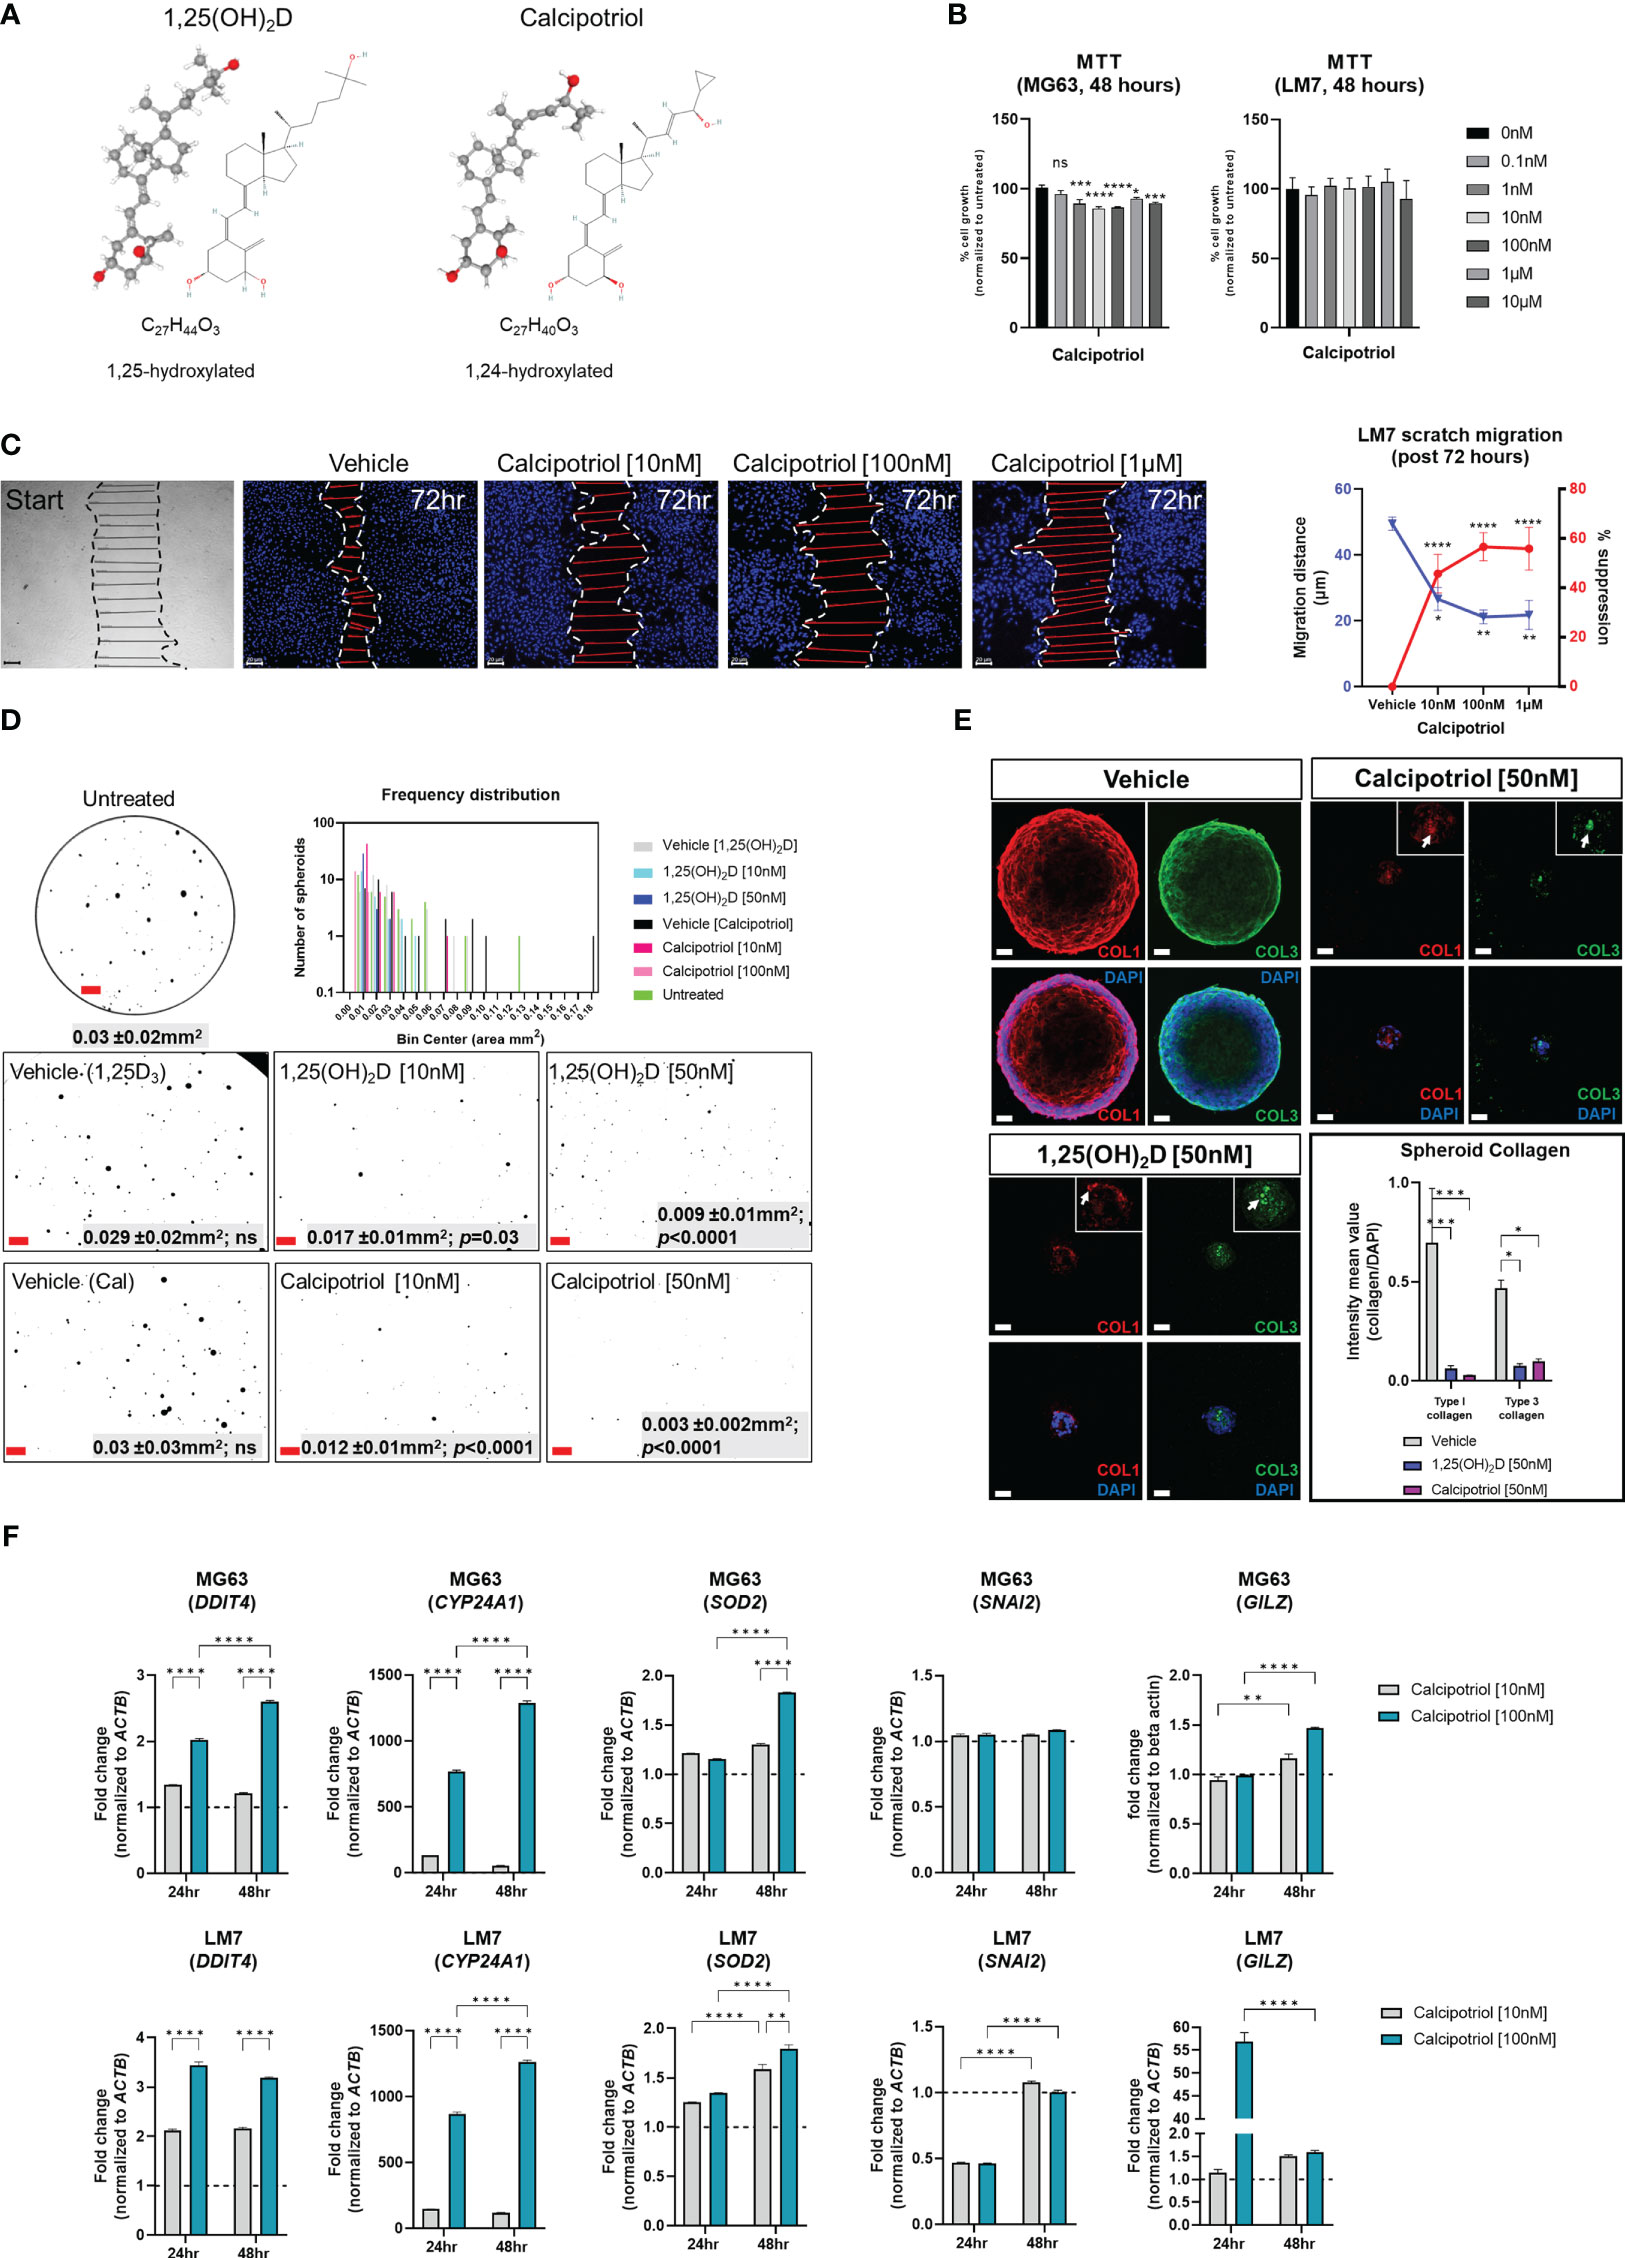
Figure 10 Effects of vitamin D3 synthetic analogue calcipotriol on MG63 and LM7 cells. (A) The structural formula of calcipotriol, a synthetic vitamin D3 analogue and VDR agonist. (B) MTT (3-[4,5-dimethylthiazol-2-yl]-2,5 diphenyl tetrazolium bromide) assay to measure cell proliferation 48 hours post-treatment. One-way ANOVA combined with Dunnett’s multiple comparison analysis; p ≤ *0.05, ***0.001, ****0.0001 (n=2). Bar = 20µm (C) Scratch migration assay employing LM7 cells treated with calcipotriol. For each condition, the distance of the scratch was measured across the scratch. Tukey’s multiple comparison test for two-way ANOVA; p ≤ *0.05, **0.01, ****0.0001 (n=4). Bar = 20µm (D) Frequency distribution of spheroids in soft agar treated with calcipotriol. Composite represent the background corrected, threshold-applied ImageJ post-processed images. One-way ANOVA; Šídák’s multiple comparisons test versus untreated (n=3). Bar = 1mm (E) 1,25(OH)2D and calcipotriol decrease collagen production and laminar deposition within MG63 spheroids. MG63 cells in soft agar for 14 days were immunostained for types 1 and 3 collagen. Arrows depict collagen aggregations in the magnified insets. Two-way ANOVA Multiple comparisons using Tukey’s test; p ≤ *0.05, ***0.001 (n=3). Bar = 40µm (F) qPCR analysis of MG63 and LM7 osteosarcomas treated with calcipotriol. Two-way ANOVA Multiple comparisons using Tukey’s test; p ≤ **0.01, ****0.0001 (n=4). LM7 xenograft metastatic model in Nu/J (nude) mice. The images are from 5-week-old Nu/J mice that had LM7 cells delivered to their right flank. After xenograft, mice were immediately given either vehicle or calcipotriol (60 μg/kg b.w.) treatment until tissue harvest. NS, not significant.
Calcipotriol inhibits the spread and tumorigenicity of LM7 osteosarcoma in vivo
Given the pronounced effects of calcipotriol on LM7 gene expression and migration, an experimental LM7 xenograft mouse model was created to evaluate the efficacy of calcipotriol against metastasis and tumorigenicity (Figure 11A). First, we ectopically engrafted LM7 cells into the right flank of athymic nude (Foxn1nu, also known as Nu/J) mice without matrigel to investigate metastatic potential of LM7 cells. Five weeks after LM7 transplantation, cancerous lesions in the lower mandibular/cervical neck region were observed in vehicle treated animals (Figure 11B, upper). In contrast, animals given calcipotriol (60 µg/kg body weight three times per week intraperitoneally) for five weeks showed no visible signs of cancerous lesions throughout their bodies (Figure 11B, lower). Nine weeks after treatment, the animals were subjected to PET imaging as well as histological and anatomical analysis. Animals on vehicle developed large hematomas around the sub-mandible region after euthanasia, indicating an excess of broken blood vessels from localized tumors (Figures 11C, E). Vehicle-treated mice developed numerous skin polyps around the sub-mandible region, while the dorsal skin displayed numerous cyst-like structures and wounds near the richly vascularized ears (Figure 11C). Tumors also formed in the periprostatic adipose (pad) tissue of vehicle-treated mice, indicating a favorable niche (Figure 11C). Histological examination of skin tissue of vehicle-treated mice confirmed scab formation and hyper dermal and epidermal responses (Figure 11D), while lung tissues exhibited nodules in the outer respiratory tracks within the interlobular septum (Figure 11E), indicating the presence more favorable niches. PET analysis confirmed calcipotriol’s anti-metastatic and anti-tumorigenic effects (Figure 11F). Vehicle-treated animals had excessive 18F-flurodeoxyglucose (18F-FDG) uptake and distribution in the sub-mandibular, brachial plexus, and urogenital regions compared to calcipotriol-treated animals, which were nearly tumor-free (Figure 11F right, Movies S1, S2). Comparisons of maximal image projections (MIPs) revealed a statistically significant decrease in tumor size and spread after calcipotriol treatment (Figure 11G). Finally, we used a CD44 human-specific antibody to track LM7 cells in order to better understand the cutaneous pathologies associated with LM7 xenografts (Figure S9). Immunofluorescence analysis revealed LM7 localization at the polyp’s periphery but not within the centroid, implying paracrine effects of exogenous LM7 cells in polyp transformation (Figure 11H upper). Furthermore, we observed both peri and intravascular localization of CD44-positive LM7 cells in vehicle-treated animals (Figure 11H lower), but not in calcipotriol-treated animals (Figure S10), indicating that endothelial transmigration was suppressed by calcipotriol. Finally, cyst formation in vehicle-treated animals appeared to be induced by paracrine effects of surrounding CD44-positive LM7 cells, as these cells were not integrated within the cysts themselves (Figure 11I). Overall, calcipotriol significantly suppressed LM7 metastasis and tumorigenicity in humanized mice.
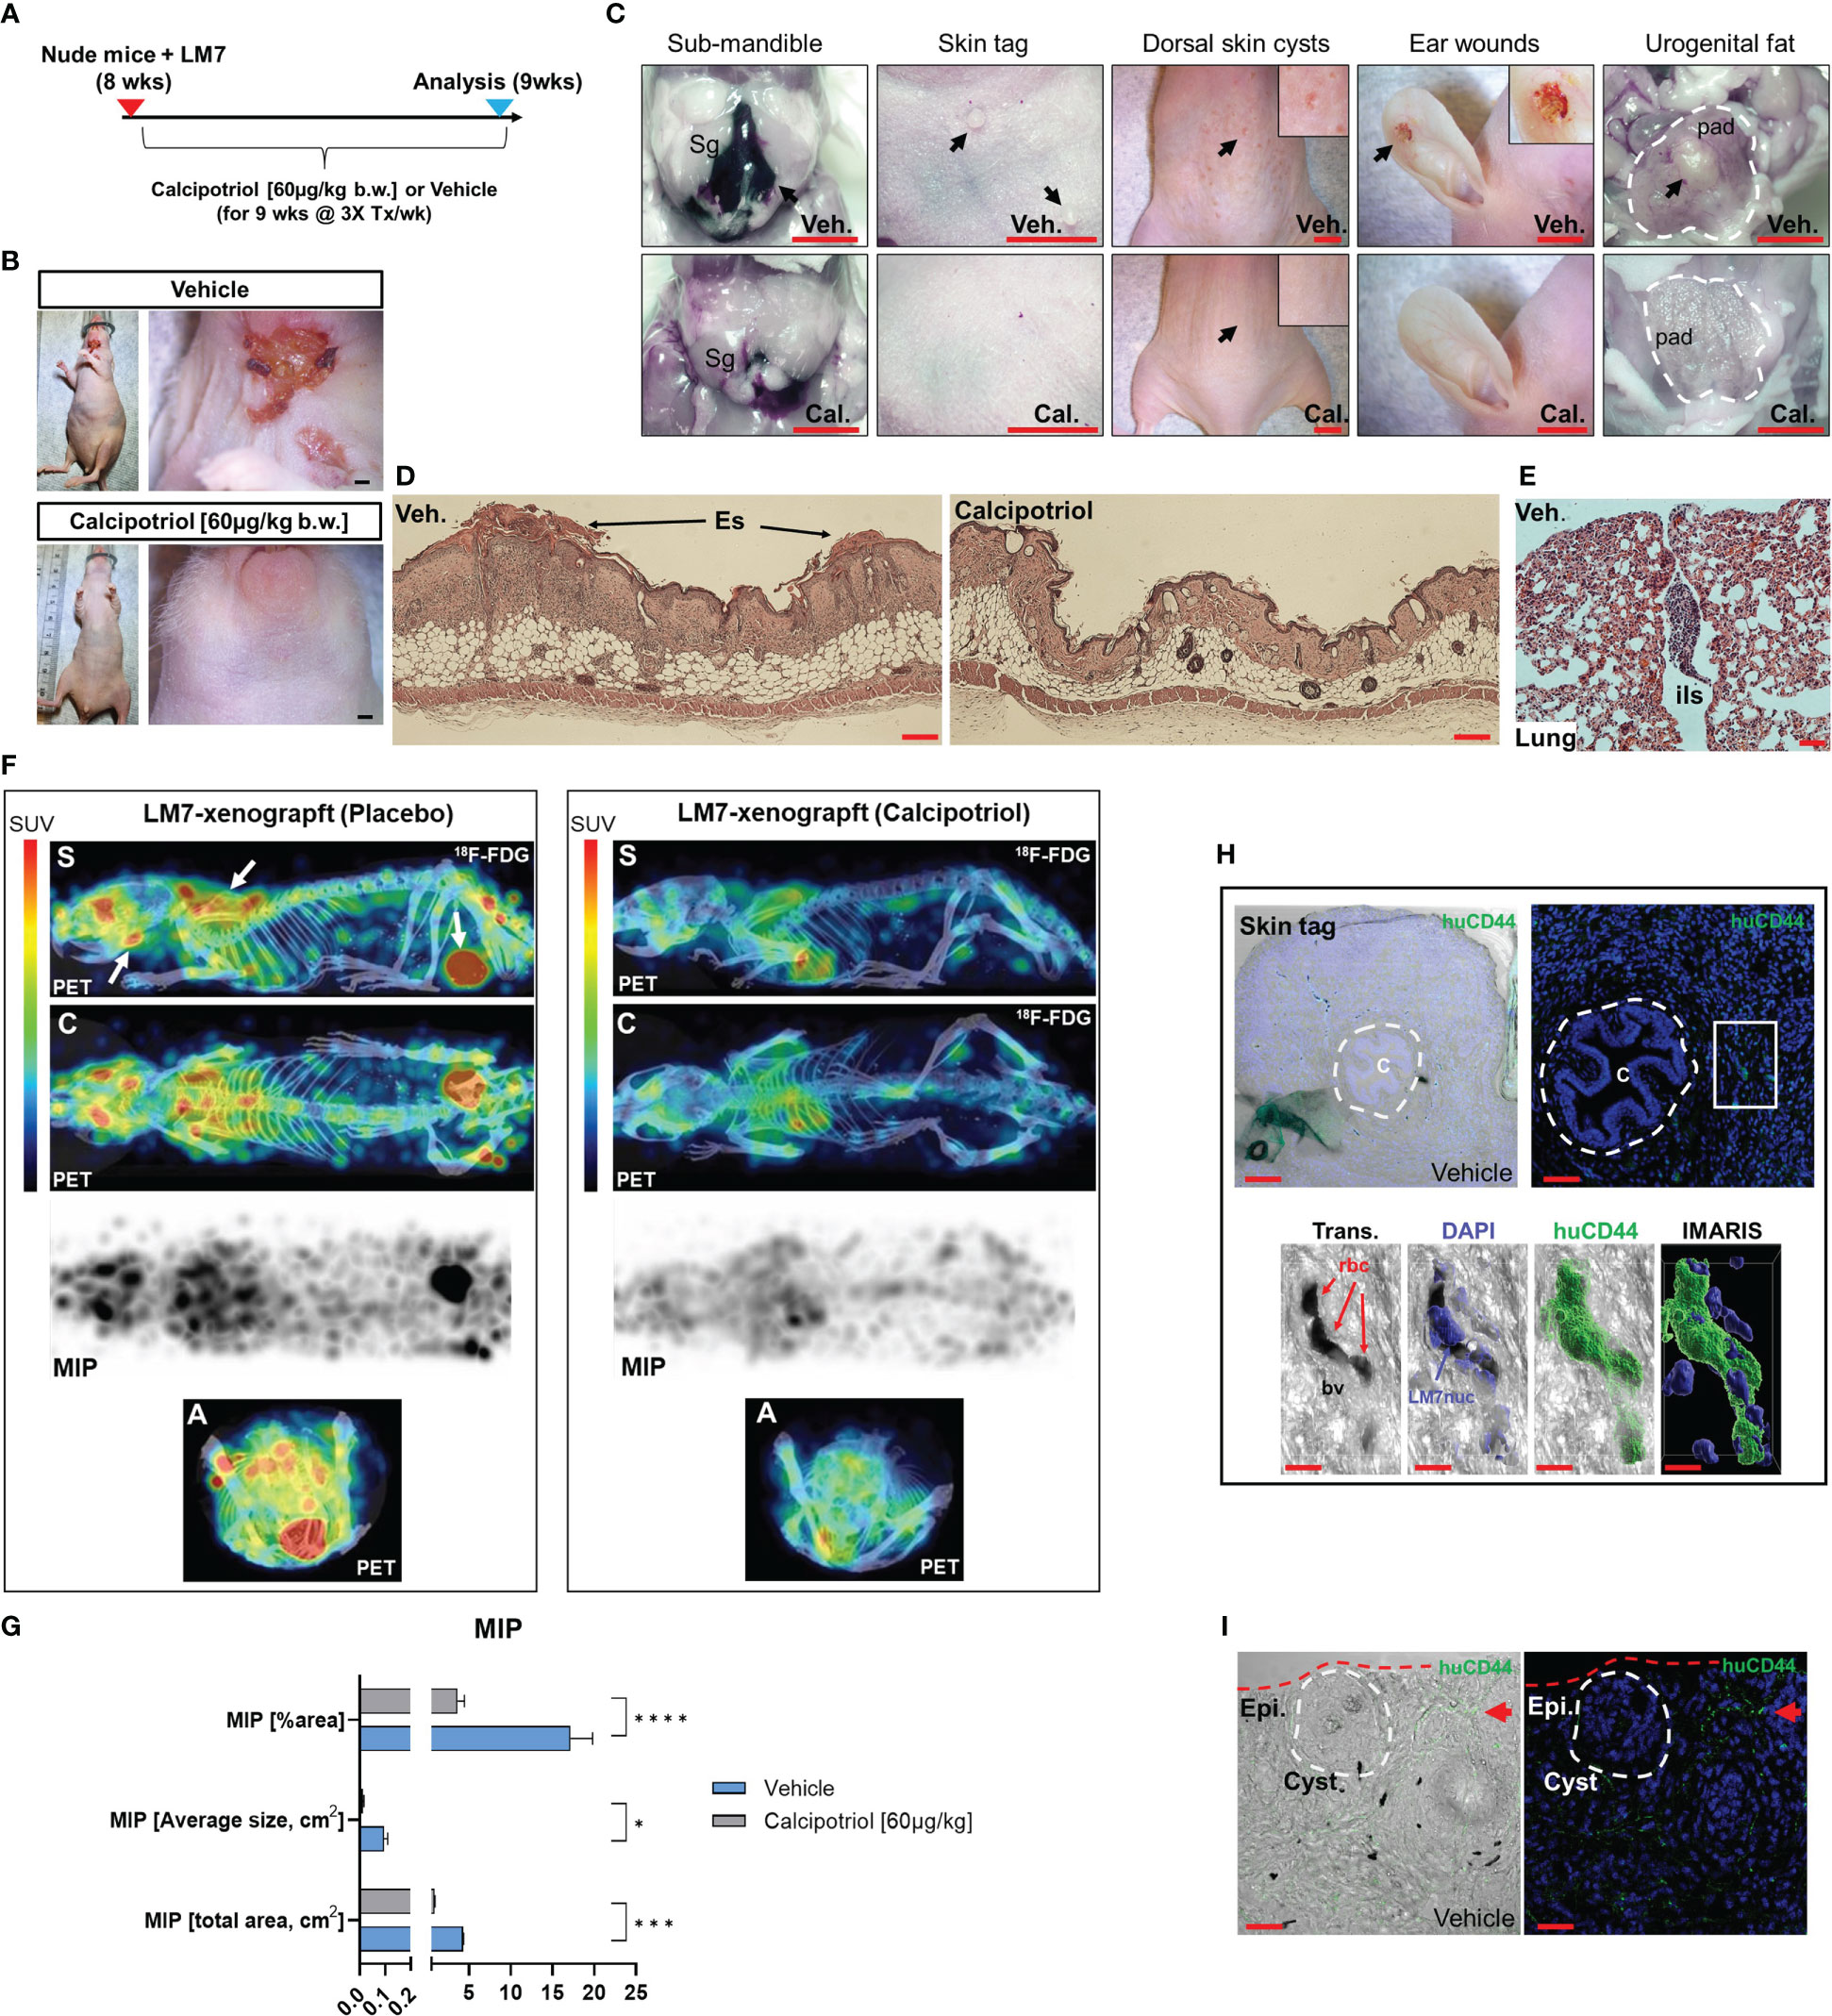
Figure 11 Calcipotriol suppresses LM7 spread and tumor growth in a xenograft mouse model. (A) Overview of LM7-bearing xenograft calcipotriol treatment strategy. (B) Sub-mandible lesions apparent by 5-weeks after LM7 transplantation only in vehicle-treated animals. Bar = 5mm. (C) Gross anatomical and necroscopic assessment of vehicle and calcipotriol-treated animals after 9 weeks of treatment. Leftmost panel: Arrow depicts large hematoma. Submandibular gland (Sg). Rightmost panel: Outlined is the periprostatic adipose (pad) tissue with an arrow depicting tumor mass. All bars = 5mm (D) Hyperdermal and -epidermal responses to LM7 cells. Hematoxylin and eosin staining of dorsal skin sections. Eschar (Es) Bar = 20µm (E) H&E staining of outer lung of vehicle-treated LM7-bearing nude animal. Interlobular septum (ils) harbors a tumor nodule. Bar = 50µm (F) PET imaging of treated LM7-bearing nude mice. Left arrows depict tumors localized to the sub-mandible, brachia plexus, and urogenital regions. Standardized tracer uptake values (SUV) are depicted in the color bar. Maximal intensity projection (MIP). Different views are represented as sagittal (S), coronal (C) and axial (A) image sections. (G) MIP statistics. Unpaired T test; p ≤ *0.05, ***0.001, ****0.0001 (n=4) (H) Immunofluorescence analysis of vehicle-treated skin tags using a human-specific CD44 antibody to detect LM7 cells. Center (C) of the skin epithelial polyp is encircled. The boxed region is highlighted below showing the localization of LM7 cells transmigrating within blood vessels (bv). Red blood cells (rbc). Bar (upper left) = 100µm, Bar (upper right) = 50µm, Bar (lower panel) = 10µm (I) Immunofluorescence analysis of vehicle-treated skin using the huCD44 antibody. The cyst is encircled and a cluster of LM7 cells (red arrow) is depicted in the periphery. Bar = 20µm.
Discussion
Despite recent advances in the field, OS remains a fatal disease. Because approximately 80% of patients are thought to have metastases at the time of initial presentation, understanding the cellular and molecular mechanisms that control OS-specific tumorigenicity and metastasis is critical for developing novel therapies (96). Several studies have linked low vitamin D3 status to an increased risk of common cancers (25, 26, 33–38). In contrast, the largest clinical trial of vitamin D3 supplementation ever conducted, and its post-hoc re-analysis, suggest that vitamin D3 benefits patients with advanced or lethal cancers associated with metastasis (25). Despite these findings, the molecular and cellular mechanisms by which vitamin D3 influences cancer outcomes remain elusive. The current study sheds light on how 1,25(OH)2D and calcipotriol can influence tumor dormancy and outgrowth by regulating OS self-renewal and metastatic initiation potential (Figure 12). In part, we show that 1,25(OH)2D inhibits OS self-renewal and EMT to block migration, while also suppressing the NMD machinery and re-expressing putative immunogenic antigens and pro-apoptotic proteins (e.g., BTN2A1, GILZ) from defined NMD-target genes. Furthermore, our findings reveal additional novel regulatory effects of 1,25(OH)2D, such as inhibition of desmoplasia and suppression of SOD2 non-canonical and neurogenic pathways, all of which have novel therapeutic implications. Depending on the metastatic state, 1,25(OH)2D also appeared to promote MET and will necessitate additional research to better understand the nature of the adhesion factors that halt OS migration in vivo.
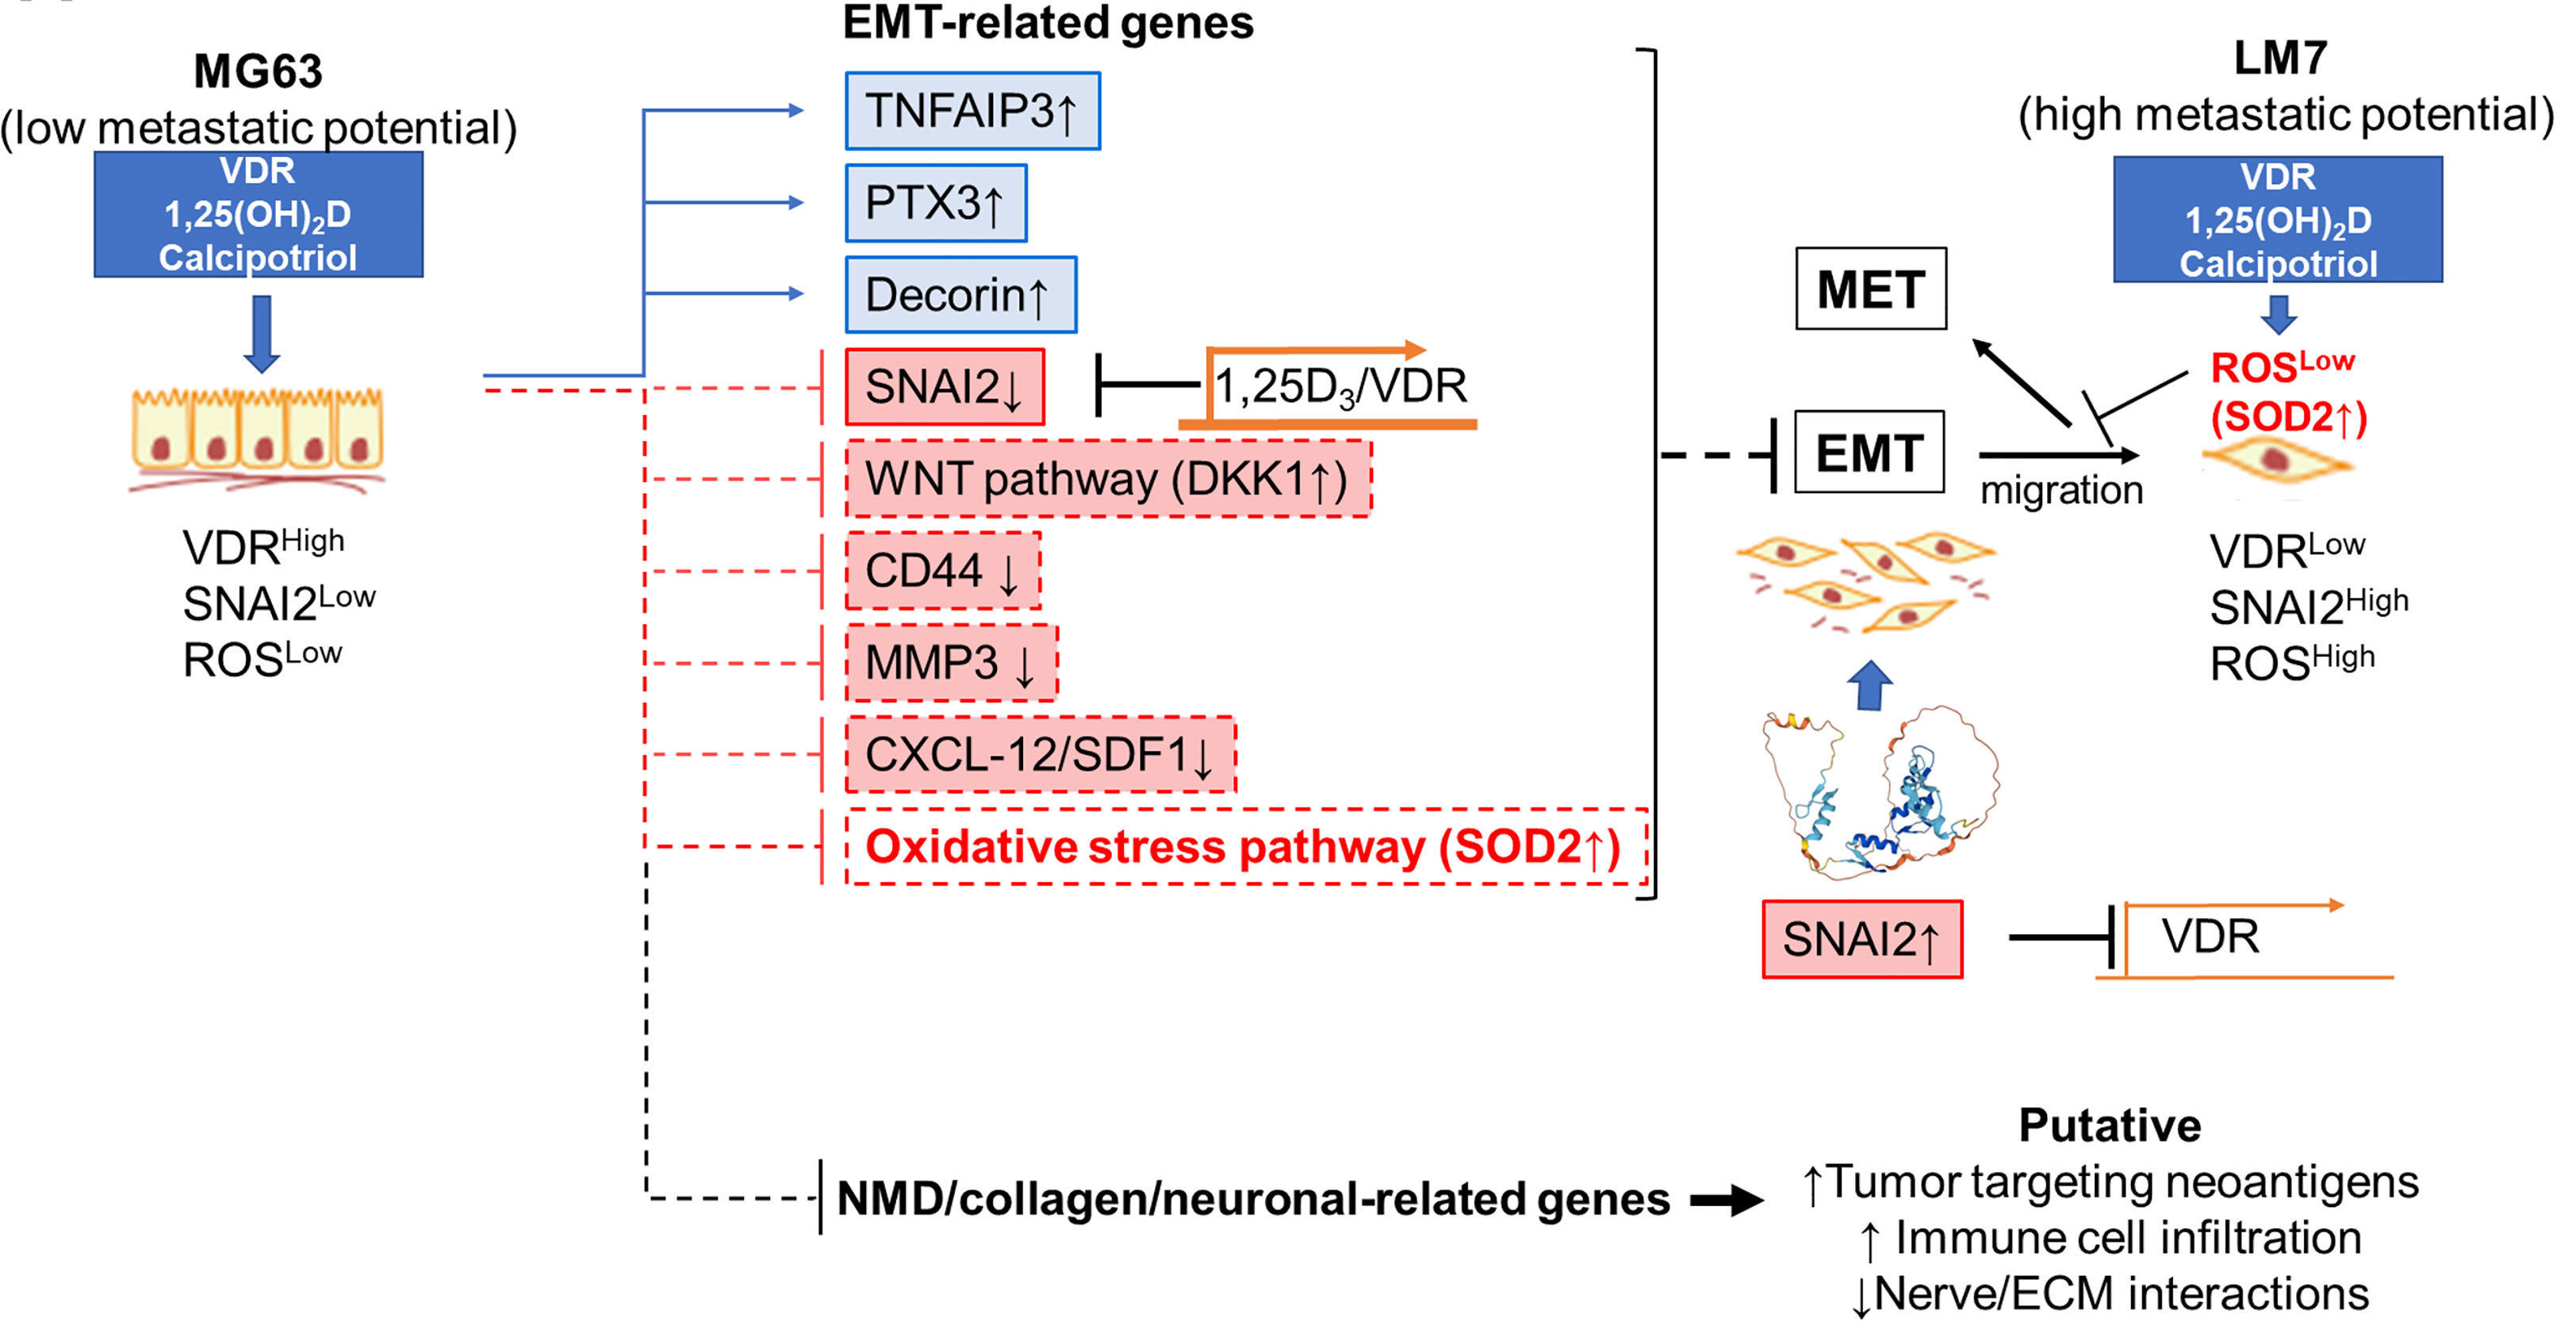
Figure 12 Novel anti-cancer properties of 1,25(OH)2D in osteosarcoma. Schematic demonstrating the likely mechanism underlying the suppression of EMT, NMD, desmoplasia, and neural connections between OS by 1,25(OH)2D. The reciprocal regulation of VDR and SNAI2 constitutes one mechanism.
Vitamin D3 regulation of osteosarcoma EMT and desmoplasia
Several studies have shown that 1,25(OH)2D regulates EMT in multiple cancers (e.g., breast and colon) (91, 97–99) and fibrosis-related tissue model systems (12). For example, 1,25(OH)2D suppressed EMT by modulating a number of genes that encode EMT transcription factors (SNAI1/2, ZEB1, TWIST1), adherens junction proteins (E/N-cadherin), focal adhesion members (paxillin, integrins), tight junction components (claudins), cytoskeletal proteins (vimentin), ECM proteins (collagens, MMPs), and polarity proteins (98). Despite these findings, the direct effects, and underlying mechanisms of 1,25(OH)2D in OS and cutaneous wound EMT have not been determined to date. Through chromatin interactions, we identified SNAI2 as a direct VDR target gene, highlighting a central EMT inductive node for regulating OS metastasis. Other EMT transducers, such as ZEB1, ZEB2, E47, or TWIST1, were not influenced by 1,25(OH)2D (91), implying disease-specific responses. Importantly, our findings have wider implications against other cancers with aberrant upstream receptor activation, as SNAI2 can work together with oncogenes such as RAS and ERBB2 to enhance tumorigenicity (100). Our SNAI2 DsiRNA KD studies indicate that it may also repress VDR expression, most notably in the highly metastatic LM7 OS cell line. This finding is consistent with previous research in colon cancer cells, which found that SNAI2 repressed VDR expression, inhibiting the induction of E-cadherin to promote metastasis (91). This newly discovered OS relationship points to decreased VDR expression in metastatic OS progression, which explains the reduced responsiveness to 1,25(OH)2D. However, an interesting finding was that the calcipotriol analogue enhanced anti-migratory effects in LM7 cells in both culture and in mice, suggesting clinical usage to overcome resistance in the future. Our analysis of the Cistrome DB Toolkit also suggests that SNAI2 may repress VDR, as observed in motile skin keratinocytes, which may be a common feature. Thus, combined approaches that target both the SNAI2 and the VDR signaling systems may be more effective in treating high grade malignant cancers and possibly skin disorders involving fibrosis such as scleroderma.
EMT entails the cellular deposition and remodeling of ECM, as well as the loss of the epithelial cell-to-basement membrane interactions, to generate a fibroblastic phenotype. Both 1,25(OH)2D and calcipotriol decreased collagen proteins and mRNA expression in OS spheroids and culture, a critical feature of EMT and tumor cell immunorecognition. These findings are consistent with recent observations in mammary epithelial cells (101), and in different intestinal fibrosis mouse models, where both vitamin D3 dietary intervention and epithelial-specific Vdr ablation promoted fibrosis and pro-fibrotic factors (12). Recent research indicates that hair follicle bulge stem cells can give rise to progenitor cells with fibroblast-like characteristics via EMT (102, 103). Our findings show that ablation of the Vdr within hair follicle bugle stem cells results in increased migration and putative fibrotic responses within thickened neo-epidermal tissue after injury. Overall, the findings of this study suggest that modulating VDR signaling during key stages of cancer and tissue injury may be important from a therapeutic perspective.
Vitamin D3 regulation of the NMD pathway
Vitamin D3 modulation of the NMD pathway has yet to be reported. We found that vitamin D3 disproportionally induced the upregulation of NMD-target genes in OS cells, with the potential to sensitize immunotherapy in patients with OS. One unanswered question is how vitamin D3 regulates NMD machinery factors. According to recent research, upstream regulators of NMD include proteins involved in the integrated stress response (ISR) and the unfolded protein response (UPR) (104). That is, in the presence of cellular stress, ISR and UPR are activated, resulting in overall suppression of protein synthesis and NMD factors. Indeed, our previous research has shown that 1,25(OH)2D treatment of MG63 induces mitohormesis, which involves UPR activation and a decrease in protein translation (105), which may be linked to NMD inhibition as part of an adaptation response to restore mRNA integrity and full-length protein in the presence of PTC. However, it is unclear how vitamin D3 can induce selective suppression of both upstream and downstream components of the NMD pathway, regardless of ISR/UPR, which may entail, direct or indirect, gene-targeting elements induced by the VDR.
Most vitamin D-related immune research focuses on how it boosts the innate immune system (40, 47, 106–108), but the biological/therapeutic effects of vitamin D’s cell-autonomous immunomodulatory responses in tumor cells are poorly understood. Recent research has demonstrated that combining vitamin D3 with immunotherapy can have sensitizing effects (109, 110). In patients who were resistant to anti-PD1 alone, vitamin D3 supplementation in conjunction with anti-PD1 sensitized oral tumors and activated T cells (111, 112). Also, Rituximab and Trastuzumab can detect surface antigens on B-cell lymphomas and breast tumor cells, but vitamin D deficient patients do not respond well to these therapies (113, 114). Although the mechanism of action is unknown, our research indicates that vitamin D3 may make tumors more immunogenic by regulating novel effector systems such as NMD to sensitize tumor cell killing (17, 84). Cancer’s NMD pathway is complex, with the ability to elicit both pro-tumor and tumor suppressor functions corresponding to the tumor’s genetic landscape and microenvironment (20). On the one hand, NMD can be advantageous for cancer cells by inhibiting the expression of antigens with immunogenic activity. In contrast, targeted suppression of NMD in cancer cells has been used in preclinical studies to promote the production of neoantigens that induce an anti-tumor immune response (21, 115, 116). Importantly, NMD is particularly pronounced in osteosarcomas, and the absence of adequate cell-to-cell adhesions (e.g., CLDN1, CLDN15) and a potent host immune response, makes vitamin D3 a likely candidate for combined immunotherapy (14–17). Future research will seek to identify and validate novel functional neoantigens that may aid in the killing of OS tumor cells in vivo. In addition, it appears that calcipotriol may function similarly to 1,25(OH)2D, yet with enhanced effects on cell migration and gene expression across multiple pathways, such as EMT and NMD, depending on the subtype of OS cells (117).
Vitamin D3 regulation of neuronal markers of osteosarcoma
Previous genome-wide association studies identified two susceptibility loci for osteosarcoma, one of which that achieved genome-wide significance was a single nucleotide intronic variant, rs1906953, at 6p21.3, in the glutamate receptor metabotropic 4 (GRM4) gene (19). Although not formally and biochemically confirmed, it is believed that rs1906953, which is located at a DNase I hypersensitive site, enhances transcription of GRM4 given that it is overexpressed in the majority of osteosarcomas (118). Furthermore, the direct role of glutamate receptors in OS was recently investigated, whereby pharmacological treatment with the Riluzole glutamate receptor antagonist inhibited cancer cell proliferation and migration (119). Despite these studies, how neurotransmitter receptors are regulated in osteosarcomas is unclear. Interestingly, an increasing body of evidence suggests that tumors, including gastrointestinal tumors, interact with neurons that innervate the tumor microenvironment, resulting in tumor progression and metastasis (120). Importantly, our epigenetic and transcriptomic analysis indicates that OS may be classified as neuroendocrine tumors or carcinoids. Along these lines, a clinicopathological correlation was established in gastric cancer patients for overall survival in prespecified subgroups based on the level of innervation, which revealed higher levels of VDR expression in aneural samples and higher VDR levels correlated with lower grade gastric cancers (121). Overall, our studies provide further evidence that impaired ionotropic glutamate receptors are part of the pathogenesis of osteosarcomas that can be regulated by vitamin D for potential clinical benefits.
Vitamin D3 modulation of intracellular iron and SOD2 functional localization in osteosarcoma
SOD2 is a mitochondrial superoxide dismutase that catalyzes the conversion of superoxide radicals () into molecular oxygen, which is a byproduct of oxygen metabolism that causes cell damage. Except for SOD2, most of the 1,25(OH)2D-modulated EMT pathway genes were not affected in highly metastatic LM7 OS cells. That is, it appears that reducing ROS is a common mechanism for facilitating 1,25(OH)2D-induced EMT suppression of migration. In advanced breast cancer cells, it also appears that ROS is able to activate SNAIL by recruiting NF-kB subunits to promoter regions to drive SNAIL expression (92), thereby extending the significance of ROS and its regulation of EMT (122). Our findings also indicate that the VDR regulates SNAIL2 expression directly, in conjunction with its effects on ROS via SOD2 upregulation, thereby providing a mechanism how SNAIL transcription factors can regulate ROS production directly (92). Not only did 1,25(OH)2D increase SOD2 levels, but it also promoted SOD2 mitochondrial localization to potentially act on mitochondrial ROS. In support of this, our previous research had shown that 1,25(OH)2D mediates antioxidant functions in OS cells by specifically lowering mitochondrial levels (105). Elsewhere, breast cancer cells exhibit nuclear SOD2 as well as chromatin decondensation at genes involved in self renewal, dedifferentiation, and stemness reprogramming, resulting in increased metastatic potential (123). Interestingly, new research has also revealed that SOD2 incorporated with iron (FeSOD2) functions as a nuclear pro-oxidant peroxidase, increasing oxidative stress (124). Excess cellular iron has been linked to cancer progression, with increased cellular iron leading to metabolic misadaptations to oxidative stress (125). Interestingly, FeSOD2 uses H2O2 as a substrate to promote tumorigenic and metastatic cancer cell phenotypes, whereas nuclear FeSOD2 promotes the induction of genes associated with EMT and stemness reprogramming (124). In this context, we discovered that 1,25(OH)2D can suppress H2O2 across OS lines, as well as EMT and stemness/self-renewal genes, potentially compromising FeSOD2 nuclear pro-oxidant activity after treatment.
Differential anti-cancer effects of CYP24A1 in osteosarcoma
The implications of the differential responses of CYP24A1, a VDR target gene, to either 1,25(OH)2D or calcipotriol on anti-OS effects remain unknown. In general, increased 24-hydroxylation of 1,25(OH)2D results in less active vitamin D3 metabolite, 1,24,25(OH)2D, potentially supporting tumorigenicity. Indeed, overexpression of CYP24A1 has been linked to a poor prognosis in some human cancers (126), and recently novel small molecule DNA aptamers have been identified that target CYP24A1 with promising anticancer effects (127). However, in our studies, 1,25(OH)2D did not induce CYP24A1 in MG63 cells, which may reflect an enhanced antitumor response via increased 1,25(OH)2D but not the 1,24,25(OH)2D metabolite. Calcipotriol treatment, on the other hand, not only increased the expression of CYP24A1 in MG63 osteosarcomas, but it also had a significant anti-tumor effect. Several mechanisms, including epigenetic regulation of the CYP24A1 promoter and 1,25(OH)2D metabolism, may account for the observed differences in response. For example, human prostate cancer cells are known to express low levels of CYP24A1 controlled by DNA methylation of its promoter (128), which may be synonymous with MG63 cells treated with 1,25(OH)2D. Furthermore, given its structural similarity to 1,25(OH)2D, the vitamin D3 metabolite, 24,25-dihydroxycholecalciferol, which is formed from 25-hydroxyvitamin D3 by the action of CYP24A1, exhibits potent anti-cancer effects (129). Importantly, this may be synonymous with the calcipotriol response observed in MG63 cells, which yields both high levels of CYP24A1 and anti-cancer responses at the same time via alternative pathways to 1,25(OH)2D signaling. Future studies utilizing bisulfite promoter sequencing and/or high-pressure liquid chromatography will be required to test these conditions in both LM7 and MG63 models.
Novel vitamin D3-EMT interactions and model systems to establish and study in the future
We discovered that assessing several human OS lines for metastasis potential was more informative for their clinical relevance in epigenetic regulation studies of EMT and metastasis. Indeed, re-analysis of cDNA array data of metastatic lung tumors from primary osteosarcomas show that they in fact express higher levels of E cadherin compared to normal bone tissues and even primary OS samples themselves (Figures S11, S12) (130, 131). This suggests that “metastatic” tumors re-expressed epithelial adhesion markers, and represent post-migratory tumors within newly established tumor microenvironments. Nevertheless, despite these limitations, based on the reanalysis of cDNA array data, SOD2 levels were consistently enhanced in metastatic OS samples, yet decreased relative to normal bone tissue, once again suggesting that SOD2 plays an upstream adaptive role in osteosarcomas and stimulation of its anti-oxidative organelle-specific functions may be key to therapy (Figures S11, S12).
Lastly, while this study focused on several common EMT factors, we did discover other novel 1,25(OH)2D interactions worth mentioning. For example, 1,25(OH)2D treatment increased the expression of pentraxin 3 (PTX3), a known pattern recognition molecule and oncosuppressor that inhibits FGF-dependent tumor growth and metastasis (Figures 1, 12) (132). Furthermore, we discovered that 1,25(OH)2D treatment increased the expression of tumor necrosis factor alpha-induced protein 3 (TNFAIP3), which is required for the ubiquitination and degradation of EMT transcription factors like SNAIL1/2 and ZEB1 in gastric cancers (133). Surprisingly, 1,25(OH)2D also inhibited C-X-C motif chemokine Ligand 12 (CXCL12) expression, which is a key pre-metastatic niche factor that recruits tumor cells (i.e., oncogenic “seeds”), thus escalating tumor progression and metastatic potential. Our findings also revealed that SOX2 was enriched in highly metastatic LM7 cells, and that vitamin D3 can suppress its expression (GSE220948). EMT is often activated during cancer invasion and metastasis, generating cells with properties of stem cells (134). Although SOX2 is a well-known marker of (neuronal) stem cell pluripotency, recent research has shown that it also promotes cell migration and invasion in ovarian (135), breast (136), retinal (137), and laryngeal (138) cancers; thus, vitamin D3 in this context may have a broader impact. To date, it is unknown whether vitamin D3 can inhibit OS in patients or patient-derived xenograft (PDX) animal models; therefore, future research is needed to create murine models of metastatic OS to provide in vivo tools to investigate vitamin D3 and OS more thoroughly.
Materials and methods
Reagents and human osteosarcoma cell lines
Crystalline 1,25(OH)2D (679101; MilliporeSigma, Burlington, MA, USA) was reconstituted in ethanol and kept at −80°C. Calcipotriol (hydrate) was reconstituted in ethanol before treatment (10009599; Cayman Chemical). Human MG63 osteosarcoma (CRL-1427; American Type Culture Collection, Manassas, VA, USA) and SaOS-LM7 (RRID : CVCL_0515; kind gift from Dr. Johnathan Trent, U. Miami) cells were cultured in complete media containing Eagle’s minimum essential medium (ATCC, 30–2003), 10% heat-inactivated fetal bovine serum (Gibco, Thermo Fisher Scientific, Waltham, MA, USA), and 100 U/mL penicillin, 100 mg/mL streptomycin (Life Technologies, Carlsbad, CA, USA). For assays, cells were treated with 0 (vehicle; equal-volume ethanol; 0.0001%), 10nM, and 100nM 1,25(OH)2D incubated in tissue culture plates (CytoOne, USA Scientific, Ocala, FL, USA) at 37°C in a humidified atmosphere of 5% CO2, 95% air.
Lineage tracing and migration of wound induced K15 bulge stem cell progenitors in the absence of Vdr
The Tg(Krt1-15-cre/PGR)22Cot line (referred to as K15-CrePR1; JAX stock no. 005249) was on a mixed C57BL/6 and SJL background and was utilized to generate RU486-inducible, Cre-mediated gene deletions in BSCs of mouse hair follicles. The Gt(ROSA)26Sortm1(CAG-Brainbow2.1)Cle strain (also known as R26R-Confetti; JAX stock number 013731) was maintained on the C57BL/6J strain. Professor Geert Carmeliet (KU Leuven) kindly provided mice with a floxed Vdr gene that were generated as previously described (139). Prior to conducting tests, the conditional alleles and deletion efficiencies were validated via PCR analysis. Floxed Vdr mice were bred with K15-CrePR1 and R26R-Confetti mice expressing Cre-recombinase under the control of the K15 promoter in order to trace the lineage of subsequent progenitor cells following RU486 treatment and wounding. Each experimental mouse received a 3-mm-diameter, full-thickness truncal wound with a sterile biopsy punch (Sklar Instruments, PA). As an analgesic, slow-release buprenorphine was administered, and the animals were monitored daily for signs of distress. After sacrifice, the degree and cellular composition of re-epithelialization were evaluated by obtaining tissue in PBS containing 4% PFA (pH 7.4). Wounds were sectioned and imaged with a Zeiss LSM 880 confocal laser scanning microscope after being cut along the midlines and placed in cryofreezing liquid. Using serial wound sections for Confetti-labeled cell counting, 4-5 separate animal experiments were conducted.
Scratch migration and Boyden chamber invasion assays
The scratch assay was used to examine cell migration following scratch-induced cell loss. Cells were grown to confluence, then glass Pasteur pipettes were used to scratch the surface of the vessels in a vertical direction. To prevent re-adhesion of dissociated cells, the wells were immediately rinsed in PBS. Cells were cultured under a variety of conditions, with the gap distance being monitored every day for up to 72 hours. After 72 hours, cells were fixed with 4% PFA and stained with a crystal violet solution containing 0.05% crystal violet in 30% methanol. In certain instances, staining with 4-HNE was performed after scratching. For impedance-based detection of migrating cells, Boyden chamber invasion tests were conducted using Millicell with hanging Transwell polyethylene terephthalate inserts (8 µm pore size, Millipore, PIEP12R48). 200 µl of serum-free medium containing 5104 unstimulated MG63 or LM7 cells was added to the upper compartment, while 750 µl of complete EMEM medium with or without 1,25(OH)2D, was added to the lower compartment. Cotton swabs were used to remove non-migratory cells from the upper chamber after 24 hours. On the lower side of the Transwell membrane, migratory cells were fixed with 4% PFA and stained with DAPI. Using ImageJ, cells were counted using a Zeiss 880 LSM confocal microscope (Olympus).
ATACseq and analysis
ATACseq was used to evaluate the chromatin of MG63 cells (Active Motif, Carlsbad, CA, USA; 53150). At the Sylvester Comprehensive Cancer Center’s Oncogenomic Core Facility, DNAseq library preparation was performed. Samples were sequenced on an Illumina NovaSeq 6000 utilizing 100-bp paired ends. Using Cutadapt, sequencing reads (40 million per sample) were trimmed of Nextera adaptor sequences and filtered. Reads were mapped to the reference genome (hg38 Canonical) utilizing Bowtie2 with the following parameters: “extremely sensitive end-to-end (–very-sensitive)”, “set the maximum fragment length for viable paired-end alignments: 1000”, and “enable mate dovetailing to produce BAM files.” BAM data sets on a range of variables were used to filter out uninformative reads with poor mapping quality and improper pairing (Galaxy Version 2.4.1). ≥30 was applied to the read mapping quality (phred scale) filter. ATACseq TF motifs were called using HOMER (http://www.homer.ucsd.edu).
RNA-seq and analysis
RNA-seq data has been submitted to GEO with accession GSE220948. Total RNA was isolated from MG63 lysates (n = 2 per treatment condition) using the PureLink RNA Mini kit (12183018A, Thermo Fisher Scientific) with DNase set (12185010, Thermo Fisher Scientific). The Agilent Bioanalyzer confirmed that the RIN counts of the RNA samples were greater than >8.5. The Oncogenomic Core Facility of the Sylvester Comprehensive Cancer Center was responsible for library preparation and RNA-sequencing (University of Miami). Samples were sequenced using 75 bp paired ends on an Illumina NextSeq 500 (San Diego, CA, USA), resulting in ~30 million trimmed and filtered reads per sample using Cutadapt. Compressed Fastq.gz files were uploaded to a Galaxy account (https://usegalaxy.org) and concatenated data sets tail-to-head (Galaxy Version 0.1.0). HTseq-count was executed to generate gene counts that were not standardized for each sample. iDEP (http://bioinformatics.sdstate.edu/idep93) was utilized to perform normalization of RNA-seq gene counts (counts per million [CPM]) as well as differential gene expression and visualization analyses. Individual gene expression graphs produced from RNA-seq were subjected to a two-way ANOVA with Bonferroni’s multiple comparisons test using the CPM values. The p value summaries were represented as ****p ≤ 0.0001, ***p ≤ 0.001, **p ≤ 0.01 and *p ≤ 0.05. Using statistically significant differentially expressed genes, GSEA (v 4.3.2) was used to evaluate whether an a priori-defined collection of genes differed between the two biological states. GSEA used a normalized enrichment score (NES) > +/− 2, nominal P value (NOM P-Val) < 0.05 and false discovery rate (FDR) < 0.05 for statistical significance. The molecular Signatures Database v7.3 with signature gene sets was utilized for GSEA. The “clusterProfiler” R package was used to analyze GO and KEGG enrichment (140). ShinyGO enrichment tool (141) was also utilized for data analysis and graphical representation.
Analysis of Osteosarcoma patient samples using microarray data
Raw probe-level data (.CEL files) from Affymetrix HG U133A microarray experiments were collected from the Gene Expression Omnibus (GEO) and reanalyzed in order to evaluate human osteoblast patient samples. The series GSE16088 (130) included array data for 14 OS tissue samples, whereas the series GSE14359 (131) included array data for 10 OS tissue samples, four metastatic lung OS tissue samples, and a normal bone tissue sample. Normal osteoblast states were examined utilizing the GSE39262 series. The CEL files were read using the R package “oligo” (142). Averages of the probe set of values were normalized using the robust multichip algorithm (RMA) method of “oligo” R package, as well as heatmap and PCA plots. The “limma” R package was used to do differential expression analysis (143). Genes with adjusted p-values ≤ 0.05 and log2 foldchanges ≥2 were determined to be differentially expressed.
Comprehensive analysis and processing of epigenomic data sets for osteosarcoma
We reanalyzed raw genome-wide histone modification data from series GSE74230, which includes ChIP-seq of H3K4me1, H3K27ac, and DNase I Hypersensitivity data in metastatic and non-metastatic OS cell line pairings, as well as primary and metastatic tumors in human patients. Bowtie2 was used to index the sequences to the reference hg38 genome (144). BowtieQC (v 0.11.9) was used to assess the quality of the raw FASTQ files. Reads that were not uniquely mapped or redundant were removed. The “callpeak” module of Model-based Analysis for ChIP Sequencing (MACS v 2.1.3) was utilized to identify regions with ChIP-seq enrichment over the background (q < 0.01) (145). The R Bioconductor program ChIPseeker (146) was used to generate Brower Extensible Data (BED) format files depicting genomic areas with each histone modification and DNase I hypersensitive site peak for the annotation of enriched peaks acquired from the MACS2 callpeak function. The 500bp sequences surrounding the peak summits were recovered from the promoter region, and transcription factor motif finding was performed using HOMER version 4.11 and ranked by adjusted p. CISTROME-GO was implemented to evaluate gene-level regulatory potential (RP) scores and enrichment of Kyoto Encyclopedia of Genes and Genomes (KEGG) pathways between H3K27ac changes in MG63 and LM7 OS cells (75). A half-decay distance of 10.0 kb was established for all differential peaks found by DESeq2 (Padjusted < 0.05, log2-fold change > 1). The epigenetic changes were also annotated independently using the EaSeq platform (147). Peak annotations for H3K27ac (-500 and +1000 from TSS) and H3K4ME1 (-100 and +5000 from TSS) were determined using a log2 FC threshold for LM7 and MG63 samples. Overrepresented peaks were defined as log2 (0.2 to 11.6), while underrepresented peaks were defined as log2 (-0.1 to -2). The Cistrome DB toolkit was used to extract SNAI2 and VDR TFs based on >250,000 epigenomic data sets taken from human and mouse samples [13]. EaSeq and Integrative Genome Browser (IGV) was used to visualize peaks, correlation plots (poised and active enhancer elements), and heatmaps.
Target gene prediction for nonsense-mediated RNA decay and statistical comparison
On the basis of four studies in which NMD effectors were inhibited in human HeLa cells, a list of core NMD-target and non-NMD-target genes was compiled (77–80). NMD targets were filtered if they exhibited a ≥2-fold upregulation in response to UPF1/SMG6 knockdown and expressed FPKM ≥ 5 (79). Non-target genes of NMD were categorized as showing no or marginal upregulation (i.e., < 1.5-fold upregulation after knockdown (77–80)). Based on this analysis, more than >4,000 genes were identified as NMD nontargets, while more than >900 genes were identified as NMD targets by at least one study; however, 50 genes were identified as NMD targets by all studies, and we used these 50 genes as our core NMD-target gene set (Figure S5). We compared our RNA-seq data from MG63 cells to NMD-target and nontarget genes. GraphPad was used to calculate descriptive statistics, such as skewness and kurtosis, for the NMD target and non-target genes. Using GraphPad, a ROC curve was generated by comparing the true positive rate to the false positive rate for NMD target and non-target genes. Multiple comparisons were conducted for non-NMD target genes by randomly selecting 39 genes from the pool of non-NMD target genes. GraphPad generated C statistics based on the area under the curve. Anti-phosphorylated UPF1 antibody (Millipore Sigma 07-1016) was used on MG63 cells.
Disruption of the NMD SMG7-UPF1 complex to using NMDI-14
NMDI-14 inhibitor (Ethyl 2-(((6,7-dimethyl-3-oxo-1,2,3,4-tetrahydro-2-quinoxalinyl)acetyl)amino)-4,5-dimethyl-3-thiophenecarboxylate) was purchased from Calbiochem (Cat. Nr. 530838) and reconstituted in DMSO (10mg/ml; 24mM). For MTT assay, MG63 cells were treated with NMDI-14 at 0.05nM-50µM (10-fold series) with corresponding matching DMSO series performed independently in 96-welll plates. A same batch of MG63 cells were cultured in 6-well plates for total RNA collection and qPCR analysis. Cell toxicity and stress was observed at 50µM NMDI-14 at both 24 and 48 hours of treatment, which was reported not to occur with other cell lines (87).
DsiRNA SMG6 knockdown to evaluate NMD target gene expression
Dicer-substrate short interfering RNAs (DsiRNAs) and TriFECTa® kits (Integrated DNA Technologies) were utilized to knockdown SMG6 more effectively than conventional siRNA. All RNA strands for DsiRNAs were synthesized as single-strand RNAs (ssRNAs) and resuspended in RNase-free water following purification by high-performance liquid chromatography. ssRNAs were annealed at 95°C for 5 minutes to form DsiRNA duplexes, then incubated at room temperature for 4 hours before being aliquoted and stored at 80°C. 27-mer hs.Ri.SMG6.13.3 duplex DsiRNA targeting the coding sequence of SMG6 was sufficient for >60% knockdown (Figure S6). For optimization, endogenous gene positive controls and qPCR assays (HPRT-S1 DsiRNAs and qPCR assays) were also employed. As a reference, a universal negative control (non-targeting DsiRNA) was utilized in all experiments as a reference. MG63 cells were transfected with BioT (Biolands), and after optimization, 20-60nM of targeting DsiRNAs were used. After 24 hours of treatment, the effects of SMG6 knockdown on NMD-target and non-target genes were assessed using qPCR. The two-way ANOVA test with Tukey’s multiple comparisons was used to conduct statistical analysis. All data represent the mean standard deviation (S.D.) of at least three separate experiments. ****p ≤ 0.0001.
Analysis of soft agar osteosarcoma spheroids
MG63 and LM7 cells were seeded into 0.4% low-melting-point agarose (Lonza, Basel, Switzerland; 50101) on top of a 1% agarose layer (1000 cells per well, 24-well plate). For approximately 14 days, cells were maintained in an incubator at 37°C and 5% CO2 with vehicle or 1,25(OH)2D. The Live-or-Dye™ Zombie Aqua fixable viability staining kit was used for live cell analysis (32004-T; Biotium). For quantification, colonies were fixed in 4% PFA and counted using a dissecting scope (Zeiss Stemi 508, Carl Zeiss, Jena, Germany) and ImageJ software. Images were converted to 8-bit, background subtracted using rolling ball radius of 1000 pixels and light background, and then applied threshold using Internodes correction. The spheroids were enumerated using the particle analyzer with the settings: size = 0.01/0.001-10mm2; circularity = 0-1.0. All experiments were designed with three replicates per condition. An ordinary one-way ANOVA with Sidak’s multiple comparisons test was conducted. A number of spheroids were extracted from soft agar and immunostained. Unconjugated rabbit polyclonal antibodies were used to detect 4-hydroxynonenal, type 1 and type 3 collagens (bs-6313R, bs-10423R, and bs-0948R; Bioss). Because of their small sizes, LM7 colonies were not extracted.
DsiRNA SNAI2 knockdown to evaluate the effects of 1,25(OH)2D on gene expression and migration
Dicer-substrate short interfering RNAs (DsiRNAs) and TriFECTa® kits (Integrated DNA Technologies) were utilized to knockdown SNAI2 more effectively than conventional siRNA. All RNA strands for DsiRNAs were synthesized as single-strand RNAs (ssRNAs) and resuspended in RNase-free water following purification by high-performance liquid chromatography. ssRNAs were annealed at 95°C for 5 minutes to form DsiRNA duplexes, then incubated at room temperature for 4 hours before being aliquoted and stored at 80°C. 27-mer hs.Ri.SNAI2.13.2, but not hs.Ri.SNAI2.13.1, duplex DsiRNA targeting the coding sequence of SNAI2 was sufficient for knockdown (Figure S8). Transfection efficiency control, TYE 563-labeled DsiRNAs, was used for optimization studies (Figure S7). For optimization, endogenous gene positive controls and qPCR assays (HPRT-S1 DsiRNAs and qPCR assays) were also employed. As a reference, a universal negative control (non-targeting DsiRNA) was utilized. LM7 cells were transfected with BioT (Biolands), and after optimization, 80nM of targeting DsiRNAs were used. After 24 hours of treatment, the sensitizing effect of SNAI2 DsiRNAs on 10nM 1,25(OH)2D-mediated gene expression in LM7 cells was determined using qPCR. The Student’s t-test was used to conduct statistical analysis. All data represent the mean standard deviation (S.D.) of at least three-four separate experiments. *p ≤ 0.05, **p ≤ 0.01, ***p ≤ 0.001, and ****p ≤ 0.0001.; Student’s t-test.
Western blotting
MG63 cells were lysed in RIPA buffer (50mM Tris-Cl pH 7.4, 150mM NaCl, 0.1% SDS, 0.1% sodium azide, 0.5% Na-deoxycholate, 1mM EDTA, 1% NP-40, 1X Protease inhibitor cocktail) and centrifuged for 10 minutes at 13,000 g and 4 C. The amount of total protein was determined using a BCA kit. Protein samples (20 µg) were denatured at 95 C for 5 minutes in 1X Laemmle buffer (Tris-HCl pH 6.8, 2% SDS, 20% glycerol, 0.2% bromophenol blue, 0.025% beta-mercaptoethanol). Proteins were separated by SDS-PAGE, transferred to an activated polyvinylidene fluoride membrane, and then blocked for 1 hour at room temperature with 5% non-fat dried skim milk/1X TBST (Tris-buffer saline, 0.1% Tween 20). The primary antibodies were diluted in a buffer of 0.5% milk/1X TBST (CD44 antibody; 15675-1-AP, Proteintech). The Li-COR system was used to detect antibody binding.
Chromatin immunoprecipitation -qPCR
After 24 hours of treatment with vehicle or 10nM 1,25(OH)2D, MG63 cells (~1.0 X 10⁷) were cross-linked with 1% formaldehyde at room temperature for 10 minutes. Cross-linking was inhibited with 100 mM glycine, and cells were lysed in 1 ml expansion buffer (25 mM HEPES pH 8.0, 1.5 mM MgCl2, 10 mM KCl, 0.1% NP-40, 1X PIC) and centrifuged at 2000 rpm to recover nuclei. Fixed nuclei were re-suspended in 1 ml sonication buffer (50 mM HEPES pH 8.0, 140 mM NaCl, 1 mM EDTA, 1% Triton X-100, 0.1% Na-deoxycholate and 0.1% SDS) containing a protease inhibitor cocktail and sonicated with a Q125 sonicator (QSonica) to generate fragment sizes of 200-800 bp. The supernatant was pre-cleared for 1 hour at 4°C with protein A Dynabeads (Invitrogen). Chromatin samples were incubated overnight at a low temperature with 10 µg ChIP-grade anti-RNA polymerase II (ab26721; Abcam, Boston, MA, USA) and anti-VDR (sc-1008x; Santa Cruz Biotechnology, Santa Cruz, CA, USA) antibodies. IP complexes were captured using protein-A Dynabeads (pre-blocked with 0.5% BSA/1X PBS) and washed three times each with wash buffer-1 (50 mM HEPES pH 8.0, 500 mM NaCl, 1 mM EDTA, 1% Triton X-100, 0.1% Na-deoxycholate and 0.1% SDS), wash buffer-2 (20 mM Tris HCL pH 8.0, 1 mM EDTA, 0.5% NP-40, 250 mM LiCl, 0.5% Na-deoxycholate and 1X PIC) and TE buffer. Immunoprecipitated chromatin was eluted at 65°C for 10 minutes in 200 l of elution buffer (50 mM Tris pH 8.0, 1 mM EDTA, 1% SDS, 50 mM NaHCO3). Input and IP fractions were treated with 20 µg RNase A and 40 µg Proteinase K for 1 hour at 42 C and 65°C, respectively. Overnight, reverse crosslinking was performed at 65°C. DNA was extracted with phenol: chloroform: isoamyl alcohol (25:24:1), and ethanol precipitation was performed with 3M sodium acetate (pH 5.2) and 2 µg of glycogen. In 30 µl of nuclease-free water, DNA samples were resuspended after being washed with 70% ethanol. qPCR was conducted using the standard SYBR-green method.
LM7 xenograft animal model and positron emission tomography, data acquisition and human cell tracking
Xenografts were performed on female homozygous Nu/J mice (strain #: 002019) aged 8-9 weeks and weighing 24-26 grams that were procured from The Jackson Laboratory (Bar Harbor, ME, USA) and maintained in the animal care facility of the Neuroscience Annex Building at the University of Miami (Miami, FL, USA). The Institutional Animal Care and Use Committee of the University of Miami Miller School of Medicine approved all animal procedures (protocol 21-107). All animals were kept in accordance with the circadian cycle (12hr light/12hr dark cycle) and were provided with sterilized food and drink ad libitum. 1X10⁶ LM7 cells/100 µl dilutant (1% ethanol in PBS cat#: 21-031-CV, Corning, Corning) were injected subcutaneously into the right flanks of Nu/J mice without matrigel. The animals were subsequently treated with either PBS (ethanol vehicle) or calcipotriol (60 μg/kg b.w., catalog number: NC1022293, Fisher Scientific; reconstituted in ethanol) three times intraperitoneally each week for nine weeks. This dose is known not to induce hypercalcemia or any deleterious side effects (148). Mice were humanely euthanized, and tissues harvest for qPCR analysis of human OS markers against mouse beta actin mRNA expression. Prior to sacrifice, PET imaging studies were conducted at the Cancer Modeling Shared Resource part of the Sylvester Comprehensive Cancer Center. A continuous body weight loss of >20% was also a predetermined survival endpoint, which did not occur during the 9 weeks of treatment. During imaging, experimental animals were anesthetized using isoflurane, and the isoflurane inhalation will be maintained throughout scanning. Animals were fasted overnight prior to 18F-fluorodeoxyglucose (FDG) positron-emitting radiotracer administration and start of imaging to monitor tumor response. A maximum of 10 µl per gram of body weight of 18F-FDG was injected intravenously via the tail vein per mouse (24 MBq of 18F-FDG, for 60 min). The whole-body PET scanning was done on a MILabs VECTor instrument with animals maintained under anesthesia and normothermia while monitoring vital signs in dorsal recumbency on a heating pad. For tracking human LM7 cells in nude mice, we utilized the anti-CD44 mouse monoclonal antibody (CF488A) [clone: HCAM/918] (Biotium, BNC880918-100) with affinipure Fab fragments goat anti-mouse IgG (H+L) (Jackson ImmunoResearch Laboratories, 115-007) blocking (Figure S10).
Quantitative real-time RT-PCR (qPCR) and analysis
RNA was prepared using the PureLink RNA Mini kit (12183018A, Thermo Fisher Scientific) with DNase set (12185010, Thermo Fisher Scientific). cDNA was synthesized using 300 ng total RNA with the ProtoScript First Strand cDNA Synthesis kit (New England Biolabs, Ipswich, MA, USA) utilizing random hexamers. qPCR analysis was performed on a QuantStudio 3 Real-Time instrument (Thermo Fisher Scientific) utilizing the Power SYBR Green PCR Master mix (Thermo Fisher Scientific; Table S1) with ROX reference dye following the program: 95°C for 10 minutes, followed by 40 cycles of 95°C for 15 seconds and 60°C for 1 minute. Target genes were normalized to beta actin mRNA expression. For the primer design, the human genome sequence coverage assembly GRCh38.p13 was utilized from the Genome Reference Consortium. Data were presented as fold induction of treatments compared with 0 nM (vehicle) normalized to beta actin mRNA levels (i.e., the comparative CT Livak method). Melting curve analysis was performed for all primer sets to eliminate those that yielded primer-dimers. The p values reflect the log fold-change compared with the vehicle (0 nM) condition (n= 3-4 experimental samples ± SD). A two-way ANOVA test with Sidak’s multiple comparisons test was performed between vehicle and treatment data sets using Prism (GraphPad, La Jolla, CA, USA) where the p value summaries were depicted as ****p ≤ 0.0001, ***p ≤ 0.001, **p ≤ 0.01, and *p ≤ 0.05.
MTT assay
All experiments were performed using 2.4 × 10⁴ cells/well in 96-well plates. Cells were seeded and then left to incubate at 37°C (5%CO2) overnight. The following day, cells were carefully washed with 1X PBS, and then treated with 1,25(OH)2D and the cellular status was assessed at 48 hours post treatment. The MTT (3-[4,5-dimethylthiazol-2-yl]-2,5 diphenyl tetrazolium bromide) assay was performed according to the manufacturer´s recommendation (10009365; Cayman Chemical). After incubation with the MTT reagent, the cells and salt were solubilized using the provided sodium dodecyl sulfate-based lysis buffer. The optical density absorbance was determined using a Molecular Devices EMax microplate spectrophotometer at 550 nm absorbance. Data is represented as the mean of six replicate wells ± SD, with analysis using the two-way ANOVA with Bonferroni post-hoc test (GraphPad Prism).
Image processing
Imaris was used to process and analyze Zeiss LSM 880 LS microscope-generated confocal images (Bitplane). Imaris (Bitplane) was used to perform 3D reconstructions using the semi-automated Surfaces feature. Using the multiple-channel masking tool, colocalization analysis was conducted. Using regions of interest on maximally projected images, the average mean fluorescence intensities were obtained. Adobe Illustrator and Microsoft PowerPoint were utilized to develop the diagrams.
Data availability statement
The datasets presented in this study can be found in online repositories. The names of the repository/repositories and accession number(s) can be found in the article/Supplementary Material.
Ethics statement
The Institutional Animal Care and Use Committee of the University of Miami Miller School of Medicine approved all animal procedures performed in this manuscript under Protocol 21-107 by trained individuals.
Author contributions
TL conceived, designed, and performed the experiments, analyzed the data, and wrote the manuscript. EC and VM performed the experiments. VM provided excellent technical support of the project. JH and VM edited the manuscript. EC, GS and SR analyzed the data and edited the manuscript. All authors gave final approval to the manuscript.
Funding
TL was supported by Grant # IRG-17-183-16 from the American Cancer Society, and from the Sylvester Comprehensive Cancer Center at the Miller School of Medicine, University of Miami. SR was funded by grant # 1R01CA215973. EC was supported by the grant NSF 19-500, DMS 1918925/1922843, JAX Computational Sciences, JAX Cancer Center (JAXCC) and NCI CCSG (P30CA034196).
Acknowledgments
We would like to thank Ava King (U. Miami) for technical support, and Dr. Jonathan Trent from the Sarcoma Research Group at the Sylvester Comprehensive Cancer Center (SCCC) for providing the LM7 cell line. We would also like to thank Dr. Daniel Bilbao and Dr. Christian Mason (Cancer Modeling Shared Resource/SCCC) for excellent technical support and advice for the PET imaging studies.
Conflict of interest
TL was employed by iCURA LLC.The remaining authors declare that the research was conducted in the absence of any commercial or financial relationships that could be construed as a potential conflict of interest.
Publisher’s note
All claims expressed in this article are solely those of the authors and do not necessarily represent those of their affiliated organizations, or those of the publisher, the editors and the reviewers. Any product that may be evaluated in this article, or claim that may be made by its manufacturer, is not guaranteed or endorsed by the publisher.
Supplementary material
The Supplementary Material for this article can be found online at: https://www.frontiersin.org/articles/10.3389/fonc.2023.1188641/full#supplementary-material
Supplementary Figure 1 | MMP13 expression and ATAC-seq genome browser tracks from VIM and CLDN1. (A) 24 hours of 1,25(OH)2D treatment of MG63 cells at 10nM concentration. (B) MG63 and MMP3 expression. Visualized using IMARIS.
Supplementary Figure 2 | Pie chart distribution of ChIP regions (H3K27ac) over chromosomes for LM7 and MG63 osteosarcoma lines. The percentages indicate the total ChIP, with the proportion of ChIP regions indicating the enrichment and significance of genomic structures such as promoters, gene bodies, etc.
Supplementary Figure 3 | Network associate of putative target genes from H3K27ac peaks in MG63 and LM7 osteosarcoma cells. The network corresponds to in the main text. Additional functional enrichment analysis of these networks is provided as Supplementary Material.
Supplementary Figure 4 | Vitamin D regulation of glutamate receptors in osteosarcomas. Glutamate receptor expression in MG63 cells as determined by RNA-seq. Two-way ANOVA Tukey’s multiple comparison test; p ≤ ****0.0001 (n=1).
Supplementary Figure 5 | Potential NMD target genes modulated by 1,25(OH)2D in MG63 cells. Four major studies that manipulated the NMD machinery were screened for common NMD target and non-target genes. Those genes were then compared to differentially regulated gene sets modulated by 1,25(OH)2D. The overlapping gene set expression pattern was analyzed in the main text.
Supplementary Figure 6 | DsiRNA knockdown of control HPRT and SMG6 in MG63 cells. (A) Partial suppression by 1,25(OH)2D of the NMD machinery genes in LM7 cells. LM7 cells treated for 48 hours with 100nM 1,25(OH)2D exhibit a downregulation of SMG5. Two-way ANOVA Tukey’s test for multiple comparisons; p ≤ ****0.0001 (n=3). (B) Specific knockdown of SMG6 using the SMG6.13.3 duplex. Duplex sequences shown below the graph. Two-way ANOVA test with Tukey’s multiple comparisons. All data represent the mean standard deviation (S.D.) of at least three separate experiments. ****p < 0.0001.
Supplementary Figure 7 | VDR directly enhances the transcriptional activity of SNAI2 but not SOD2. (A) Using NUBIScan (http://nubiscan.unibas.ch), potential vitamin D receptor response elements (VDREs) in the SOD2 and SNAI2 promoter regions were anticipated. As shown by the blue bar, the starting point is the transcription start sites (TSS, +1000bp). (B) SOD2 has 13 nuclear receptor binding sites, while SNAI2 had 17. SNAI2 was the only gene that featured a putative VDRE with a direct repeat 3 (DR3) intervals for RXR binding (highlighted by the red arrow and bar).
Supplementary Figure 8 | Transfection efficiency of DsiRNA Trifecta reagents in LM7 cells. After 24 hours of incubation, the transfection efficiency of 20pmole of TYE563-labeled DsiRNA was greater than 90%. Bar = 100µm Below: Histograms revealed that the 20pmole concentration comprised a bigger fraction of cells with a higher intensity.
Supplementary Figure 9 | DsiRNA knockdown of SNAI2 and control HPRT in LM7 cells (A) HPRT cleavage by DsiRNA. (B) Using the SNAI2.13.1 duplex, DsiRNA aimed to inhibit SNAI2 expression. (C) Successful SNAI2 DsiRNA knockdown with the SNAI2.13.2 duplex.
Supplementary Figure 10 | huCD44 antibody testing. (A) Application of huCD44 antibody against calcipotriol-treated LM7 xenograft mouse skin. Red arrows depict red blood cells that are negative for huCD44. Bar = 10µm (B) Negative control. Wild type mice skin sections were treated similarly but without huCD44 antibody. Typical autofluorescence of hair shafts (hs) are seen. Bar = 20µm (C) huCD44 background analysis with mouse Fab fragment blocking. Bar = 20µm (D) huCD44 background analysis without mouse Fab fragment blocking. Bar = 20µm
Supplementary Figure 11 | Principal component analysis of osteosarcoma and normal samples used for comparative gene expression analysis. The GEO series accession numbers are referenced for each sample set.
Supplementary Figure 12 | Comparative analysis between normal bone tissue, and primary osteosarcoma and metastasized lung tumors. (A) Hierarchical clustering of cDNA arrays of human tumor samples and OS cell lines using Euclidean distance and full linkage. The GEO sample accession number is assigned to each sample (Corresponds to Figure). BioConductor software for traditional 3’ arrays were used for preprocessing and analysis of Affymetrix GeneChip data. RMA (Robust Multiarray Analysis) was utilized for array preparation. Moderated t-statistics (limma) were utilized to identify genes with differential regulation. (B) The chart displays the M value, which is the log-ratio of the probeset intensities, as well as the corrected p values of numerous comparisons. Normal has normal osteoblast cells and normal tissue. Red indicates signatures that statistically differed from the others.
Supplementary File S1 | Functional enrichment annotation analysis of MG63 unique H3K27ac target genes
Supplementary File S2 | Functional enrichment annotation analysis of LM7 unique H3K27ac target genes
Supplementary Movie S1 | Vehicle-treated LM7-bearing nude mice PET scan.
Supplementary Movie S2 | Calcipotriol-treated LM7-bearding nude mice PET scan.
References
1. Mirabello L, Troisi RJ, Savage SA. International osteosarcoma incidence patterns in children and adolescents, middle ages and elderly persons. Int J Cancer (2009) 125(1):229–34. doi: 10.1002/ijc.24320
2. Ottaviani G, Jaffe N. The epidemiology of osteosarcoma. Cancer Treat Res (2009) 152:3–13. doi: 10.1007/978-1-4419-0284-9_1
3. Misaghi A, Goldin A, Awad M, Kulidjian AA. Osteosarcoma: a comprehensive review. SICOT J (2018) 4:12. doi: 10.1051/sicotj/2017028
4. Harrison DJ, Geller DS, Gill JD, Lewis VO, Gorlick R. Current and future therapeutic approaches for osteosarcoma. Expert Rev Anticancer Ther (2018) 18(1):39–50. doi: 10.1080/14737140.2018.1413939
5. Kundu ZS. Classification, imaging, biopsy and staging of osteosarcoma. Indian J Orthop (2014) 48(3):238–46. doi: 10.4103/0019-5413.132491
6. Lisle JW, Choi JY, Horton JA, Allen MJ, Damron TA. Metastatic osteosarcoma gene expression differs in vitro and in vivo. Clin Orthop Relat Res (2008) 466(9):2071–80. doi: 10.1007/s11999-008-0309-1
7. Meazza C, Scanagatta P. Metastatic osteosarcoma: a challenging multidisciplinary treatment. Expert Rev Anticancer Ther (2016) 16(5):543–56. doi: 10.1586/14737140.2016.1168697
8. Meyers PA, Heller G, Healey JH, Huvos A, Applewhite A, Sun M, et al. Osteogenic sarcoma with clinically detectable metastasis at initial presentation. J Clin Oncol (1993) 11(3):449–53. doi: 10.1200/JCO.1993.11.3.449
9. Kager L, Zoubek A, Potschger U, Kastner U, Flege S, Kempf-Bielack B, et al. Cooperative German-Austrian-Swiss osteosarcoma study, g., primary metastatic osteosarcoma: presentation and outcome of patients treated on neoadjuvant cooperative osteosarcoma study group protocols. J Clin Oncol (2003) 21(10):2011–8. doi: 10.1200/JCO.2003.08.132
10. Duan Q, Zhang H, Zheng J, Zhang L. Turning cold into hot: firing up the tumor microenvironment. Trends Cancer (2020) 6(7):605–18. doi: 10.1016/j.trecan.2020.02.022
11. Hattinger CM, Patrizio MP, Magagnoli F, Luppi S, Serra M. An update on emerging drugs in osteosarcoma: towards tailored therapies? Expert Opin Emerg Drugs (2019) 24(3):153–71. doi: 10.1080/14728214.2019.1654455
12. Yu M, Wu H, Wang J, Chen X, Pan J, Liu P, et al. Vitamin d receptor inhibits EMT via regulation of the epithelial mitochondrial function in intestinal fibrosis. J Biol Chem (2021) 296:100531. doi: 10.1016/j.jbc.2021.100531
13. Derynck R, Weinberg RA. EMT and cancer: more than meets the eye. Dev Cell (2019) 49(3):313–6. doi: 10.1016/j.devcel.2019.04.026
14. Chen C, Xie L, Ren T, Huang Y, Xu J, Guo W. Immunotherapy for osteosarcoma: fundamental mechanism, rationale, and recent breakthroughs. Cancer Lett (2021) 500:1–10. doi: 10.1016/j.canlet.2020.12.024
15. Wu CC, Beird HC, Andrew Livingston J, Advani S, Mitra A, Cao S, et al. Immuno-genomic landscape of osteosarcoma. Nat Commun (2020) 11(1):1008. doi: 10.1038/s41467-020-14646-w
16. Wang Z, Li B, Ren Y, Ye Z. T-Cell-Based immunotherapy for osteosarcoma: challenges and opportunities. Front Immunol (2016) 7:353. doi: 10.3389/fimmu.2016.00353
17. Litchfield K, Reading JL, Lim EL, Xu H, Liu P, Al-Bakir M, et al. Escape from nonsense-mediated decay associates with anti-tumor immunogenicity. Nat Commun (2020) 11(1):3800. doi: 10.1038/s41467-020-17526-5
18. Zhao A, Zhao Z, Liu W, Cui X, Wang N, Wang Y, et al. Carcinoma-associated fibroblasts promote the proliferation and metastasis of osteosarcoma by transferring exosomal LncRNA SNHG17. Am J Trans Res (2021) 13(9):10094–111.
19. Savage SA, Mirabello L, Wang Z, Gastier-Foster JM, Gorlick R, Khanna C, et al. Genome-wide association study identifies two susceptibility loci for osteosarcoma. Nat Genet (2013) 45(7):799–803. doi: 10.1038/ng.2645
20. Bongiorno R, Colombo MP, Lecis D. Deciphering the nonsense-mediated mRNA decay pathway to identify cancer cell vulnerabilities for effective cancer therapy. J Exp Clin Cancer Res (2021) 40(1):376. doi: 10.1186/s13046-021-02192-2
21. Pastor F, Kolonias D, Giangrande PH, Gilboa E. Induction of tumour immunity by targeted inhibition of nonsense-mediated mRNA decay. Nature (2010) 465(7295):227–30. doi: 10.1038/nature08999
22. Tan K, Stupack DG, Wilkinson MF. Nonsense-mediated RNA decay: an emerging modulator of malignancy. Nat Rev Cancer (2022) 22(8):437–51. doi: 10.1038/s41568-022-00481-2
23. Pawlicka K, Kalathiya U, Alfaro J. Nonsense-mediated mRNA decay: pathologies and the potential for novel therapeutics. Cancers (Basel) (2020) 12(3):765. doi: 10.3390/cancers12030765
24. Bouillon R, Eelen G, Verlinden L, Mathieu C, Carmeliet G, Verstuyf A. Vitamin d and cancer. J Steroid Biochem Mol Biol (2006) 102(1-5):156–62. doi: 10.1016/j.jsbmb.2006.09.014
25. Chandler PD, Chen WY, Ajala ON, Hazra A, Cook N, Bubes V, et al. Effect of vitamin D3 supplements on development of advanced cancer: a secondary analysis of the VITAL randomized clinical trial. JAMA Netw Open (2020) 3(11):e2025850. doi: 10.1001/jamanetworkopen.2020.25850
26. Manson JE, Cook NR, Lee IM, Christen W, Bassuk SS, Mora S, et al. Vitamin d supplements and prevention of cancer and cardiovascular disease. N Engl J Med (2019) 380(1):33–44. doi: 10.1056/NEJMoa1809944
27. Lisse TS. Vitamin d regulation of a SOD1-to-SOD2 antioxidative switch to prevent bone cancer. Appl Sci-Basel (2020) 10(7):2554. doi: 10.3390/app10072554
28. Zhang Y, Fang F, Tang J, Jia L, Feng Y, Xu P, et al. Association between vitamin d supplementation and mortality: systematic review and meta-analysis. BMJ (2019) 366:l4673. doi: 10.1136/bmj.l4673
29. Feldman D, Krishnan AV, Swami S, Giovannucci E, Feldman BJ. The role of vitamin d in reducing cancer risk and progression. Nat Rev Cancer (2014) 14(5):342–57. doi: 10.1038/nrc3691
30. Bouillon R, Carmeliet G, Verlinden L, van Etten E, Verstuyf A, Luderer HF, et al. Vitamin d and human health: lessons from vitamin d receptor null mice. Endocrine Rev (2008) 29(6):726–76. doi: 10.1210/er.2008-0004
31. Holick MF. Vitamin d: evolutionary, physiological and health perspectives. Curr Drug Targets (2011) 12(1):4–18. doi: 10.2174/138945011793591635
32. Holick MF. Vitamin d and sunlight: strategies for cancer prevention and other health benefits. Clin J Am Soc Nephrol (2008) 3(5):1548–54. doi: 10.2215/CJN.01350308
33. Fetahu IS, Hobaus J, Kallay E. Vitamin d and the epigenome. Front Physiol (2014) 5:164. doi: 10.3389/fphys.2014.00164
34. Carlberg C, Munoz A. An update on vitamin d signaling and cancer. Semin Cancer Biol (2022) 79:217–30. doi: 10.1016/j.semcancer.2020.05.018
35. Keum N, Lee DH, Greenwood DC, Manson JE, Giovannucci E. Vitamin d supplementation and total cancer incidence and mortality: a meta-analysis of randomized controlled trials. Ann Oncol (2019) 30(5):733–43. doi: 10.1093/annonc/mdz059
36. Wactawski-Wende J, Kotchen JM, Anderson GL, Assaf AR, Brunner RL, O'Sullivan MJ, et al. Calcium plus vitamin d supplementation and the risk of colorectal cancer. N Engl J Med (2006) 354(7):684–96. doi: 10.1056/NEJMoa055222
37. Avenell A, MacLennan GS, Jenkinson DJ, McPherson GC, McDonald AM, Pant PR, et al. Long-term follow-up for mortality and cancer in a randomized placebo-controlled trial of vitamin D(3) and/or calcium (RECORD trial). J Clin Endocrinol Metab (2012) 97(2):614–22. doi: 10.1210/jc.2011-1309
38. Trivedi DP, Doll R, Khaw KT. Effect of four monthly oral vitamin D3 (cholecalciferol) supplementation on fractures and mortality in men and women living in the community: randomised double blind controlled trial. BMJ (2003) 326(7387):469. doi: 10.1136/bmj.326.7387.469
39. Takeyama K, Kitanaka S, Sato T, Kobori M, Yanagisawa J, Kato S. 25-hydroxyvitamin D3 1alpha-hydroxylase and vitamin d synthesis. Science (1997) 277(5333):1827–30. doi: 10.1126/science.277.5333.1827
40. Bacchetta J, Sea JL, Chun RF, Lisse TS, Wesseling-Perry K, Gales B, et al. Fibroblast growth factor 23 inhibits extrarenal synthesis of 1,25-dihydroxyvitamin d in human monocytes. J Bone Mineral Res (2013) 28(1):46–55. doi: 10.1002/jbmr.1740
41. Bacchetta J, Zaritsky JJ, Lisse TS, Sea JL, Chun RF, Nemeth E, et al. Vitamin d as a new regulator of iron metabolism: vitamin d suppresses hepcidin in vitro and in vivo. Nephrol Dial Transpl (2012) 27:29–30.
42. Bacchetta J, Zaritsky JJ, Sea JL, Chun RF, Lisse TS, Zavala K, et al. Suppression of iron-regulatory hepcidin by vitamin d. J Am Soc Nephrol JASN (2014) 25(3):564–72. doi: 10.1681/ASN.2013040355
43. Zhou R, Chun RF, Lisse TS, Garcia AJ, Xu JZ, Adams JS, et al. Vitamin d and alternative splicing of RNA. J Steroid Biochem (2015) 148:310–7. doi: 10.1016/j.jsbmb.2014.09.025
44. Zhou R, Park JW, Chun RF, Lisse TS, Garcia AJ, Zavala K, et al. Concerted effects of heterogeneous nuclear ribonucleoprotein C1/C2 to control vitamin d-directed gene transcription and RNA splicing in human bone cells. Nucleic Acids Res (2017) 45(2):606–18. doi: 10.1093/nar/gkw851
45. Lisse TS, Adams JS, Hewison M. Identification of novel vitamin d receptor target genes based on promoter interaction with the vitamin d response element binding protein. Endocrine Rev (2010) 31(3).
46. Lisse TS, Adams JS, Hewison M. Vitamin d and microRNAs in bone. Crit Rev eukaryotic Gene Expression (2013) 23(3):195–214. doi: 10.1615/CritRevEukaryotGeneExpr.2013007147
47. Lagishetty V, Chun RF, Liu NQ, Lisse TS, Adams JS, Hewison M. 1alpha-hydroxylase and innate immune responses to 25-hydroxyvitamin d in colonic cell lines. J Steroid Biochem Mol Biol (2010) 121(1-2):228–33. doi: 10.1016/j.jsbmb.2010.02.004
48. Lisse TS, Chun RF, Rieger S, Adams JS, Hewison M. Vitamin d activation of functionally distinct regulatory miRNAs in primary human osteoblasts. J Bone mineral Res (2013) 28(6):1478–88. doi: 10.1002/jbmr.1882
49. Lisse TS, Hewison M. Vitamin d: a new player in the world of mTOR signaling. Cell Cycle (2011) 10(12):1888–9. doi: 10.4161/cc.10.12.15620
50. Lisse TS, Hewison M, Adams JS. Hormone response element binding proteins: novel regulators of vitamin d and estrogen signaling. Steroids (2011) 76(4):331–9. doi: 10.1016/j.steroids.2011.01.002
51. Lisse TS, Liu T, Irmler M, Beckers J, Chen H, Adams JS, et al. Gene targeting by the vitamin d response element binding protein reveals a role for vitamin d in osteoblast mTOR signaling. FASEB J (2011) 25(3):937–47. doi: 10.1096/fj.10-172577
52. Lisse TS, Saini V, Zhao H, Luderer HF, Gori F, Demay MB. The vitamin d receptor is required for activation of cWnt and hedgehog signaling in keratinocytes. Mol Endocrinol (2014) 28(10):1698–706. doi: 10.1210/me.2014-1043
53. Zhao H, Rieger S, Abe K, Hewison M, Lisse TS. DNA Damage-inducible transcript 4 is an innate surveillant of hair follicular stress in vitamin d receptor knockout mice and a regulator of wound re-epithelialization. Int J Mol Sci (2016) 17(12):1984. doi: 10.3390/ijms17121984
54. Tahbazlahafi B, Paknejad M, Khaghani S, Sadegh-Nejadi S, Khalili E. Vitamin d represses the aggressive potential of osteosarcoma. Endocr Metab Immune Disord Drug Targets (2021) 21(7):1312–8. doi: 10.2174/1871530320666200821155756
55. Nakamichi Y, Udagawa N, Horibe K, Mizoguchi T, Yamamoto Y, Nakamura T, et al. VDR in osteoblast-lineage cells primarily mediates vitamin d treatment-induced increase in bone mass by suppressing bone resorption. J Bone Mineral Res (2017) 32(6):1297–308. doi: 10.1002/jbmr.3096
56. Subramanian A, Tamayo P, Mootha VK, Mukherjee S, Ebert BL, Gillette MA, et al. Gene set enrichment analysis: a knowledge-based approach for interpreting genome-wide expression profiles. Proc Natl Acad Sci USA (2005) 102(43):15545–50. doi: 10.1073/pnas.0506580102
57. Liberzon A, Birger C, Thorvaldsdottir H, Ghandi M, Mesirov JP, Tamayo P. The molecular signatures database (MSigDB) hallmark gene set collection. Cell Syst (2015) 1(6):417–25. doi: 10.1016/j.cels.2015.12.004
58. Bouillon R, Bischoff-Ferrari H, Willett W. Vitamin d and health: perspectives from mice and man. J Bone Mineral Res (2008) 23(7):974–9. doi: 10.1359/jbmr.080420
59. Wu S, Du Y, Beckford J, Alachkar H. Upregulation of the EMT marker vimentin is associated with poor clinical outcome in acute myeloid leukemia. J Transl Med (2018) 16(1):170. doi: 10.1186/s12967-018-1539-y
60. Bhat AA, Syed N, Therachiyil L, Nisar S, Hashem S, Macha MA, et al. Claudin-1, a double-edged sword in cancer. Int J Mol Sci (2020) 21(2):569. doi: 10.3390/ijms21020569
61. Conacci-Sorrell M, Simcha I, Ben-Yedidia T, Blechman J, Savagner P, Ben-Ze'ev A. Autoregulation of e-cadherin expression by cadherin-cadherin interactions: the roles of beta-catenin signaling, slug, and MAPK. J Cell Biol (2003) 163(4):847–57. doi: 10.1083/jcb.200308162
62. Medrano-Gonzalez PA, Rivera-Ramirez O, Montano LF, Rendon-Huerta EP. Proteolytic processing of CD44 and its implications in cancer. Stem Cells Int (2021) 2021:6667735. doi: 10.1155/2021/6667735
63. Lafleur EA, Koshkina NV, Stewart J, Jia SF, Worth LL, Duan X, et al. Increased fas expression reduces the metastatic potential of human osteosarcoma cells. Clin Cancer Res (2004) 10(23):8114–9. doi: 10.1158/1078-0432.CCR-04-0353
64. Morrow JJ, Bayles I, Funnell APW, Miller TE, Saiakhova A, Lizardo MM, et al. Positively selected enhancer elements endow osteosarcoma cells with metastatic competence. Nat Med (2018) 24(2):176–85. doi: 10.1038/nm.4475
65. Takahashi K, Yamanaka S. Induction of pluripotent stem cells from mouse embryonic and adult fibroblast cultures by defined factors. Cell (2006) 126(4):663–76. doi: 10.1016/j.cell.2006.07.024
66. Arnold SJ, Huang GJ, Cheung AF, Era T, Nishikawa S, Bikoff EK, et al. The T-box transcription factor Eomes/Tbr2 regulates neurogenesis in the cortical subventricular zone. Genes Dev (2008) 22(18):2479–84. doi: 10.1101/gad.475408
67. Lisse TS, Rieger S. IKKalpha regulates human keratinocyte migration through surveillance of the redox environment. J Cell Sci (2017) 130(5):975–88. doi: 10.1242/jcs.197343
68. Gonzalez R, Moffatt G, Hagner A, Sinha S, Shin W, Rahmani W, et al. Platelet-derived growth factor signaling modulates adult hair follicle dermal stem cell maintenance and self-renewal. NPJ Regener Med (2017) 2:11. doi: 10.1038/s41536-017-0013-4
69. Huh HD, Kim DH, Jeong HS, Park HW. Regulation of TEAD transcription factors in cancer biology. Cells (2019) 8(6):600. doi: 10.3390/cells8060600
70. Ouyang X, Feng L, Yao L, Xiao Y, Hu X, Zhang G, et al. Testicular orphan receptor 4 (TR4) promotes papillary thyroid cancer invasion via activating circ-FNLA/miR-149-5p/MMP9 signaling. Mol Ther Nucleic Acids (2021) 24:755–67. doi: 10.1016/j.omtn.2021.03.021
71. Yang R, Wang M, Zhang G, Bao Y, Wu Y, Li X, et al. E2F7-EZH2 axis regulates PTEN/AKT/mTOR signalling and glioblastoma progression. Br J Cancer (2020) 123(9):1445–55. doi: 10.1038/s41416-020-01032-y
72. Kumar S, Perlman E, Harris CA, Raffeld M, Tsokos M. Myogenin is a specific marker for rhabdomyosarcoma: an immunohistochemical study in paraffin-embedded tissues. Mod Pathol (2000) 13(9):988–93. doi: 10.1038/modpathol.3880179
73. Kawane T, Qin X, Jiang Q, Miyazaki T, Komori H, Yoshida CA, et al. Runx2 is required for the proliferation of osteoblast progenitors and induces proliferation by regulating Fgfr2 and Fgfr3. Sci Rep (2018) 8(1):13551. doi: 10.1038/s41598-018-31853-0
74. Creyghton MP, Cheng AW, Welstead GG, Kooistra T, Carey BW, Steine EJ, et al. Histone H3K27ac separates active from poised enhancers and predicts developmental state. Proc Natl Acad Sci USA (2010) 107(50):21931–6. doi: 10.1073/pnas.1016071107
75. Li S, Wan C, Zheng R, Fan J, Dong X, Meyer CA, et al. Cistrome-GO: a web server for functional enrichment analysis of transcription factor ChIP-seq peaks. Nucleic Acids Res (2019) 47(W1):W206–11. doi: 10.1093/nar/gkz332
76. Imai T, Tokunaga A, Yoshida T, Hashimoto M, Mikoshiba K, Weinmaster G, et al. The neural RNA-binding protein Musashi1 translationally regulates mammalian numb gene expression by interacting with its mRNA. Mol Cell Biol (2001) 21(12):3888–900. doi: 10.1128/MCB.21.12.3888-3900.2001
77. Yepiskoposyan H, Aeschimann F, Nilsson D, Okoniewski M, Muhlemann O. Autoregulation of the nonsense-mediated mRNA decay pathway in human cells. RNA (2011) 17(12):2108–18. doi: 10.1261/rna.030247.111
78. Tani H, Imamachi N, Salam KA, Mizutani R, Ijiri K, Irie T, et al. Identification of hundreds of novel UPF1 target transcripts by direct determination of whole transcriptome stability. RNA Biol (2012) 9(11):1370–9. doi: 10.4161/rna.22360
79. Schmidt SA, Foley PL, Jeong DH, Rymarquis LA, Doyle F, Tenenbaum SA, et al. Identification of SMG6 cleavage sites and a preferred RNA cleavage motif by global analysis of endogenous NMD targets in human cells. Nucleic Acids Res (2015) 43(1):309–23. doi: 10.1093/nar/gku1258
80. Cho H, Han S, Choe J, Park SG, Choi SS, Kim YK. SMG5-PNRC2 is functionally dominant compared with SMG5-SMG7 in mammalian nonsense-mediated mRNA decay. Nucleic Acids Res (2013) 41(2):1319–28. doi: 10.1093/nar/gks1222
81. Ronchetti S, Migliorati G, Riccardi C. GILZ as a mediator of the anti-inflammatory effects of glucocorticoids. Front Endocrinol (Lausanne) (2015) 6:170. doi: 10.3389/fendo.2015.00170
82. Zhou J, Li Y, Yang L, Wu Y, Zhou Y, Cui Y, et al. Stanniocalcin 2 improved osteoblast differentiation via phosphorylation of ERK. Mol Med Rep (2016) 14(6):5653–9. doi: 10.3892/mmr.2016.5951
83. Watanabe M, Higashi T, Ozeki K, Higashi AY, Sugimoto K, Mine H, et al. CLDN15 is a novel diagnostic marker for malignant pleural mesothelioma. Sci Rep (2021) 11(1):12554. doi: 10.1038/s41598-021-91464-0
84. Rigau M, Ostrouska S, Fulford TS, Johnson DN, Woods K, Ruan Z, et al. Butyrophilin 2A1 is essential for phosphoantigen reactivity by gammadelta T cells. Science (2020) 367(6478):eaay5516. doi: 10.1126/science.aay5516
85. Chiu SY, Serin G, Ohara O, Maquat LE. Characterization of human Smg5/7a: a protein with similarities to caenorhabditis elegans SMG5 and SMG7 that functions in the dephosphorylation of Upf1. RNA (2003) 9(1):77–87. doi: 10.1261/rna.2137903
86. Kurosaki T, Li W, Hoque M, Popp MW, Ermolenko DN, Tian B, et al. A post-translational regulatory switch on UPF1 controls targeted mRNA degradation. Genes Dev (2014) 28(17):1900–16. doi: 10.1101/gad.245506.114
87. Martin L, Grigoryan A, Wang D, Wang J, Breda L, Rivella S, et al. Identification and characterization of small molecules that inhibit nonsense-mediated RNA decay and suppress nonsense p53 mutations. Cancer Res (2014) 74(11):3104–13. doi: 10.1158/0008-5472.CAN-13-2235
88. Zannas AS, Wiechmann T, Gassen NC, Binder EB. Gene-Stress-Epigenetic regulation of FKBP5: clinical and translational implications. Neuropsychopharmacology (2016) 41(1):261–74. doi: 10.1038/npp.2015.235
89. Podvinec M, Kaufmann MR, Handschin C, Meyer UA. NUBIScan, an in silico approach for prediction of nuclear receptor response elements. Mol Endocrinol (2002) 16(6):1269–79. doi: 10.1210/mend.16.6.0851
90. Zheng R, Wan C, Mei S, Qin Q, Wu Q, Sun H, et al. Cistrome data browser: expanded datasets and new tools for gene regulatory analysis. Nucleic Acids Res (2019) 47(D1):D729–35. doi: 10.1093/nar/gky1094
91. Larriba MJ, Martin-Villar E, Garcia JM, Pereira F, Pena C, de Herreros AG, et al. Snail2 cooperates with Snail1 in the repression of vitamin d receptor in colon cancer. Carcinogenesis (2009) 30(8):1459–68. doi: 10.1093/carcin/bgp140
92. Cichon MA, Radisky DC. ROS-induced epithelial-mesenchymal transition in mammary epithelial cells is mediated by NF-kB-dependent activation of snail. Oncotarget (2014) 5(9):2827–38. doi: 10.18632/oncotarget.1940
93. Aboelella NS, Brandle C, Kim T, Ding ZC, Zhou G. Oxidative stress in the tumor microenvironment and its relevance to cancer immunotherapy. Cancers (Basel) (2021) 13(5):986. doi: 10.3390/cancers13050986
94. Ding N, Yu RT, Subramaniam N, Sherman MH, Wilson C, Rao R, et al. A vitamin d receptor/SMAD genomic circuit gates hepatic fibrotic response. Cell (2013) 153(3):601–13. doi: 10.1016/j.cell.2013.03.028
95. Shintani Y, Maeda M, Chaika N, Johnson KR, Wheelock MJ. Collagen I promotes epithelial-to-mesenchymal transition in lung cancer cells via transforming growth factor-beta signaling. Am J Respir Cell Mol Biol (2008) 38(1):95–104. doi: 10.1165/rcmb.2007-0071OC
96. Odri GA, Tchicaya-Bouanga J, Yoon DJY, Modrowski D. Metastatic progression of osteosarcomas: a review of current knowledge of environmental versus oncogenic drivers. Cancers (Basel) (2022) 14(2):360. doi: 10.3390/cancers14020360
97. Li J, Luco AL, Camirand A, St-Arnaud R, Kremer R. Vitamin d regulates CXCL12/CXCR4 and epithelial-to-Mesenchymal transition in a model of breast cancer metastasis to lung. Endocrinology (2021) 162(7):bqab049. doi: 10.1210/endocr/bqab049
98. Larriba MJ, Garcia de Herreros A, Munoz A. Vitamin d and the epithelial to mesenchymal transition. Stem Cells Int (2016) 2016:6213872. doi: 10.1155/2016/6213872
99. Yu X, Wang Q, Liu B, Zhang N, Cheng G. Vitamin d enhances radiosensitivity of colorectal cancer by reversing epithelial-mesenchymal transition. Front Cell Dev Biol (2021) 9:684855. doi: 10.3389/fcell.2021.684855
100. Pomella S, Sreenivas P, Gryder BE, Wang L, Milewski D, Cassandri M, et al. Interaction between SNAI2 and MYOD enhances oncogenesis and suppresses differentiation in fusion negative rhabdomyosarcoma. Nat Commun (2021) 12(1):192. doi: 10.1038/s41467-020-20386-8
101. Kemmis CM, Welsh J. Mammary epithelial cell transformation is associated with deregulation of the vitamin d pathway. J Cell Biochem (2008) 105(4):980–8. doi: 10.1002/jcb.21896
102. Piccini I, Bertolini M. Experimentally induced epithelial-mesenchymal transition of human hair follicle stem cells as a model of scarring alopecia ex vivo. Methods Mol Biol (2020) 2154:143–52. doi: 10.1007/978-1-0716-0648-3_12
103. Imanishi H, Ansell DM, Cheret J, Harries M, Bertolini M, Sepp N, et al. Epithelial-to-Mesenchymal stem cell transition in a human organ: lessons from lichen planopilaris. J Invest Dermatol (2018) 138(3):511–9. doi: 10.1016/j.jid.2017.09.047
104. Gardner LB. Hypoxic inhibition of nonsense-mediated RNA decay regulates gene expression and the integrated stress response. Mol Cell Biol (2008) 28(11):3729–41. doi: 10.1128/MCB.02284-07
105. Quigley M, Rieger S, Capobianco E, Wang Z, Zhao H, Hewison M, et al. Vitamin d modulation of mitochondrial oxidative metabolism and mTOR enforces stress adaptations and anticancer responses. JBMR Plus (2022) 6(1):e10572. doi: 10.1002/jbm4.10572
106. Liu PT, Wheelwright M, Teles R, Komisopoulou E, Edfeldt K, Ferguson B, et al. MicroRNA-21 targets the vitamin d-dependent antimicrobial pathway in leprosy. Nat Med (2012) 18(2):267–73. doi: 10.1038/nm.2584
107. Liu PT, Stenger S, Li H, Wenzel L, Tan BH, Krutzik SR, et al. Toll-like receptor triggering of a vitamin d-mediated human antimicrobial response. Science (2006) 311(5768):1770–3. doi: 10.1126/science.1123933
108. Lagishetty V, Misharin AV, Liu NQ, Lisse TS, Chun RF, Ouyang Y, et al. Vitamin d deficiency in mice impairs colonic antibacterial activity and predisposes to colitis. Endocrinology (2010) 151(6):2423–32. doi: 10.1210/en.2010-0089
109. Zhang XJ, Luo FL, Li J, Wan JY, Zhang L, Li HZ, et al. DNA Damage-inducible transcript 4 is an innate guardian for human squamous cell carcinoma and an molecular vector for anti-carcinoma effect of 1,25(OH)(2)D-3. Exp Dermatol (2019) 28(1):45–52. doi: 10.1111/exd.13815
110. Liu C, Shaurova T, Shoemaker S, Petkovich M, Hershberger PA, Wu Y. Tumor-targeted nanoparticles deliver a vitamin d-based drug payload for the treatment of EGFR tyrosine kinase inhibitor-resistant lung cancer. Mol Pharm (2018) 15(8):3216–26. doi: 10.1021/acs.molpharmaceut.8b00307
111. Verma A. Combining vitamin d with programmed death 1 blockade in head and neck cancer. State University of New York at Buffalo: ProQuest Dissertations Publishing (2021).
112. Verma A, Vincent-Chong VK, DeJong H, Hershberger PA, Seshadri M. Impact of dietary vitamin d on initiation and progression of oral cancer. J Steroid Biochem Mol Biol (2020) 199:105603. doi: 10.1016/j.jsbmb.2020.105603
113. Kelly JL, Salles G, Goldman B, Fisher RI, Brice P, Press O, et al. Low serum vitamin d levels are associated with inferior survival in follicular lymphoma: a prospective evaluation in SWOG and LYSA studies. J Clin Oncol (2015) 33(13):1482–90. doi: 10.1200/JCO.2014.57.5092
114. Zeichner SB, Koru-Sengul T, Shah N, Liu Q, Markward NJ, Montero AJ, et al. Improved clinical outcomes associated with vitamin d supplementation during adjuvant chemotherapy in patients with HER2+ nonmetastatic breast cancer. Clin Breast Cancer (2015) 15(1):e1–11. doi: 10.1016/j.clbc.2014.08.001
115. Bokhari A, Jonchere V, Lagrange A, Bertrand R, Svrcek M, Marisa L, et al. Targeting nonsense-mediated mRNA decay in colorectal cancers with microsatellite instability. Oncogenesis (2018) 7(9):70. doi: 10.1038/s41389-018-0079-x
116. Gonzalez-Hilarion S, Beghyn T, Jia J, Debreuck N, Berte G, Mamchaoui K, et al. Rescue of nonsense mutations by amlexanox in human cells. Orphanet J Rare Dis (2012) 7:58. doi: 10.1186/1750-1172-7-58
117. Jiang Y, Wang J, Sun M, Zuo D, Wang H, Shen J, et al. Multi-omics analysis identifies osteosarcoma subtypes with distinct prognosis indicating stratified treatment. Nat Commun (2022) 13(1):7207. doi: 10.1038/s41467-022-34689-5
118. Wang K, Zhao J, He M, Fowdur M, Jiang T, Luo S. Association of GRM4 gene polymorphisms with susceptibility and clinicopathological characteristics of osteosarcoma in guangxi Chinese population. Tumour Biol (2016) 37(1):1105–12. doi: 10.1007/s13277-015-3904-2
119. Liao S, Ruiz Y, Gulzar H, Yelskaya Z, Ait Taouit L, Houssou M, et al. Osteosarcoma cell proliferation and survival requires mGluR5 receptor activity and is blocked by riluzole. PloS One (2017) 12(2):e0171256. doi: 10.1371/journal.pone.0171256
120. Moser AR, Luongo C, Gould KA, McNeley MK, Shoemaker AR, Dove WF. ApcMin: a mouse model for intestinal and mammary tumorigenesis. Eur J Cancer (1995) 31A(7-8):1061–4. doi: 10.1016/0959-8049(95)00181-H
121. Zhao ZX, Zhang YQ, Sun H, Chen ZQ, Chang JJ, Wang X, et al. Calcipotriol abrogates cancer-associated fibroblast-derived IL-8-mediated oxaliplatin resistance in gastric cancer cells via blocking PI3K/Akt signaling. Acta Pharmacologica Sin (2022) 44(1):178–88. doi: 10.1038/s41401-022-00927-1
122. Wang Z, Li Y, Sarkar FH. Signaling mechanism(s) of reactive oxygen species in epithelial-mesenchymal transition reminiscent of cancer stem cells in tumor progression. Curr Stem Cell Res Ther (2010) 5(1):74–80. doi: 10.2174/157488810790442813
123. Coelho DR, Palma FR, Paviani V, He C, Danes JM, Huang Y, et al. Nuclear-localized, iron-bound superoxide dismutase-2 antagonizes epithelial lineage programs to promote stemness of breast cancer cells via a histone demethylase activity. Proc Natl Acad Sci USA (2022) 119(29):e2110348119. doi: 10.1073/pnas.2110348119
124. Ganini D, Santos JH, Bonini MG, Mason RP. Switch of mitochondrial superoxide dismutase into a prooxidant peroxidase in manganese-deficient cells and mice. Cell Chem Biol (2018) 25(4):413–25:e6. doi: 10.1016/j.chembiol.2018.01.007
125. Guo Q, Li L, Hou S, Yuan Z, Li C, Zhang W, et al. The role of iron in cancer progression. Front Oncol (2021) 11:778492. doi: 10.3389/fonc.2021.778492
126. Anderson MG, Nakane M, Ruan X, Kroeger PE, Wu-Wong JR. Expression of VDR and CYP24A1 mRNA in human tumors. Cancer chemotherapy Pharmacol (2006) 57(2):234–40. doi: 10.1007/s00280-005-0059-7
127. Biyani M, Yasuda K, Isogai Y, Okamoto Y, Weilin W, Kodera N, et al. Novel DNA aptamer for CYP24A1 inhibition with enhanced antiproliferative activity in cancer cells. ACS Appl Mater Interfaces (2022) 14(16):18064–78. doi: 10.1021/acsami.1c22965
128. Luo W, Karpf AR, Deeb KK, Muindi JR, Morrison CD, Johnson CS, et al. Epigenetic regulation of vitamin d 24-hydroxylase/CYP24A1 in human prostate cancer. Cancer Res (2010) 70(14):5953–62. doi: 10.1158/0008-5472.CAN-10-0617
129. Dennis CD, Cohen DJ, Boyan BD, Schwartz Z. Abstract 2693: the vitamin D3 metabolite, 24R,25(OH)3D3 is differentially tumorigenic in ER+ and ER- laryngeal cancer cells in vitro. Cancer Res (2022) 82:2693. doi: 10.1158/1538-7445.AM2022-2693
130. Paoloni M, Davis S, Lana S, Withrow S, Sangiorgi L, Picci P, et al. Canine tumor cross-species genomics uncovers targets linked to osteosarcoma progression. BMC Genomics (2009) 10:625. doi: 10.1186/1471-2164-10-625
131. Fritsche-Guenther R, Noske A, Ungethum U, Kuban RJ, Schlag PM, Tunn PU, et al. De novo expression of EphA2 in osteosarcoma modulates activation of the mitogenic signalling pathway. Histopathology (2010) 57(6):836–50. doi: 10.1111/j.1365-2559.2010.03713.x
132. Matarazzo S, Melocchi L, Rezzola S, Grillo E, Maccarinelli F, Giacomini A, et al. Long pentraxin-3 follows and modulates bladder cancer progression. Cancers (Basel) (2019) 11(9):1277. doi: 10.3390/cancers11091277
133. Du B, Liu M, Li C, Geng X, Zhang X, Ning D, et al. The potential role of TNFAIP3 in malignant transformation of gastric carcinoma. Pathol Res Pract (2019) 215(8):152471. doi: 10.1016/j.prp.2019.152471
134. Mani SA, Guo W, Liao MJ, Eaton EN, Ayyanan A, Zhou AY, et al. The epithelial-mesenchymal transition generates cells with properties of stem cells. Cell (2008) 133(4):704–15. doi: 10.1016/j.cell.2008.03.027
135. Lou X, Han X, Jin C, Tian W, Yu W, Ding D, et al. SOX2 targets fibronectin 1 to promote cell migration and invasion in ovarian cancer: new molecular leads for therapeutic intervention. OMICS (2013) 17(10):510–8. doi: 10.1089/omi.2013.0058
136. Wang Y, Bibi M, Min P, Deng W, Zhang Y, Du J. SOX2 promotes hypoxia-induced breast cancer cell migration by inducing NEDD9 expression and subsequent activation of Rac1/HIF-1alpha signaling. Cell Mol Biol Lett (2019) 24:55. doi: 10.1186/s11658-019-0180-y
137. Balaji S, Santhi R, Kim U, Muthukkaruppan V, Priya CG, Vanniarajan A. Cancer stem cells with overexpression of neuronal markers enhance chemoresistance and invasion in retinoblastoma. Curr Cancer Drug Targets (2020) 20(9):710–9. doi: 10.2174/1568009620666200504112711
138. Yang N, Hui L, Wang Y, Yang H, Jiang X. SOX2 promotes the migration and invasion of laryngeal cancer cells by induction of MMP-2 via the PI3K/Akt/mTOR pathway. Oncol Rep (2014) 31(6):2651–9. doi: 10.3892/or.2014.3120
139. Masuyama R, Stockmans I, Torrekens S, Van Looveren R, Maes C, Carmeliet P, et al. Vitamin d receptor in chondrocytes promotes osteoclastogenesis and regulates FGF23 production in osteoblasts. J Clin Invest (2006) 116(12):3150–9. doi: 10.1172/JCI29463
140. Yu G, Wang LG, Han Y, He QY. clusterProfiler: an r package for comparing biological themes among gene clusters. OMICS (2012) 16(5):284–7. doi: 10.1089/omi.2011.0118
141. Ge SX, Jung D, Yao R. ShinyGO: a graphical gene-set enrichment tool for animals and plants. Bioinformatics (2020) 36(8):2628–9. doi: 10.1093/bioinformatics/btz931
142. Carvalho BS, Irizarry RA. A framework for oligonucleotide microarray preprocessing. Bioinformatics (2010) 26(19):2363–7. doi: 10.1093/bioinformatics/btq431
143. Ritchie ME, Phipson B, Wu D, Hu Y, Law CW, Shi W, et al. Limma powers differential expression analyses for RNA-sequencing and microarray studies. Nucleic Acids Res (2015) 43(7):e47. doi: 10.1093/nar/gkv007
144. Langmead B, Salzberg SL. Fast gapped-read alignment with bowtie 2. Nat Methods (2012) 9(4):357–9. doi: 10.1038/nmeth.1923
145. Zhang Y, Liu T, Meyer CA, Eeckhoute J, Johnson DS, Bernstein BE, et al. Model-based analysis of ChIP-seq (MACS). Genome Biol (2008) 9(9):R137. doi: 10.1186/gb-2008-9-9-r137
146. Yu G, Wang LG, He QY. ChIPseeker: an R/Bioconductor package for ChIP peak annotation, comparison and visualization. Bioinformatics (2015) 31(14):2382–3. doi: 10.1093/bioinformatics/btv145
147. Lerdrup M, Johansen JV, Agrawal-Singh S, Hansen K. An interactive environment for agile analysis and visualization of ChIP-sequencing data. Nat Struct Mol Biol (2016) 23(4):349–57. doi: 10.1038/nsmb.3180
Keywords: osteosarcoma, vitamin D, VDR, ROS, EMT, Snai2, metastasis, cancer
Citation: Capobianco E, McGaughey V, Seraphin G, Heckel J, Rieger S and Lisse TS (2023) Vitamin D inhibits osteosarcoma by reprogramming nonsense-mediated RNA decay and SNAI2-mediated epithelial-to-mesenchymal transition. Front. Oncol. 13:1188641. doi: 10.3389/fonc.2023.1188641
Received: 17 March 2023; Accepted: 20 April 2023;
Published: 09 May 2023.
Edited by:
Yunfeng Feng, Qinghai University Medical College, ChinaReviewed by:
Hengguang Zhao, Second Affiliated Hospital of Chongqing Medical University, ChinaKaori Yasuda, Toyama Prefectural University, Japan
Copyright © 2023 Capobianco, McGaughey, Seraphin, Heckel, Rieger and Lisse. This is an open-access article distributed under the terms of the Creative Commons Attribution License (CC BY). The use, distribution or reproduction in other forums is permitted, provided the original author(s) and the copyright owner(s) are credited and that the original publication in this journal is cited, in accordance with accepted academic practice. No use, distribution or reproduction is permitted which does not comply with these terms.
*Correspondence: Thomas S. Lisse, dGxpc3NlQGljdXJhZHguY29t