- 1Department of Radiation Oncology, State Key Laboratory of Oncology in South China, Guangdong Key Laboratory of Nasopharyngeal Carcinoma Diagnosis and Therapy, Guangdong Provincial Clinical Research Center for Cancer, Sun Yat-sen University Cancer Center, Guangzhou, China
- 2Department of Radiation Oncology, the First People’s Hospital of Foshan, Foshan, China
- 3Department of Radiation Oncology, Luoding People’s Hospital, Yunfu, China
Background and purpose: This study aimed to analyze the impact of interobserver variability (IOV) on clinical dosimetry and prognosis, specifically investigating the correlation between IOV and clinical prognosis in the context of intensity-modulated radiation therapy (IMRT) for nasopharyngeal carcinoma (NPC).
Materials and methods: Twelve NPC patients who underwent IMRT were selected. Four radiotherapy physicians from two different-tier cancer centers independently delineated target volumes and organs at risk (OARs) for each patient. These delineations were compared against gold standard structures from a regional cancer center. The IOV among physicians and its effect on clinical and prognosis were analyzed. The relationships between the IOV, dosimetry, and prognosis were investigated using spearman’s correlation analysis.
Results: The target volume and OARs delineation differed significantly among physicians. This variability led to reduced prescription dose coverage (PDC) of the planning target volume (PTV) and increased doses to OARs, impacting tumor control probability (TCP) and normal tissue complication probability (NTCP). Compared to standard delineations, all four physicians showed decreased TCPs (average decrease in ΔTCP >1%) and a significant increase in NTCPs of OARs. The relative volume difference (ΔV) of target volumes correlated strongly with ΔPDC (R=0.686) and ΔTCP (R=0.703). Moreover, in the validation set, ΔV also strongly correlated with ΔTCP (R = 0.778).
Conclusion: Substantial IOV in delineating NPC target volumes and OARs for IMRT was observed. This variability affects plan optimization, dose distribution, and clinical prognosis. ΔV can serve as a risk predictor for assessing delineation variability in NPC radiotherapy treatment planning.
1 Introduction
Intensity-modulated radiation therapy (IMRT) is the primary treatment for nasopharyngeal carcinoma (NPC) and delivers high doses to tumors while reducing radiation exposure to the surrounding organs at risk (OARs), thus enhancing the therapeutic ratio (1–3). The precise delineation of target volumes and critical OARs is essential for accurate IMRT implementation. Given the complex anatomical features of NPC, coupled with interobserver variability (IOV) in clinical experience, understanding of guidelines, and delineation methods, inconsistencies in target and OAR contouring have negatively impacted NPC radiotherapy outcomes, substantially influencing treatment precision and effectiveness (4–7).
Several studies (8–11) have reported considerable variations among physicians in contouring target volumes and OARs for the same NPC patients by quantifying IOV in terms of geometric volume metrics such as the dice similarity coefficient (DSC), average surface-to-surface distance (ASSD), and volume measurements. Nevertheless, assessing whether this delineation variability translates into clinical prognosis implications poses a significant challenge, resulting in a deficiency of universally accepted clinical standards for quantifying IOV (12).
While several studies have delved into the consequences of IOV on treatment plan optimization and discrepancies in dose distribution (13, 14), there is a scarcity of research that has specifically addressed the impact of IOV on the clinical prognosis of radiotherapy. Moreover, investigations into prostate (12, 15) and rectal cancers (16) have revealed weak or no correlations between common IOV geometric indicators and dosimetric parameters or clinical prognosis, posing a significant challenge to clinical practice. However, Jameson et al. (17) reported that relative volume difference (ΔV) in lung cancer was correlated with the tumor control probability (TCP), suggesting that the ΔV could serve as a prognostic indicator. Yet, the correlation between IOV and clinical outcomes in the context of complex NPC radiotherapy cases remains unclear.
Therefore, this study aimed to analyze IOV in target volume and OAR delineation by physicians from different-tier cancer centers for NPC radiotherapy. By investigating the impact of IOV on dosimetry and prognosis, we aim to identify that are closely related to prognosis, ultimately contributing to the homogenization of IMRT treatment planning.
2 Materials and methods
2.1 Patient datasets and contouring
This retrospective analysis included 12 newly diagnosed, pathologically confirmed stage I - IVB NPC patients (7th edition of the AJCC staging system, see Supplementary Table 1) who were treated with IMRT at a regional cancer center between May 2017 and October 2018. All patients had complete pretreatment imaging, including MRI simulation and both contrast-enhanced and non-contrast CT scans. Before the distribution of images, CT and MR images undergo automatic rigid registration on the Monaco planning system (Version 5.1, Elekta, Sweden). Subsequently, physicians manually adjust these images with reference to bony landmarks at the skull base, such as the clivus and sphenoid sinus. This study was approved by the Institutional Review Board of Sun Yat-sen University Cancer Center (ID: B2024-111-01), and all patients provided written informed consent.
For each patient, four physicians from two different-tier cancer centers independently delineated the target volume and OARs using the Monaco planning system (Version 5.1, Elekta, Sweden). Specifically, Physicians A, B, and C, each with 5 to 10 years of experience were affiliated with a city-level cancer center. Physician D, with 6 years of experience was affiliated with a county-level cancer center. Notably, the contouring results of Physician D required collective discussion and confirmation within their department. Additionally, the delineated gold standard volumes (SVs) integrate automatic delineation algorithms with expert consensus. Initially, we utilized ABAS software (Version 2.01, Elekta AB, Stockholm, Sweden) to generate primary OARs delineations. Subsequently, three senior radiation oncology experts (each with over 10 years of experience in NPC) from a regional cancer center manually delineated the target volumes and revised OARs according to International Commission on Radiation Units and Measurements (ICRU) reports 50, 60, and 83 (18–20), which were then refined through iterative consensus until an inter-observer DSC score of over 0.90 was achieved.
The target volumes included the gross tumor volume of the nasopharynx (GTVnx), number of positive neck lymph nodes (GTVnd), high-risk clinical target volume (CTV1), and prophylactic irradiation target volume (CTV2). The volumes of the OARs encompassed the brainstem, spinal cord, lens, optic nerves, optic chiasm, pituitary, parotid glands, temporal lobes, temporomandibular joints, and mandible. Planning target volumes (PTVs) corresponding to setup uncertainties were generated for GTVnx, GTVnd, CTV1, and CTV2, as well as planning risk volumes (PRVs) were created the spinal cord, optic chiasm, optic nerves, and temporal lobe based on predefined margins.
2.2 Geometric difference analysis
The IOV metrics include ΔV (Equation 1), maximum-to-minimum ratio (MMR) (Equation 2), coefficient of variation (CV) (Equation 3), DSC (Equation 4), and 95% Hausdorff distance (HD95) (Equation 5) (21, 22). These are detailed as follows:
ΔV was the difference between the individual volume delineated by a physician at a county or city cancer center ( ) and the standard delineated volume ):
MMR reflects the volumetric variation in organs delineated independently by different physicians.
where and are the maximum and minimum volumes of the delineated structures, respectively.
The CV indicates the dispersion of organ volume delineations among different physicians. A higher CV signifies greater IOV.
where and represent the standard deviation and average volume of the evaluated structure, respectively.
The DSC reflects the overlap of structures delineated independently by different physicians. It is recommended that a DSC value greater than 0.7 be used as a criterion for good concordance when evaluating differences in image volume delineation (23).
where V1 and V2 represent the volumes delineated by two physicians, and (V1∩V2) is the intersecting volume of V1 and V2.
The HD95 reflects the similarity between the contours of two structures, defined as the maximum distance from any point on one contour to its nearest point on the other contour. The formula is:
where a and b denote the contours of structures A and B, respectively, and d(a,b) is any metric between these points.
2.3 Treatment planning
All contoured structures were imported into the Eclipse treatment planning system (Version 15.6; Varian Medical Systems, Palo Alto, CA, USA). For each patient, the target area and OARs delineated by different physicians were independently subjected to 9-field uniform dynamic IMRT simultaneous integrated boost planning by the same experienced dosimetrist in a fully blinded manner. The same prescription and OAR dose constraints were applied to all plans with 6 MV X-ray irradiation at prescription doses of 70, 66, 60, and 54 Gy for PTVnx, PTVnd, PTV1, and PTV2, respectively, and the irradiation was delivered 33 times. The planned dose was calculated using a grid size of 2.5 mm with an anisotropic analytical algorithm (AAA). Plan optimization dose constraints were based on the 2019 international guidelines for prioritization and dose constraints for OARs in NPC (24).
2.4 Dosimetry difference
To evaluate the impact of IOV on PTVs and OARs on dose distribution in treatment plans and clinical prognosis, dose prescriptions designed for individual contouring structures were mapped onto gold standardized structures. Dosimetric parameters, such as prescription dose coverage (PDC) (Equation 6) and relative dose difference ΔD_diff) (Equation 7), were used to analyze the discrepancies between each individualized and gold standard plan.
The dosing schedule for a radiotherapy program must first ensure that the planned target site is exposed to sufficient prescribed doses of radiation. Accordingly, we define the PDC of the PTV as the evaluation index of the target dose, which is calculated using the following formula:
where PTV represents the volume of the contoured PTV, and is the volume of the PTV that receives 100% of the prescribed dose.
The Dmax, or D1cc for 1cc volume was used to analyze serial-type OARs such as the spinal cord and brainstem. The Dmean, or D1cc for 1cc volume was used to analyze parallel-type OARs, such as the parotid gland. ΔD_diff reflects the magnitude of dose parameter differences for OARs between plans developed at different levels of cancer centers and standard plans. It is defined as:
is the dose parameter from the county or city-level cancer centers, and is the dose parameter from the regional cancer center.
2.5 Radiobiological analysis
TCP, a radiobiological index for PTVnx, was computed using the Schultheiss logistic model (25), expressed as (Equation 8):
where denotes the dose at which no more than 50% of patients treated with radiotherapy will experience severe radiation damage 5 years posttreatment; γ50 is a unique value when TCP=0.5 and D=D50; and EUD is the equivalent uniform dose, a measure of the dose that would produce the same radiobiological effect if the tissue or organ were uniformly irradiated, given by (Equation 9):
Following Okunieff et al. (26), the radiobiological parameter TCD50 for TCP was defined as 61.69 Gy, γ50 as 3.38, and a as -8.
The normal tissue complication probability (NTCP) was assessed using a modified linear-quadratic model proposed by Zaider et al. (27), expressed as (Equations 10, 11):
where and are nonnegative adjustable parameters that vary according to tissue or organ type; D is the dose received by normal tissue; V is the volume when the tissue is uniformly irradiated; is the coefficient for lethal damage; and is the ratio of lethal to sublethal damage coefficients. The parameters required for the NTCP model calculations are provided in Supplementary Table 2.
2.6 Statistical analysis
All data were analyzed using SPSS version 22.0 (IBM SPSS, Inc., Chicago, USA). IOV delineation discrepancies, dosimetric parameters, TCPs, and NTCPs between the four physicians and the gold standard were compared using paired t-tests or Wilcoxon signed-rank tests, with significance set at P<0.05. Spearman’s rank correlation analysis was used to assess the correlation between IOV, dosimetric parameters, and clinical prognosis parameters, with a threshold of P<0.05 indicating significant correlations, Spearman’s correlation coefficient (R) indicated the strength of correlations, and the sign of R denoted the direction of association (12).
Geometric evaluation indices of the IOV that showed significant correlations and correlation coefficients |R|>0.4 were selected and designated as predictors of delineation discrepancy risk.
2.7 Validation for risk predictors of IOV
A case of a 65-year-old man previously treated with IMRT and pathologically staged as T2N2M0 was randomly selected. Ten radiation oncologists from eight cancer centers independently delineated the target volumes and OARs for NPC. The structures contoured by these physicians were used in the ABAS software to establish a consensus “true structure set” by applying the STAPLE (Simultaneous Truth and Performance Level Estimation) algorithm, which serves as the gold SV within the validation cohort (28).
Based on the various delineations and planned dose distributions within the validation set, the IOV risk factors among different physicians were compared and analyzed for their correlation with clinical outcomes. This analysis aimed to validate the feasibility and generalizability of IOV risk factors as predictors of clinical prognosis.
3 Results
3.1 IOV in target volume delineation
Significant IOV was observed in the delineation of GTVnx among the four physicians. Notably, the mean GTVnx volumes were considerably higher when compared to the standard volumes (SVs). The MMR and CV for these delineations were (mean ± SD) 3.64 ± 1.60 and 0.44 ± 0.17, respectively, with average DSC values<0.6.
IOV was less for organs with clear boundaries and larger volumes, such as the brainstem, mandibles, and eyes. The average MMR was<1.8, and the CV was<0.18, with average DSC values >0.8. Conversely, IOV was considerably larger for organs with relatively obscure boundaries and smaller volumes, such as the optic nerves and pituitary. The average MMR and CV exceeded 3 and 0.5, respectively, and the average DSC values were<0.7 (Table 1, Figure 1).
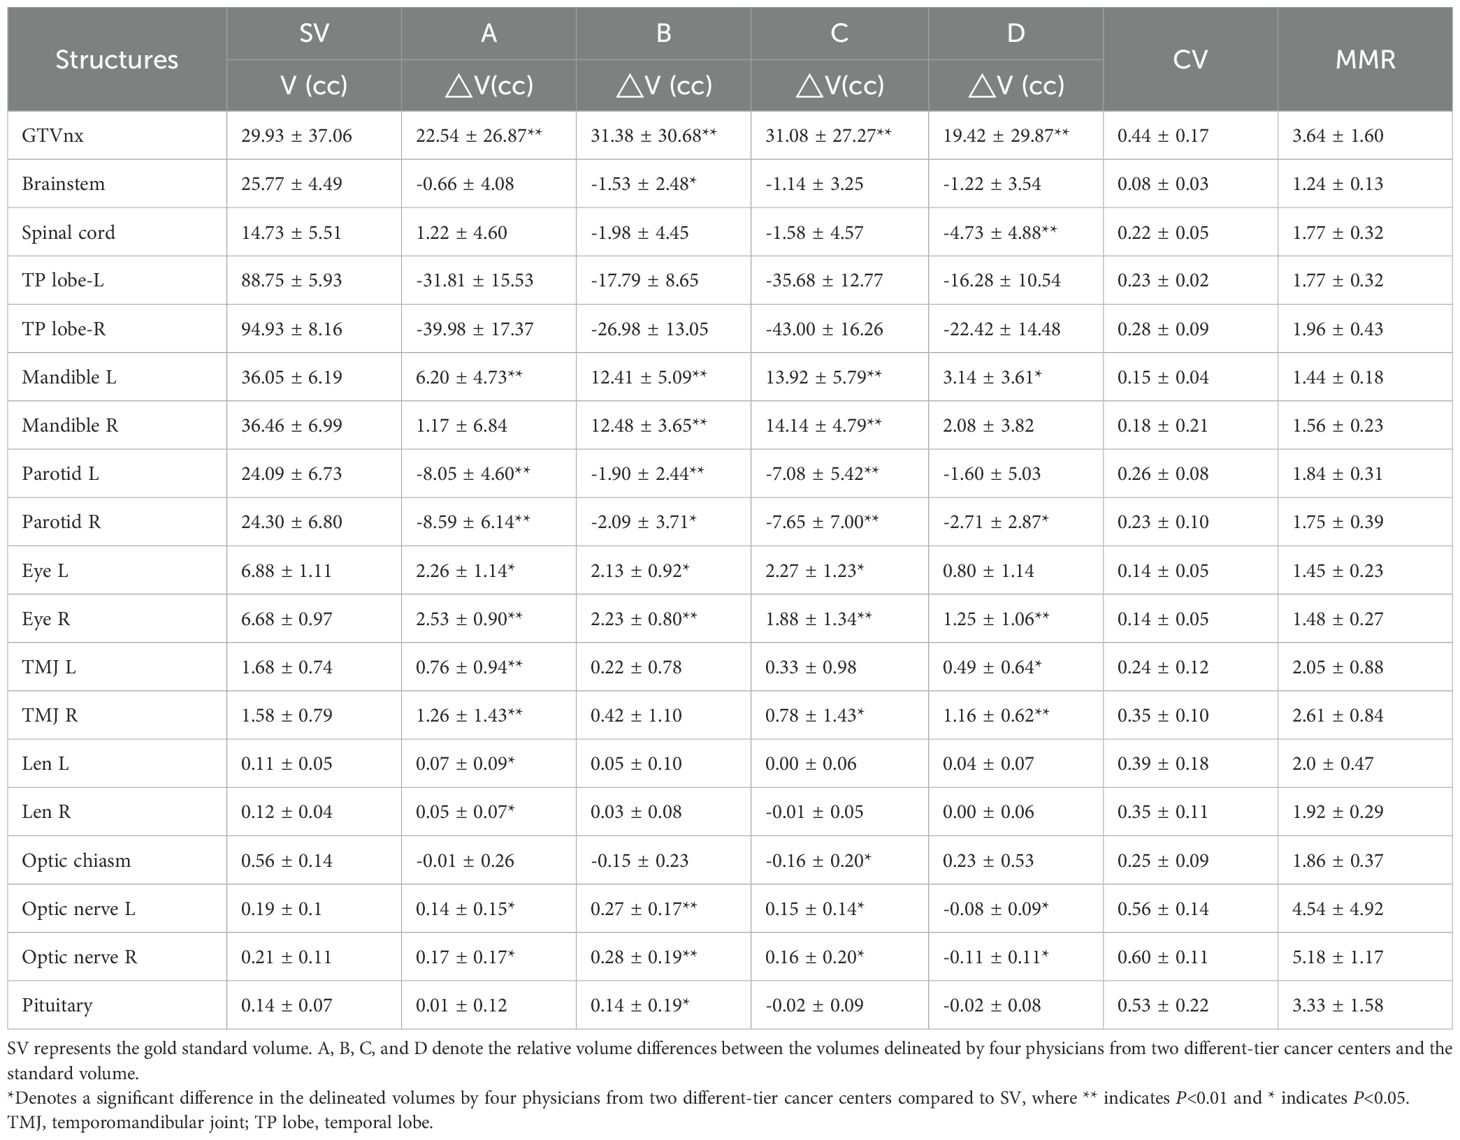
Table 1. Volume differences for structures delineated by four physicians versus the gold standard structure.
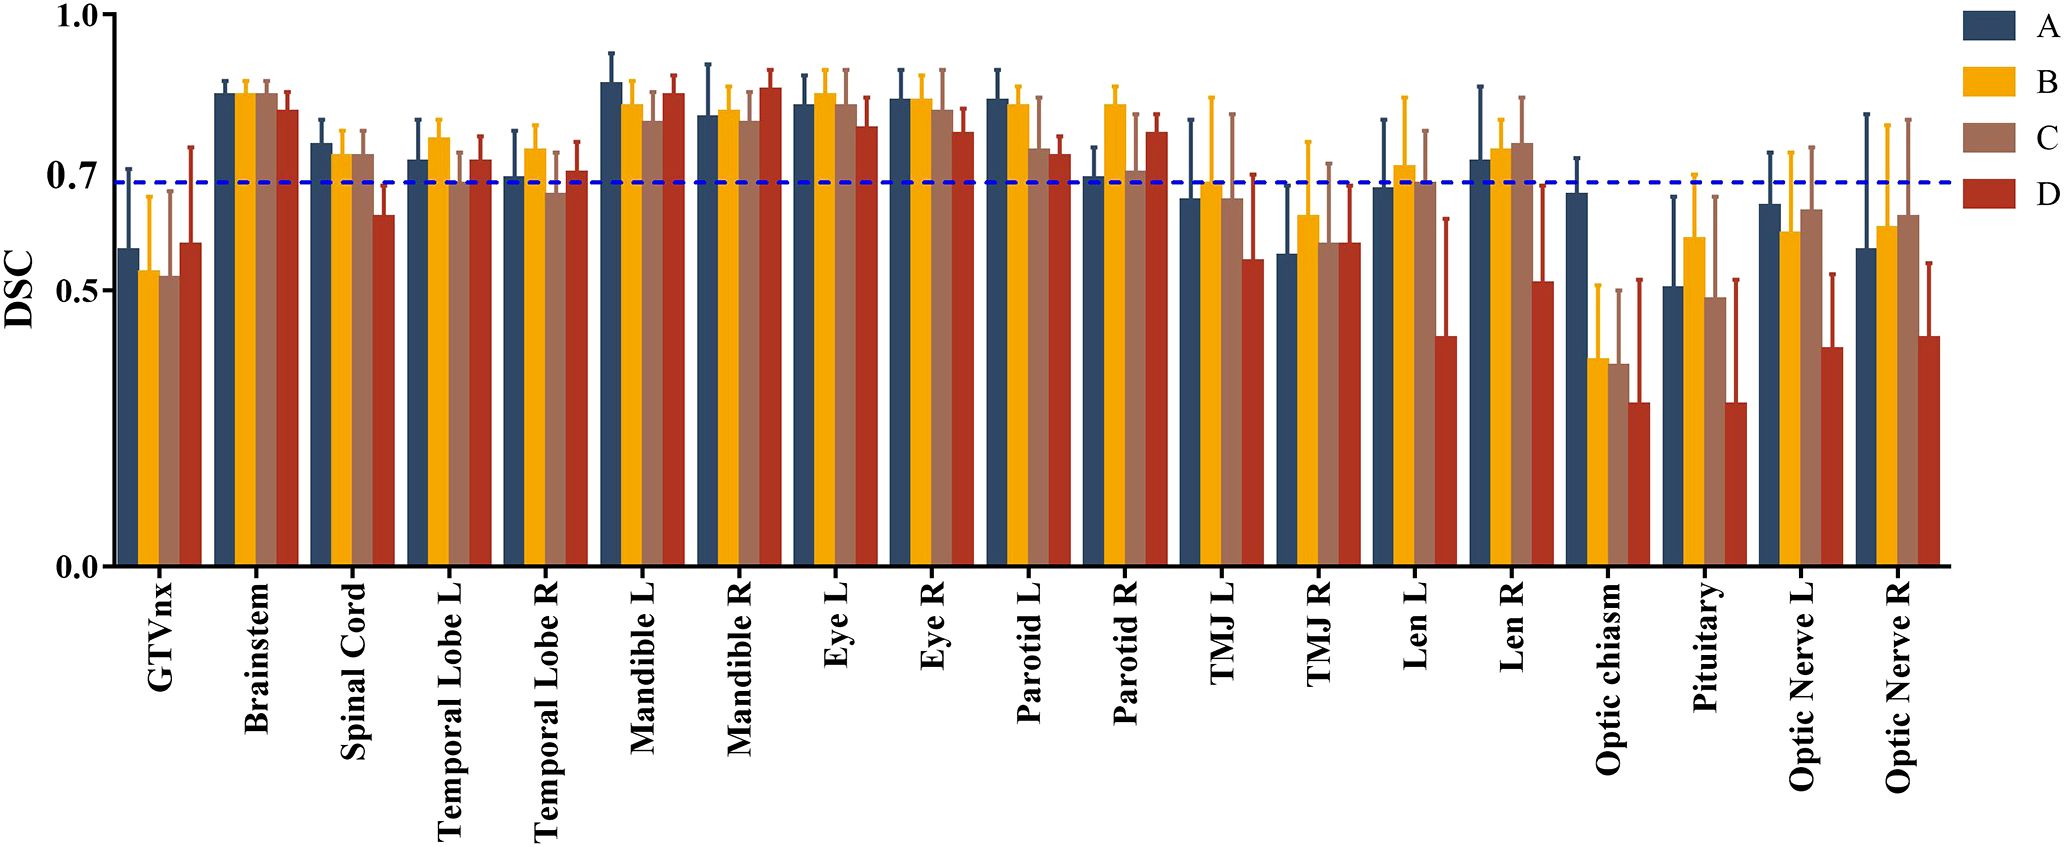
Figure 1. Comparison of Dice similarity coefficients (DSCs) between structures delineated by four physicians from the county and city-level cancer centers and the gold standard volume. (A–C) represent the DSCs between three physicians from city cancer centers and the gold standard. (D) represents the DSC between the physician from a county-level cancer center and the gold standard.
Supplementary Table 3 displays the HD95 values between the delineations of the four physicians. For critical OARs, including the spinal cord, eyes, temporomandibular joint, lenses, optic nerves, and pituitary, the HD95 values for the delineations by Doctor D, a county-level physician, were markedly greater than those of the other three city cancer center physicians.
3.2 IOV in dose distribution in treatment planning
The mean PDC values for treatment plans devised at the county and city cancer centers exhibited varying degrees of decline, with the most pronounced reduction observed in one city planning group, where the average PDC% decreased by >10%. Moreover, in treatment plans originating from these centers, doses of OARs increased to differing extents. Among these organs, dose variations for the brainstem, spinal cord, and mandibles were relatively minor, with average relative dose differences<20%. In contrast, dose differences for the optic nerves and optic chiasm were considerably larger, with average relative dose differences >50% (Table 2).
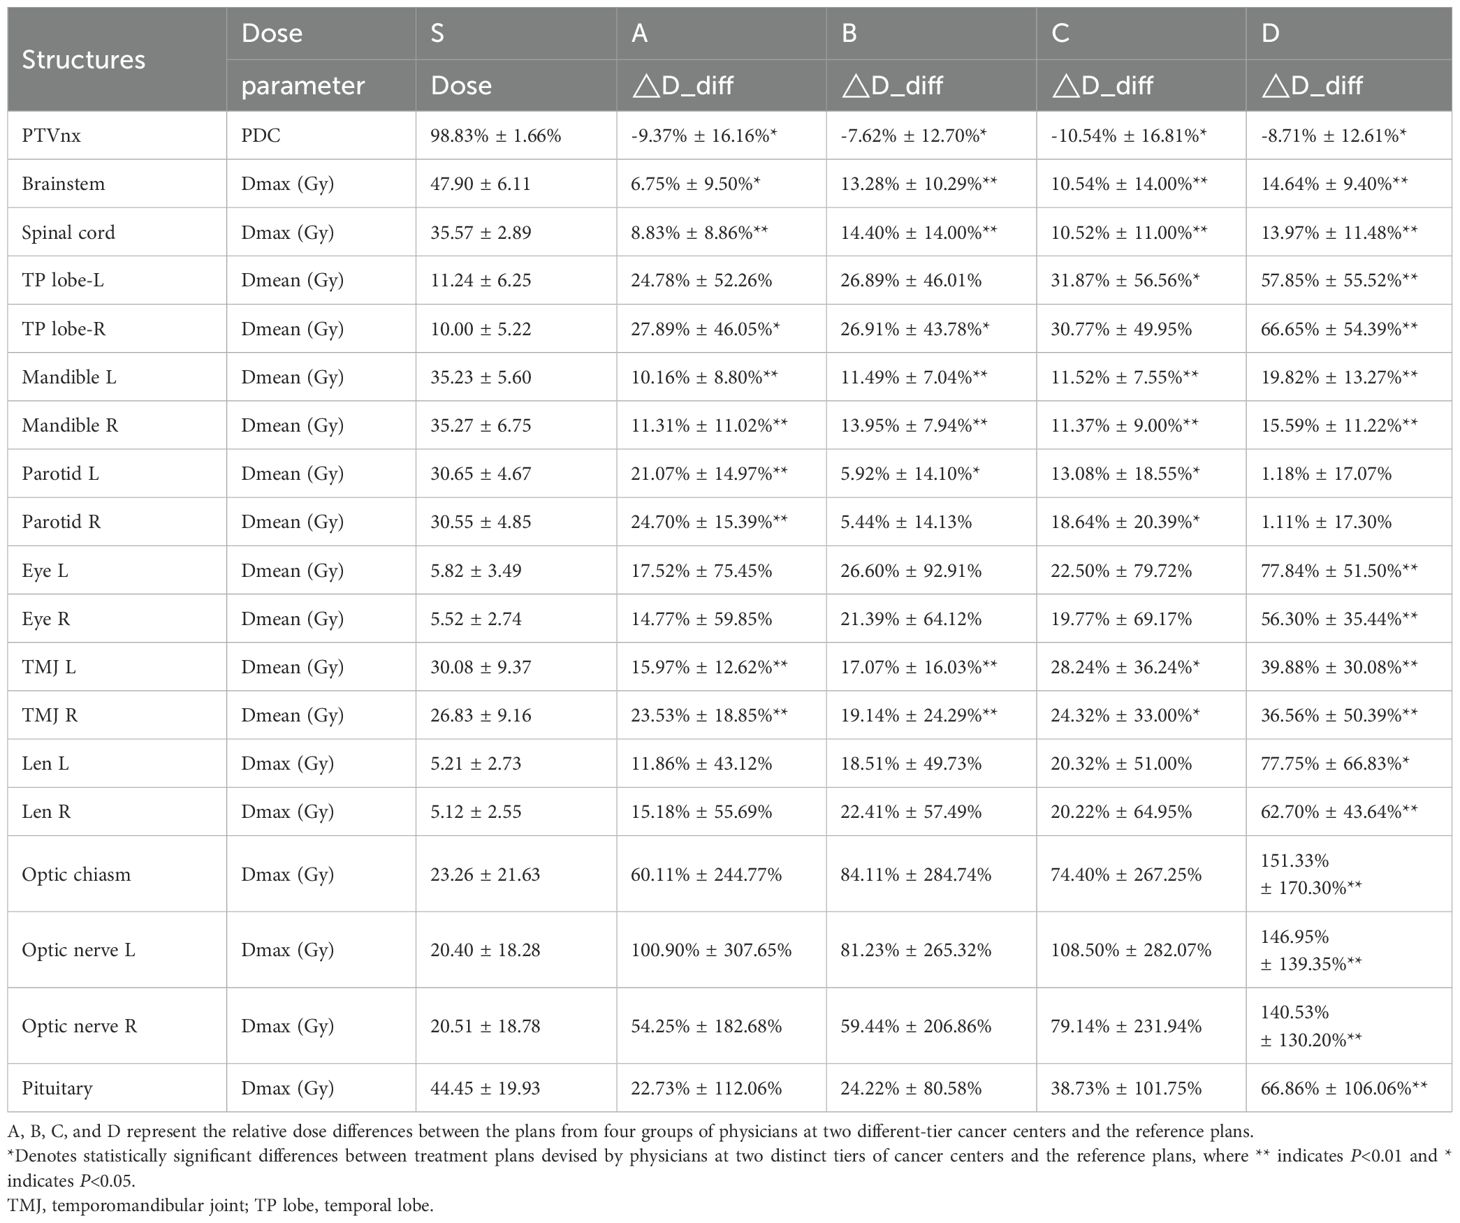
Table 2. Relative dosimetric differences between treatment plans designed by the four physicians and the reference gold standard plan.
Figure 2 illustrates the dose distribution for plans designed by two physicians from a county or city cancer center for a specific patient. Compared to the gold standard plan Figure (Figure 2S), (Figure 2A) indicated that the plan developed at the county or city cancer center demonstrated inadequate PDC due to suboptimal target volume delineation. Conversely, Figure 2B shows an overt spillage of the prescription dose beyond the intended target volume due to an overly expansive target volume delineation by a physician from county or city cancer center.
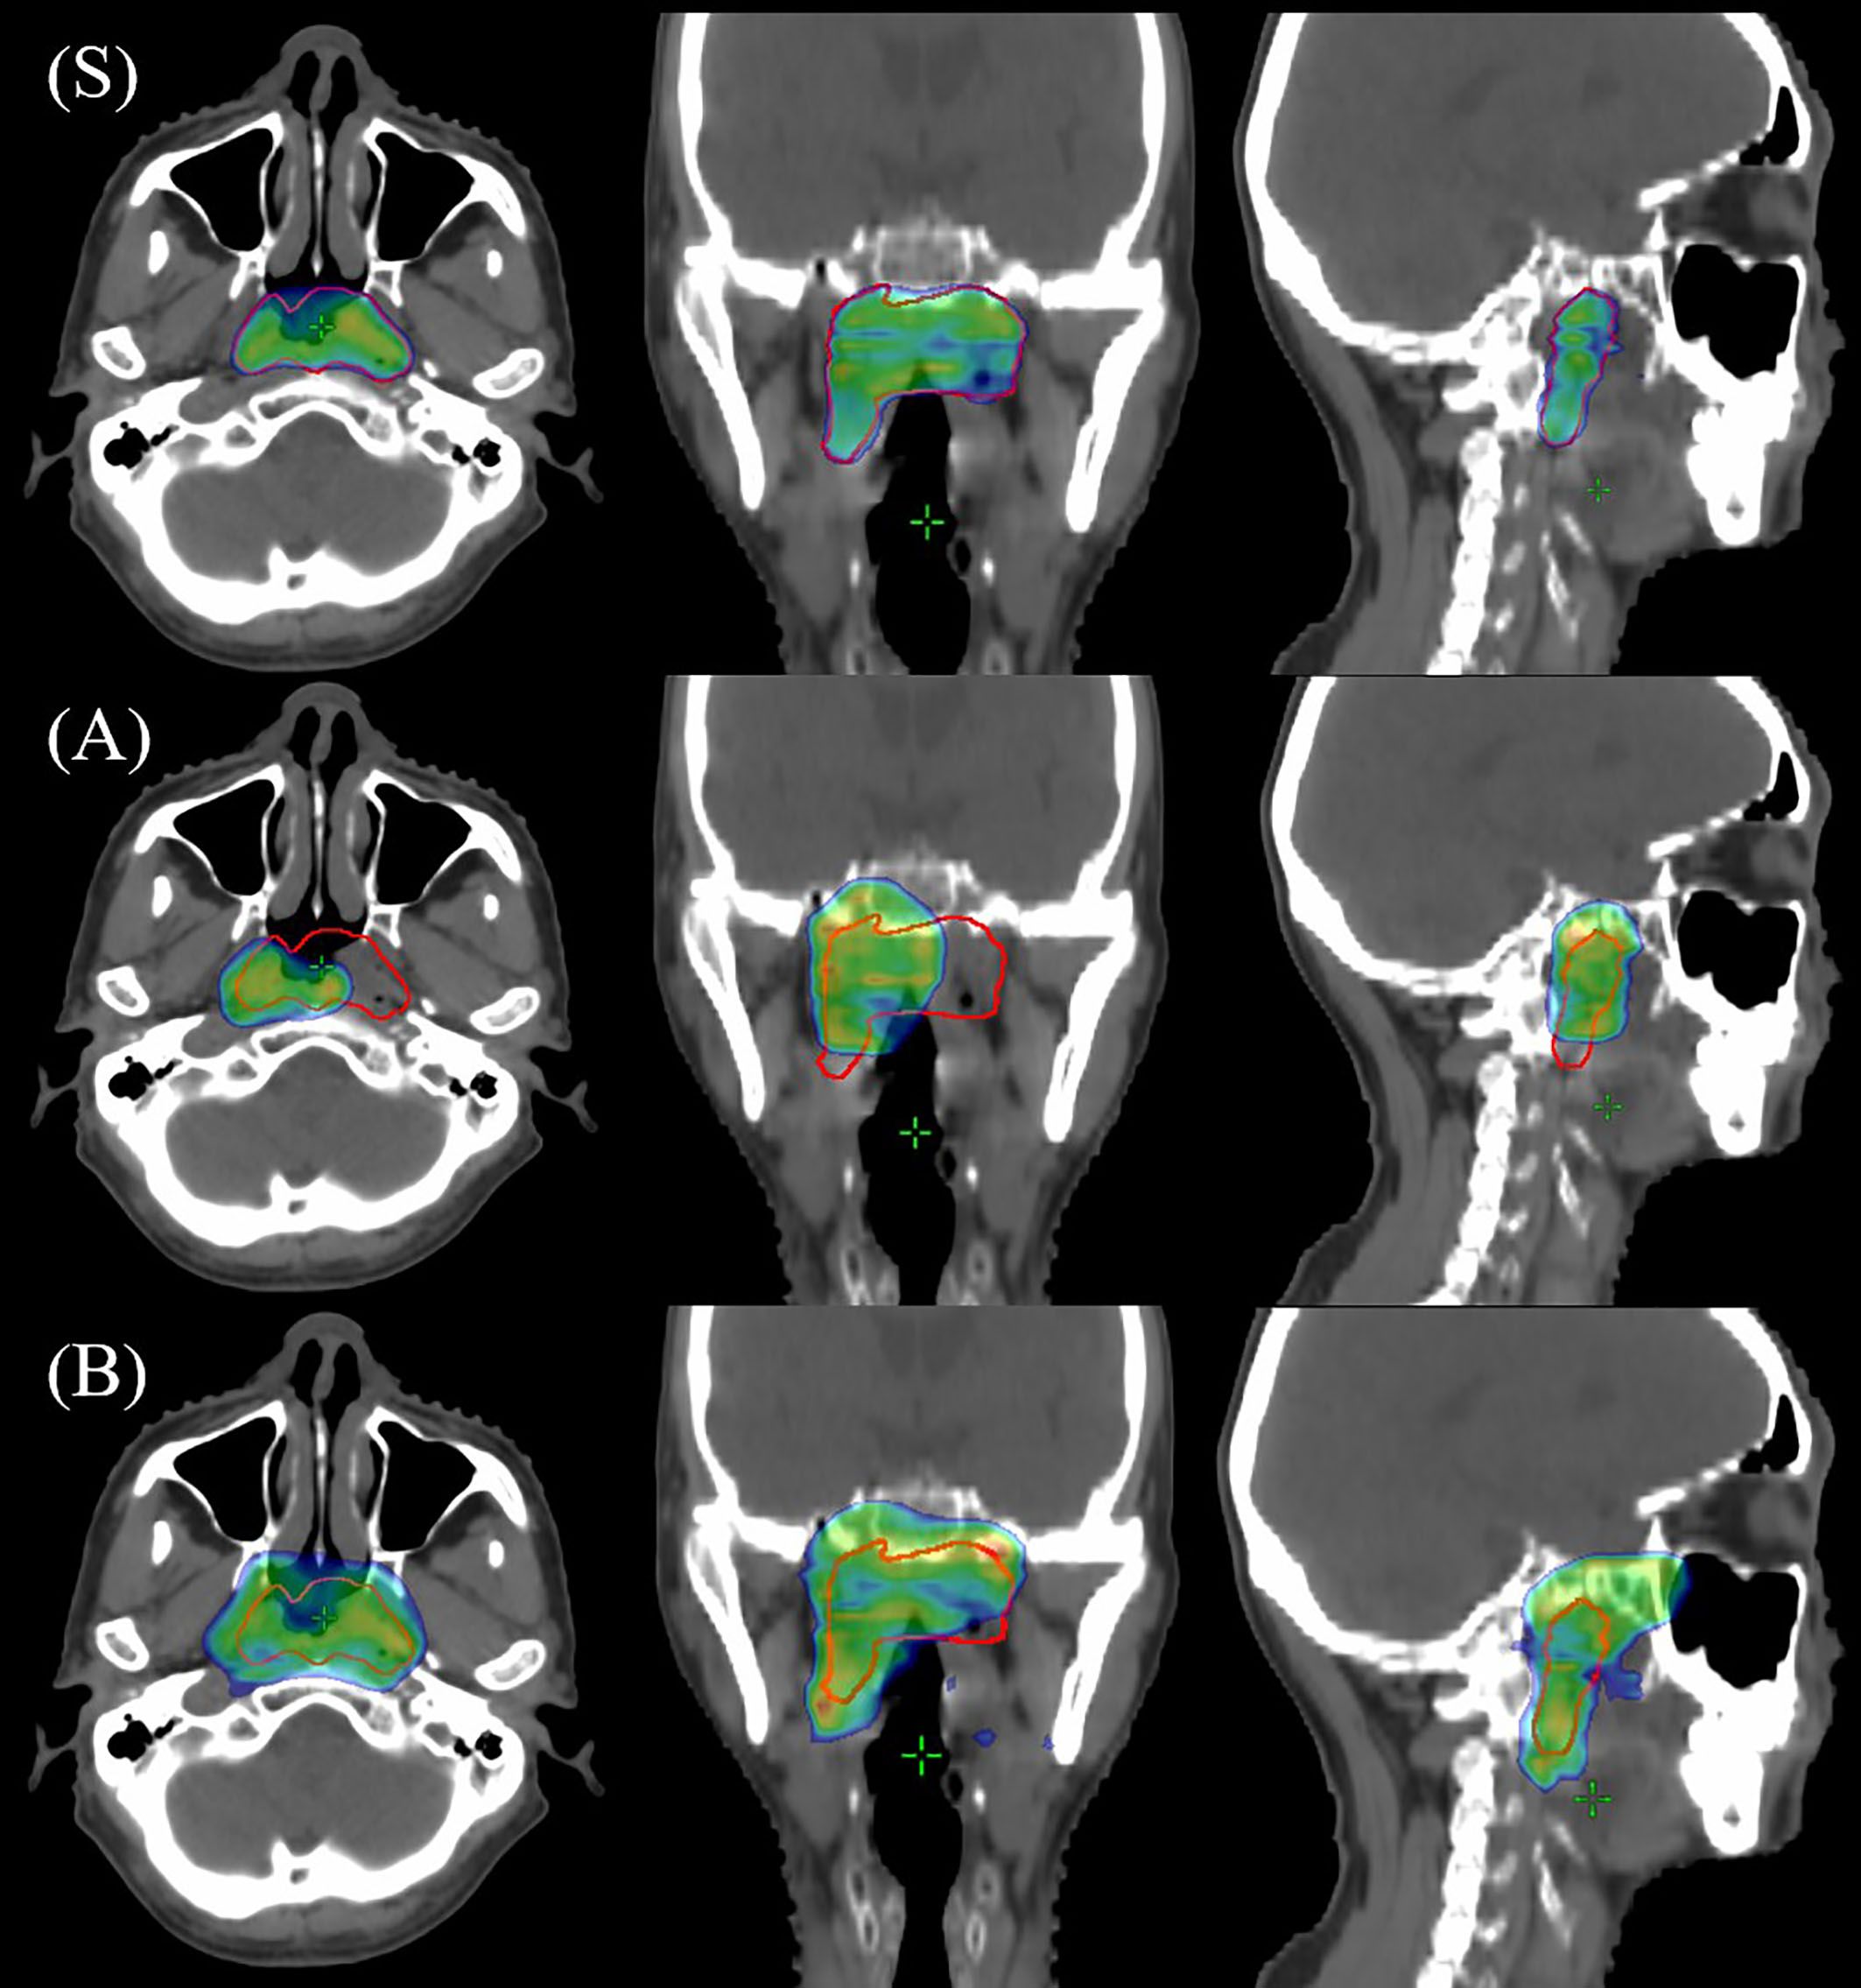
Figure 2. Comparison of prescription dose distributions between physician treatment plans and the gold standard reference plan. (S) illustrates the dose distribution for the gold standard reference plan. (A, B) depict the dose distributions of two distinct treatment plans, each devised by a physician from the city or county cancer center, respectively.
3.3 IOV and clinical prognosis
Table 3 presents the differences in TCP and NTCP between the treatment plans designed by physicians and the gold standard plans. Compared to the gold standard plans, the TCPs for the target volumes decreased by >1% in the plans designed by the physicians, with some patients experiencing a significant decline of up to 17.83%. Additionally, the NTCPs for the physician plans increased, with the most notable increase observed in the optic chiasm, where the ΔNTCP exceeded 4.9% compared to that of the gold standard plan.
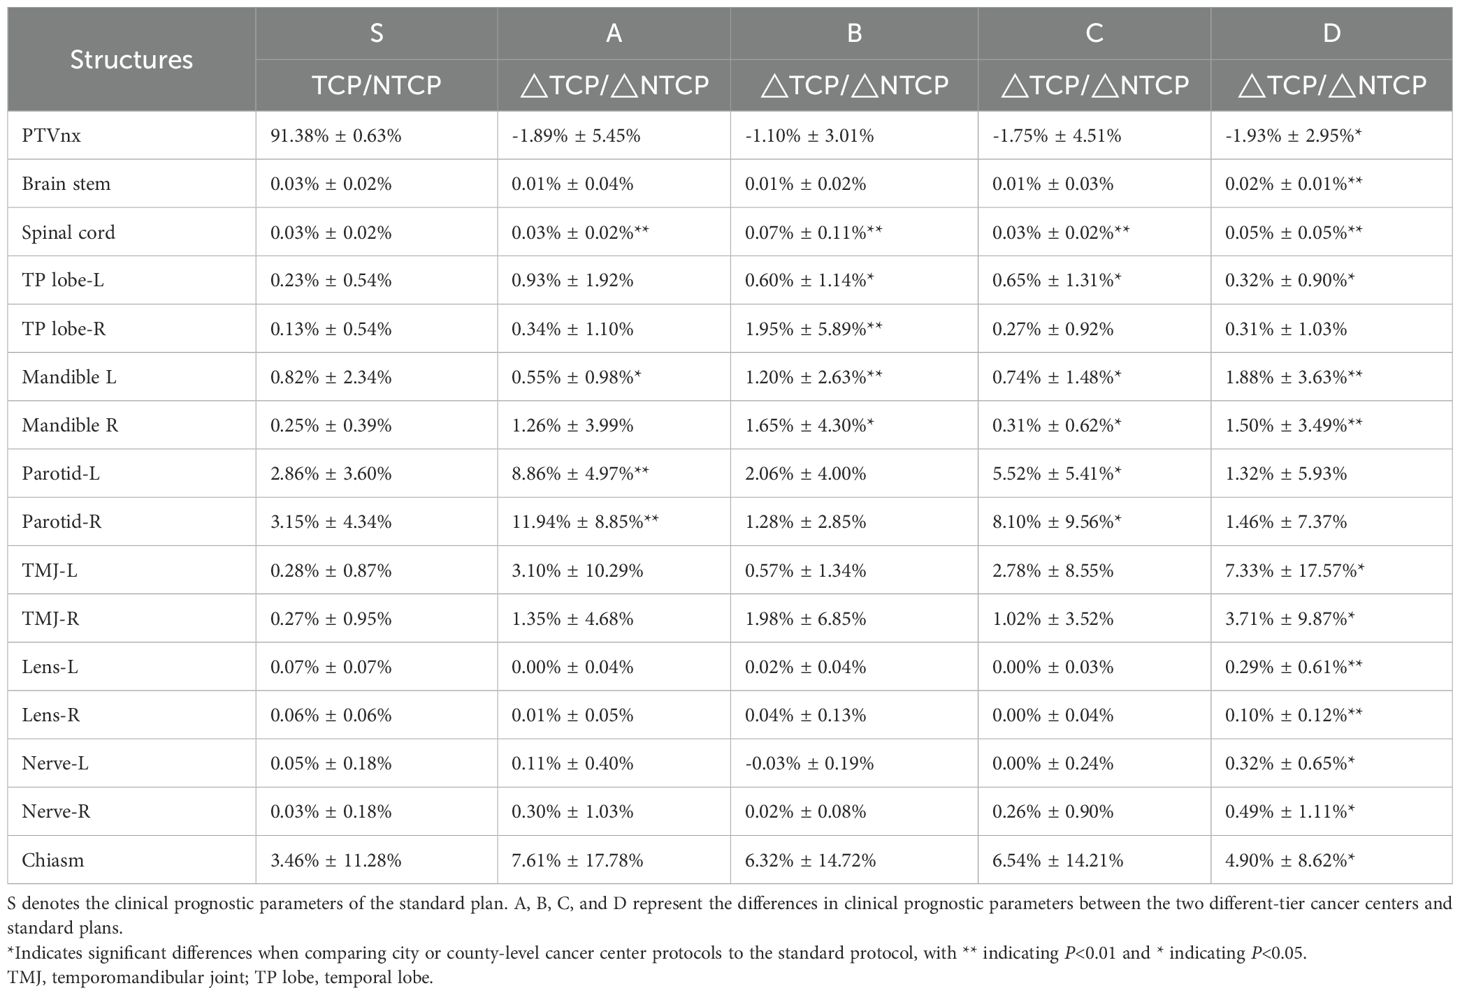
Table 3. Clinical prognostic evaluation parameters between treatment plans from the four physicians and the gold standard plan.
3.4 Correlation between delineation variability, dosimetry, and clinical prognosis
Figure 3 illustrates the correlation between geometric evaluation metrics of GTVnx, OARs, and PTVnx regarding the ΔPDC and ΔTCP. The ΔV for GTVnx strongly correlated with the ΔPDC of PTVnx (R=0.686, P<0.01). HD95 for the left mandible moderately correlated with ΔPDC of PTVnx (R=0.405, P<0.01), while other metrics demonstrated weak or no correlation with ΔPDC. Additionally, ΔV of GTVnx strongly correlated with ΔTCP of PTVnx (R=0.703, P<0.01). The ΔV of the left temporal lobe moderately correlated with ΔTCP of PTVnx (R=-0.401, P<0.01); other metrics displayed weak or no correlation with ΔTCP.
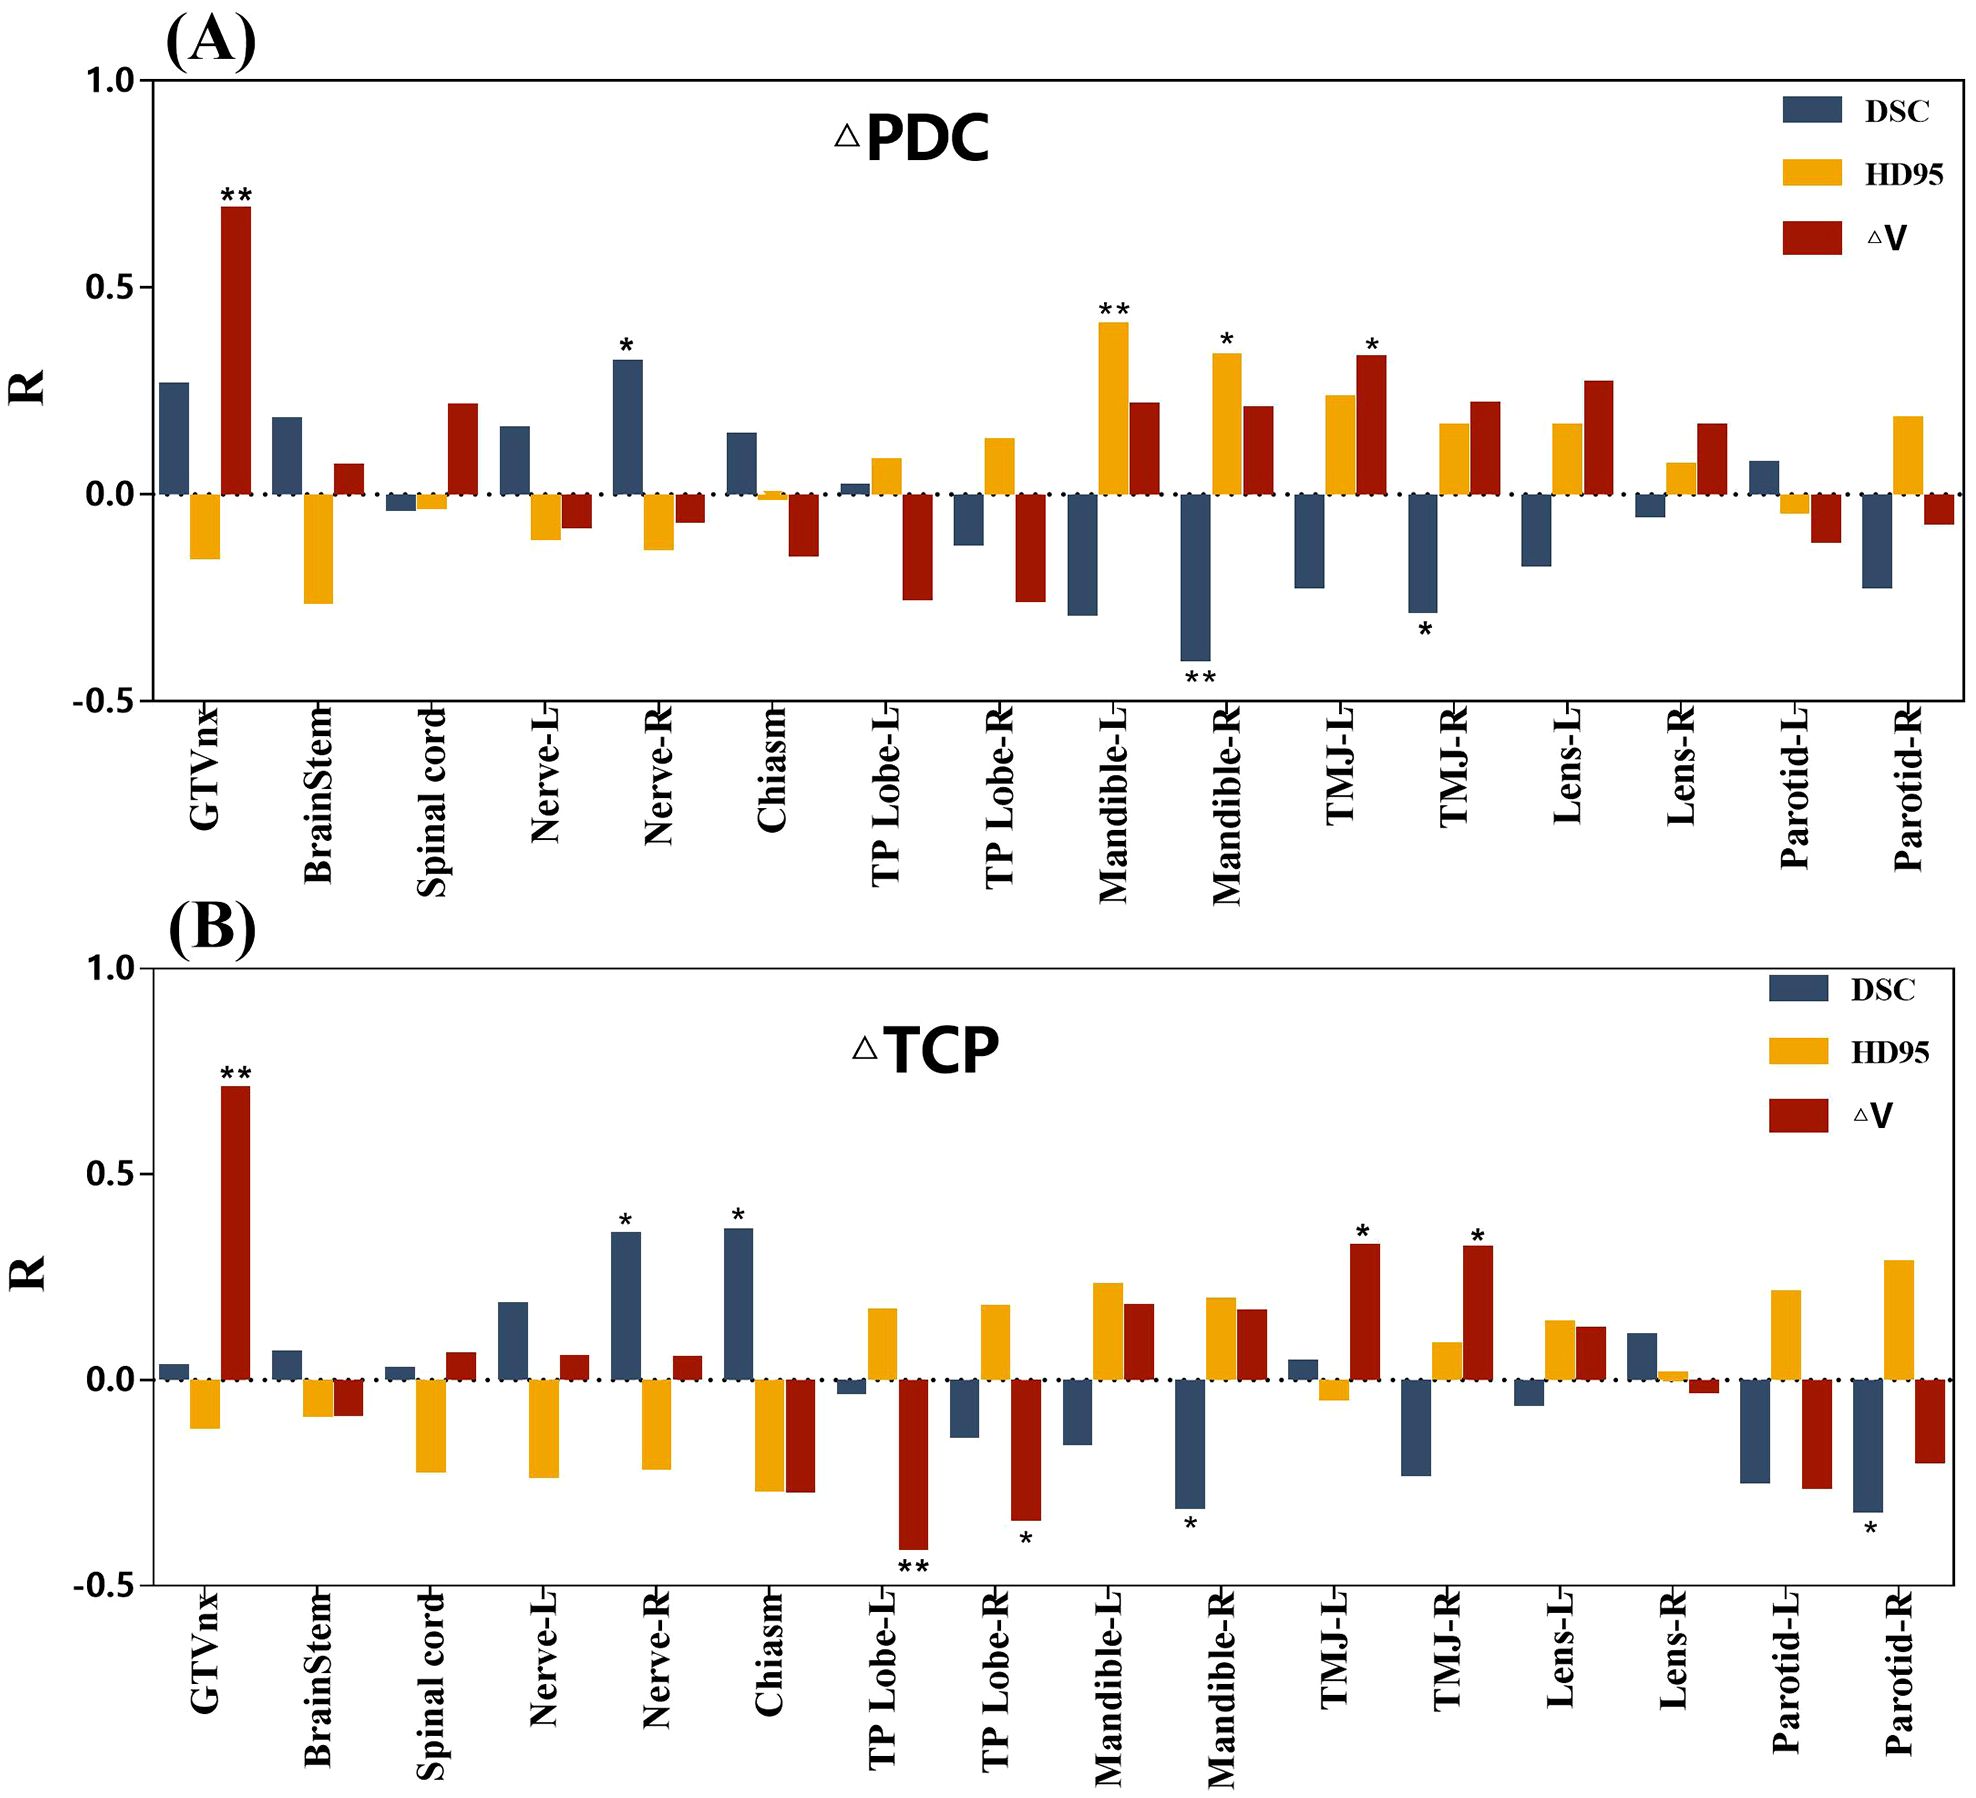
Figure 3. Correlations between geometric evaluation metrics and change in prescription dose coverage (ΔPDC) and change in tumor control probability (ΔTCP). (A) R values representing correlations between gross tumor volume of the nasopharynx (GTVnx) and various organs at risk (OARs) with ΔPDC. (B) R values representing correlations between GTVnx and various OARs with ΔTCP. Significant correlations between geometric evaluation parameters and ΔPDC or ΔTCP are indicated, with ** indicating P<0.01 and * indicating P<0.05. TMJ, temporomandibular joint; TP lobe, temporal lobe.
3.5 Predictive factors for IOV risk
The delineation outcomes in the validation set revealed that only the ΔV of GTVnx may be a predictive factor for IOV risk. ΔV exhibited strong and moderate correlations with ΔTCP (R=0.778) and ΔPDC (R=0.596) of PTVnx, respectively (Figures 4A, B). In contrast, HD95 for the left mandible showed a weak or no correlation with ΔPDC of PTVnx, and the same was observed between the left temporal lobe and ΔTCP of PTVnx (Figures 4C, D).
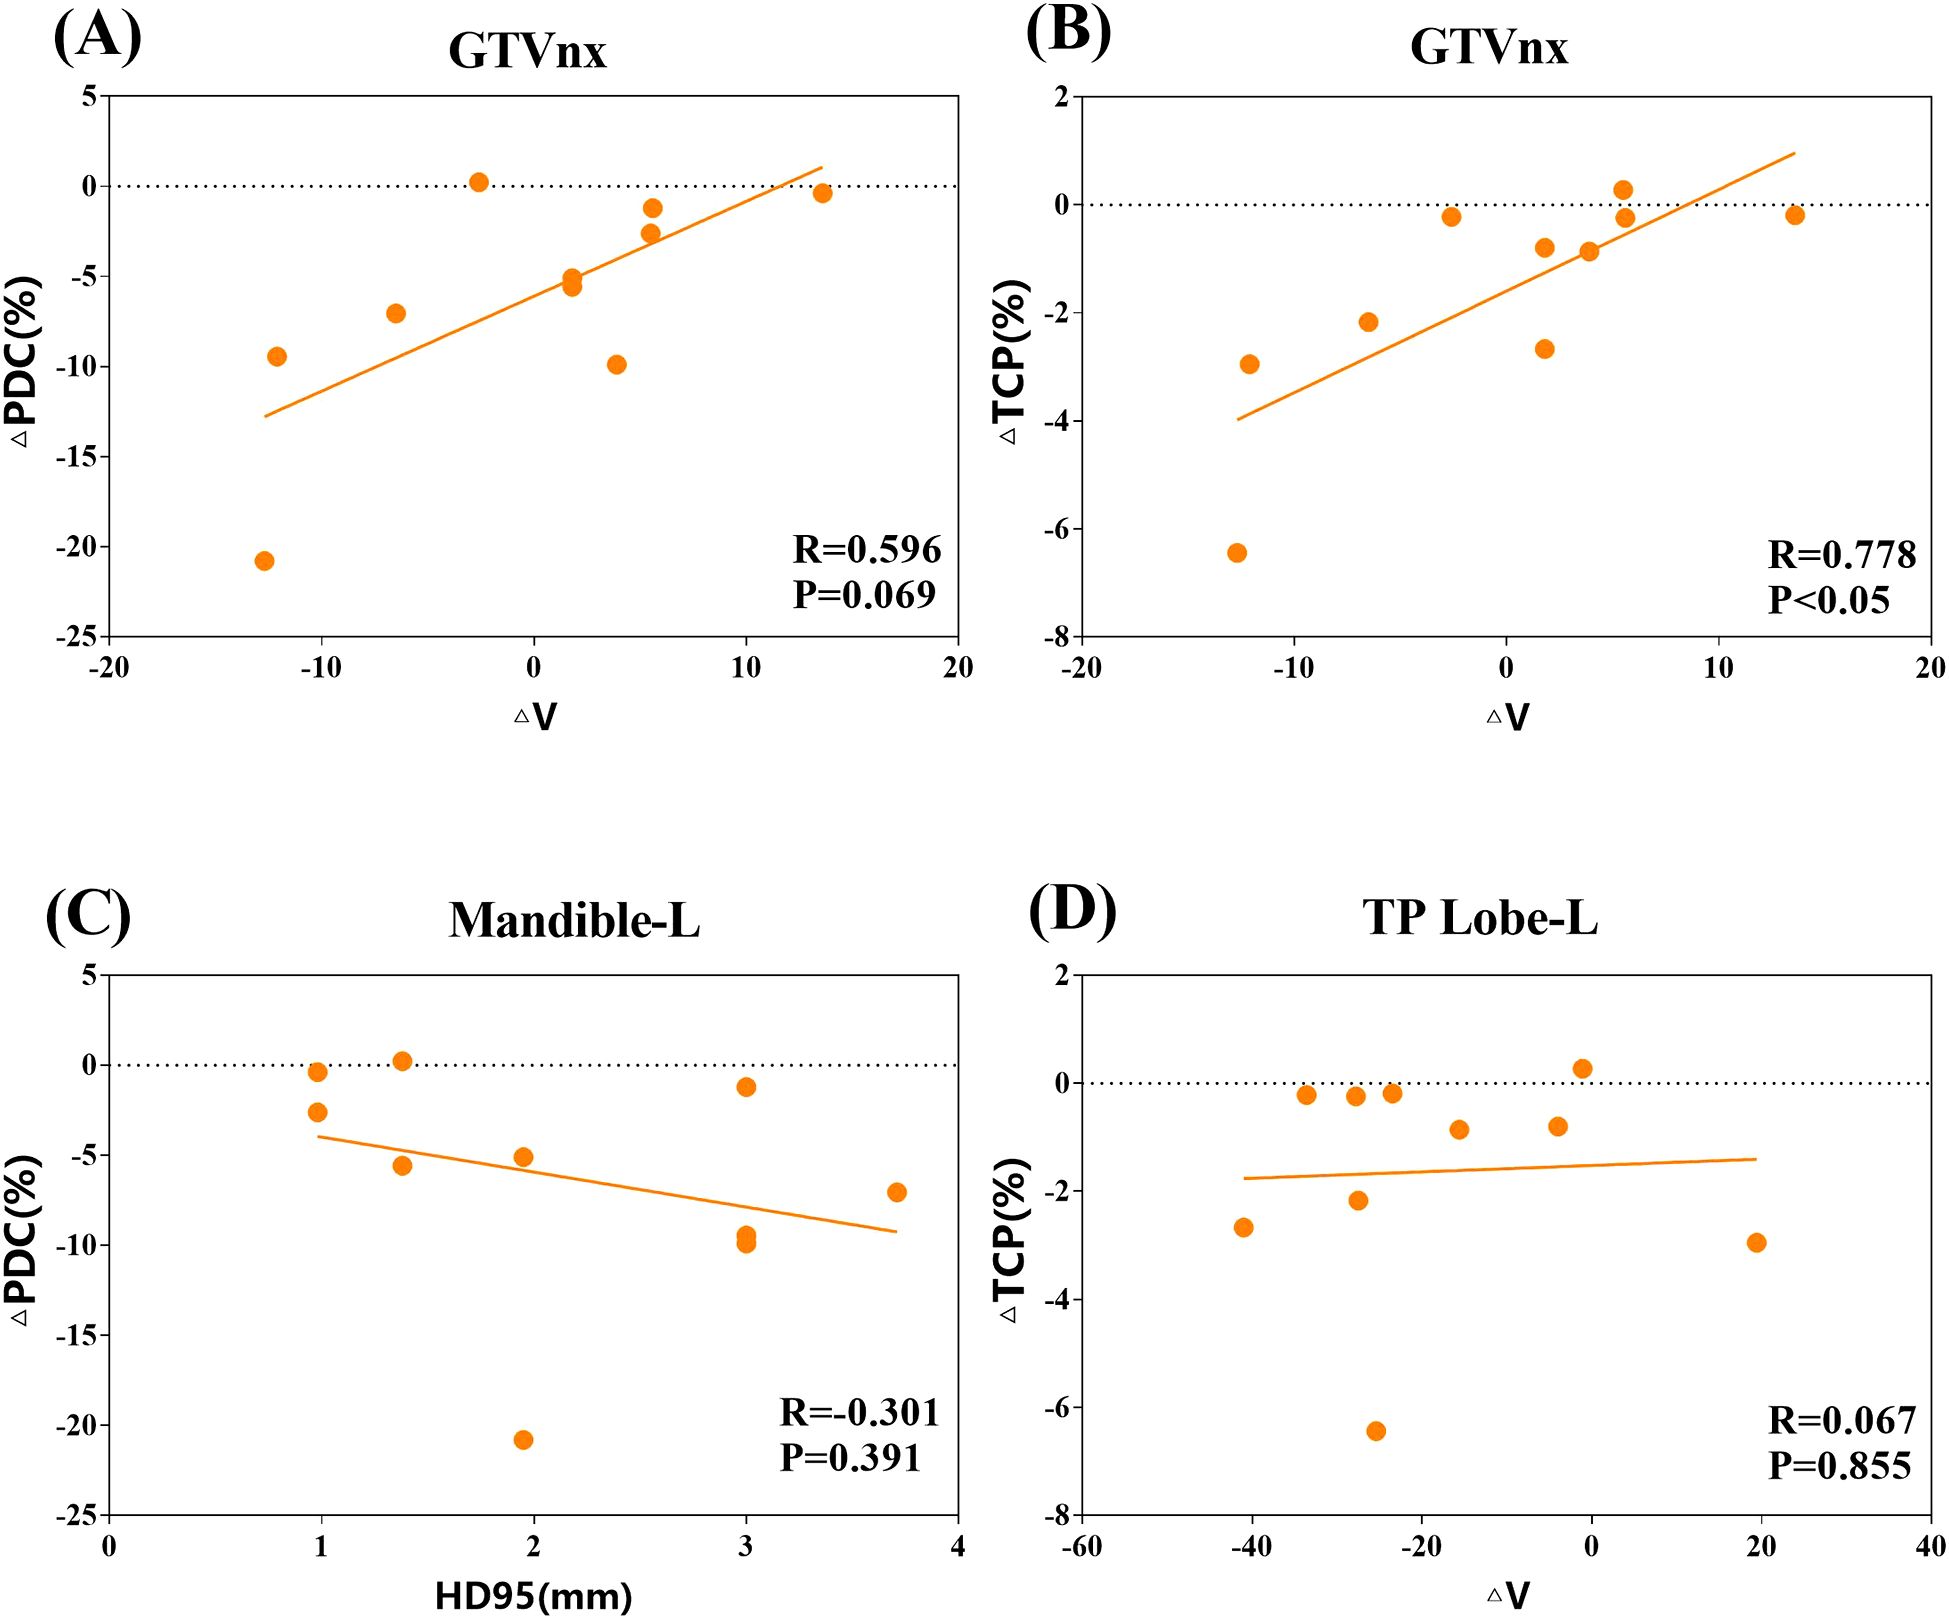
Figure 4. Correlations between delineation risk predictors in the validation cohort. (A, B) Correlations between the relative volume difference of the gross tumor volume of the nasopharynx (ΔV) and change in prescription dose coverage (ΔPDC), as well as change in tumor control probability (ΔTCP), respectively, in the validation set. (C) Correlation between the 95% Hausdorff distance (HD95) value for the left mandible and ΔPDC in the validation set. (D) Correlation between ΔV for the temporal lobe L and ΔTCP in the validation cohort.
4 Discussion
Existing studies have analyzed the magnitude of IOV in contouring target volumes and OARs in NPC patients, highlighting the significant impact of IOV on dose distribution in radiotherapy treatment plans (13, 14). However, the narrow focus on numerical differences in contouring may have limited clinical value, particularly when geometric evaluations fail to establish a direct and clear correlation with optimized dose distributions and long-term patient prognosis. Merely quantifying delineation variability cannot guide clinical decisions, optimize treatment plans, or predict treatment prognosis.
Our findings revealed significant differences in contouring NPC target volume and OARs among physicians and the gold standard, particularly for small-volume organs with ambiguous boundaries, with mean DSC values consistently<0.7 and mean MMR values >3. More critically, this IOV has tangible impacts on dose distributions in treatment plans. In this study, the mean PDC values for PTVnx decreased by varying degrees, with the most affected plan groups experiencing PDC reductions >10%. This significant deviation falls well below the PDC > 95% standard recommended by the RTOG0225 (29) and RTOG0615 (30) guidelines, leading to a notable decrease in the patients’ 5-year survival rate (31). Furthermore, the doses delivered to OARs increased by varying degrees, particularly affecting the optic nerves and chiasm. Compared to the standard treatment plan, the average Dmax values for all plan groups increased by > 50%, indicating that some patients received radiation doses far exceeding the safe upper limit set by the guidelines (Dmax< 60Gy) (24). This situation has had a significant negative impact on patients’ visual field and contrast sensitivity, potentially leading to vision loss (32). Peng et al. (13) observed similar decreases in PDC for PTVnx and increases in dose parameters for the optic nerves and chiasm in a multicenter study comparing NPC organ delineation variation. Moreover, any errors in delineating target volume and OARs can lead to reduced PDC for targets and increased OAR dose parameters, increasing the risk of recurrence and potentially causing severe radiation complications (7, 33, 34). Our findings revealed that TCP decreased by >1% across physician treatment plans from city or county-level cancer centers, while the NTCP for OARs increased, with the NTCP for the optic chiasm exceeding 4.9%.
This study investigated the associations between IOV in NPC target volume delineation, dosimetric parameters, and clinical prognosis (TCPs). Our findings revealed that changes in PTVnx (ΔPDC) correlated significantly with the relative volume differences (ΔV) in GTVnx in both the experimental and validation sets, albeit with differing sensitivities. Furthermore, commonly used DSC and ASSD indices were not sensitive enough to predict changes in target coverage and ΔTCP. This observation aligns with the seminal work of Voet et al. (35) who systematically reported no significant correlation between these geometric metrics and ΔPDC. Notably, even when achieving satisfactory contour consistency thresholds (e.g., DSC ≥ 0.8 and ASSD< 1 mm), substantial degradation in prescription dose coverage (up to 11 Gy) was observed in some cases. Roach et al. (12) analyzed that this reason might stem from the inherent limitations of DSC and ASSD in distinguishing between observer contours positioned inside versus outside the SVs. In contrast, ΔV more accurately reflects the extent of target over-contouring and its impact on ΔPDC.
Moreover, Jameson et al. (17). reported that variation in target volume exhibited a higher correlation with TCP than other geometric evaluation indicators in lung cancer. However, unlike the strong correlation (|R| = 0.778, P<0,01) demonstrated in this study, it exhibits a weak correlation. (|R| = 0.42, P<0.01). This discrepancy may be due to their study utilizing 3D-CRT treatment plans, as opposed to IMRT treatment planning incorporated in this study. IMRT treatment plans generate steeper dose gradients around the target volumes, increasing the sensitivity of target volume dosimetry to inter-observer contouring variations.
This study reveals significant interobserver variations in target volume and OARs delineation among radiation oncologists across different-tier cancer centers, with these discrepancies potentially impacting TCP in treatment planning. To enhance quality control in radiotherapy contouring, we propose the following evidence-based strategies: (1) Establish target-priority contouring principles. The biggest complication of cancer treatment is tumor recurrence. Therefore, when it is considered that there is an overlap between the tumor target area and the OAR, this area should be included in the target delineation scope first. (2) Through systematic training and education, the proficiency of physicians at municipal and county-level tumor centers in mastering guidelines can be improved, thereby narrowing the gap in their delineation experience and reducing delineation differences (5). (3) Utilizing multi-modal imaging techniques such as MRI/PET-CT to assist in organ delineation can improve the accuracy and consistency of delineation, further reducing the differences between physicians. A representative study in non-small cell lung cancer revealed that FDG-PET/CT-guided contouring achieved a tumor control probability (TCP) of 24.0 ± 5.6%, representing a 3.8-fold increase compared to CT-only approaches (6.3 ± 1.5%, p<0.001) (36). This modality fusion strategy effectively minimizes clinician-dependent contouring variations while enhancing dosimetric planning reliability. (4) Promoting the use of automatic delineation methods (such as ABAS or AI-based systems) can significantly reduce inter-observer variability (IOV) while improving efficiency (15, 37, 38). Mavroidis et al. (39) demonstrated that implementation of the ABAS automated contouring software in rectal cancer significantly improved TCP for target volumes while reducing NTCP for the small intestine. In addition, we propose enhancing current AI contouring models through two clinically-grounded strategies: establishing a standardized delineation repository by selecting radiotherapy plans from patients demonstrating optimal clinical outcomes, with precise extraction of target volume and OAR anatomical configurations. And implementing deep neural networks with integrated confidence estimation modules, trained on prognosis-optimized datasets to create AI-assisted contouring systems. Such outcome-driven intelligent systems are anticipated to not only enhance segmentation precision but also standardize implementation protocols, thereby improving radiotherapy efficacy consistency and ultimately optimizing both patient survival quality and clinical benefits. (5) The introduction of the cross-review mechanism, through peer or superior physician review and discussion, can improve planners’ understanding of medical images and improve delineation accuracy. (6) Prioritize the systematic integration of inter-observer variability (IOV) quantification into radiotherapy contouring workflows, particularly for defining PTV/PRV margins for GTV or critical OARs, through rigorous analysis of large-scale multi-institutional datasets and validation via prospective clinical trials incorporating dose accumulation analytics, to ensure dosimetrically optimized treatment safety and protocol standardization.
This study still faces certain limitations. First, we have not conducted systematic comparisons between individual contouring structures and clinical guidelines/consensus standards, nor performed quantitative assessments of their compliance. Future research could establish a guideline-based validation framework, implementing statistical comparisons between multi-observer results and established specifications to provide more actionable quality control recommendations for clinical practice. Second, the TCP calculation formula only evaluates the influence of physical parameters of radiotherapy plan, and does not involve the possible influence of other clinical factors (such as combination chemotherapy, targeted therapy, etc.) on treatment results. Therefore, ΔV demonstrates strong predictive value for short-term treatment responses, such as dose distribution. However, its utility in predicting long-term survival outcomes, like overall survival or progression-free survival, may be limited. This is because most clinical treatments for NPC are combined with chemoradiotherapy, targeted therapy, immunotherapy, etc. Third, constrained by the current cohort size, we were unable to perform stratified subgroup analyses to explore potential confounding variables. To address this, subsequent phases of research will prioritize expanding the patient population and conducting hypothesis-driven subgroup analyses. Specific focus will be directed toward variables such as tumor stage, baseline functional status, and operator-dependent factors (e.g., physician contouring experience), aiming to elucidate modifiers of the observed IOV-outcome correlations.
5 Conclusion
Physicians exhibit notable variability in the contouring of target volumes and OARs in NPC patients, particularly in delineating target volumes and small-volume OARs. This IOV impacts the optimization of treatment planning and the precision of dose distribution and may lead to reduced TCP and increased NTCP for OARs. We also noted that ΔV was strongly correlated with changes in TCP, potentially serving as a predictive factor for assessing the risk of IOV. This predictive capability holds prospective implications for clinical outcomes, offering insight into the potential effectiveness of therapeutic interventions.
Data availability statement
The datasets presented in this study can be found in online repositories. The names of the repository/repositories and accession number(s) can be found below: the Research Data Deposit (RDD Number: RDDA2025402178, https://www.researchdata.org.cn).
Ethics statement
This study involving humans were approved by the Institutional Review Board of Sun Yat-sen University Cancer Center (ID: B2024-111-01) .The patients/participants provided their written informed consent to participate in this study.
Author contributions
MC: Formal analysis, Methodology, Writing – original draft, Conceptualization, Investigation, Writing – review & editing. YP: Conceptualization, Methodology, Project administration, Writing – review & editing. RC: Investigation, Resources, Writing – review & editing. QX: Investigation, Data curation, Writing – review & editing. DC: Investigation, Data curation, Writing – review & editing. JS: Investigation, Data curation, Writing – review & editing. RH: Investigation, Data curation, Writing – review & editing. JZ: Formal analysis, Investigation, Writing – review & editing. CZ: Resources, Supervision, Writing – review & editing. LC: Supervision, Writing – review & editing. XD: Funding acquisition, Resources, Writing – review & editing. YL: Writing – review & editing.
Funding
The author(s) declare that financial support was received for the research and/or publication of this article. This work was jointly supported by the National Key R&D Program of China (2023YFC2413900 and 2022YFC2402304), Science and Technology Program of Guangzhou, China (202206010154).
Conflict of interest
The authors declare that the research was conducted in the absence of any commercial or financial relationships that could be construed as a potential conflict of interest.
Generative AI statement
The author(s) declare that no Generative AI was used in the creation of this manuscript.
Publisher’s note
All claims expressed in this article are solely those of the authors and do not necessarily represent those of their affiliated organizations, or those of the publisher, the editors and the reviewers. Any product that may be evaluated in this article, or claim that may be made by its manufacturer, is not guaranteed or endorsed by the publisher.
Supplementary material
The Supplementary Material for this article can be found online at: https://www.frontiersin.org/articles/10.3389/fonc.2025.1510568/full#supplementary-material
References
1. Huang TL, Chien CY, Tsai WL, Liao KC, Chou SY, Lin HC, et al. Long-term late toxicities and quality of life for survivors of nasopharyngeal carcinoma treated with intensity-modulated radiotherapy versus non-intensity-modulated radiotherapy. Head Neck. (2016) 38 Suppl 1:E1026–32. doi: 10.1002/hed.24150
2. Kiang A, Weinberg VK, Cheung KH, Shugard E, Chen J, Quivey JM, et al. Long-term disease-specific and cognitive quality of life after intensity-modulated radiation therapy: a cross-sectional survey of nasopharyngeal carcinoma survivors. Radiat Oncol. (2016) 11:127. doi: 10.1186/s13014-016-0704-9
3. Au KH, Ngan RKC, Ng AWY, Poon DMC, Ng WT, Yuen KT, et al. Treatment outcomes of nasopharyngeal carcinoma in modern era after intensity modulated radiotherapy (IMRT) in Hong Kong: A report of 3328 patients (HKNPCSG 1301 study). Oncol. (2018) 77:16–21. doi: 10.1016/j.oraloncology.2017.12.004
4. Shen G, Xiao W, Han F, Fan W, Lin XP, Lu L, et al. Advantage of PET/CT in target delineation of MRI-negative cervical lymph nodes in intensity-modulated radiation therapy planning for nasopharyngeal carcinoma. J Cancer. (2017) 8:4117–23. doi: 10.7150/jca.21582
5. Dionisi F, Di Rito A, Errico A, Iaccarino G, Farneti A, D’Urso P, et al. Nasopharyngeal cancer: the impact of guidelines and teaching on radiation target volume delineation. Radiol Med. (2023) 128:362–71. doi: 10.1007/s11547-023-01612-x
6. Sun Y, Yu XL, Luo W, Lee AW, Wee JT, Lee N, et al. Recommendation for a contouring method and atlas of organs at risk in nasopharyngeal carcinoma patients receiving intensity-modulated radiotherapy. Radiother Oncol. (2014) 110:390–7. doi: 10.1016/j.radonc.2013.10.035
7. Weber DC, Tomsej M, Melidis C, Hurkmans CW. QA makes a clinical trial stronger: evidence-based medicine in radiation therapy. Radiother Oncol. (2012) 105:4–8. doi: 10.1016/j.radonc.2012.08.008
8. Nelms BE, Tomé WA, Robinson G, Wheeler J. Variations in the contouring of organs at risk: test case from a patient with oropharyngeal cancer. Int J Radiat Oncol Biol Phys. (2012) 82:368–78. doi: 10.1016/j.ijrobp.2010.10.019
9. Feng M, Demiroz C, Vineberg KA, Eisbruch A, Balter JM. Normal tissue anatomy for oropharyngeal cancer: contouring variability and its impact on optimization. Int J Radiat Oncol Biol Phys. (2012) 84:e245–9. doi: 10.1016/j.ijrobp.2012.03.031
10. Liu X, Huang H, Zhu C, Gan Q, Jiang H, Liu P, et al. Interobserver variations in target delineation in intensity-modulated radiation therapy for nasopharyngeal carcinoma and its impact on target dose coverage. Technol Cancer Res Treat. (2023) 22:15330338231169592. doi: 10.1177/15330338231169592
11. Ryan O, Dundas K, Surjan Y, Elwadia D, Nguyen K, Cardoso M, et al. Magnetic resonance imaging organ at risk delineation for nasopharyngeal radiotherapy: measuring the effectiveness of an educational intervention. J Med Radiat Sci. (2023) 70 Suppl 2:59–69. doi: 10.1002/jmrs.651
12. Roach D, Jameson MG, Dowling JA, Ebert MA, Greer PB, Kennedy AM, et al. Correlations between contouring similarity metrics and simulated treatment outcome for prostate radiotherapy. Phys Med Biol. (2018) 63:035001. doi: 10.1088/1361-6560/aaa50c
13. Peng YL, Chen L, Shen GZ, Li YN, Yao JJ, Xiao WW, et al. Interobserver variations in the delineation of target volumes and organs at risk and their impact on dose distribution in intensity-modulated radiation therapy for nasopharyngeal carcinoma. Oncol. (2018) 82:1–7. doi: 10.1016/j.oraloncology.2018.04.025
14. Tao CJ, Yi JL, Chen NY, Ren W, Cheng J, Tung S, et al. Multi-subject atlas-based auto-segmentation reduces interobserver variation and improves dosimetric parameter consistency for organs at risk in nasopharyngeal carcinoma: a multi-institution clinical study. Radiother Oncol. (2015) 115:407–11. doi: 10.1016/j.radonc.2015.05.012
15. Kawula M, Purice D, Li M, Vivar G, Ahmadi SA, Parodi K, et al. Dosimetric impact of deep learning-based CT auto-segmentation on radiation therapy treatment planning for prostate cancer. Radiat Oncol. (2022) 17:21. doi: 10.1186/s13014-022-01985-9
16. Guo H, Wang J, Xia X, Zhong Y, Peng J, Zhang Z, et al. The dosimetric impact of deep learning-based auto-segmentation of organs at risk on nasopharyngeal and rectal cancer. Radiat Oncol. (2021) 16:113. doi: 10.1186/s13014-021-01837-y
17. Jameson MG, Kumar S, Vinod SK, Metcalfe PE, Holloway LC. Correlation of contouring variation with modeled outcome for conformal non-small cell lung cancer radiotherapy. Radiother Oncol. (2014) 112:332–6. doi: 10.1016/j.radonc.2014.03.019
18. Bethesda MD. International Commission on Radiation Units and Measurements. Report 50: Prescribing, recording, and reporting photon beam therapy. ICRU (1993). Available at: https://www.icru.org/report/prescribing-recording-and-reporting-photon-beam-therapy-report-50/.
19. Bethesda MD. International Commission on Radiation Units and Measurements. Report 62: Prescribing, recording and reporting pho- ton beam therapy (supplement to ICRU report 50). ICRU (1999). Available at: https://www.icru.org/report/prescribing-recording-and-reporting-photon-beam-therapy-report-62/.
20. Onkol S. The ICRU Report 83: Prescribing, recording and reporting photon-beam intensity-modulated radiation therapy (IMRT). ICRU (2012). Available at: https://www.icru.org/report/prescribing-recording-and-reporting-intensity-modulated-photon-beam-therapy-imrticru-report-83/ .
21. Hanna GG, Hounsell AR, O’Sullivan JM. Geometrical analysis of radiotherapy target volume delineation: a systematic review of reported comparison methods. Clin Oncol (R Coll Radiol). (2010) 22:515–25. doi: 10.1016/j.clon.2010.05.006
22. Jameson MG, Holloway LC, Vial PJ, Vinod SK, Metcalfe PE. A review of methods of analysis in contouring studies for radiation oncology. J Med Imaging Radiat Oncol. (2010) 54:401–10. doi: 10.1111/j.1754-9485.2010.02192.x
23. Lee N, Xia P, Quivey JM, Sultanem K, Poon I, Akazawa C, et al. Intensity-modulated radiotherapy in the treatment of nasopharyngeal carcinoma: an update of the UCSF experience. Int J Radiat Oncol Biol Phys. (2002) 53:12–22. doi: 10.1016/s0360-3016(02)02724-4
24. Lee AW, Ng WT, Pan JJ, Chiang CL, Poh SS, Choi HC, et al. International guideline on dose prioritization and acceptance criteria in radiation therapy planning for nasopharyngeal carcinoma. Int J Radiat Oncol Biol Phys. (2019) 105:567–80. doi: 10.1016/j.ijrobp.2019.06.2540
25. Schultheiss TE, Orton CG, Peck RA. Models in radiotherapy: volume effects. Med Phys. (1983) 10:410–5. doi: 10.1118/1.595312
26. Okunieff P, Morgan D, Niemierko A, Suit HD. Radiation dose-response of human tumors. Int J Radiat Oncol Biol Phys. (1995) 32:1227–37. doi: 10.1016/0360-3016(94)00475-z
27. Zaider M, Amols HI. Practical considerations in using calculated healthy-tissue complication probabilities for treatment-plan optimization. Int J Radiat Oncol Biol Phys. (1999) 44:439–47. doi: 10.1016/s0360-3016(99)00014-0
28. Warfield SK, Zou KH, Wells WM. Simultaneous truth and performance level estimation (STAPLE): an algorithm for the validation of image segmentation. IEEE Trans Med Imaging. (2004) 23:903–21. doi: 10.1109/TMI.2004.828354
29. Lee N, Harris J, Garden AS, Straube W, Glisson B, Xia P, et al. Intensity-modulated radiation therapy with or without chemotherapy for nasopharyngeal carcinoma: radiation therapy oncology group phase II trial 0225. J Clin Oncol. (2009) 27:3684–90. doi: 10.1200/JCO.2008.19.9109
30. Lee NY, Zhang Q, Pfister DG, Kim J, Garden AS, Mechalakos J, et al. Addition of bevacizumab to standard chemoradiation for locoregionally advanced nasopharyngeal carcinoma (RTOG 0615): a phase 2 multi-institutional trial. Lancet Oncol. (2012) 13:172–80. doi: 10.1016/S1470-2045(11)70303-5
31. Ng WT, Lee MC, Chang AT, Chan OS, Chan LL, Cheung FY, et al. The impact of dosimetric inadequacy on treatment outcome of nasopharyngeal carcinoma with IMRT. Oncol. (2014) 50:506–12. doi: 10.1016/j.oraloncology.2014.01.017
32. Ozkaya Akagunduz O, Guven Yilmaz S, Yalman D, Yuce B, Demirkilinc Biler E, Afrashi F, et al. Evaluation of the radiation dose-volume effects of optic nerves and chiasm by psychophysical, electrophysiologic tests, and optical coherence tomography in nasopharyngeal carcinoma. Technol Cancer Res Treat. (2017) 16:969–77. doi: 10.1177/1533034617711613
33. Spoelstra FO, Senan S, Le Péchoux C, Ishikura S, Casas F, Ball D, et al. Variations in target volume definition for postoperative radiotherapy in stage III non-small-cell lung cancer: analysis of an international contouring study. Int J Radiat Oncol Biol Phys. (2010) 76:1106–13. doi: 10.1016/j.ijrobp.2009.02.072
34. Peters LJ, O’Sullivan B, Giralt J, Fitzgerald TJ, Trotti A, Bernier J, et al. Critical impact of radiotherapy protocol compliance and quality in the treatment of advanced head and neck cancer: results from TROG 02.02. J Clin Oncol. (2010) 28:2996–3001. doi: 10.1200/JCO.2009.27.4498
35. Voet PW, Dirkx ML, Teguh DN, Hoogeman MS, Levendag PC, Heijmen BJ. Does atlas-based autosegmentation of neck levels require subsequent manual contour editing to avoid risk of severe target underdosage? A dosimetric analysis. Radiother Oncol. (2011) 98:373–7. doi: 10.1016/j.radonc.2010.11.017
36. De Ruysscher D, Wanders S, Minken A, Lumens A, Schiffelers J, Stultiens C, et al. Effects of radiotherapy planning with a dedicated combined PET-CT-simulator of patients with non-small cell lung cancer on dose limiting normal tissues and radiation dose-escalation: a planning study. Radiother Oncol. (2005) 77:5–10. doi: 10.1016/j.radonc.2005.06.014
37. Peng Y, Liu Y, Shen G, Chen Z, Chen M, Miao J, et al. Improved accuracy of auto-segmentation of organs at risk in radiotherapy planning for nasopharyngeal carcinoma based on fully convolutional neural network deep learning. Oncol. (2023) 136:106261. doi: 10.1016/j.oraloncology.2022.106261
38. Lin L, Dou Q, Jin YM, Tang YQ, Chen WL, Su BA, et al. Deep learning for automated contouring of primary tumor volumes by MRI for nasopharyngeal carcinoma. Radiol. (2019) 291:677–86. doi: 10.1148/radiol.2019182012
39. Mavroidis P, Giantsoudis D, Awan MJ, Nijkamp J, Rasch CR, Duppen JC, et al. Consequences of anorectal cancer atlas implementation in the cooperative group setting: radiobiologic analysis of a prospective randomized in silico target delineation study. Radiother Oncol. (2014) 112:418–24. doi: 10.1016/j.radonc.2014.05.011
Keywords: intensity-modulated radiotherapy, interobserver variability, normal tissue complication probability, tumor control probability, nasopharyngeal carcinoma
Citation: Chen M, Peng Y, Chen R, Xie Q, Chen D, Shi J, Huang R, Zhang J, Zhao C, Chen L, Deng X and Liu Y (2025) Interobserver variability in organ delineation on radiotherapy treatment planning for nasopharyngeal carcinoma: A dosimetric and prognostic analysis. Front. Oncol. 15:1510568. doi: 10.3389/fonc.2025.1510568
Received: 13 October 2024; Accepted: 18 April 2025;
Published: 12 May 2025.
Edited by:
C-M Charlie Ma, Fox Chase Cancer Center, United StatesReviewed by:
Jia-Ming Wu, Wuwei Cancer Hospital of Gansu Province, ChinaMariangela Massaccesi, Agostino Gemelli University Polyclinic (IRCCS), Italy
Copyright © 2025 Chen, Peng, Chen, Xie, Chen, Shi, Huang, Zhang, Zhao, Chen, Deng and Liu. This is an open-access article distributed under the terms of the Creative Commons Attribution License (CC BY). The use, distribution or reproduction in other forums is permitted, provided the original author(s) and the copyright owner(s) are credited and that the original publication in this journal is cited, in accordance with accepted academic practice. No use, distribution or reproduction is permitted which does not comply with these terms.
*Correspondence: Yimei Liu, bGl1eW0xQHN5c3VjYy5vcmcuY24=; Xiaowu Deng, ZGVuZ3h3QHN5c3VjYy5vcmcuY24=; Li Chen, Y2hlbmxpQHN5c3VjYy5vcmcuY24=
†These authors have contributed equally to this work
 Meining Chen
 Yinglin Peng
 Ruotong Chen1
 Jun Zhang
 Chong Zhao
 Li Chen
 Xiaowu Deng
 Yimei Liu