 Yufen Chen1†Qinghua Deng2†
 Tengyue Fu3†
 Yuxiang Huang4
 Houlin Li4Jingmu Xie4Feng Liao4Feimiao Zeng2
 Xinyi Fang5*
 Ruiman Li1*
 Zhuming Chen4*
- 1Department of Obstetrics and Gynecology, The First Affiliate Hospital of Jinan University, Guangzhou, Guangdong, China
- 2Department of Gynaecology, The Second Affiliated Hospital of Guangdong Medical University, Zhanjiang, Guangdong, China
- 3Department of Neurosurgery, The First Affiliated Hospital of Shantou University Medical College, Shantou, Guangdong, China
- 4Guangdong-Hong Kong-Macau Institute of CNS Regeneration (GHMICR), Jinan University, Guangzhou, Guangdong, China
- 5Reproductive Medical Center, Affiliated Hospital of Guangdong Medical University, Zhanjiang, Guangdong, China
Background: Cervical squamous cell carcinoma (CESC) constitutes a substantial global health burden, especially in resource-limited regions. The identification of reliable biomarkers is critical for developing a clinically applicable nomogram to predict survival outcomes and evaluate immune infiltration in CESC patients.
Methods: This study integrated RNA-seq data from GEO and TCGA databases to identify key genes associated with CESC through differential expression analysis and machine learning techniques. Prognostic models were constructed and validated, with additional analyses exploring immune cell infiltration and gene function via GSEA and clinical correlation. Finally, key genes were validated via qRT-PCR in CESC tissues.
Results: A total of 112 differentially expressed genes (DEGs) were identified through differential analysis of the GEO and TCGA datasets. EFNA1, CXCL8, and PPP1R14A emerged as prognostic biomarkers for CESC, showing significant associations with survival, tumor stage, and immune infiltration. EFNA1 may drive tumor progression via the MAPK signaling pathway, CXCL8 could influence immune evasion through NOD-like receptor signaling, and PPP1R14A may contribute to tumor invasion by modulating extracellular matrix remodeling. A nomogram integrating these genes demonstrated high predictive accuracy for overall survival (AUC>0.75) and calibration plots. Decision curve analysis (DCA) was performed to assess the nomogram’s clinical utility and net benefit for application in clinical practice. Additionally, it was validated by qRT-PCR, showing elevated expression in tumors versus normal tissues (P<0.05).
Conclusion: EFNA1, CXCL8, and PPP1R14A are promising biomarkers for CESC prognosis and immune regulation. The nomogram model provides a practical tool for personalized survival prediction, enhancing clinical decision-making for immunotherapy and risk stratification.
1 Introduction
CESC is the fourth most common cause of cancer death among women globally, accounting for approximately 606,000 new cases and 342,000 deaths annually (1). Notably, over 70% of cervical cancer deaths occur in low- and middle-income countries (LMICs), where the incidence and mortality rates are the second highest (1, 2). Despite advancements in prevention and treatment, cervical cancer remains a significant health threat to women in LMICs, highlighting disparities in access to care (2). Current treatment strategies for CESC depend on the diagnostic stage. For stage I, hysterectomy is the primary treatment, with cervical resection an option for fertility preservation. Adjuvant therapies such as pelvic radiation are often used post-surgery, while high-risk cases may require chemotherapy (3, 4). Stage II treatment involves radical resection of the cervix, uterus, and lymph nodes, supplemented with adjuvant therapies (3). For locally advanced (stage III) or metastatic (IVA-stage) disease, cisplatin-based chemotherapy remains the mainstay, with emerging immunotherapies like pembrolizumab showing promise in recurrent cases (5, 6). However, the clinical benefits of immunotherapy are inconsistent, with response rates below 20% in advanced CESC (7). This variability underscores the urgent need for predictive biomarkers to stratify patients likely to benefit from immunomodulatory therapies. A critical gap persists in understanding how immune-related biomarkers interact with the tumor microenvironment (TME) to influence prognosis. While studies have identified immune-targeted genes in CESC using gene microarrays (8), these efforts often focus on single biomarkers or lack integration with clinical outcomes (9). For instance, PD-L1 expression alone fails to predict immunotherapy response in 40–60% of CESC cases, suggesting that multi-gene signatures or immune contexture may better capture prognostic complexity (10). Furthermore, existing prognostic models rarely account for dynamic immune-TME crosstalk, limiting their utility in guiding personalized therapy (11).
To address these gaps, we propose a systems biology approach integrating multi-omics data and machine learning. By analyzing RNA-seq data from GEO and TCGA cohorts, we aim to identify immune-related gene signatures that not only predict survival but also reflect TME modulation. Our study diverges from prior work by prioritizing genes with dual roles in prognosis and immune regulation, validating biomarkers across heterogeneous cohorts, and constructing a nomogram that bridges molecular insights with clinical parameters (e.g., lymph node metastasis, tumor stage). This strategy addresses the limitations of reductionist biomarker discovery and provides a framework for translating immune-genomic findings into actionable clinical tools.
2 Materials and methods
2.1 Data collection and preprocessing
To better understand the research process, Figure 1 illustrates the workflow diagram of this study. RNA-seq data were acquired from publicly accessible Gene Expression Omnibus (GEO) and The Cancer Genome Atlas (TCGA) databases (12, 13). The TCGA dataset contains clinical information from 296 cancer patients, including disease stage and survival outcomes, along with 3 normal tissue controls. Key characteristics of both datasets are systematically summarized in Table 1. DEGs were rigorously identified using the “limma” package in R, with selection criteria of |log2 FC|>1 and adjusted P<0.05 (14).

Figure 1. Research and design flow chart.
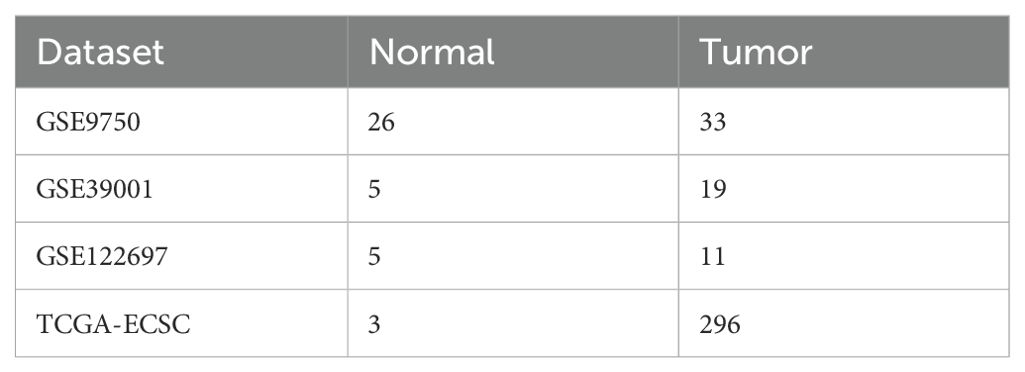
Table 1. Details of GEO and TCGA dataset.
2.2 Functional enrichment analysis of GO and KEGG
DEGs were subjected to functional enrichment analysis using the DAVID database (https://david.ncifcrf.gov/) for Gene Ontology (GO) and Kyoto Encyclopedia of Genes and Genomes (KEGG) annotations (15). The “clusterProfiler” package in R facilitated statistical evaluation and visualization of enriched biological terms (16, 17). GO enrichment analysis includes three key biological domains: biological processes (BP), cellular components (CC), and molecular functions (MF) (18), while KEGG pathway annotation elucidated predominant metabolic and signaling pathways. Enrichment significance was determined at P<0.05.
2.3 Machine learning methods for obtaining disease characteristic genes
Feature selection employed LASSO regression and Support Vector Machine-Recursive Feature Elimination (SVM-RFE) (19, 20). The LASSO algorithm (“glmnet” package) identified CESC-associated genes through penalized regression (α=1), with optimal regularization parameter λ determined by five-fold cross-validation. SVM-RFE (“e1071” package) iteratively eliminated low-contribution features to extract disease-specific signatures. Prognostically significant differentially expressed genes were subsequently screened via univariate Cox regression (P<0.01), followed by multivariate Cox regression to construct the final predictive nomogram (21).
2.4 Validation of prognostic models
The risk score, derived from the constructed prognostic model, represents the prognostic risk for each CESC patient. The calculation formula for the model’s gene risk score is as follows: gene a coefficient multiplied by gene an expression, plus gene b coefficient multiplied by gene b expression,…, plus gene i coefficient multiplied by gene i expression (where a, b, and i represent specific genes). Training and testing cohorts were stratified into high-/low-risk groups using cohort-specific median thresholds. Survival disparities between risk strata were statistically validated through Kaplan-Meier analysis.
2.5 Estimation and analysis of immune cell infiltration patterns
Immune cell infiltration levels of 22 distinct subtypes were quantified through transcriptomic deconvolution using the “CIBERSORT” algorithm implemented in R. Comparative analysis of immune profiles between high- and low-risk cohorts was subsequently performed with the “limma” package.
2.6 GSEA enrichment analysis
Gene set enrichment analysis was conducted using the Molecular Signatures Database (MSigDB) collections “c5.go.v7.4.symbols” and “c2.cp.kegg.v7.4.symbols”. Hub genes associated with specific immune cell populations were functionally annotated through the “clusterProfiler” and “enrichplot” packages in R, with statistically significant terms identified at P<0.05 (16).
2.7 Clinical general information
This retrospective analysis included 6 hysterectomy patients stratified into two cohorts: cervical squamous carcinoma (CESC; n=3, mean age 57.02 ± 9.21 years) and benign gynecological conditions (adenomyosis/uterine fibroids/prolapse; n=3, 57.56 ± 9.81 years), all confirmed by histopathological examination. Surgical specimens were snap-frozen in liquid nitrogen within 30 min post-resection for RNA preservation. Exclusion criteria encompassed pre-existing metabolic disorders (diabetes mellitus) or renal dysfunction. The research protocol was approved by the Second Affiliated Hospital of Guangdong Medical University (Approval No. PJKT2024-134).
2.8 RNA extraction and gene expression analysis
Gene expression analysis was performed using TRIzol reagent (Invitrogen, USA) to extract 1 μg total RNA per manufacturer’s protocol. RNA was reverse-transcribed into cDNA and amplified via qRT-PCR under standardized cycling conditions: 95°C for 5 min, followed by 40 cycles of 95°C for 15 s and 60°C for 30 s. Primer sequences used for qPCR are detailed in Table 2. Gene expression levels were quantified using the 2–ΔΔCT method and normalized with GAPDH.
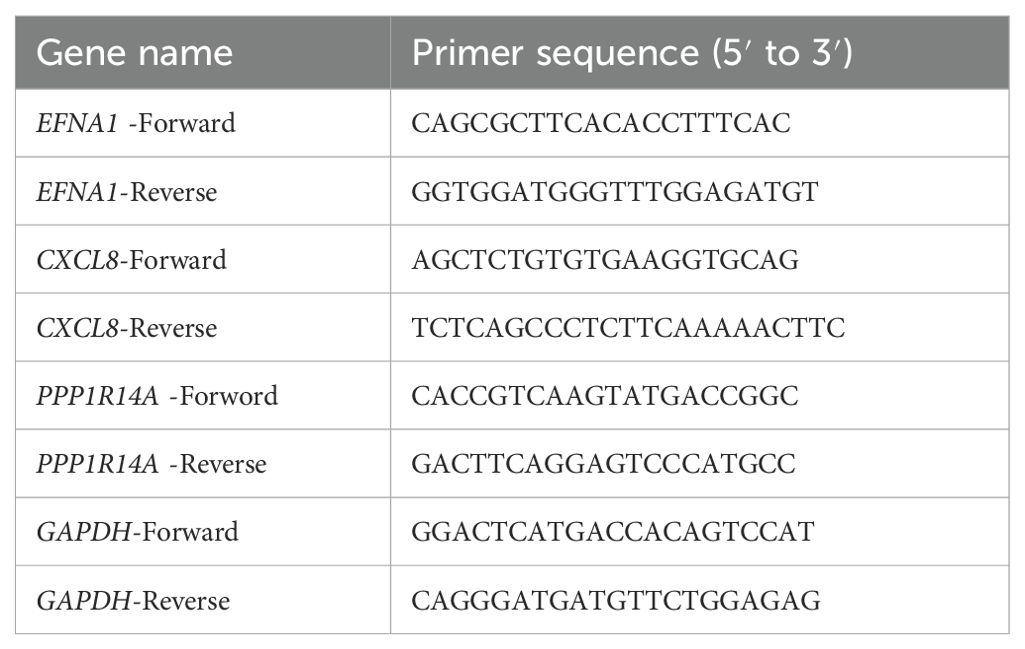
Table 2. Primer sequences for real-time reverse transcription PCR (qRT-PCR).
2.9 Construction and validation of nomograms
A prognostic nomogram integrating independent risk factors identified through univariate and multivariate Cox regression analyses was developed using the rms package in R, enabling visualization of 3-, 5-, and 8-year overall survival (OS) predictions for CESC patients. Model validation comprised temporal discrimination assessment via time-dependent receiver operating characteristic (ROC) curves with area under the curve (AUC) quantification, calibration curve analysis for prediction accuracy evaluation.
2.10 Clinical relevance
Clinical utility of the nomogram was systematically evaluated through decision curve analysis (DCA). Using the ROC curve, we determine the optimal threshold for each patient’s risk score via the nomogram. Subsequently, patients in the training and validation queues are classified into high-risk and low-risk categories based on their calculated risk scores. Kaplan-Meier survival curves are employed to analyze OS between these groups in two cohorts to assess survival differences.
2.11 Statistical analysis
Statistical analyses were conducted using R software (version 4.3.1). Continuous and categorical variables were compared between groups using Student’s t-tests and Pearson’s chi-square tests, respectively. Survival outcomes were evaluated through Kaplan-Meier methodology with log-rank testing for group comparisons, supplemented by Cox proportional hazards regression modeling. Prognostic predictors were identified through univariate/multivariate Cox regression. Model discriminative ability was quantified using C-index, while calibration curves assessed prediction-observation agreement. Clinical decision-making utility was evaluated through DCA. Statistical significance in this study was determined using P<0.05.
3 Results
3.1 Screening for DEGs
We retrieved mRNA expression profiles from GEO databases (GSE9750, GSE39001, GSE122697) to identify DEGs in CESC. Following batch calibration and normalization, differential expression analysis of the GEO dataset revealed 666 DEGs, comprising 434 upregulated genes (log2 FC>1) and 232 downregulated genes (log2 FC< -1), as shown in (Figures 2A, B). To further explore DEGs in CESC, we performed a detailed differential expression analysis using the TCGA dataset, comparing cancer tissues with adjacent normal tissues. This analysis identified 5,784 significantly differentially expressed genes, including 3,452 upregulated genes (log2 FC>1) and 2,332 downregulated genes (log2 FC<-1), as presented in (Figures 2C, D). By integrating the GEO and TCGA datasets, we identified 112 overlapping DEGs, consisting of 20 upregulated genes (log2 FC> 1) and 92 downregulated genes (log2 FC< -1), illustrated in (Figure 2E). This study conducted integrative differential gene expression analysis across GEO and TCGA cohorts, characterizing tumor-specific transcriptional dysregulation through systematic comparison of neoplastic and normal tissues.
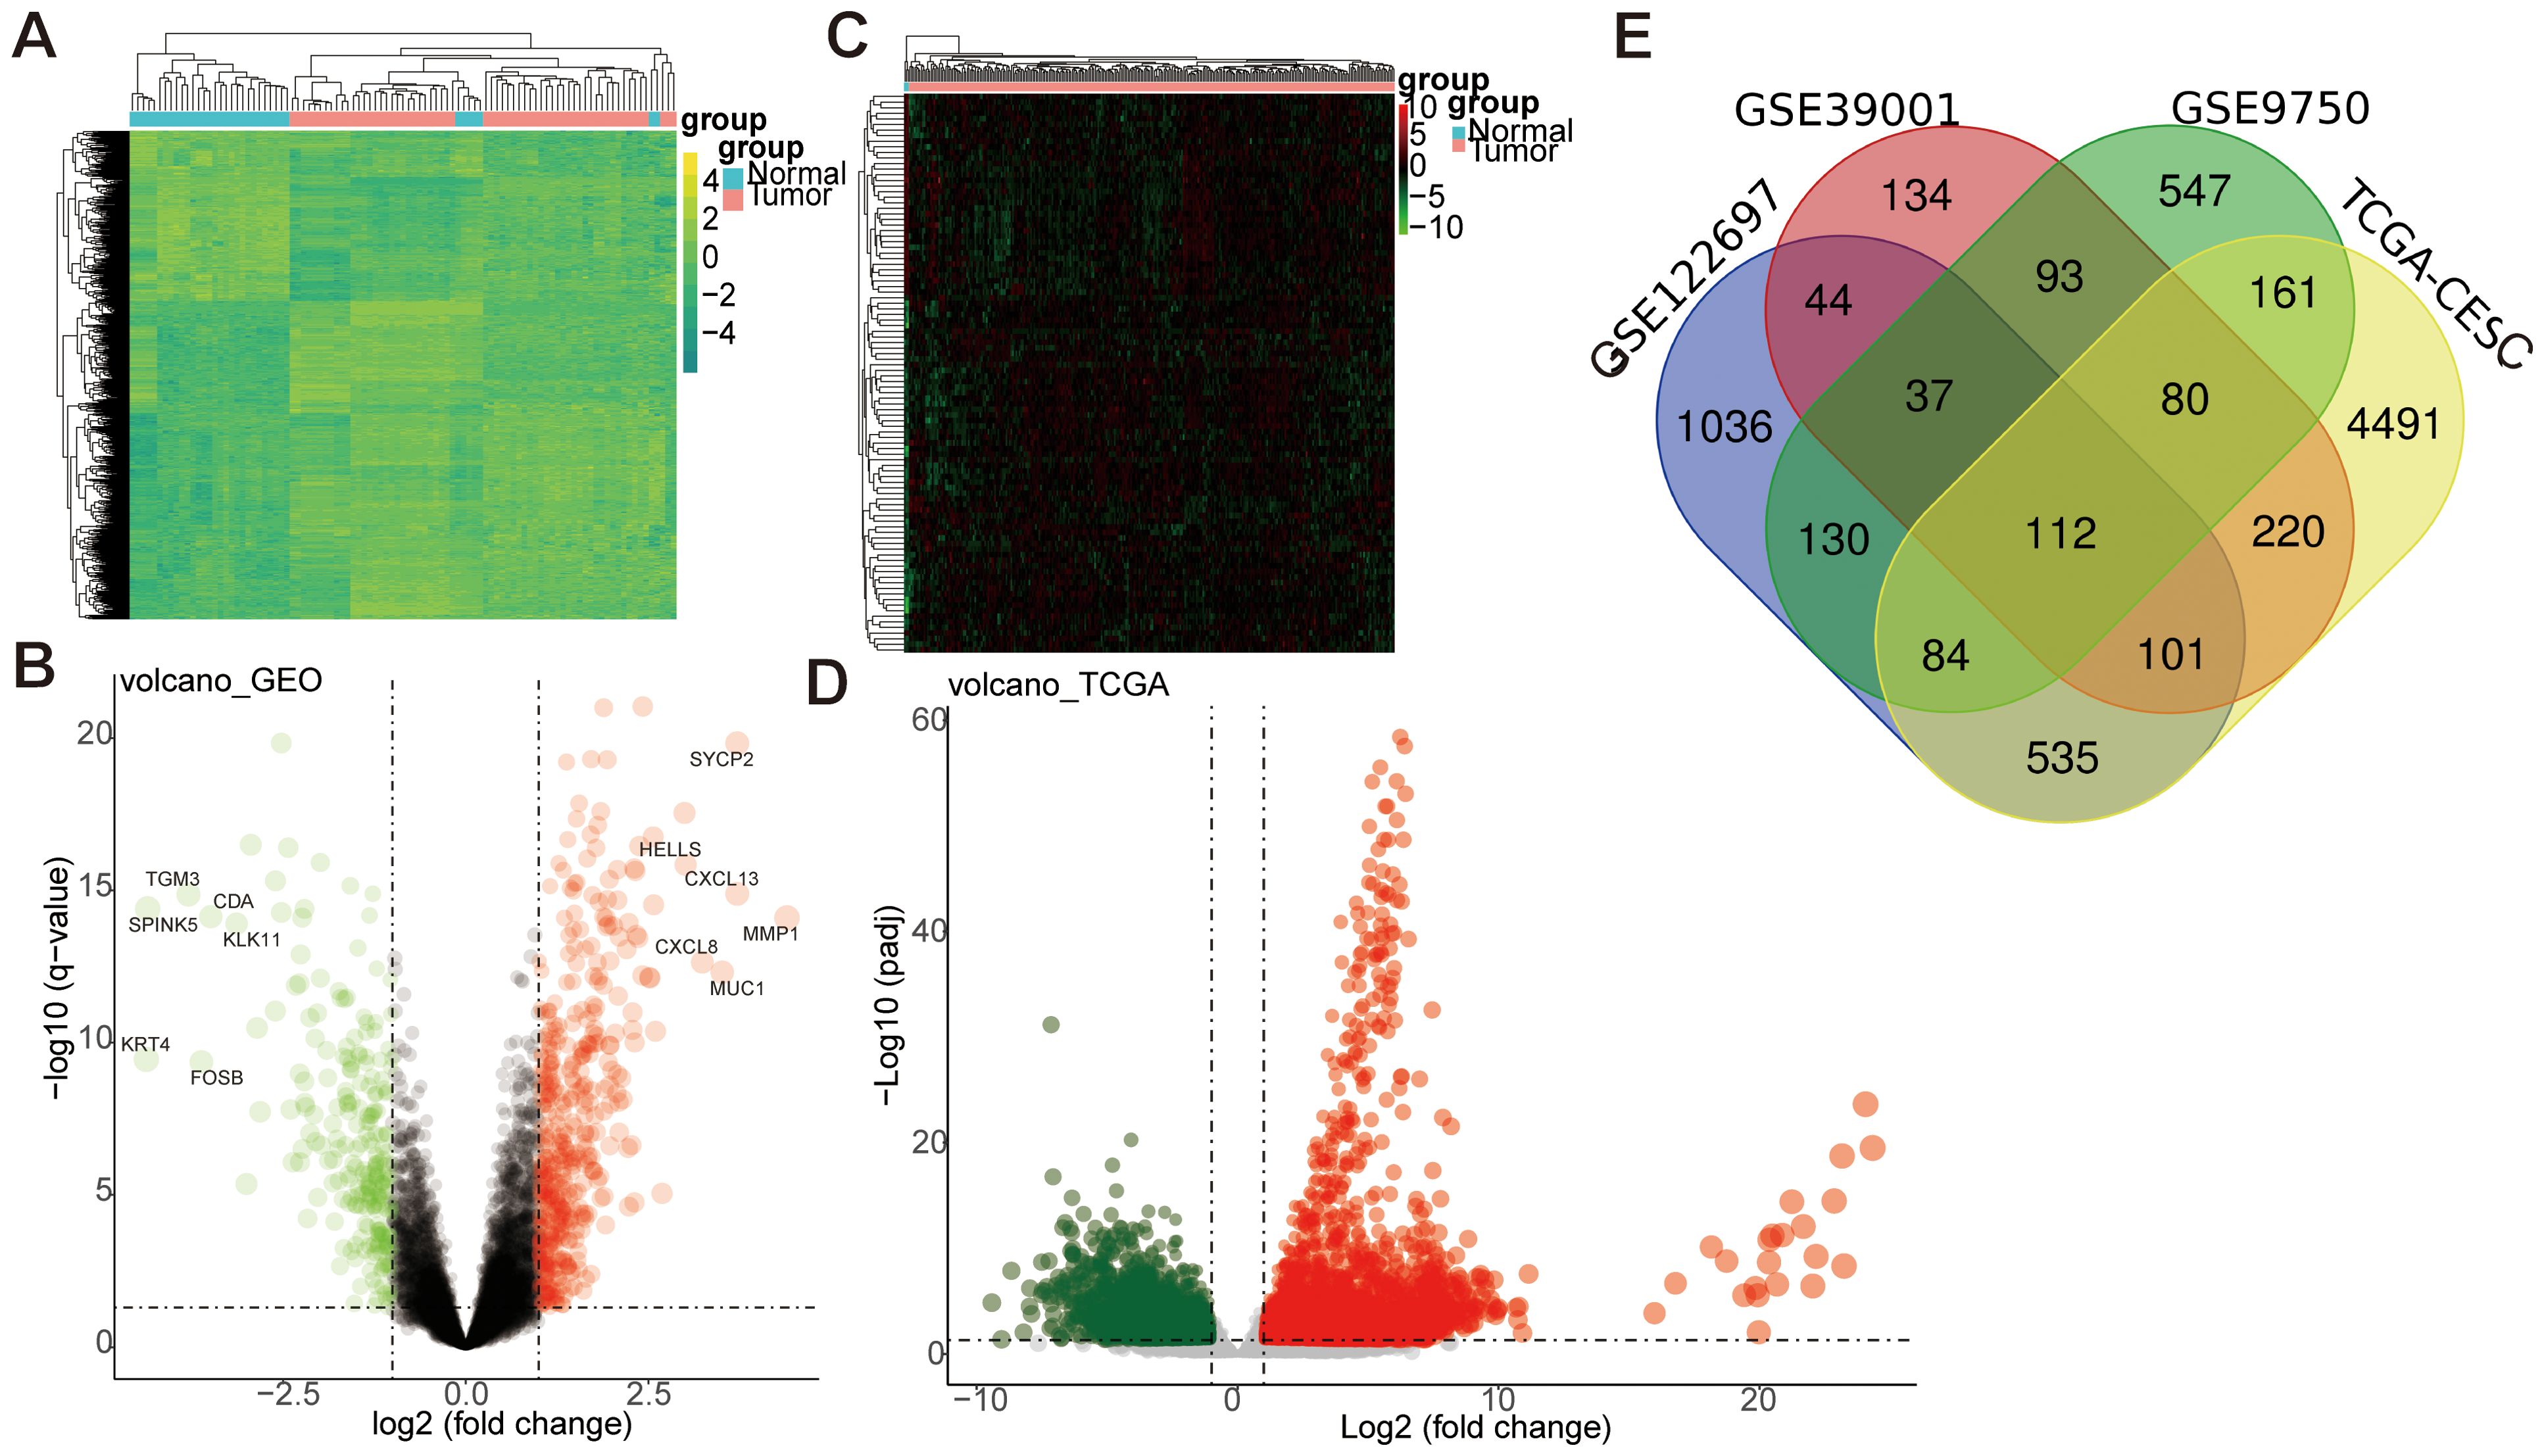
Figure 2. Differential gene analysis between GEO and TCGA datasets. (A, B) The differential gene analysis heatmap and volcano map of the GEO dataset. The expression profiles above the average in the heatmap are yellow, while those below the average are in green. (C, D) The differential gene analysis heatmap and volcano map of the TCGA dataset. Expression profiles above the average were represented in red. In contrast, those below the average were represented in green. Log FC: log2 fold changes. (E) Venn map of differentially expressed genes between GEO and TCGA datasets.
3.2 GO & KEGG enrichment analysis of DEGs
To investigate the functional characteristics of 112 DEGs in CESC, systematic enrichment analyses were performed through the DAVID database. GO and KEGG analyses were conducted with FDR<0.05. Expressly, BP analysis indicated significant involvement of these DEGs in processes such as DNA replication, chromosome segregation, cell division, and the mitotic cell cycle. CC analysis revealed their primary association with spindle poles, kinetochores, and chromosome regions. Furthermore, MF analysis demonstrated that these DEGs primarily exhibit binding abilities to single-stranded DNA, microtubules, and protein kinases (Figure 3A). KEGG pathway analysis (Figure 3B) identified core mechanisms including Cell cycle, DNA replication, Oocyte meiosis, Progesterone-mediated oocyte maturation, Motor proteins, p53 signaling pathway, Cellular senescence, Mismatch repair, and Base excision repair. These findings collectively implicate the DEGs in essential oncogenic processes: genomic stability maintenance through DNA replication/repair, mitotic regulation via spindle apparatus components, and potential involvement in cellular senescence mechanisms in CESC pathogenesis.
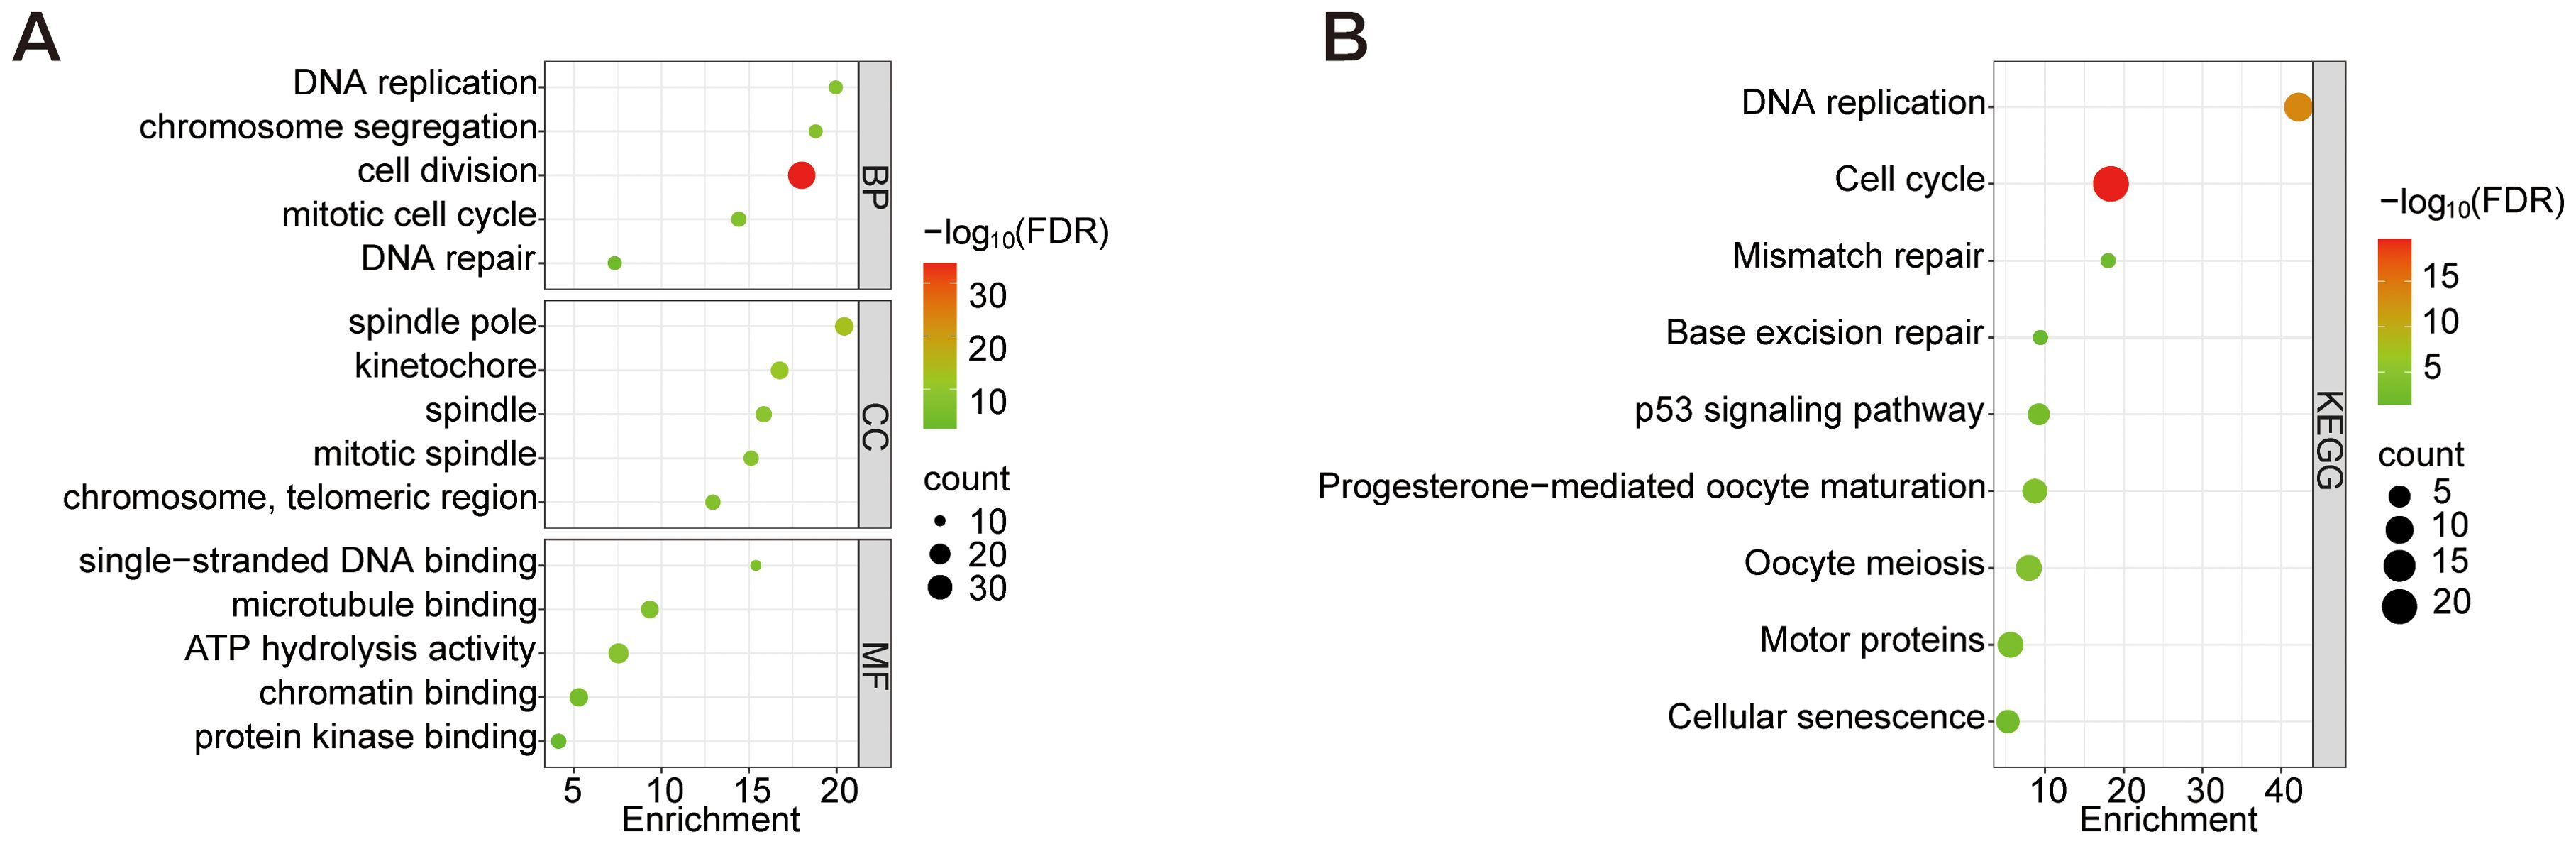
Figure 3. GO analysis of the top 5 enriched DEGs and KEGG analysis of the top 10 enriched DEGs. (A) GO enrichment analysis of BP, CC, and MF. (B) KEGG enrichment analysis. Node size represents the proportion of genes; The node color represents the FDR value.
3.3 LASSO regression of differentially expressed genes in GEO dataset and SVM-RFE algorithm for screening key pathogenic-characteristic gene
Disease-associated genes were identified through a multi-step feature selection process. LASSO regression analysis selected 23 characteristic genes (e.g., CXCL8, EFNA1, EZH2) by minimizing prediction error, with error magnitude and gene number relationships visualized (Figures 4A, B). SVM-RFE analysis subsequently refined candidate genes through recursive elimination, identifying 51 optimal features at minimal cross-validation error (Figure 4C). Intersection analysis of both methods revealed eight core disease-characteristic genes (CXCL8, EFNA1, EZH2, PAQR4, SLC27A6, SPINK5, SYCP2, YEATS2), confirmed by Venn diagram (Figure 4D).
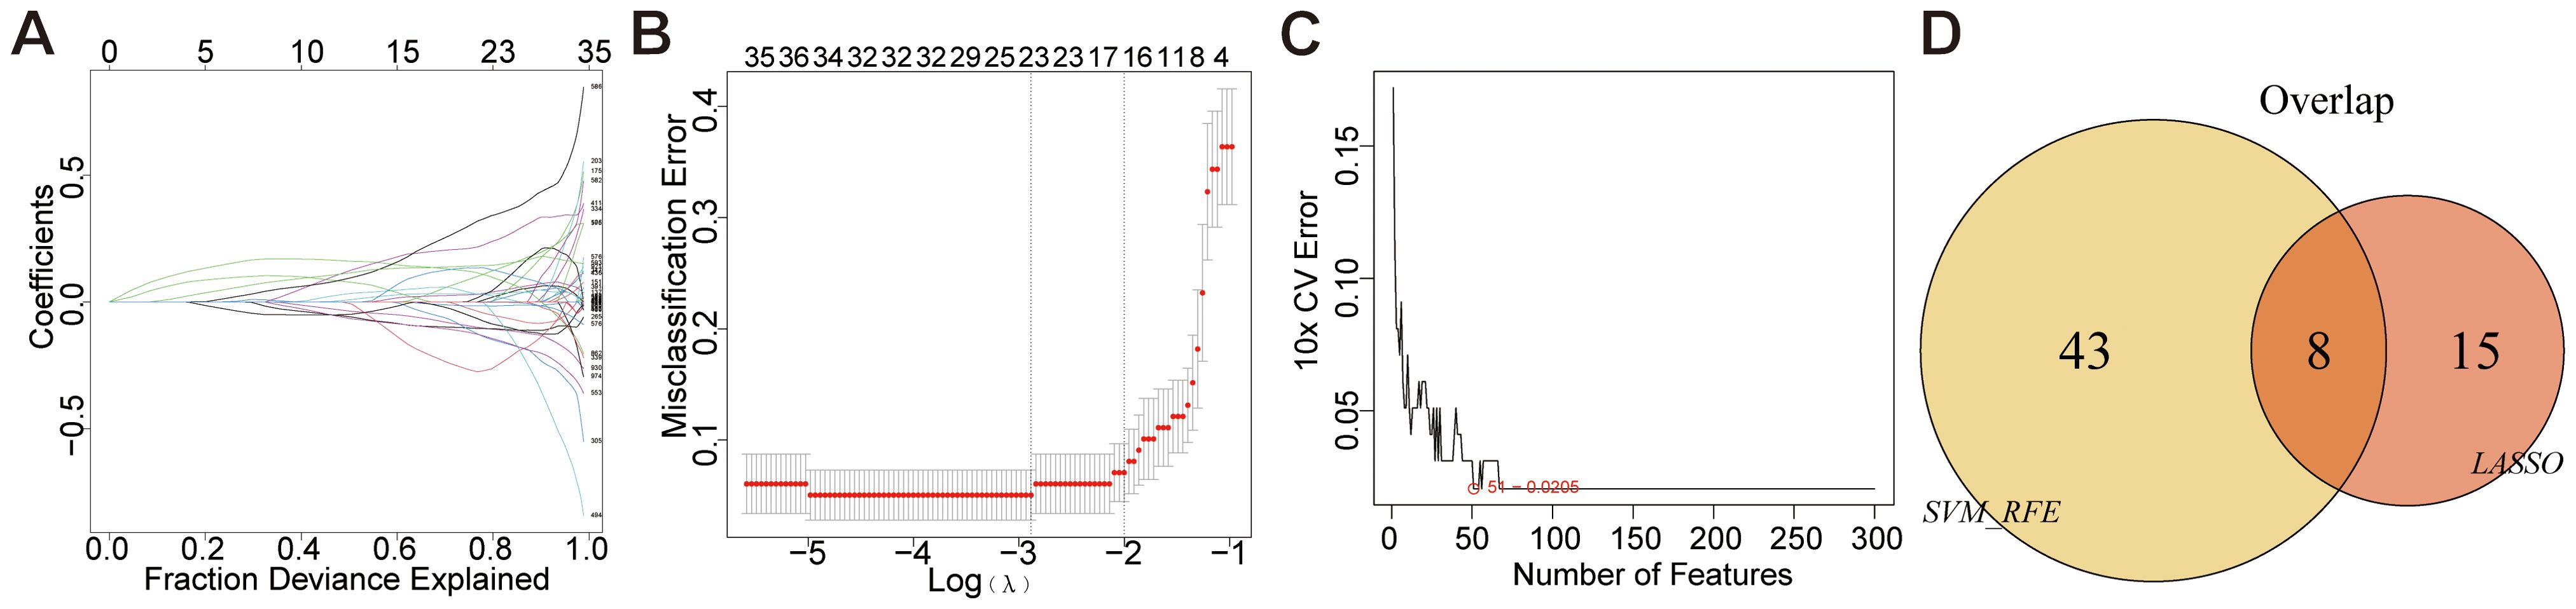
Figure 4. Mechanical learning method for obtaining disease characteristic genes from GEO dataset. (A, B) LASSO regression plot, λ = 0.1022. (C) SVM-RFE diagram, 51-0.0205 indicates an error rate of 0.0205 for the 51 trait genes screened. (D) Venn diagram.
3.4 Screening of disease characteristic genes using LASSO regression and univariate COX regression analysis in the TCGA dataset
Feature selection was conducted through LASSO regression (“glmnet” package) to identify feature genes demonstrating minimal prediction error. The optimal regularization parameter (λ) was determined via cross-validation, selecting hub genes with the lowest error rate as disease-specific biomarkers (Figures 5A, B). Furthermore, a risk-scoring model for cervical cancer was constructed and used to stratify 296 CESC patients into low-risk (n=148) and high-risk (n=148) groups based on their median disease risk, as shown in (Figure 5C). For further insight, (Figure 5D) displays the risk score distribution and corresponding survival status of patients within these risk groups. Finally, univariate Cox regression analysis was conducted to identify four key genes (F10, PPP1R14A, FBLN5, ABCA8), and a gene model was constructed based on these findings. The analysis results are presented clearly in (Figure 5E).
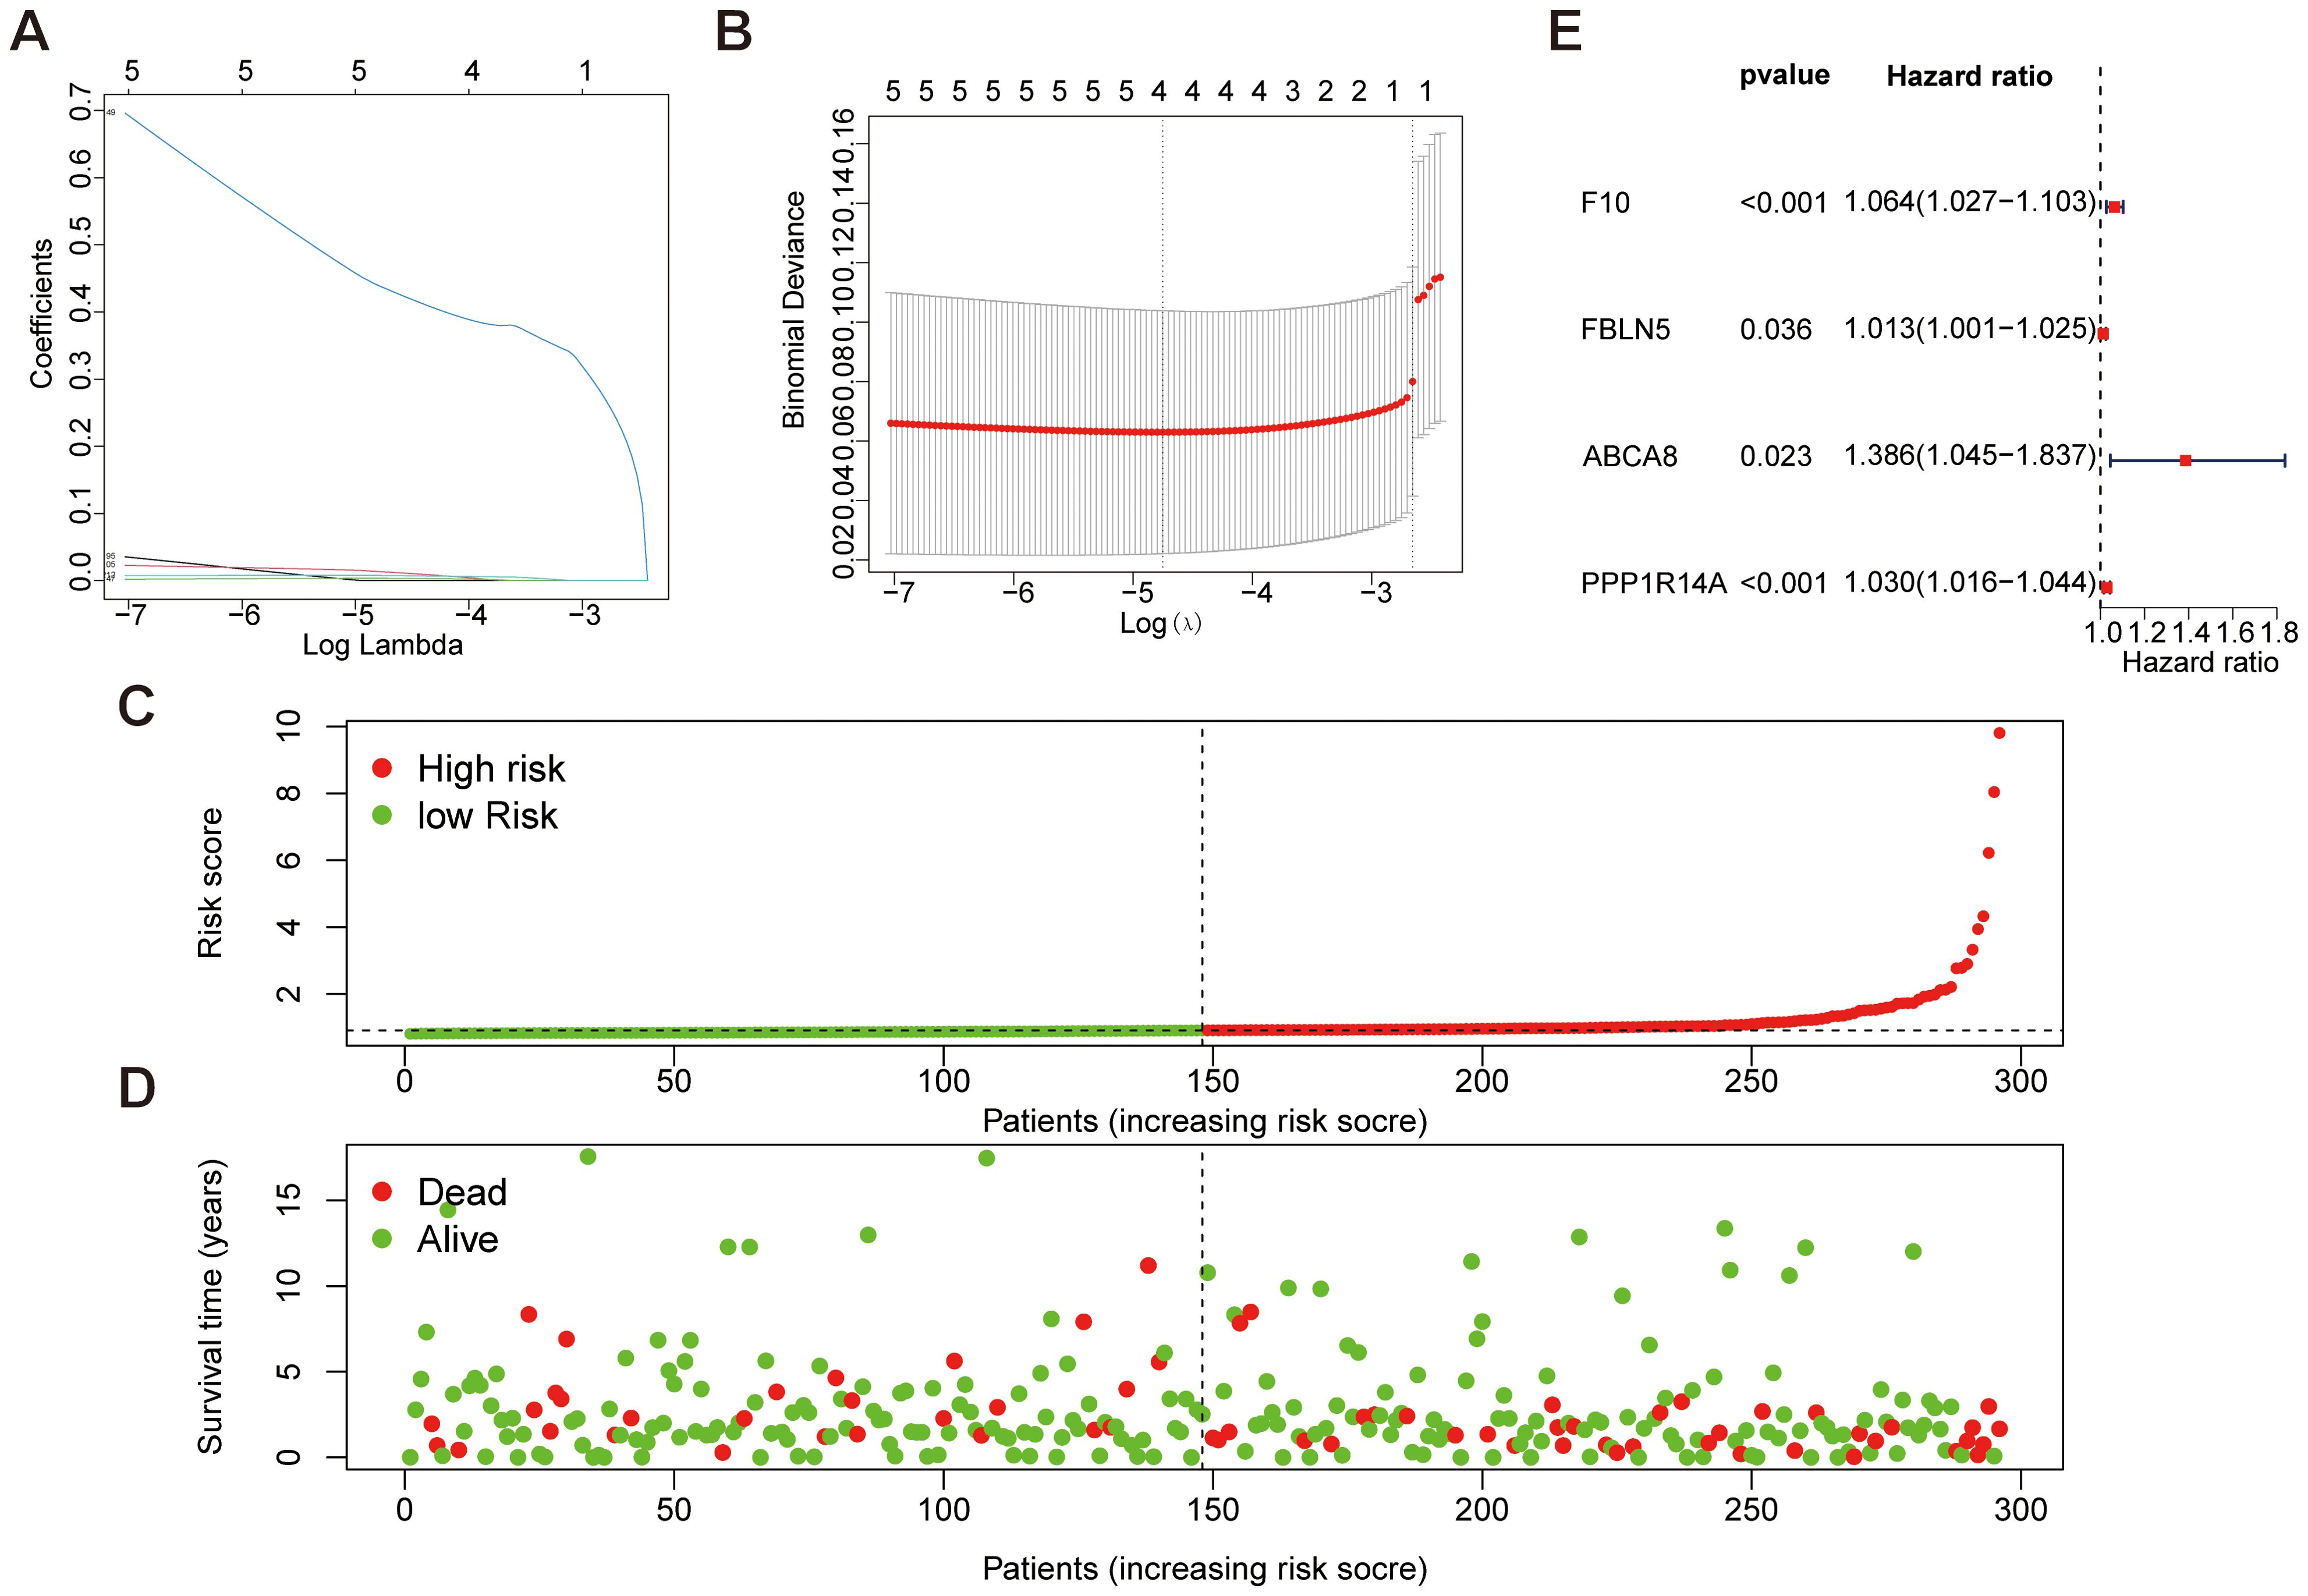
Figure 5. Mechanical learning method for obtaining disease characteristic genes from TCGA dataset. (A, B) LASSO regression plot, λ=0.0086. (C, D) Patient risk scores and survival status for high-risk and low-risk groups. (E) Forest plot of key genes selected in features through univariate Cox analysis.
3.5 Survival prognosis analysis of key genes
To investigate the prognostic significance of 12 key genes (EFNA1, CXCL8, EZH2, PAQR4, SLC27A6, SPINK5, SYCP2, YEATS2, F10, PPP1R14A, FBLN5, ABCA8) in CESC, we conducted a comprehensive survival analysis. Notably, EFNA1 (Figure 6A), CXCL8 (Figure 6B), and PPP1R14A (Figure 6C) demonstrated statistically significant predictive value for overall survival (P<0.05). Conversely, EZH2, PAQR4, SLC27A6, SPINK5, SYCP2, YEATS2, F10, FBLN5, and ABCA8 did not exhibit statistically significant differences in overall survival prognosis (Figures 6D–L). These findings suggest that EFNA1, CXCL8, and PPP1R14A may serve as potential prognostic markers for CESC, warranting further investigation for their roles in disease progression and therapeutic targeting.
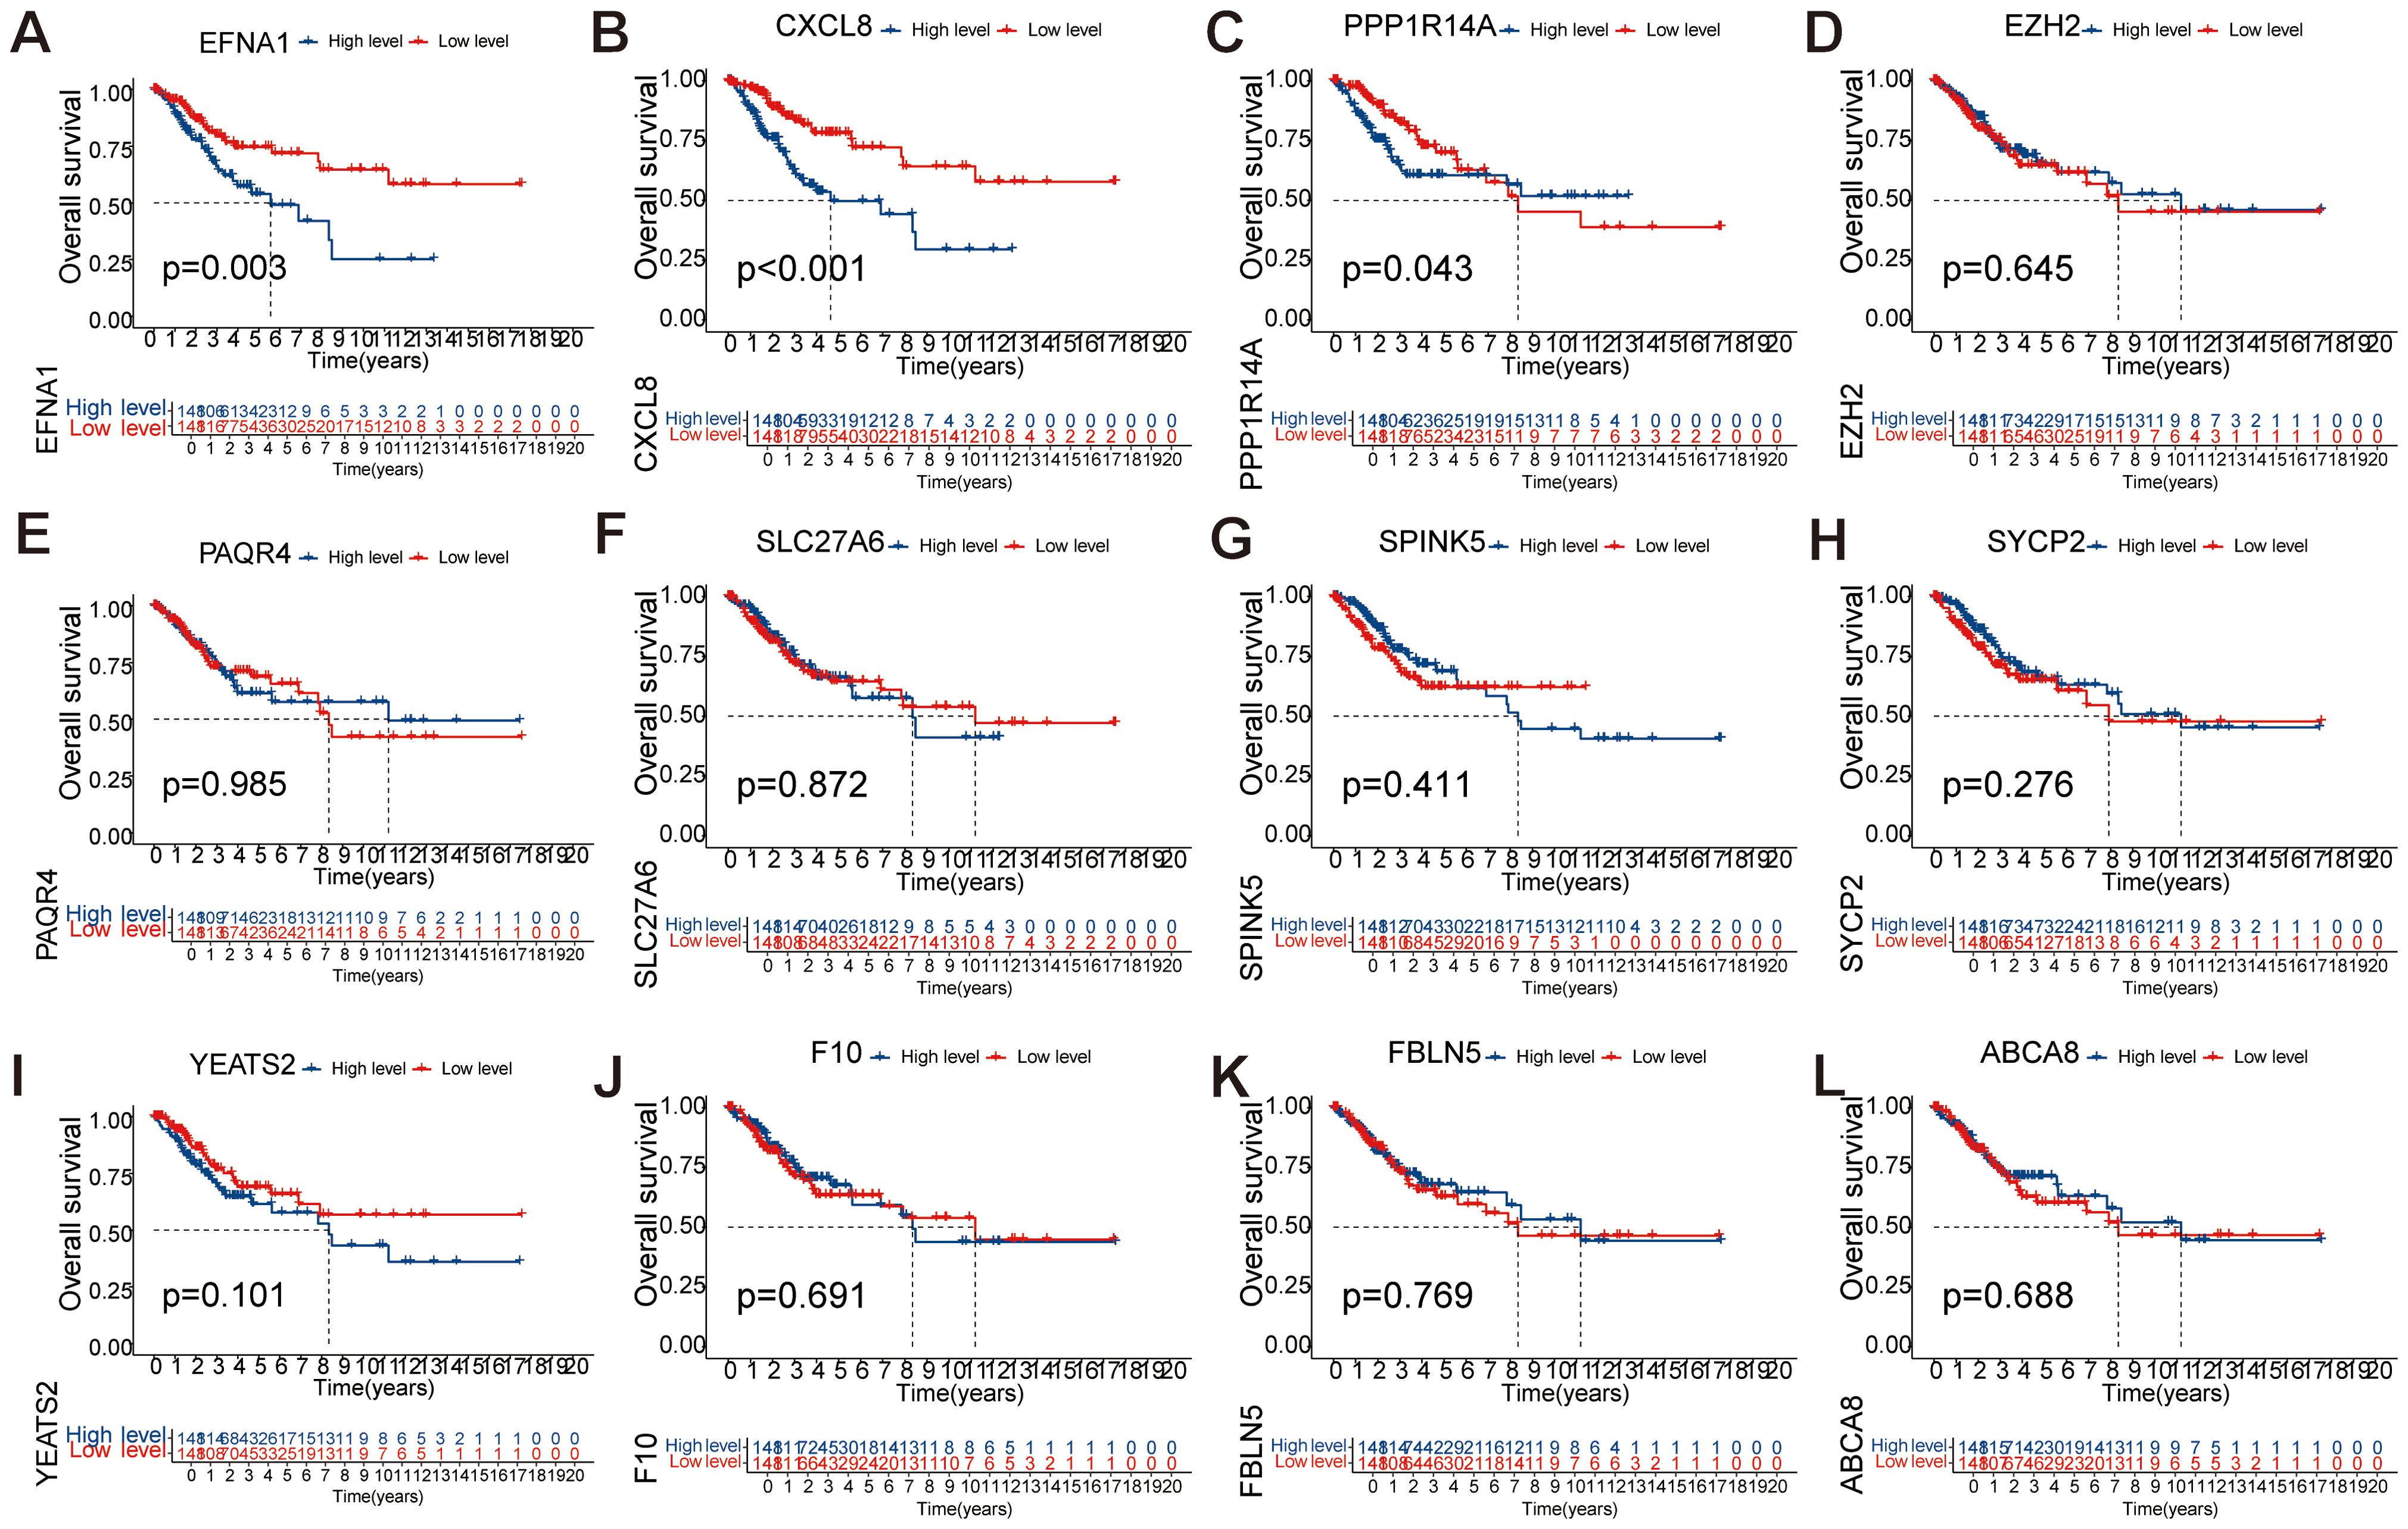
Figure 6. Single-factor analysis of factors influencing the survival rates of CESC patients. (A-L) Kaplan Meier survival curve analysis of EFNA1, CXCL8, EZH2, PAQR4, SLC27A6, SPINK5, SYCP2, YEATS2, F10, PPP1R14A, FBLN5, and ABCA8 showed significant differences in OS between low-risk and high-risk scoring groups.
3.6 ROC validation of key survival prognostic genes
Time-dependent ROC analysis evaluated the prognostic accuracy of a three-gene signature (EFNA1, CXCL8, PPP1R14A) for cervical squamous cell carcinoma survival outcomes. The EFNA1 (Figure 7A) demonstrated moderate discrimination with progressive improvement in AUC from 0.650 (1-year) to 0.715 (10-year), consistently exceeding random prediction. CXCL8 (Figure 7B) showed superior and stable performance across all intervals, maintaining AUC between 0.682-0.719 with minimal temporal variation. Notably, PPP1R14A (Figure 7C) exhibited temporal performance heterogeneity - achieving peak discriminative capacity at 1-year (AUC=0.726) followed by progressive decline to 0.505 at 10-year follow-up. This temporal analysis revealed two distinct prognostic patterns: CXCL8 maintained consistent predictive reliability throughout the observation period, while PPP1R14A and EFNA1 showed opposing temporal trajectories. The composite model demonstrated the strongest predictive utility for early-stage prognosis (1–3 year AUC range: 0.650-0.726), with diminished accuracy in long-term predictions (5–10 year AUC range: 0.505-0.715). These findings position this multigene signature as a potential tool for short-term survival stratification, though longitudinal prognostic accuracy may require temporal recalibration or incorporation of complementary biomarkers.
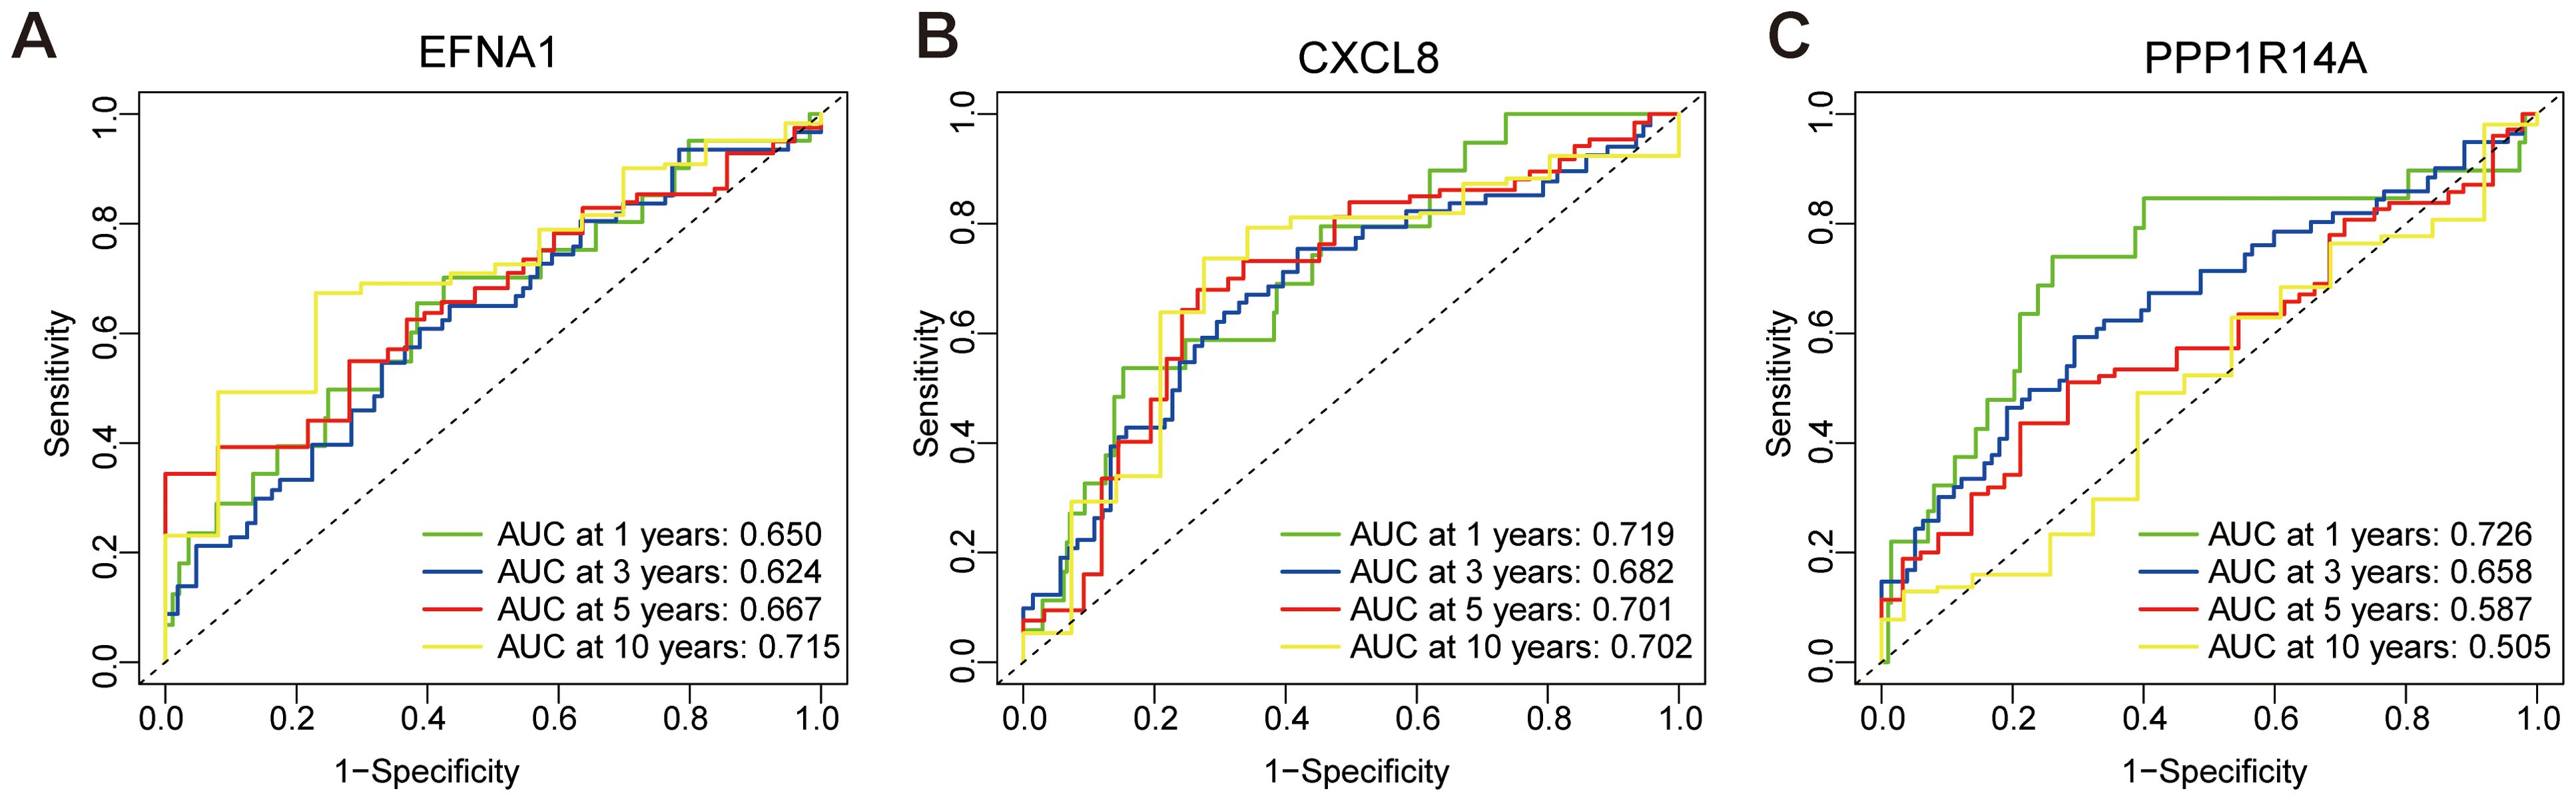
Figure 7. ROC curve for predicting overall survival based on risk score. (A) ROC analysis of EFNA1 gene. (B) ROC analysis of CXCL8 gene. (C) ROC analysis of PPP1R14A gene.
3.7 Key gene immune infiltration analysis
Comprehensive immune microenvironment profiling of CESC was performed through analysis of 22 immune cell signatures and infiltration patterns (Figures 8A, B). The heatmap visually represents the abundance and proportional differences of various immune cell subtypes in CESC samples, highlighting a higher proportion of CD8+ T cells, plasma cells, Tregs, follicular helper T cells, and macrophages (M1, M0, and M2). To explore the correlation between the three key genes (EFNA1, CXCL8, and PPP1R14A) and immune cell infiltration, we stratified the gene expression levels into high- and low-risk groups for analysis (Figures 8C-E). The findings revealed significant differences in dendritic cell activation between high- and low-risk groups for EFNA1 (P<0.05). CXCL8 significantly influenced the proportions of Tregs, NK cells, dendritic cell activation, mast cells, and neutrophils (P<0.05), and changes in PPP1R14A were significantly associated with γδ T cells, macrophages (M0 and M2), dendritic cell activation, and the proportion of neutrophils (P<0.05). These mechanistic insights propose clinically actionable strategies: CXCL8 inhibition may disrupt immunosuppressive networks while PPP1R14A modulation could target macrophage polarization, with EFNA1-mediated dendritic cell activation serving as a potential predictive biomarker for immune checkpoint inhibitor response.
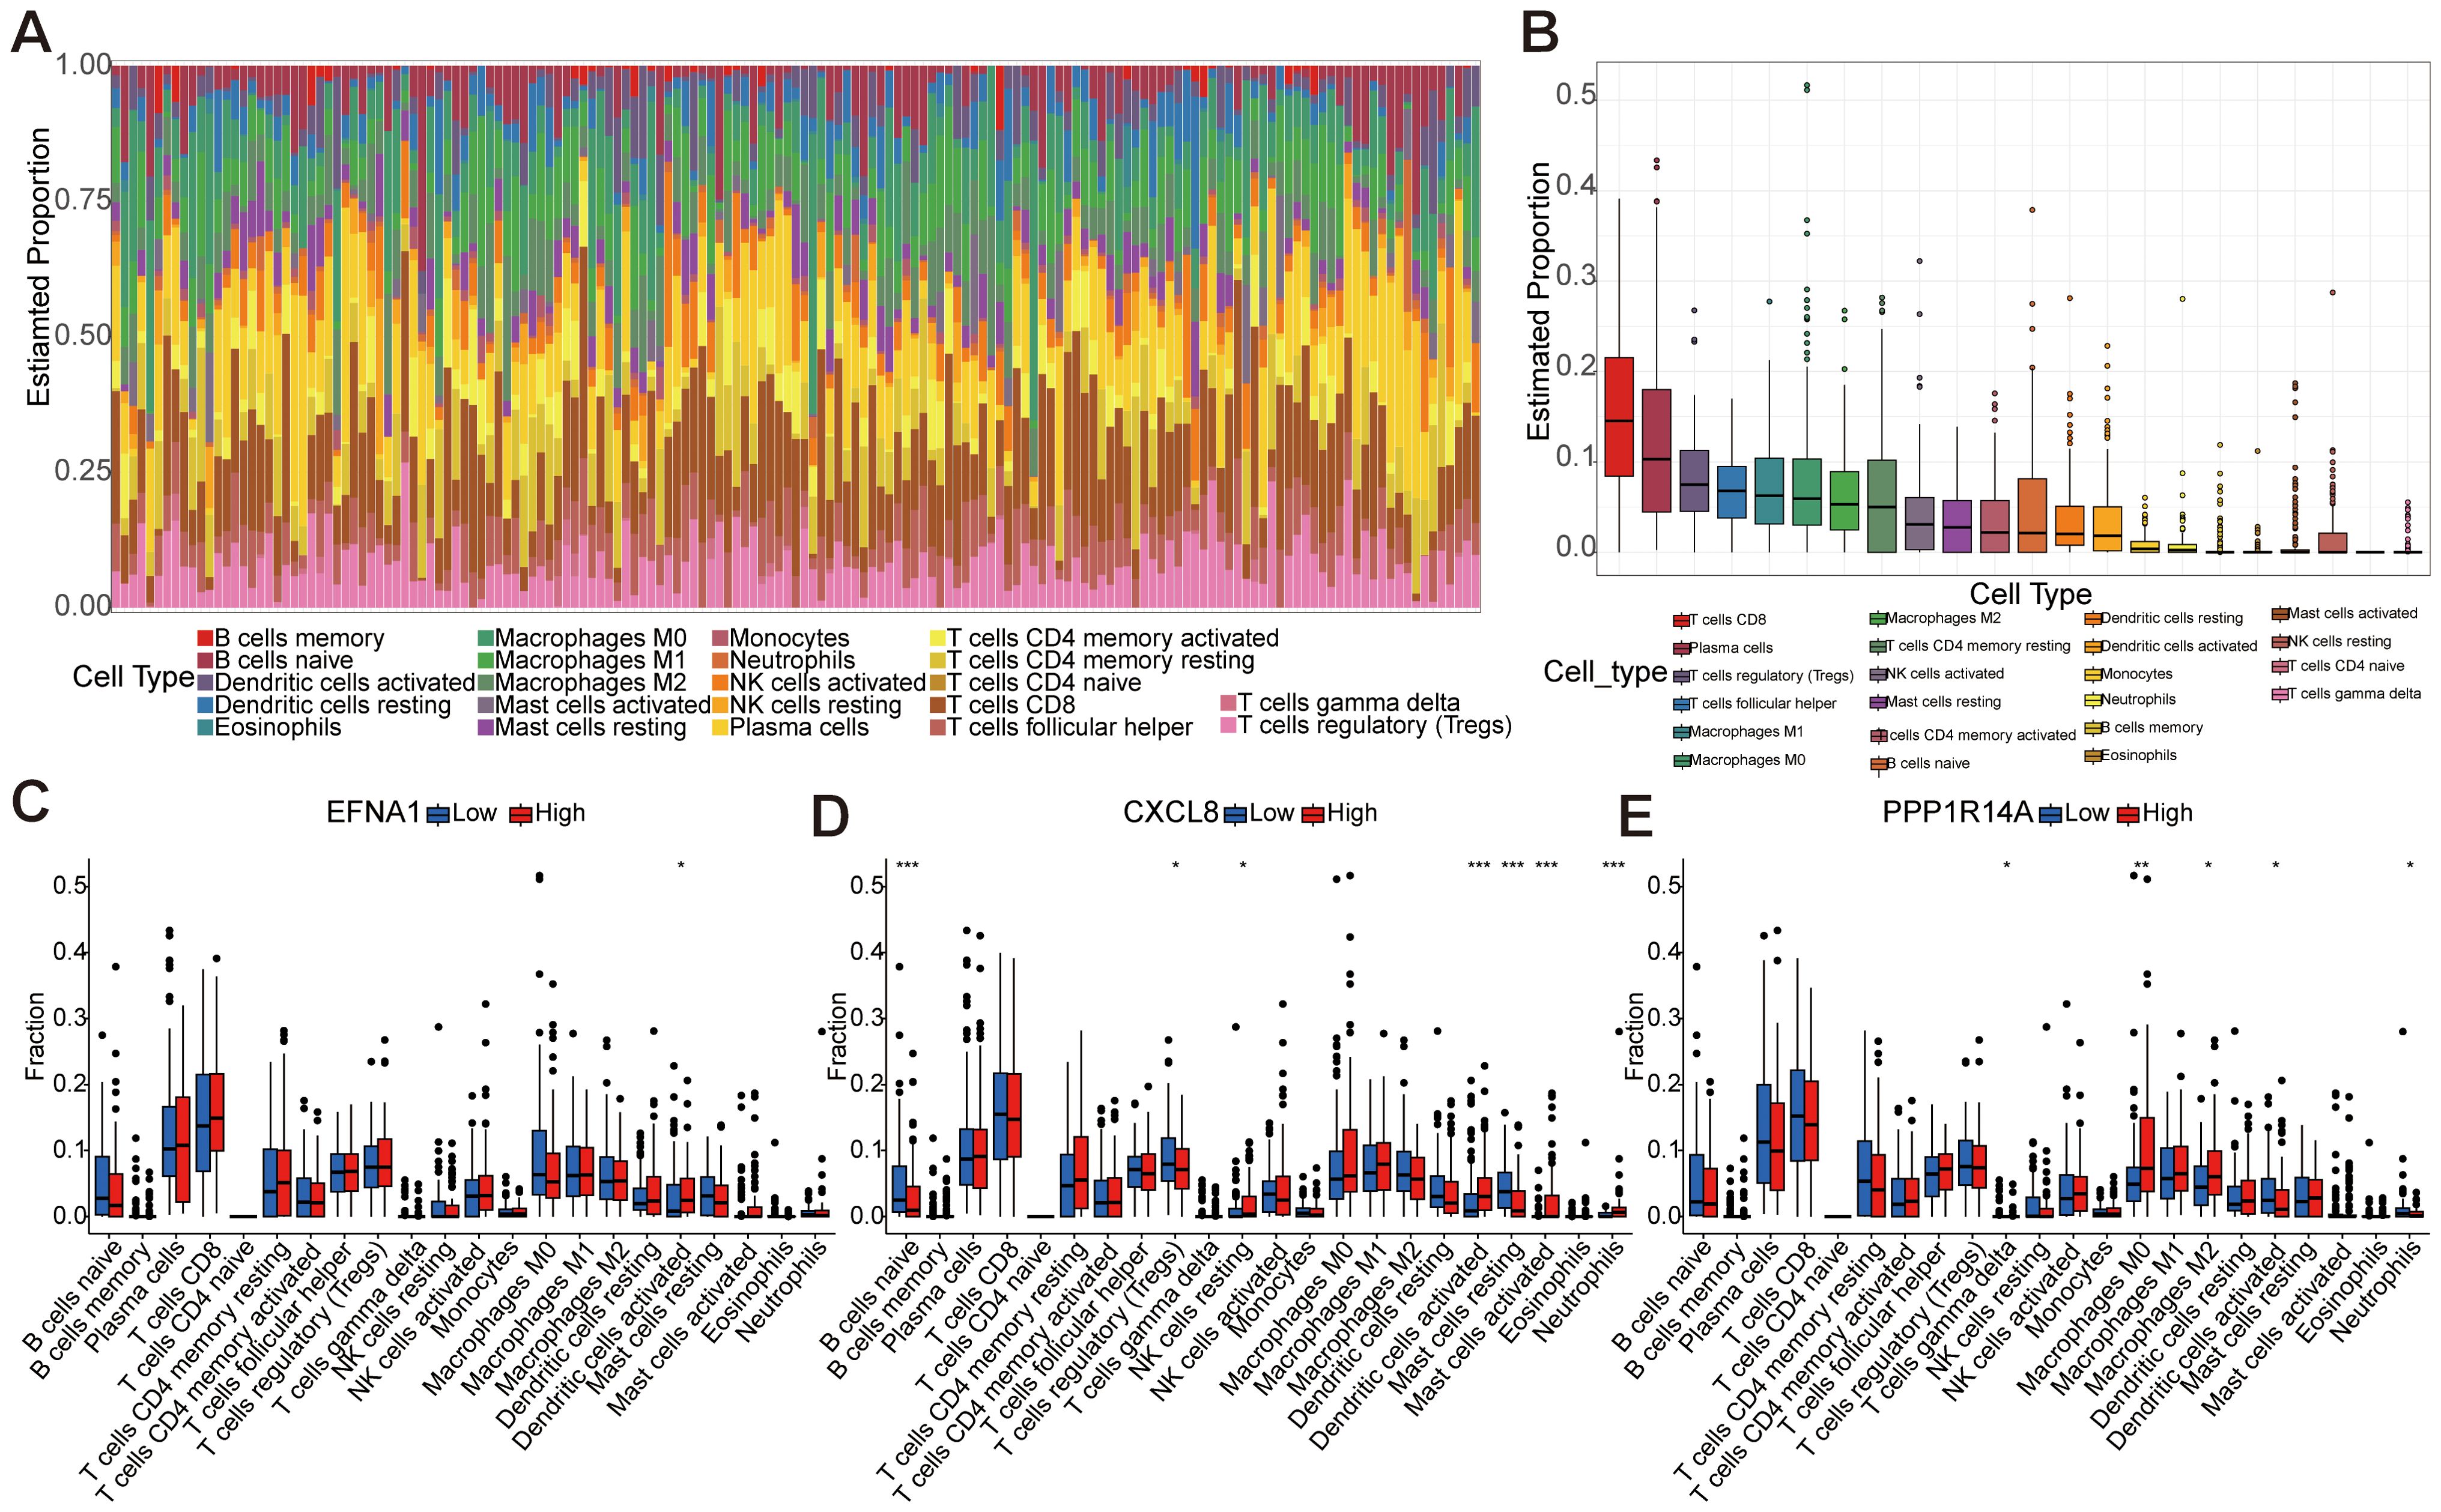
Figure 8. Immune infiltration analysis based on 22 immune-related gene sets. (A) Representing 22 subtypes of immune cells, the abundance of each bar chart represents the proportion of immune cells in each sample, and different colors represent each subtype. (B) Differences in the proportion of 22 subtypes of immune cells. (C-E) The comparative analysis of the proportion of immune infiltrating cells in the high-risk and low-risk groups of EFNA1, CXCL8, and PPP1R14A (*P<0.05, **P<0.01, ***P<0.001).
3.8 Specific gene co-expression analysis
Gene co-expression network analysis revealed distinct interaction patterns among EFNA1, CXCL8, and PPP1R14A. Pearson correlation analysis demonstrated a statistically robust positive correlation between EFNA1 and CXCL8 expression (R=0.21, P<0.001; Figure 9A), suggesting potential co-regulatory mechanisms or functional synergy. In contrast, non-significant correlations were observed for EFNA1-PPP1R14A (R=0.053, P=0.36; Figure 9B) and CXCL8-PPP1R14A pairs (R=0.042, P=0.46; Figure 9C), as evidenced by nullcline-proximal data distributions. This differential correlation profile implies PPP1R14A’s functional autonomy from the EFNA1-CXCL8 axis within the studied biological context.
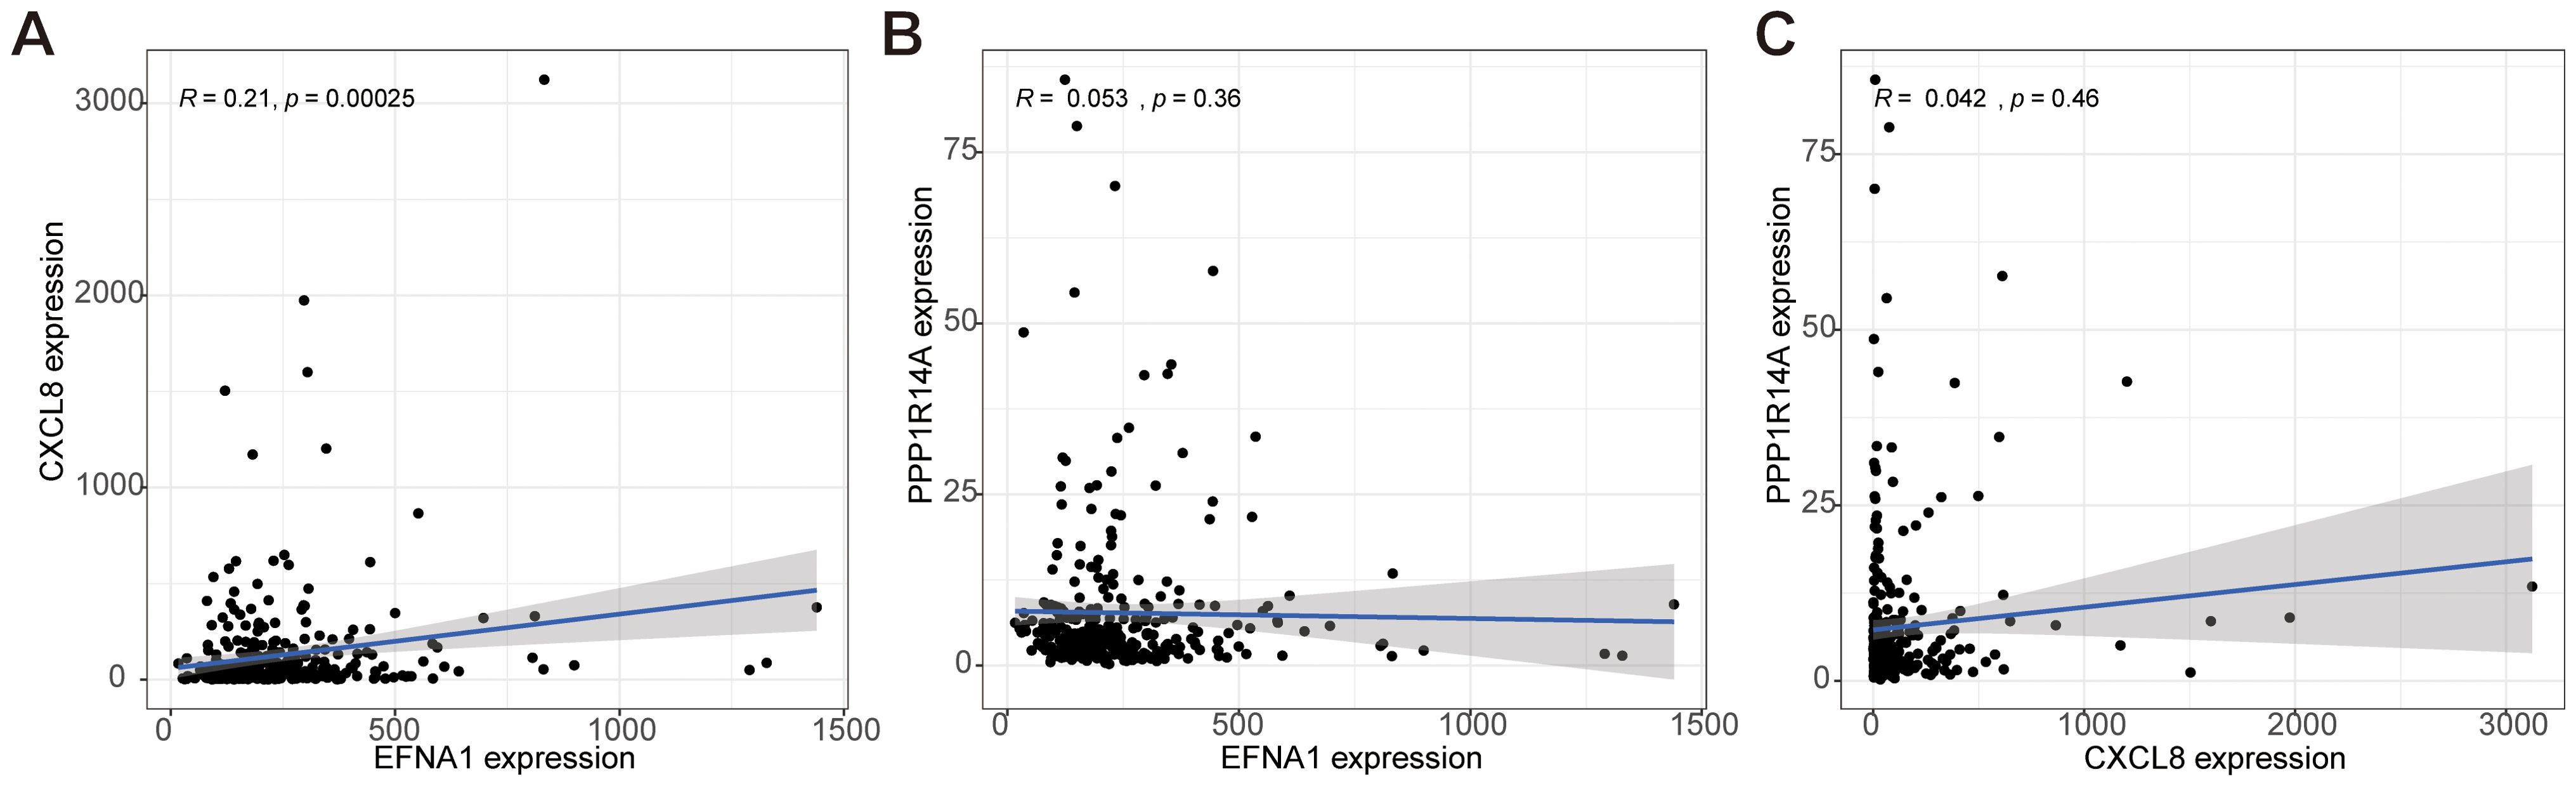
Figure 9. Analysis of the co-expression correlation for key genes EFNA1, CXCL8, and PPP1R14A. (A–C) The correlation among EFNA1, CXCL8, and PPP1R14A expressions in our cohort was determined by Spearman's correlation analysis.
3.9 Enrichment analysis of key survival prognostic genes using GSEA
GSEA systematically decoded functional networks of EFNA1, CXCL8, and PPP1R14A within the CESC immune microenvironment. EFNA1 exhibited dual regulatory capacity: GO terms implicated its involvement in keratinocyte differentiation and T cell receptor complex assembly (Figure 10A), while KEGG pathways connected it to MAPK signaling and cytoskeletal remodeling (Figure 10B). CXCL8 exhibited dual regulatory roles in cervical carcinogenesis, demonstrating pro-proliferative effects on endothelial/epithelial lineages (Figure 10C) concurrent with inflammasome activation through NOD-like receptor signaling pathways (Figure 10D). PPP1R14A emerged as a stromal interface regulator, with GO enrichment in fibroblast growth factor signaling and extracellular matrix (ECM) organization (Figure 10E), corroborated by KEGG pathways encompassing ECM-receptor interactions and cancer-associated adhesion molecules (Figure 10F). Multi-dimensional analysis reveals three synergistic pathological mechanisms in cervical squamous carcinogenesis: EFNA1-mediated immune-structural interactions regulate differentiation processes, CXCL8 coordinates proliferative-inflammatory equilibrium, and PPP1R14A drives stromal-ECM remodeling. These interconnected networks collectively promote tumor progression through differentiation dysregulation, immune evasion, and metastatic niche formation, identifying microenvironment-specific targets for precision immunotherapy development.
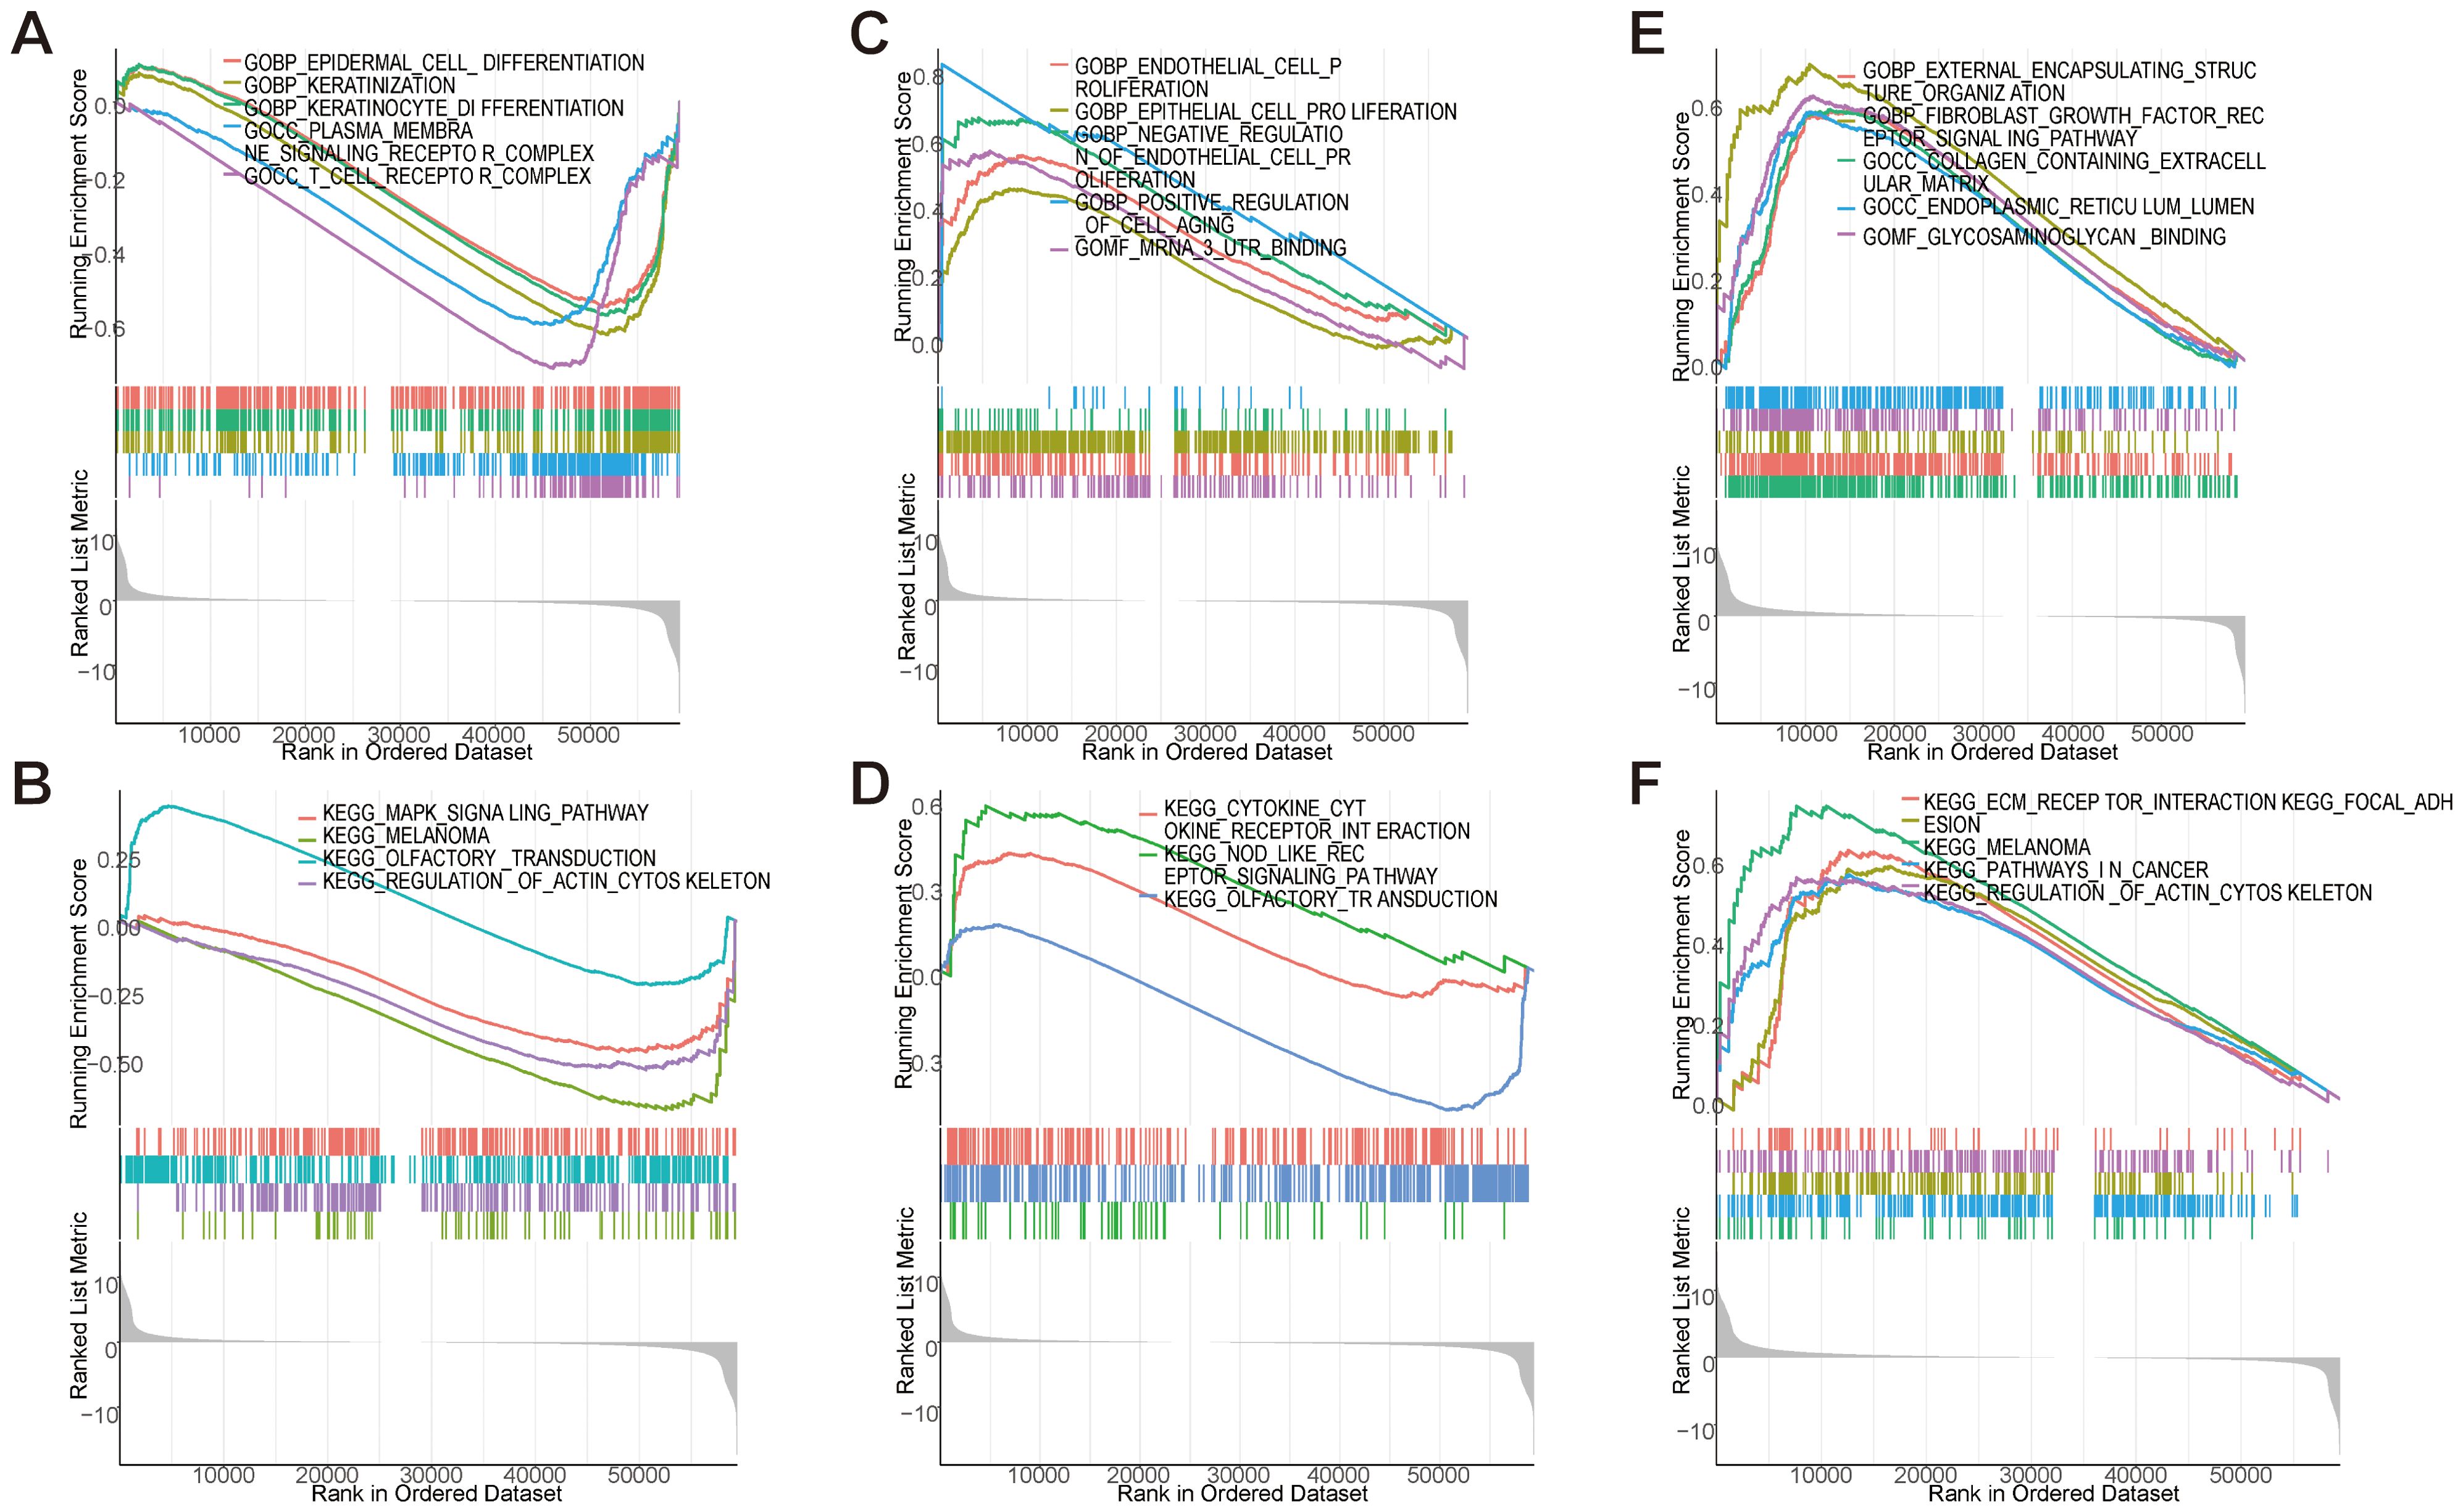
Figure 10. GSEA enrichment analysis of key genes. (A, B) GSEA analysis of EFNA1 gene. (C, D) GSEA analysis of CXCL8 gene. (E, F) GSEA analysis of PPP1R14A gene.
3.10 Clinical correlation analysis of key genes for survival prognosis
To investigate the role of key genes in cervical cancer survival prognosis, we comprehensively analyzed the correlation between the expression levels of EFNA1, CXCL8, and PPP1R14A, and various clinical features, including age, stage, tumor grade (T), lymph node status (N), and metastasis status (M). EFNA1 demonstrated lymph node-specific regulation with elevated expression in NX versus N1 cases (P=0.045, Figures 11A, E), showing no significant associations with age, stage, grade, or metastasis (Figures 11B-D, F). CXCL8 exhibited progressive upregulation in advanced disease stages (T3 vs T2, P=0.032; G3 vs G2, P=0.016; Figures 11G-J), independent of age or metastatic status (Figures 11K, L). PPP1R14A displayed age-dependent suppression (>65 years, P=0.032) and paradoxical elevation in TX-grade tumors (vs T1-2, P=0.023; Figures 11M, N, P), with no significant correlations to staging or metastasis (Figures 11O, Q, R). In short, EFNA1 demonstrates lymph node-specific biomarker potential, CXCL8 correlates with histopathological progression through stage/grade associations, and PPP1R14A exhibits age-related suppression and grade-dependent paradoxical expression. These differential clinical signatures collectively highlight their translational value for precision staging systems and biomarker-driven therapeutic stratification in CESC management.
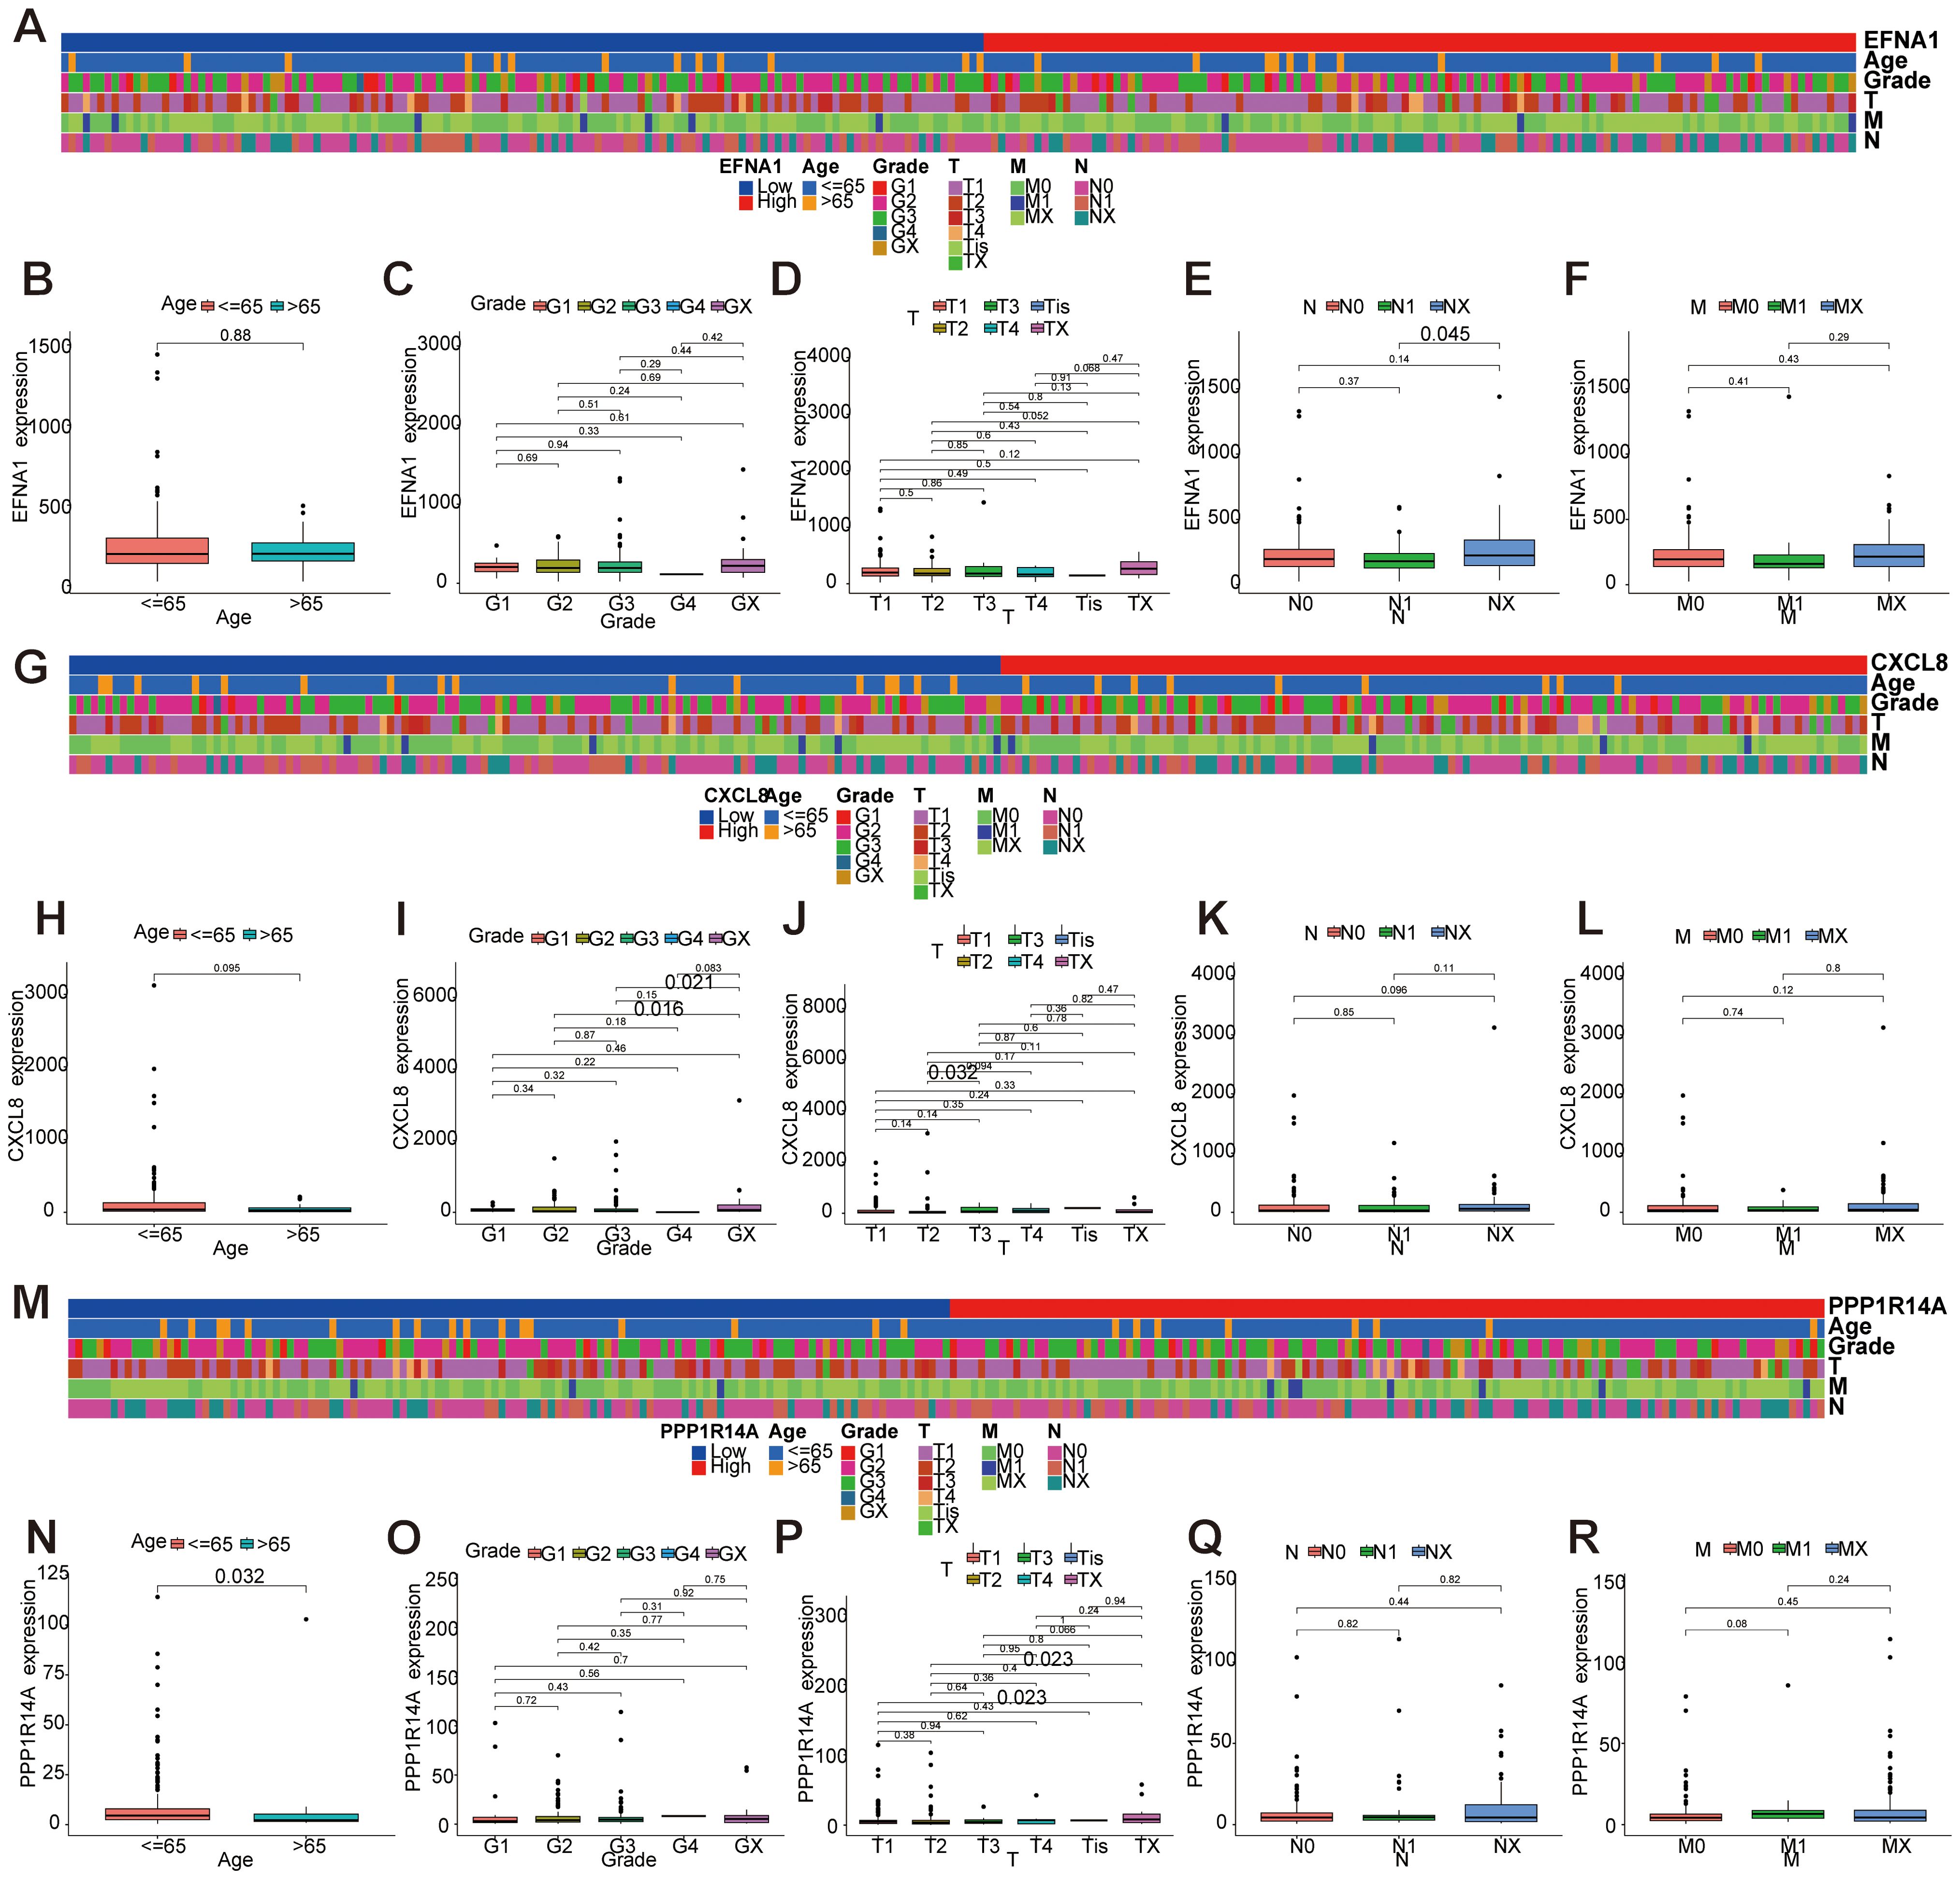
Figure 11. Correlation analysis between key gene expression and clinical features. (A-F) Correlation analysis between EFNA1 gene expression and clinical features. (G-L) Correlation analysis between gene expression of CXCL8 and clinical features. (M-R) Correlation analysis between PPP1R14A gene expression and clinical features.
3.11 Establishment and evaluation of a prognostic nomogram for key genes and clinical features
A prognostic nomogram integrating three molecular markers (EFNA1, CXCL8, PPP1R14A) with clinicopathological parameters (age, TNM stage) was developed to predict 3-/5-/8-year overall survival in cervical squamous cell carcinoma (Figure 12A). Tumor grade demonstrated the strongest prognostic weight (C-index: 0.785 training, 0.750 validation), followed by CXCL8 expression and metastasis status. The nomogram showed robust temporal discrimination (3-year AUC: 0.762 training, 0.689 validation; Figures 12B, C) and precise calibration (Figures 12D-I), with DCA confirming clinical utility across 10-45% risk thresholds (Figures 12J-O). This multivariable tool enables personalized survival prediction and risk-stratified therapeutic decision-making for CESC patients.
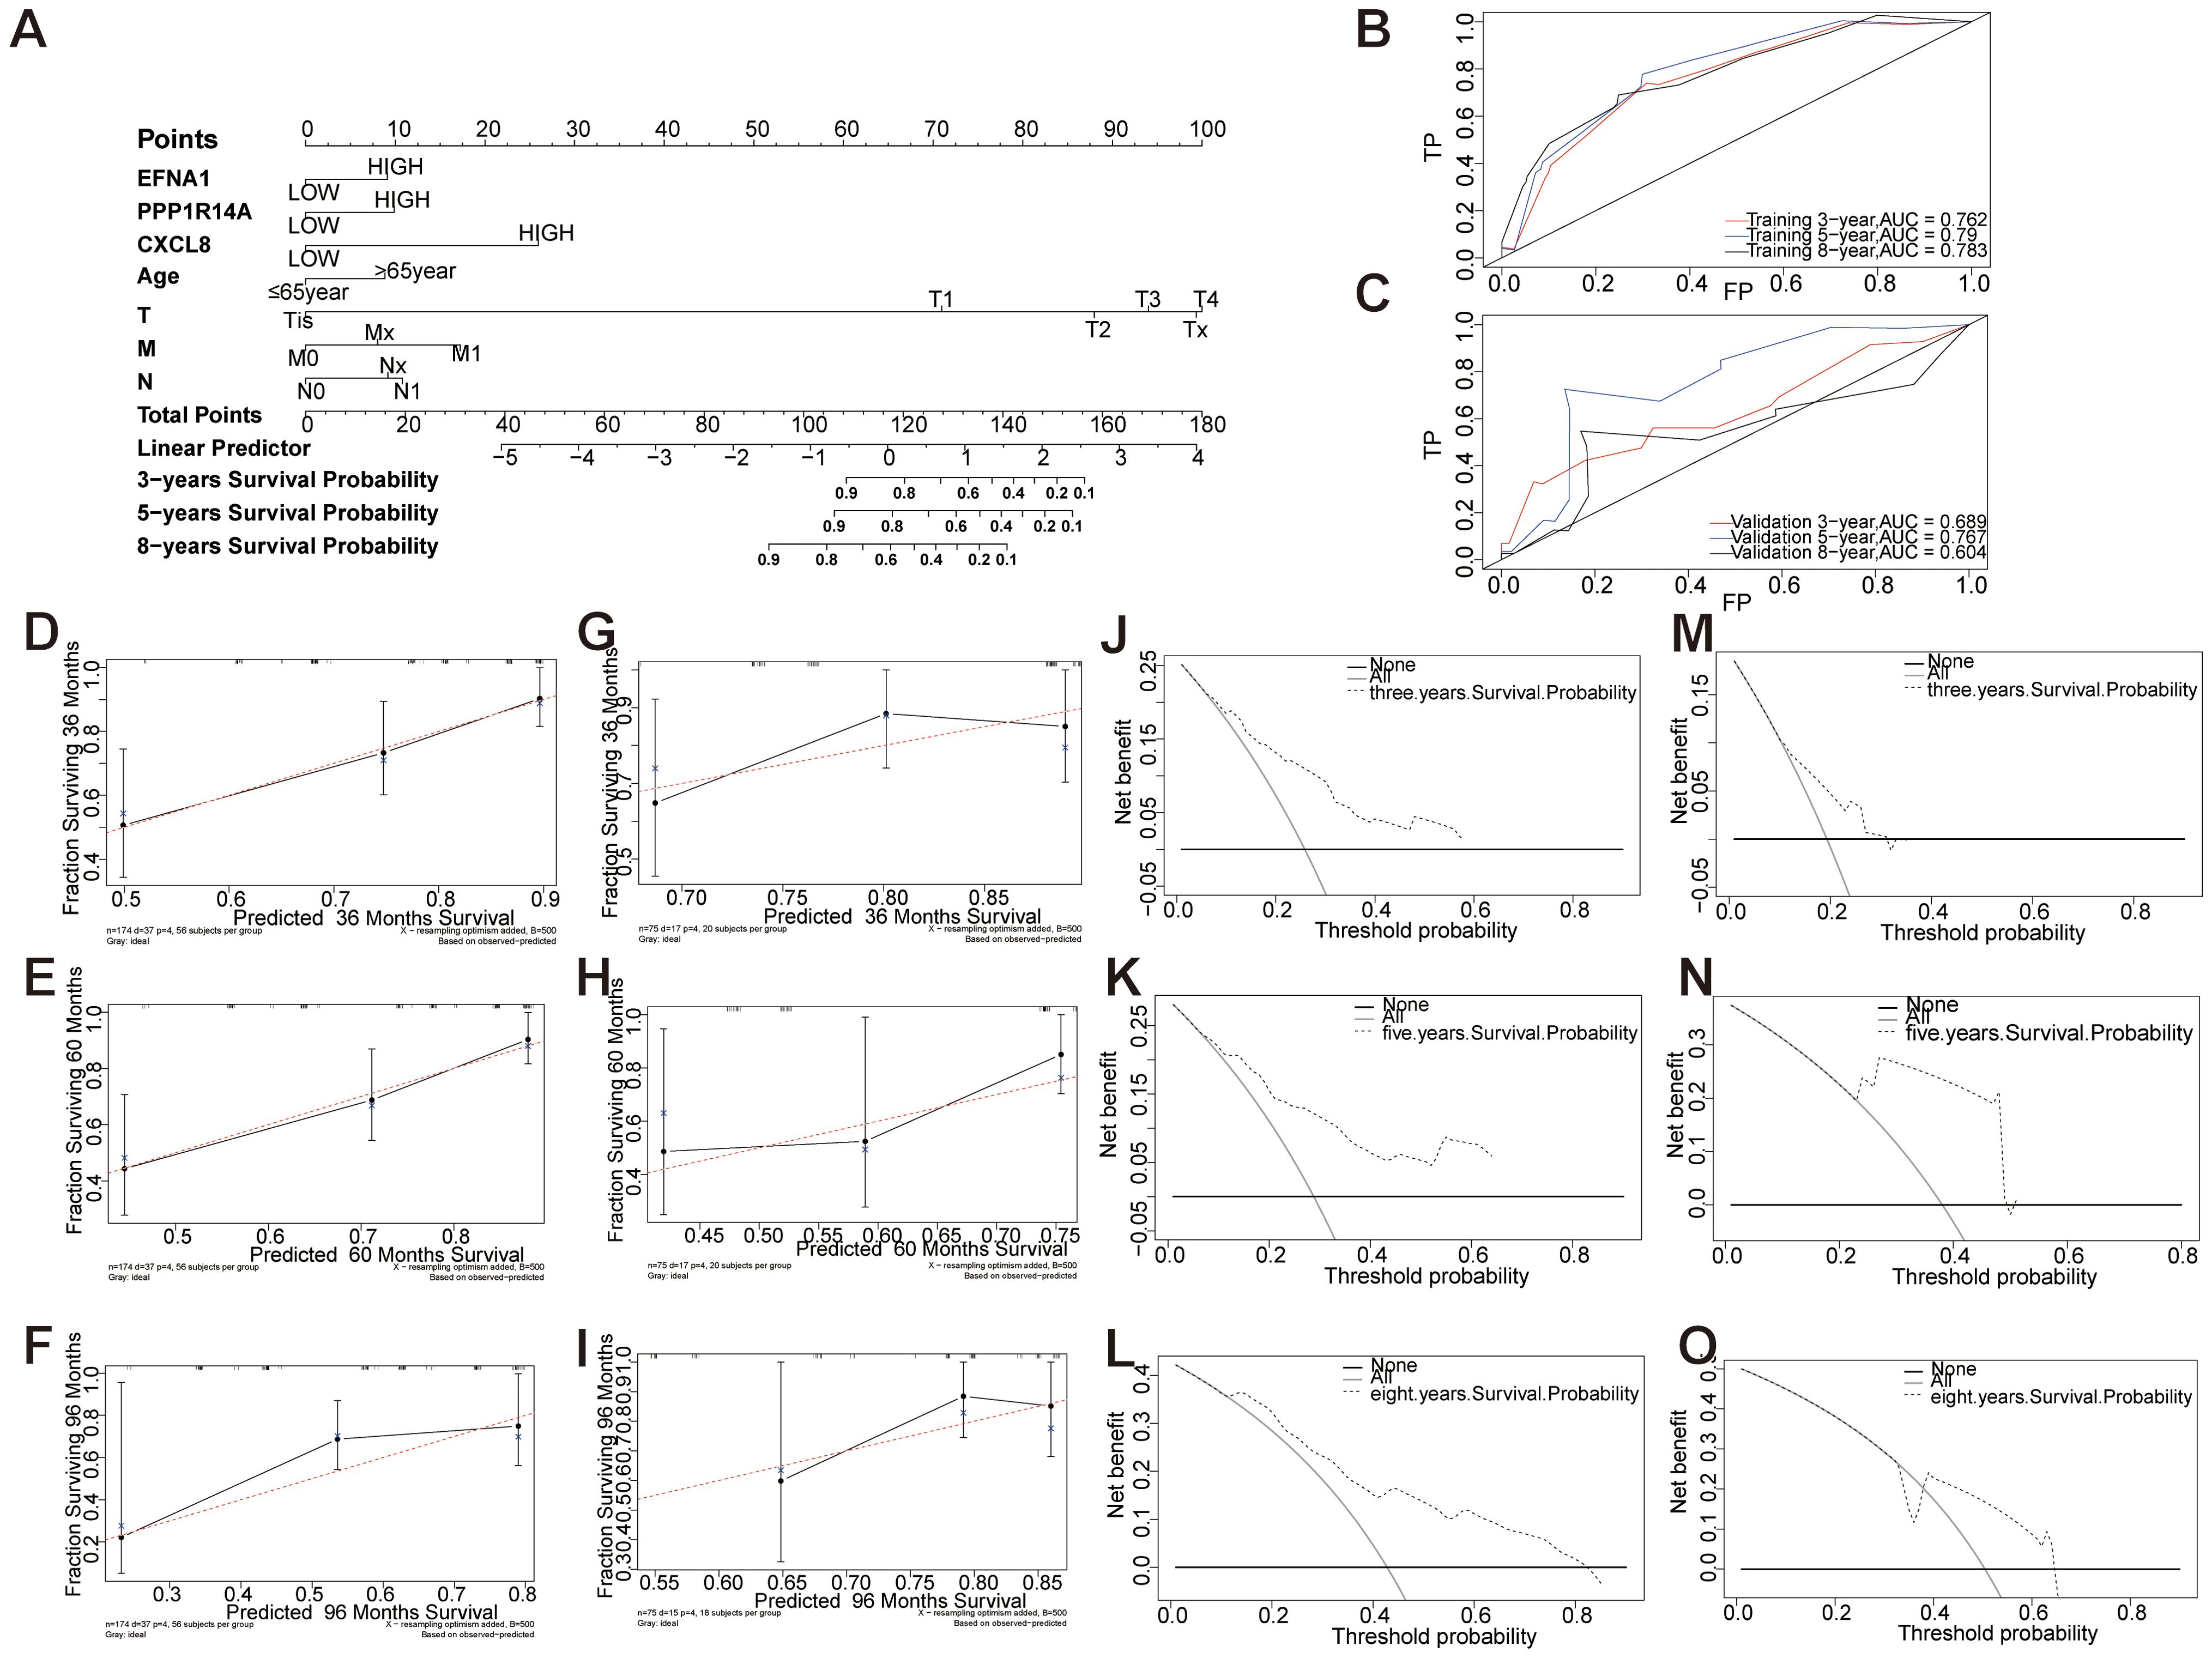
Figure 12. Establishment and evaluation of a prognostic nomogram of key genes and clinical features. (A) Models of OS for CESC patients at 3, 5, and 8 years. (B, C) Time-dependent curves (ROC) of the nomogram for 3-, 5-, and 8-year predictions in the training and validation cohorts. (D-I) Calibration charts of 3-year, 5-year, and 8-year overall survival for CESC patients in the training and validation cohorts. (J-O) Decision curve analysis of nomogram. DCA curves of 3-year, 5-year, and 8-year OS in the training queue and validation queue.
3.12 Key gene qRT-PCR validation
Cervical cancer primarily consists of squamous cell carcinoma (70%), adenocarcinoma (25%), and other rare types (5%) (22). Multimodal analysis of cervical carcinogenesis progression was conducted through histopathological evaluation and molecular profiling. Hematoxylin-eosin staining revealed progressive histoarchitectural alterations (Figure 13A): Control tissues maintained normal stratified squamous epithelium, LSIL specimens exhibited basal layer expansion with koilocytic changes, HSIL showed full-thickness dysplasia with nuclear hyperchromasia, and invasive carcinoma displayed complete architectural disarray with stromal invasion. Complementary qRT-PCR analysis demonstrated significant transcriptional upregulation of oncogenic effectors - EFNA1, CXCL8, and PPP1R14A in carcinoma versus control tissues (P<0.05) (Figure 13B). This coordinated overexpression pattern correlates with histopathological progression from premalignant lesions to invasive carcinoma, suggesting their synergistic role in cervical carcinogenesis.
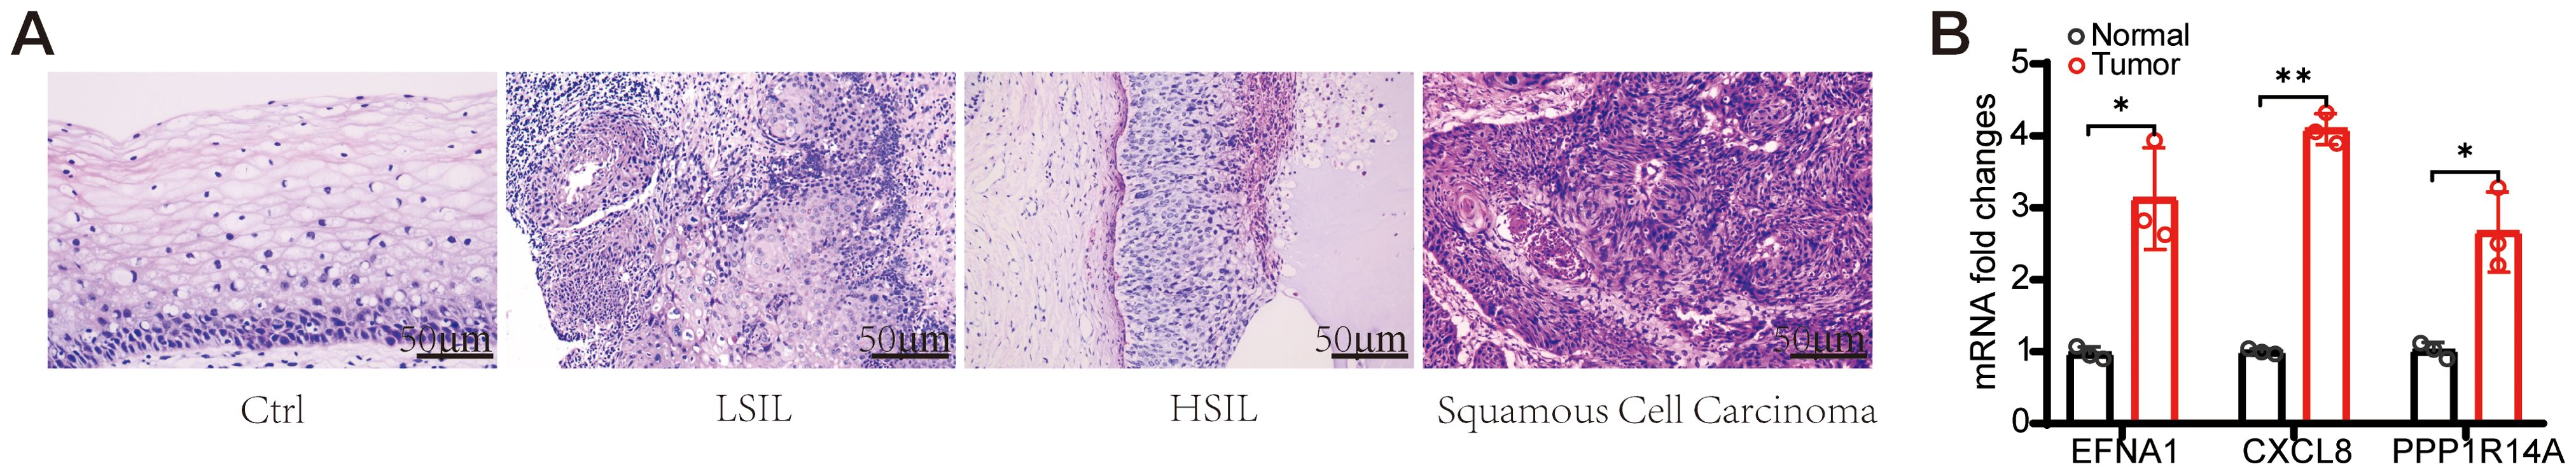
Figure 13. Morphological changes and Hub gene expression validation in CESC patients. (A) Typical HE staining images of CESC patients. (scale bar=50 μm). (B) EFNA1、CXCL1 and PPP1R14A mRNA expression levels were examined using qRT-PCR. (n=3, *P<0.05, **P<0.01 vs Normal).
4 Discussion
CESC poses a substantial threat to women’s health worldwide, with epidemiological studies showing ~80% of cases diagnosed at advanced stages (III-IV) where treatment efficacy remains limited (23, 24). Although therapeutic strategies have evolved, patients with advanced CESC still demonstrate poor clinical outcomes, emphasizing the imperative need for both validated prognostic biomarkers and elucidation of molecular progression mechanisms. In this study, we identified EFNA1, CXCL8, and PPP1R14A as core biomarkers that bridge prognosis with immune modulation, offering novel insights into CESC biology and therapeutic targeting.
EFNA1, a member of the Ephrin ligand family, regulates cell migration and angiogenesis through Eph receptor interactions (25, 26). Studies have shown that EFNA1 was associated with MAPK signaling, a pathway driving proliferation and invasion in CESC (27). In CESC, EFNA1’s association with lymph node metastasis (P=0.045) and may drive invasiveness via Eph receptor-mediated MAPK/STAT3 activation, a pathway linked to epithelial-mesenchymal transition (EMT) in solid tumors. CXCL8, a pro-inflammatory chemokine, was linked to NOD-like receptor signaling, which activates inflammasomes and modulates immune responses (28). In CESC, CXCL8 fosters an immunosuppressive tumor microenvironment by recruiting neutrophils and regulatory T cells (Tregs) (29), consistent with its correlation to advanced tumor stages and immune cell infiltration patterns. PPP1R14A, a member of the protein phosphatase 1 (PP1) inhibitor family, is also known as the 17kDa PKC-enhanced PP1 inhibitory protein (CPI-17) (30). Studies have shown that PPP1R14A plays a crucial role in the onset and progression of various tumors, including sporadic vestibular glioma, human melanoma, and schwannoma (30–32). PPP1R14A was associated with fibroblast growth factor signaling and extracellular matrix (ECM) organization, critical for stromal remodeling and tumor invasion (33). Its clinical correlations with tumor grades suggest it contributes to invasive phenotypes through ECM alterations. These pathways suggest that EFNA1, CXCL8, and PPP1R14A drive CESC progression through proliferation, immune modulation, and stromal alterations, respectively. Their interconnected roles merit further exploration.
The immune infiltration analysis further contextualized our findings by revealing elevated infiltration of CD8+ T cells, Tregs, and tumor-associated macrophages (TAMs) in CESC specimens. The activation of EFNA1 and mast cells provides a new target for Ephrin signaling in allergic diseases, highlighting tissue-specific immune modulation (34). EFNA1 correlated with dendritic cell activation (P<0.05), potentially enhancing antigen presentation. CXCL8 was associated with increased Tregs, NK cells, and neutrophils (P<0.05), supporting its immunosuppressive role (29). PPP1R14A influenced γδ T cells and M2 macrophages (P<0.05), linked to tumor progression (35, 36). However, this study did not assess survival outcomes tied to immune cell abundance—a limitation, as high Treg infiltration often predicts poor prognosis in cancers (37). Future survival analyses are needed to clarify these associations in CESC.
A prognostic nomogram integrating EFNA1, CXCL8, PPP1R14A, age, and TNM stage achieved strong predictive accuracy for 3-, 5-, and 8-year survival (3-year AUC: 0.762–0.763), with decision curve analysis confirming its utility. Recent studies have shown that EFNA1 overexpression serves as an independent prognostic risk factor in cervical cancer, demonstrating robust predictive value for survival outcomes (25, 38). CXCL8 plays a role in modulating immune infiltration, thereby influencing the prognosis of patients with various cancers, particularly cervical cancer (39–41). While research on PPP1R14A in CESC is limited, studies have shown that its high expression in bladder cancer (BCA) is associated with poor prognosis, suggesting its potential as a prognostic biomarker (42). Unlike prior models focusing on single biomarkers (43, 44), our nomogram combines multi-gene signatures with clinical parameters, achieving superior predictive accuracy. Experimental validation via qRT-PCR and HE staining showed significant upregulation of all three genes in CESC tissues (P<0.05), along with histopathological progression from normal epithelium to invasive carcinoma, further supporting their biological relevance.
However, the retrospective nature of TCGA and GEO data may introduce selection bias. Computational findings regarding immune infiltration require confirmation through immunohistochemistry or flow cytometry. Future research should validate these biomarkers in prospective cohorts and explore their functional roles through single-cell sequencing or knockout models. Additionally, prospective validation of the nomogram and survival analyses examining the relationship between immune cell abundance and clinical outcomes are crucial next steps.
5 Conclusion
In this study, we developed a predictive risk model for CESC by integrating EFNA1, CXCL8, and PPP1R14A gene expression profiles with clinical baseline characteristics. This prognostic nomogram demonstrates strong predictive power while requiring only a minimal gene panel, thereby reducing economic burdens on patients and showing potential for clinical application and translational research. Furthermore, the nomogram independently predicts patient prognosis and complements existing TNM staging systems, offering comprehensive information to support clinical decision-making. With future validation in more clinical cases, our research is poised to benefit a broader patient population and propel advancements in personalized cancer treatment and precision medicine.
Data availability statement
Publicly available datasets were analyzed in this study. This data can be found here: Publicly available datasets were analyzed in this study. This data can be found at: TCGA (https://portal.gdc.cancer.gov/); GEO (https://www.ncbi.nlm.nih.gov/geo/) with accession numbers: GSE9750、GSE39001 and GSE122697.
Ethics statement
The study protocol was reviewed and approved by the Ethics Committees of The Second Hospital of Guangdong Medical University Ethics Committee (Approval No. PJKT2024-134). The studies were conducted in accordance with the local legislation and institutional requirements. The participants provided their written informed consent to participate in this study.
Author contributions
YC: Conceptualization, Data curation, Funding acquisition, Investigation, Methodology, Project administration, Resources, Supervision, Validation, Writing – original draft. QD: Conceptualization, Data curation, Formal Analysis, Funding acquisition, Methodology, Project administration, Software, Validation, Visualization, Writing – original draft. TF: Conceptualization, Data curation, Formal Analysis, Methodology, Resources, Software, Visualization, Writing – original draft. YH: Conceptualization, Data curation, Formal Analysis, Investigation, Methodology, Software, Visualization, Writing – original draft. HL: Conceptualization, Data curation, Formal Analysis, Investigation, Project administration, Resources, Supervision, Visualization, Writing – original draft. JX: Conceptualization, Data curation, Formal Analysis, Investigation, Software, Supervision, Validation, Writing – original draft. FL: Conceptualization, Data curation, Formal Analysis, Investigation, Methodology, Supervision, Visualization, Writing – original draft. FZ: Conceptualization, Data curation, Formal Analysis, Funding acquisition, Investigation, Resources, Validation, Visualization, Writing – original draft. XF: Conceptualization, Data curation, Formal Analysis, Project administration, Resources, Validation, Visualization, Writing – review & editing, Writing – original draft. RL: Conceptualization, Data curation, Formal Analysis, Software, Validation, Visualization, Writing – original draft, Writing – review & editing. ZC: Conceptualization, Data curation, Formal Analysis, Investigation, Methodology, Project administration, Software, Supervision, Visualization, Writing – original draft, Writing – review & editing.
Funding
The author(s) declare that financial support was received for the research and/or publication of this article. This work was supported by 2023 Medical Science and Technology Research Fund of Guangdong Province (No. B2023479) and 2023 Unfunded Science and Technology Project of Zhanjiang City (No.2023B01169).
Conflict of interest
The authors declare that the research was conducted in the absence of any commercial or financial relationships that could be construed as a potential conflict of interest.
Generative AI statement
The author(s) declare that no Generative AI was used in the creation of this manuscript.
Publisher’s note
All claims expressed in this article are solely those of the authors and do not necessarily represent those of their affiliated organizations, or those of the publisher, the editors and the reviewers. Any product that may be evaluated in this article, or claim that may be made by its manufacturer, is not guaranteed or endorsed by the publisher.
Supplementary material
The Supplementary Material for this article can be found online at: https://www.frontiersin.org/articles/10.3389/fonc.2025.1524225/full#supplementary-material
References
1. Sung H, Ferlay J, Siegel RL, Laversanne M, Soerjomataram I, Jemal A, et al. Global cancer statistics 2020: GLOBOCAN estimates of incidence and mortality worldwide for 36 cancers in 185 countries. CA Cancer J Clin. (2021) 71:3. doi: 10.3322/caac.21660
2. Grau-Bejar JF, Garcia-Duran C, Garcia-Illescas D, Mirallas O, Oaknin A. Advances in immunotherapy for cervical cancer. Ther Adv Med Oncol. (2023) 15:1–18. doi: 10.1177/17588359231163836
3. Guimarães YM, Godoy LR, Longatto-Filho A, Reis RD. Management of early-stage cervical cancer: A literature review. Cancers (Basel). (2022) 14:3. doi: 10.3390/cancers14030575
4. Bogani G, Di Donato V, Scambia G, Raspagliesi F, Chiantera V, Sozzi G, et al. Radical hysterectomy for early stage cervical cancer. Int J Environ Res Public Health. (2022) 19:18. doi: 10.3390/ijerph191811641
5. Cho O, Chun M. Management for locally advanced cervical cancer: new trends and controversial issues. Radiat Oncol J. (2018) 36:4. doi: 10.3857/roj.2018.00500
6. Perkins RB, Wentzensen N, Guido RS, Schiffman M. Cervical cancer screening: A review. Jama. (2023) 330:6. doi: 10.1001/jama.2023.13174
7. Bray F, Ferlay J, Soerjomataram I, Siegel RL, Torre LA, Jemal A. Global cancer statistics 2018: GLOBOCAN estimates of incidence and mortality worldwide for 36 cancers in 185 countries. CA Cancer J Clin. (2018) 68:6. doi: 10.3322/caac.21492
8. Höhn AK, Brambs CE, Hiller GGR, May D, Schmoeckel E, Horn LC. 2020 WHO classification of female genital tumors. Geburtshilfe Frauenheilkd. (2021) 81:10. doi: 10.1055/a-1545-4279
9. Budczies J, Kazdal D, Menzel M, Beck S, Kluck K, Altbürger C, et al. Tumour mutational burden: clinical utility, challenges and emerging improvements. Nat Rev Clin Oncol. (2024) 21:10. doi: 10.1038/s41571-024-00932-9
10. Dai Y, Muaibati M, Xie W, Abasi A, Li K, Tong Q, et al. PD-1/PD-L1 inhibitors monotherapy for the treatment of endometrial cancer: meta-analysis and systematic review. Cancer Invest. (2022) 40:3. doi: 10.1080/07357907.2021.2012188
11. Bruni D, Angell HK, Galon J. The immune contexture and Immunoscore in cancer prognosis and therapeutic efficacy. Nat Rev Cancer. (2020) 20:11. doi: 10.1038/s41568-020-0285-7
12. Barrett T, Wilhite SE, Ledoux P, Evangelista C, Kim IF, Tomashevsky M, et al. NCBI GEO: archive for functional genomics data sets–update. Nucleic Acids Res. (2013) 41:D991–D995. doi: 10.1093/nar/gks1193
13. Tomczak K, Czerwińska P, Wiznerowicz M. The Cancer Genome Atlas (TCGA): an immeasurable source of knowledge. Contemp Oncol (Pozn). (2015) 19:1a. doi: 10.5114/wo.2014.47136
14. Ritchie ME, Phipson B, Wu D, Hu Y, Law CW, Shi W, et al. limma powers differential expression analyses for RNA-sequencing and microarray studies. Nucleic Acids Res. (2015) 43:7. doi: 10.1093/nar/gkv007
15. Dennis G Jr., Sherman BT, Hosack DA, Yang J, Gao W, Lane HC, et al. DAVID: database for annotation, visualization, and integrated discovery. Genome Biol. (2003) 4:5. doi: 10.1186/gb-2003-4-9-r60
16. Yu G, Wang LG, Han Y, He QY. clusterProfiler: an R package for comparing biological themes among gene clusters. Omics. (2012) 16:5. doi: 10.1089/omi.2011.0118
17. Liu J, Feng M, Li S, Nie S, Wang H, Wu S, et al. Identification of molecular markers associated with the progression and prognosis of endometrial cancer: a bioinformatic study. Cancer Cell Int. (2020) 20:59. doi: 10.1186/s12935-020-1140-3
18. Aleksander SA, Balhoff J, Carbon S, Cherry JM, Drabkin HJ, Ebert D, et al. The gene ontology knowledgebase in 2023. Genetics. (2023) 224:1. doi: 10.1093/genetics/iyad031
19. Guler H, Guler EO. Mixed Lasso estimator for stochastic restricted regression models. J Appl Stat. (2021) 48:13–5. doi: 10.1080/02664763.2021.1922614
20. Nakao H, Imaoka M, Hida M, Imai R, Nakamura M, Matsumoto K, et al. Determination of individual factors associated with hallux valgus using SVM-RFE. BMC Musculoskel Disord. (2023) 24:1. doi: 10.1186/s12891-023-06303-2
21. Liang Y, Lin F, Huang Y. Identification of biomarkers associated with diagnosis of osteoarthritis patients based on bioinformatics and machine learning. J Immunol Res. (2022) 2022:56190. doi: 10.1155/2022/5600190
22. Cohen PA, Jhingran A, Oaknin A, Denny L. Cervical cancer. Lancet. (2019) 393:10167. doi: 10.1016/s0140-6736(18)32470-x
23. Volkova LV, Pashov AI, Omelchuk NN. Cervical carcinoma: oncobiology and biomarkers. Int J Mol Sci. (2021) 22:22. doi: 10.3390/ijms222212571
24. Arbyn M, Weiderpass E, Bruni L, de Sanjosé S, Saraiya M, Ferlay J, et al. Estimates of incidence and mortality of cervical cancer in 2018: a worldwide analysis. Lancet Glob Health. (2020) 8:2. doi: 10.1016/s2214-109x(19)30482-6
25. Shen X, Li M, Lei Y, Lu S, Wang S, Liu Z, et al. An integrated analysis of single-cell and bulk transcriptomics reveals EFNA1 as a novel prognostic biomarker for cervical cancer. Hum Cell. (2022) 35:2. doi: 10.1007/s13577-022-00679-4
26. Adu-Gyamfi EA, Czika A, Liu TH, Gorleku PN, Fondjo LA, Djankpa FT, et al. Ephrin and Eph receptor signaling in female reproductive physiology and pathology†. Biol Reprod. (2021) 104:1. doi: 10.1093/biolre/ioaa171
27. Hao Y, Li G. Role of EFNA1 in tumorigenesis and prospects for cancer therapy. BioMed Pharmacother. (2020) 130:110567. doi: 10.1016/j.biopha.2020.110567
28. Mantovani A, Cassatella MA, Costantini C, Jaillon S. Neutrophils in the activation and regulation of innate and adaptive immunity. Nat Rev Immunol. (2011) 11:8. doi: 10.1038/nri3024
29. Ha H, Debnath B, Neamati N. Role of the CXCL8-CXCR1/2 axis in cancer and inflammatory diseases. Theranostics. (2017) 7:6. doi: 10.7150/thno.15625
30. Hagel C, Dornblut C, Schulz A, Wiehl U, Friedrich RE, Huckhagel T, et al. The putative oncogene CPI-17 is up-regulated in schwannoma. Neuropathol Appl Neurobiol. (2016) 42:7. doi: 10.1111/nan.12330
31. Riecken LB, Zoch A, Wiehl U, Reichert S, Scholl I, Cui Y, et al. CPI-17 drives oncogenic Ras signaling in human melanomas via Ezrin-Radixin-Moesin family proteins. Oncotarget. (2016) 7:48. doi: 10.18632/oncotarget.12919
32. Xu J, Zhang Y, Shi Y, Yin D, Dai P, Zhao W, et al. CPI-17 overexpression and its correlation with the NF2 mutation spectrum in sporadic vestibular schwannomas. Otol Neurotol. (2020) 41:1. doi: 10.1097/mao.0000000000002430
33. Kolosova IA, Ma S-F, Adyshev DM, Wang P, Ohba M, Natarajan V, et al. Role of CPI-17 in the regulation of endothelial cytoskeleton. Am J Physiol Lung Cell Mol Physiol. (2004) 287:(5):L970–80. doi: 10.1152/ajplung.00398.2003
34. Nakamoto E. Eph receptors and ephrins. Int J Biochem Cell Biol. (2000) 32(1):7–12. doi: 10.1016/s1357-2725(99)00096-5
35. Raverdeau M, Cunningham SP, Harmon C, Lynch L. γδ T cells in cancer: a small population of lymphocytes with big implications. Clin Transl Immunol. (2019) 8:10. doi: 10.1002/cti2.1080
36. Choi Y, Lee D, Kim NY, Seo I, Park NJ, Chong GO. Role of tumor-associated macrophages in cervical cancer: integrating classical perspectives with recent technological advances. Life (Basel). (2024) 14:4. doi: 10.3390/life14040443
37. Shang B, Liu Y, Jiang SJ, Liu Y. Prognostic value of tumor-infiltrating FoxP3+ regulatory T cells in cancers: a systematic review and meta-analysis. Sci Rep. (2015) 5:15179. doi: 10.1038/srep15179
38. Dong X, Chen X, Xue M, Zhang Y, Jiang P. EFNA1 promotes the tumorigenesis and metastasis of cervical cancer by phosphorylation pathway and epithelial-mesenchymal transition. Acta Histochem. (2025) 127:2. doi: 10.1016/j.acthis.2025.152236
39. Yin Y, Li Y, Zhang Y, Jia Q, Tang H, Chen J, et al. CXCL8 may serve as a potential biomarker for predicting the prognosis and immune response in cervical cancer. Discov Oncol. (2024) 15:1. doi: 10.1007/s12672-024-01475-2
40. Zhang N, Pang C, Li Z, Xu F, Zhao L. Serum CXCL8 and CXCR2 as diagnostic biomarkers for noninvasive screening of cervical cancer. Med (Baltimore). (2023) 102:34. doi: 10.1097/md.0000000000034977
41. Sarode P, Schaefer MB, Grimminger F, Seeger W, Savai R. Macrophage and tumor cell cross-talk is fundamental for lung tumor progression: we need to talk. (2020) 10:324. doi: 10.3389/fonc.2020.00324
42. Lou K, Chi J, Zheng X, Cui Y. PPP1R14A as a potential biomarker for predicting the progression and prognosis of bladder cancer. Asian J Surg. (2024) 47:9. doi: 10.1016/j.asjsur.2024.05.076
43. Xiang S, Wang M, Li Q, Yang Z. Unveiling the role of HACE1 in cervical cancer: implications for human papillomavirus infection and prognosis. Transl Cancer Res. (2024) 13:5. doi: 10.21037/tcr-23-2120
Keywords: cervical squamous cell carcinoma (CESC), diagnosis, survival prognosis, immune infiltration, biomarker
Citation: Chen Y, Deng Q, Fu T, Huang Y, Li H, Xie J, Liao F, Zeng F, Fang X, Li R and Chen Z (2025) Comprehensive analysis of potential biomarkers for the diagnosis and prognosis of Cervical squamous cell carcinoma - based on GEO and TCGA databases. Front. Oncol. 15:1524225. doi: 10.3389/fonc.2025.1524225
Received: 07 November 2024; Accepted: 08 April 2025;
Published: 08 May 2025.
Edited by:
Kunqi Chen, Fujian Medical University, ChinaReviewed by:
Prabhat Kumar Sharma, Children’s Hospital of Philadelphia, United StatesZhijian Huang, Fujian Medical University, China
Copyright © 2025 Chen, Deng, Fu, Huang, Li, Xie, Liao, Zeng, Fang, Li and Chen. This is an open-access article distributed under the terms of the Creative Commons Attribution License (CC BY). The use, distribution or reproduction in other forums is permitted, provided the original author(s) and the copyright owner(s) are credited and that the original publication in this journal is cited, in accordance with accepted academic practice. No use, distribution or reproduction is permitted which does not comply with these terms.
*Correspondence: Xinyi Fang, ZmFuZ3hpbmd5aUBob3RtYWlsLmNvbQ==; Ruiman Li, aHF5eWNrQDEyNi5jb20=; Zhuming Chen, ODY3Nzk2Nzg4QHFxLmNvbQ==
†These authors have contributed equally to this work and share first authorship