 Menghong Zou
 Hongwei Li
 Hongchao Yao1
- 1Department of Radiology, The Third Hospital of Mianyang (Sichuan Mental Health Center), Mianyang, China
- 2Department of Neurosurgery, The Third Hospital of Mianyang (Sichuan Mental Health Center), Mianyang, China
Objectives: To evaluate and compare the efficacy of radiomics models derived from T2-weighted and/or contrast-enhanced T1-weighted (CET1) images in assessing pituitary macroadenoma consistency, and to validate their performance stability under varying MRI field strengths and scanner vendors.
Methods: A total of 133 patients with pathologically proven pituitary macroadenomas (35 fibrous, 98 non-fibrous) were retrospectively included. Three logistic regression models were constructed: a T2 model, a CET1 model, and a T2-CET1 combined model, based on features selected from coronal T2-weighted and contrast-enhanced T1-weighted (CET1) images. An external validation cohort of 40 patients (20 fibrous, 20 non-fibrous) was selected from another healthcare institution. Model performance was primarily evaluated using receiver operating characteristic (ROC) analysis. Stratified analyses were performed to compare the predictive performance of the models across different magnetic field strengths (1.5T and 3.0T) and scanner vendors.
Results: In the test dataset, the T2-CET1 combined model outperformed both the independent CET1 and T2 models, achieving an AUC of 0.86, accuracy of 83.3%, sensitivity of 83.3%, and specificity of 83.8%. This compares favorably with the CET1 model (AUC: 0.80, accuracy: 73.3%, sensitivity: 80.0%, specificity: 66.7%) and the T2 model (AUC: 0.79, accuracy: 76.7%, sensitivity: 76.7%, specificity: 76.7%). The combined model’s superior performance extended to the external validation set, where its AUC (0.865) exceeded that of the CET1 model (0.765) and the T2 model (0.811). Performance varied by MRI field strength. For 1.5T systems, AUCs were 0.50 (CET1), 0.76 (T2), and 0.58 (combined). For 3.0T systems, the corresponding AUCs were 0.61, 0.83, and 0.56. Similarly, analysis by specific scanner model showed AUCs of 0.60 (CET1), 0.83 (T2), and 0.53 (combined) for one scanner, compared to 0.54, 0.84, and 0.52 for the other.
Conclusions: Combining CET1 with T2 improves prediction performance for pituitary macroadenoma consistency. However, the T2 model demonstrates greater stability across different equipment than either the CET1 or combined models.
Highlights
● Preoperative assessment of pituitary macroadenoma consistency can inform clinical management and predict surgical risk.
● The radiomics model using combined CET1 and T2 imaging sequences is superior to single-sequence models in predicting pituitary adenoma consistency.
● Compared to CET1-based or combined T2-CET1 models, the T2-based model exhibits lower variability across different field strengths and equipment manufacturers.
1 Introduction
Pituitary adenoma is the most common sellar tumor and the third most common intracranial tumor, accounting for approximately 10–25% of central nervous system tumors (1–4). Surgical resection, primarily via the transsphenoidal approach, represents the mainstay of treatment (5, 6). Accurately predicting the preoperative texture (non-fibrous vs. fibrous) of a pituitary macroadenoma is critical to optimizing the choice of surgical approach (7). For example, tumors predicted to be rigid or fibrotic may require a broader surgical approach (e.g., a double-nostril approach rather than a single-nostril approach) or advance planning of alternative approaches (e.g., a transcranial approach), especially in complex anatomical situations such as large tumors, invasion of the cavernous sinus, or significant expansion into the saddle (8–10). Radiomics quantifies imperceptible lesion characteristics by mathematically analyzing spatial distributions and pixel intensities within medical images. Recent studies have applied MRI radiomics to evaluate pituitary adenoma texture. For instance, Cuocolo et al. (11) developed an MR-based radiomics model predicting macroadenoma consistency, achieving an AUC of 0.99 and accuracy of 0.93. However, this study was limited by its small sample size, exclusive use of T2-weighted sequences, and reliance on unvalidated subjective intraoperative consistency assessments. Crucially, multi-sequence MRI typically provides richer diagnostic information (12–14), and contrast-enhanced T1-weighted (CE-T1) imaging—essential for pituitary adenoma diagnosis and differential diagnosis—remains unexplored in radiomics-based consistency prediction. This study aims to develop a more accurate predictive model for pituitary macroadenoma consistency using a larger patient cohort and multi-sequence MR images (including CE-T1), thereby optimizing surgical approach selection. Concurrently, we evaluate model stability under defined conditions.
2 Materials and methods
2.1 Patient data collection
Patients diagnosed with pituitary macroadenoma between January 2011 and August 2020 were identified within the Picture Archiving and Communication System (PACS), yielding a total of 133 patients. Inclusion criteria were: (a) preoperative MR plain scan and contrast-enhanced examination with complete imaging data; (b) complete clinical data, including surgical records and postoperative pathological results; and (c) pituitary macroadenoma diameter ≥1 cm. Exclusion criteria were: (a) poor image quality inadequate for radiomic analysis; and (b) recurrent pituitary macroadenoma. The patient screening process is shown in Figure 1.
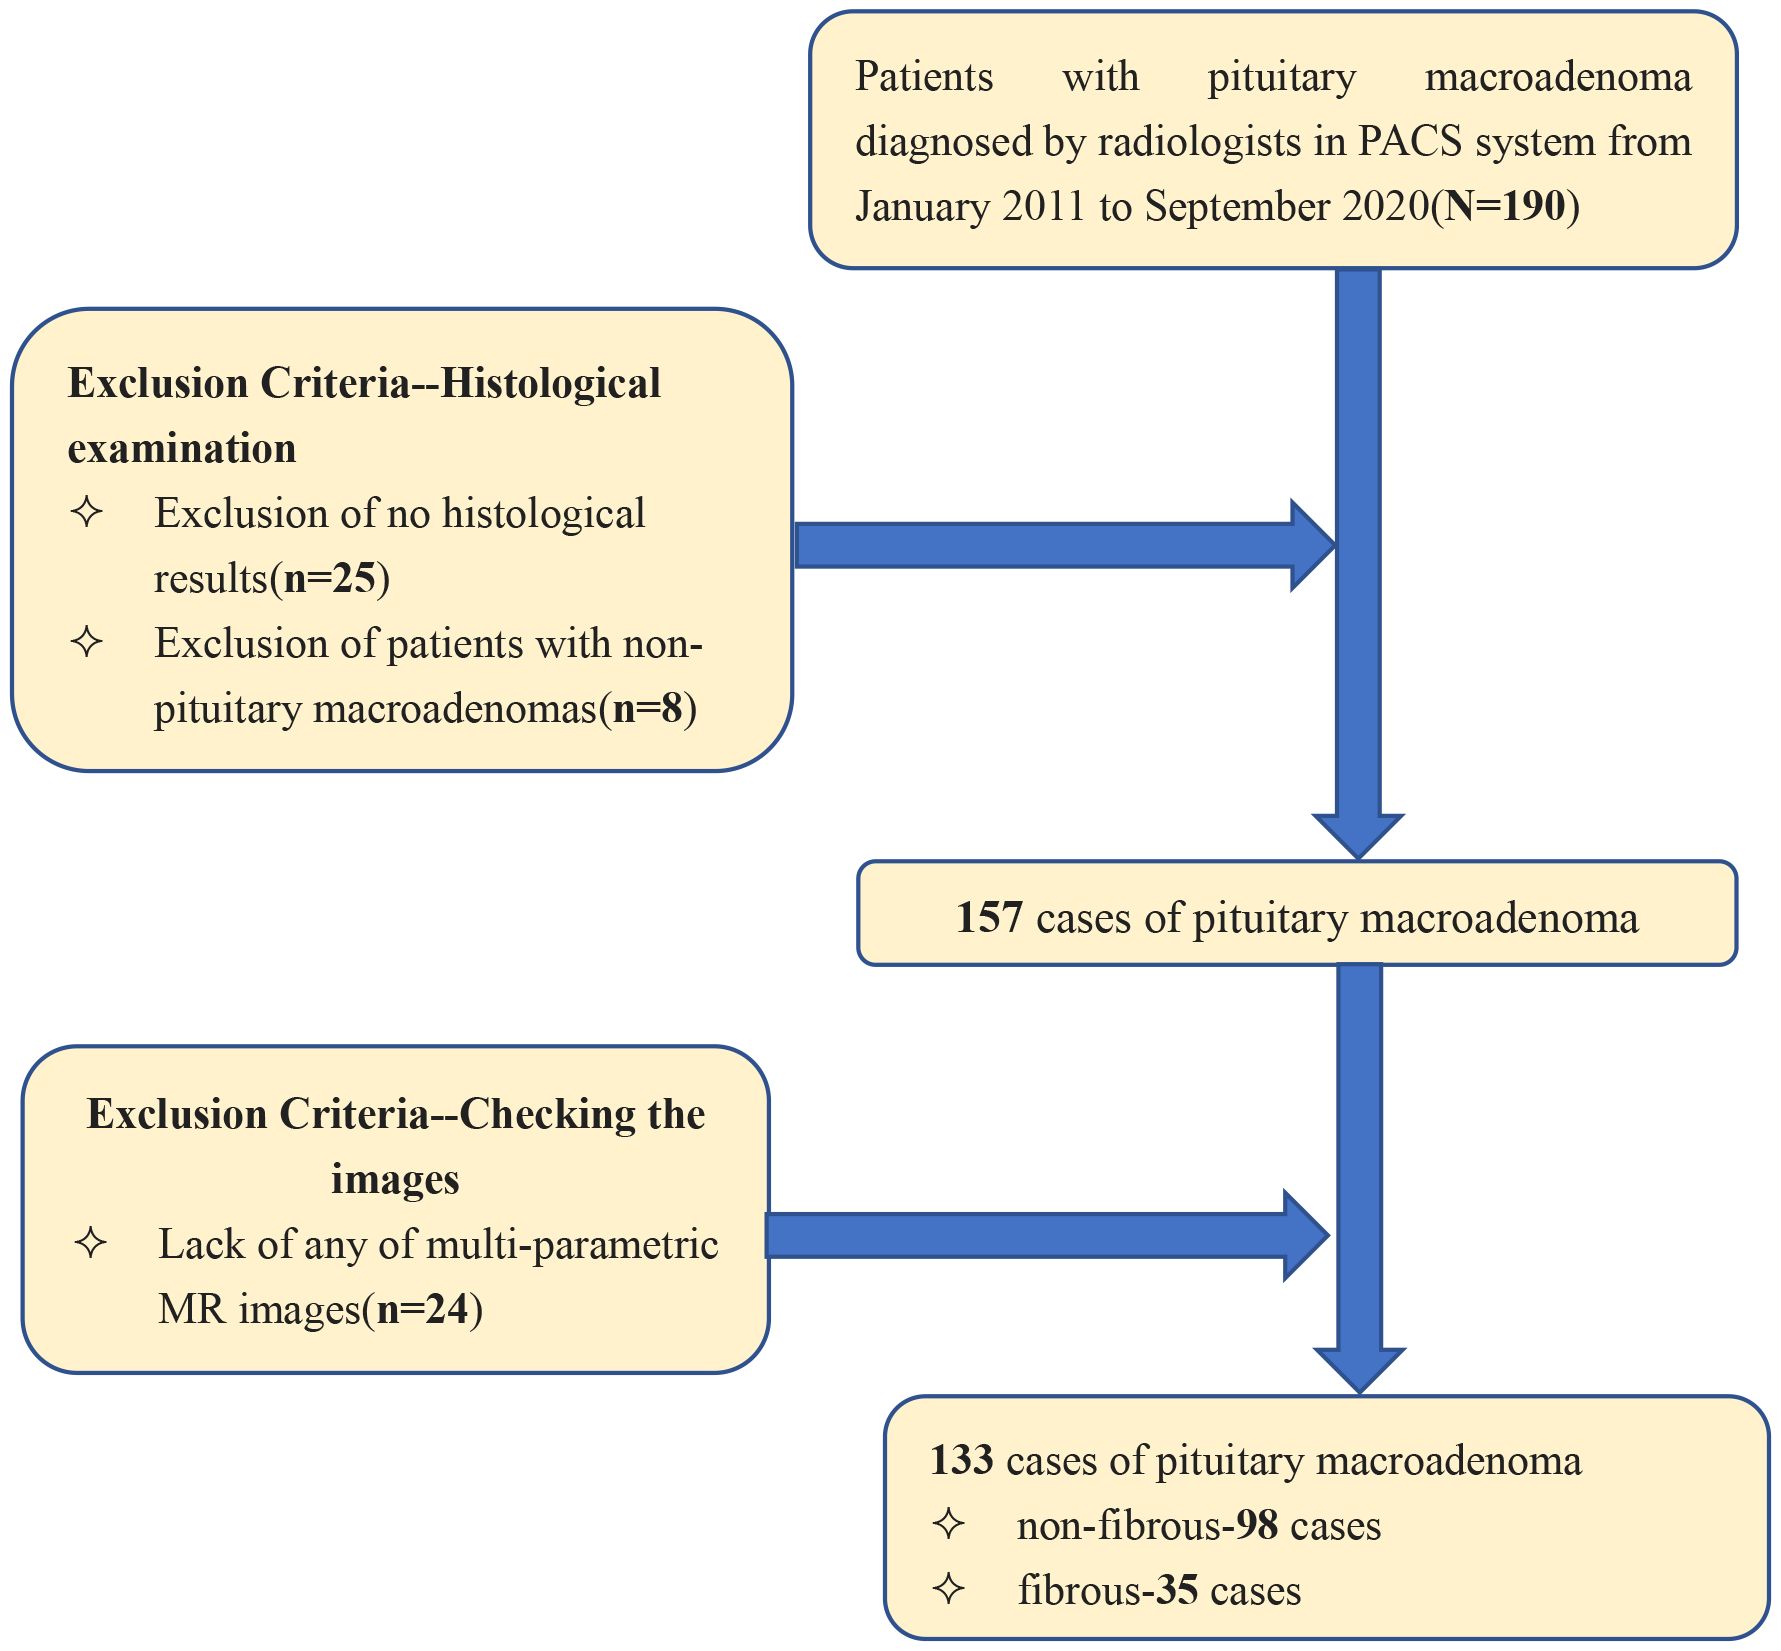
Figure 1. The patient screening process.
2.2 Study design
The study workflow is shown in Figure 2 and comprises four steps: (1) patient cohort enrollment and tumor segmentation, (2) feature extraction, (3) model construction and evaluation, and (4) stratified analysis based on equipment type and magnetic field strength.
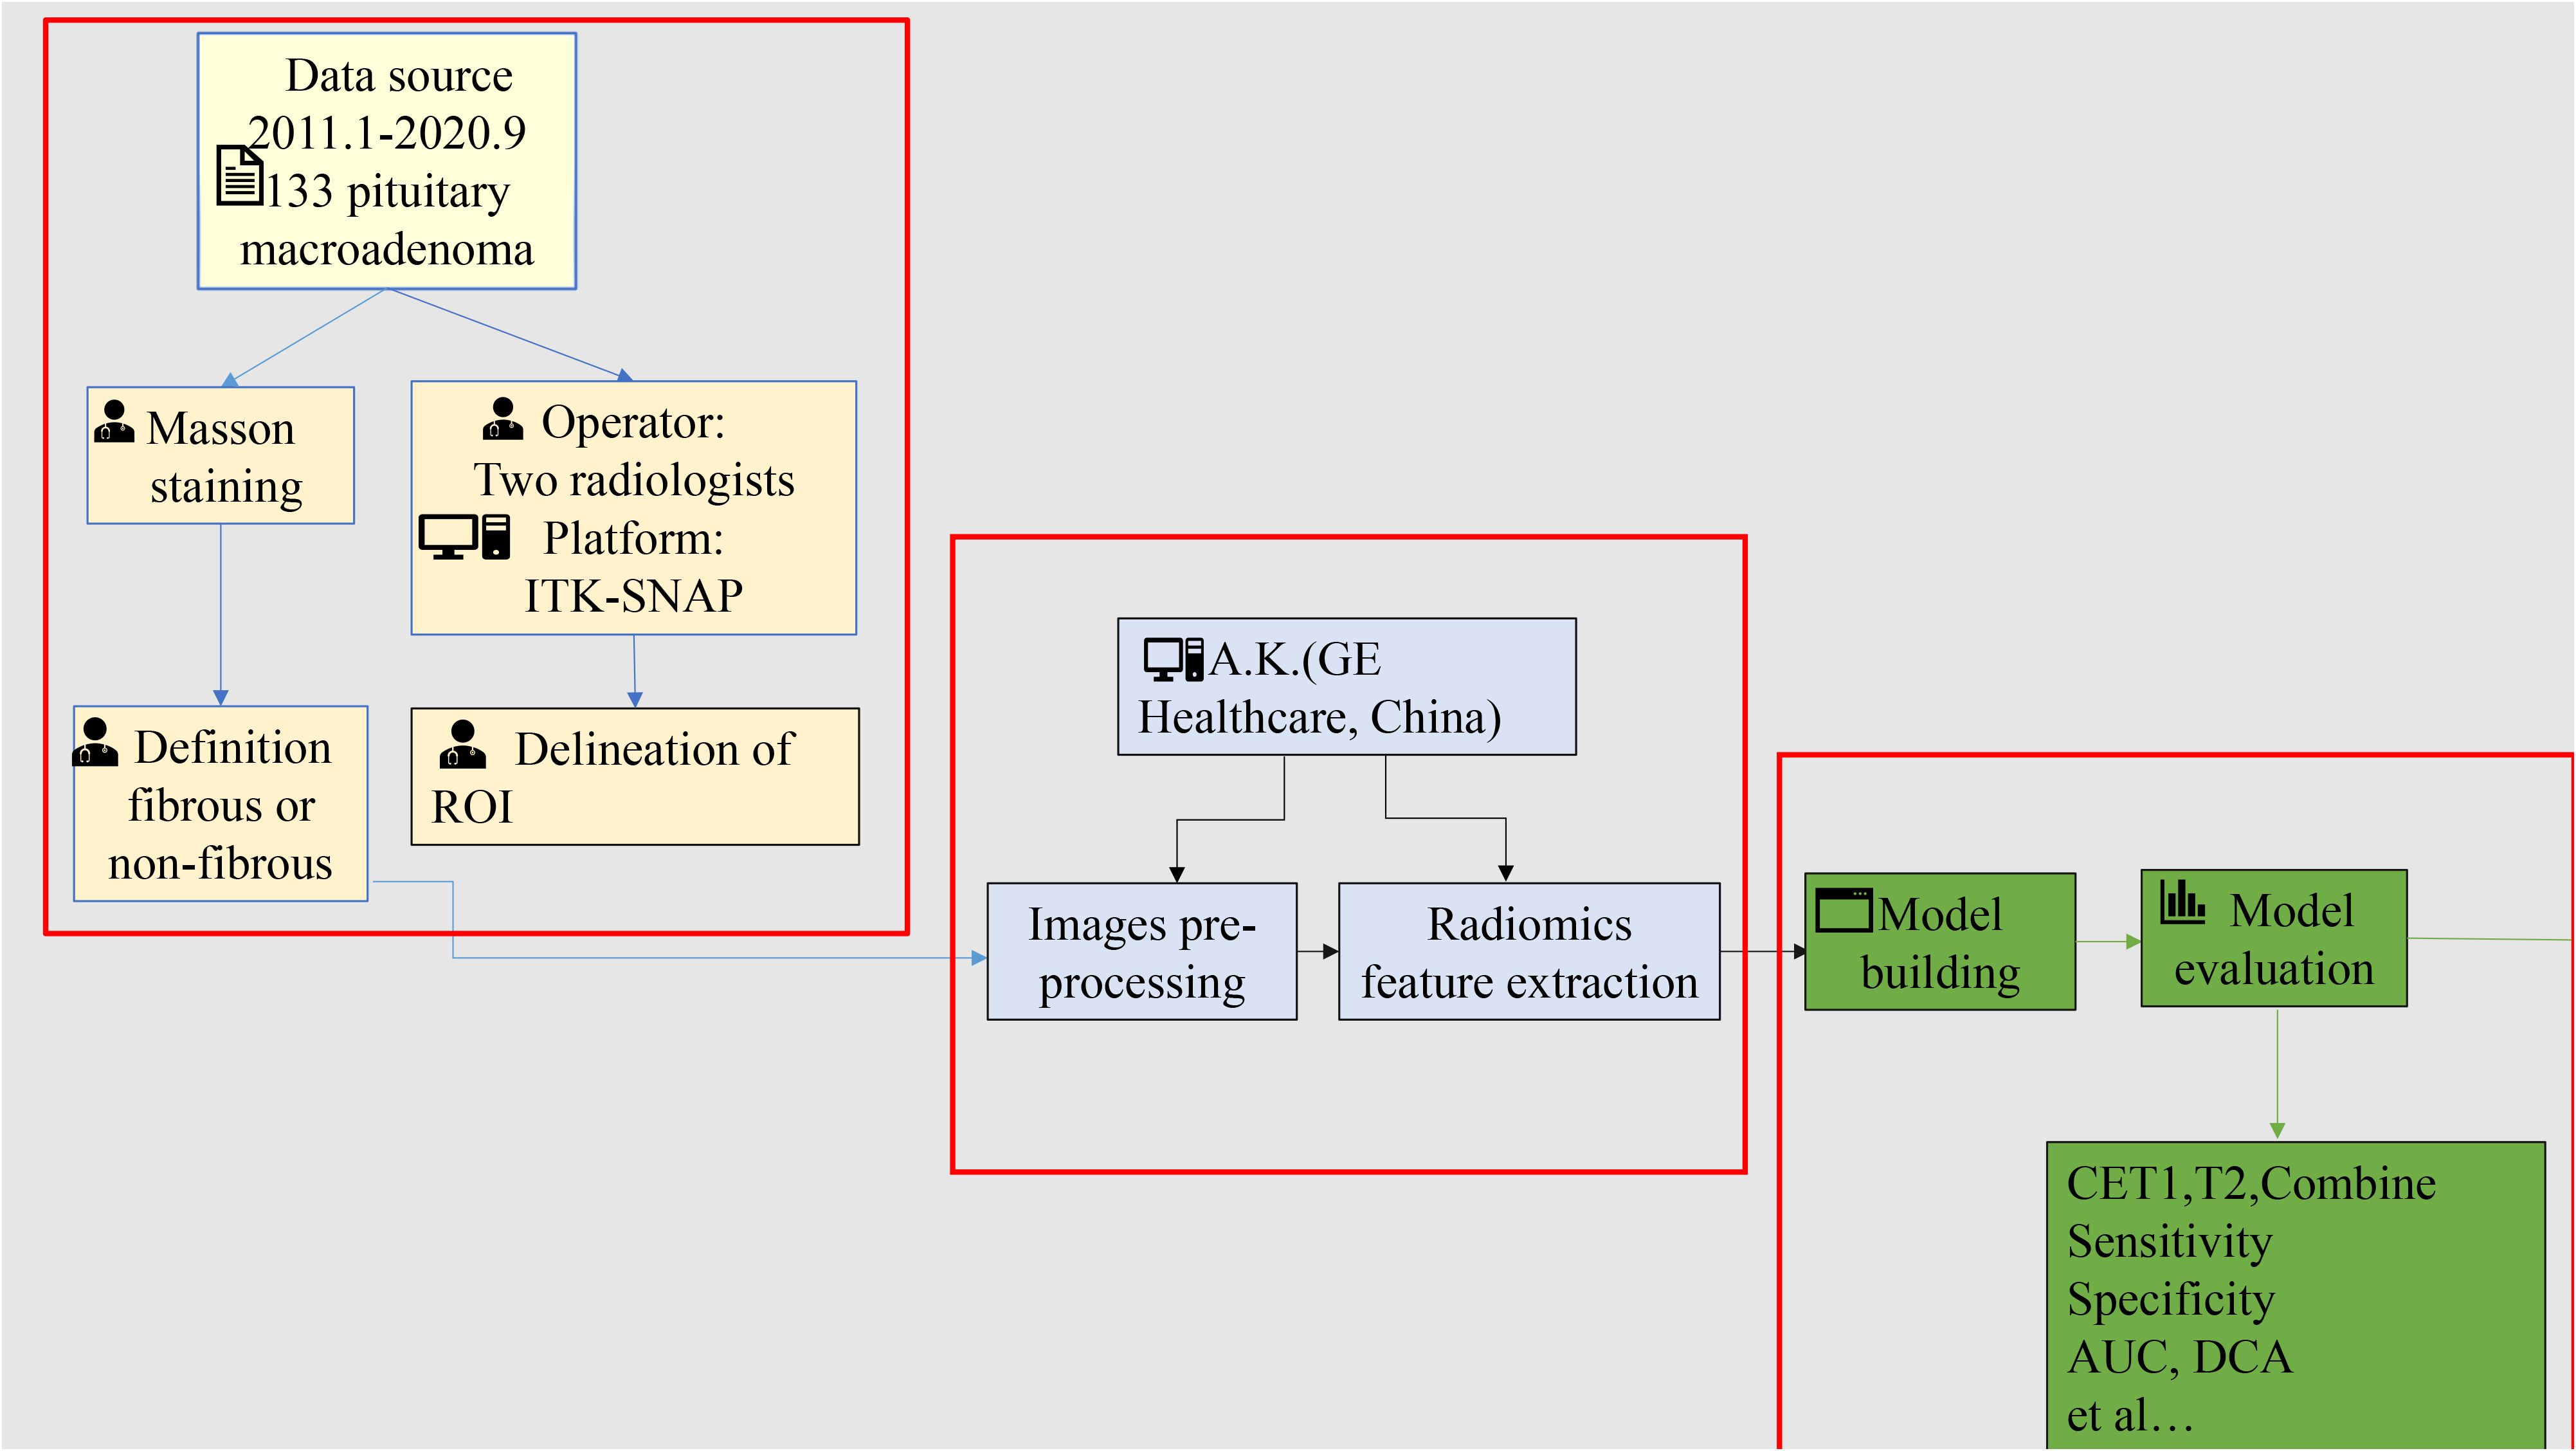
Figure 2. The study workflow.
2.3 Histologic study
In this study, tumor consistency was classified based on collagen expression levels measured in postoperative pathological sections. Sections were stained using the Masson trichrome method masson staining reagent purchased from Zhuhai Baso Biotechnology Co., Ltd., product code BA4079B). For each sample, five random fields of view were captured at ×200 magnification. The collagen-positive area within the tumor was quantified using ImageJ software (v1.8.0, National Institutes of Health) by measuring the blue-stained extracellular matrix area. Tumors were classified as non-fibrous if collagen constituted less than 15% of the total tumor area, and fibrous if collagen constituted 15% or more (15–18).
2.4 Image segmentation and radiomic feature extraction
CET1 images and T2 images of all patients were imported into ITK-SNAP (http://www.itksnap.org/, version: 3.8.0), and then two radiologists of different seniority(operated at an interval of 2 weeks) used a layer-by-layer manual outline of the lesion to generate a region of interest (ROI) (the delineation method was described in the Supplementary Data Sheet 1). The pre-processing, including Gaussian noise reduction, offset field correction, and histogram matching, was implemented on A.K. software (Artificial Intelligence Kit, A.K., version 3.3.0, GE Healthcare). After pre-processing, the image features were extracted using open-source Pyradiomics (19). Finally, 107 features were extracted from both the CET1 and the T2. Their detailed description is available in the online Pyradiomics documentation (https://pyradiomics.readthedocs.io/en/latest/features.html). Test of ICC for characteristics derived by two clinicians. Features with ICC > 0.75 were retained for further analyses.
2.5 Model building and evaluation
The enrolled patients were randomly allocated to a training set and a validation set in a 7:3 ratio. Using the ultimately selected feature set, prediction models based on T2, CE-T1, and combined T2 plus CE-T1 texture parameters were constructed via machine learning methods, including logistic regression, support vector machines (SVM), and decision trees. SMOTE was specifically employed to address the critical clinical problem of underrepresented difficult tumor cases in our dataset (20–22). Our approach directly addresses this gap by enhancing training data for edge cases where human experts typically struggle, aligning with clinical needs for improved difficult-case diagnostics. Patients were then randomly allocated to training and validation sets in a 7:3 ratio. After splitting the dataset into training and testing sets, the SMOTE was applied exclusively to the training set to balance the class distribution before model training. The testing set remained untouched throughout this process.To reduce information redundancy, radiomic features were filtered using a two-step process:
1. Correlation-based filtering: Features with an inter-feature correlation coefficient exceeding 0.90 were removed.
2. Low-variance filtering: Features exhibiting variance ≤ 0.1 were excluded. Subsequently, the Gradient Boosted Decision Tree (GBDT) algorithm was employed to further refine the feature set based on feature importance scores.
Logistic regression models were constructed using the final filtered features:
● Separate models for T2-weighted images and CET1-weighted images.
● A combined model integrating selected features from both image types.
For each model (individual or combined), a radiomics score (Radscore) was calculated using the formula:
where Intercept is the constant term, β_i represents the logistic regression coefficient for the *i*-th feature, and X_i is the feature value.
Model performance was evaluated using:
● Receiver Operating Characteristic (ROC) curves, reporting the Area Under the Curve (AUC), accuracy, sensitivity, specificity, positive predictive value (PPV), and negative predictive value (NPV).
● Calibration curves to assess agreement between predicted probabilities and actual outcomes.
● Decision Curve Analysis (DCA) to quantify the net clinical benefit across various threshold probabilities.
Finally, model stability was assessed via stratified analysis across different MRI field strengths (1.5T vs. 3.0T) and manufacturers (Siemens vs. Philips) the code was described in the Supplementary Data Sheet 2 and 3.
2.6 Statistical analysis
R (version 3.5.1) and Python (version 3.5.6) were used for feature selection, model building, and evaluation. To ensure model reproducibility, the inter-class correlation coefficient (ICC) was calculated to assess feature stability between two independent radiologists. Features with an ICC > 0.75 were retained, demonstrating relatively high inter-reader agreement in segmented tumor volume. Statistical significance was defined as a two-tailed P value below 0.05.
3 Results
3.1 Patient characteristics
We included a total of 133 patients: 35 in the hard group (16 male, 19 female; mean age 51.2 ± 12.4 years) and 98 in the soft group (46 male, 52 female; mean age 52.4 ± 13.2 years). There were no statistically significant differences in age or gender between the hard and soft groups (P > 0.05). In the external validation cohort, 40 patients were enrolled, comprising 20 patients with soft consistency (12 males and 8 females, mean age 54.3± 11.7 years) and 20 patients with hard consistency (12 males and 8 females, mean age 52.7 ± 14.1 years).
3.2 Training and validation of the radiomics-based machine learning
The intraclass correlation coefficient (ICC) values for radiomic features extracted from regions of interest (ROI) outlined by both operators exceeded 0.75. Following Spearman correlation analysis, 56 features from T2-weighted images and 19 features from contrast-enhanced T1-weighted (CET1) images were retained. Radscore calculation and detailed accuracy metrics are provided in the Supplementary Materials.
Prior to applying SMOTE, the AUC values for the T2-based model, CE-T1-based model, and their combined model were 0.70, 0.56, and 0.70, respectively (Figures 3–6). Following the application of SMOTE, the combined model achieved an accuracy of 83.3%, sensitivity of 83.3%, specificity of 83.8%, and an AUC of 0.86. In comparison, the performance metrics for the individual models were:
● CET1 Model: Accuracy 73.3%, AUC 0.80, Sensitivity 80.0%, Specificity 66.7%
● T2 Model: Accuracy 76.7%, AUC 0.79, Sensitivity 76.7%, Specificity 76.7%
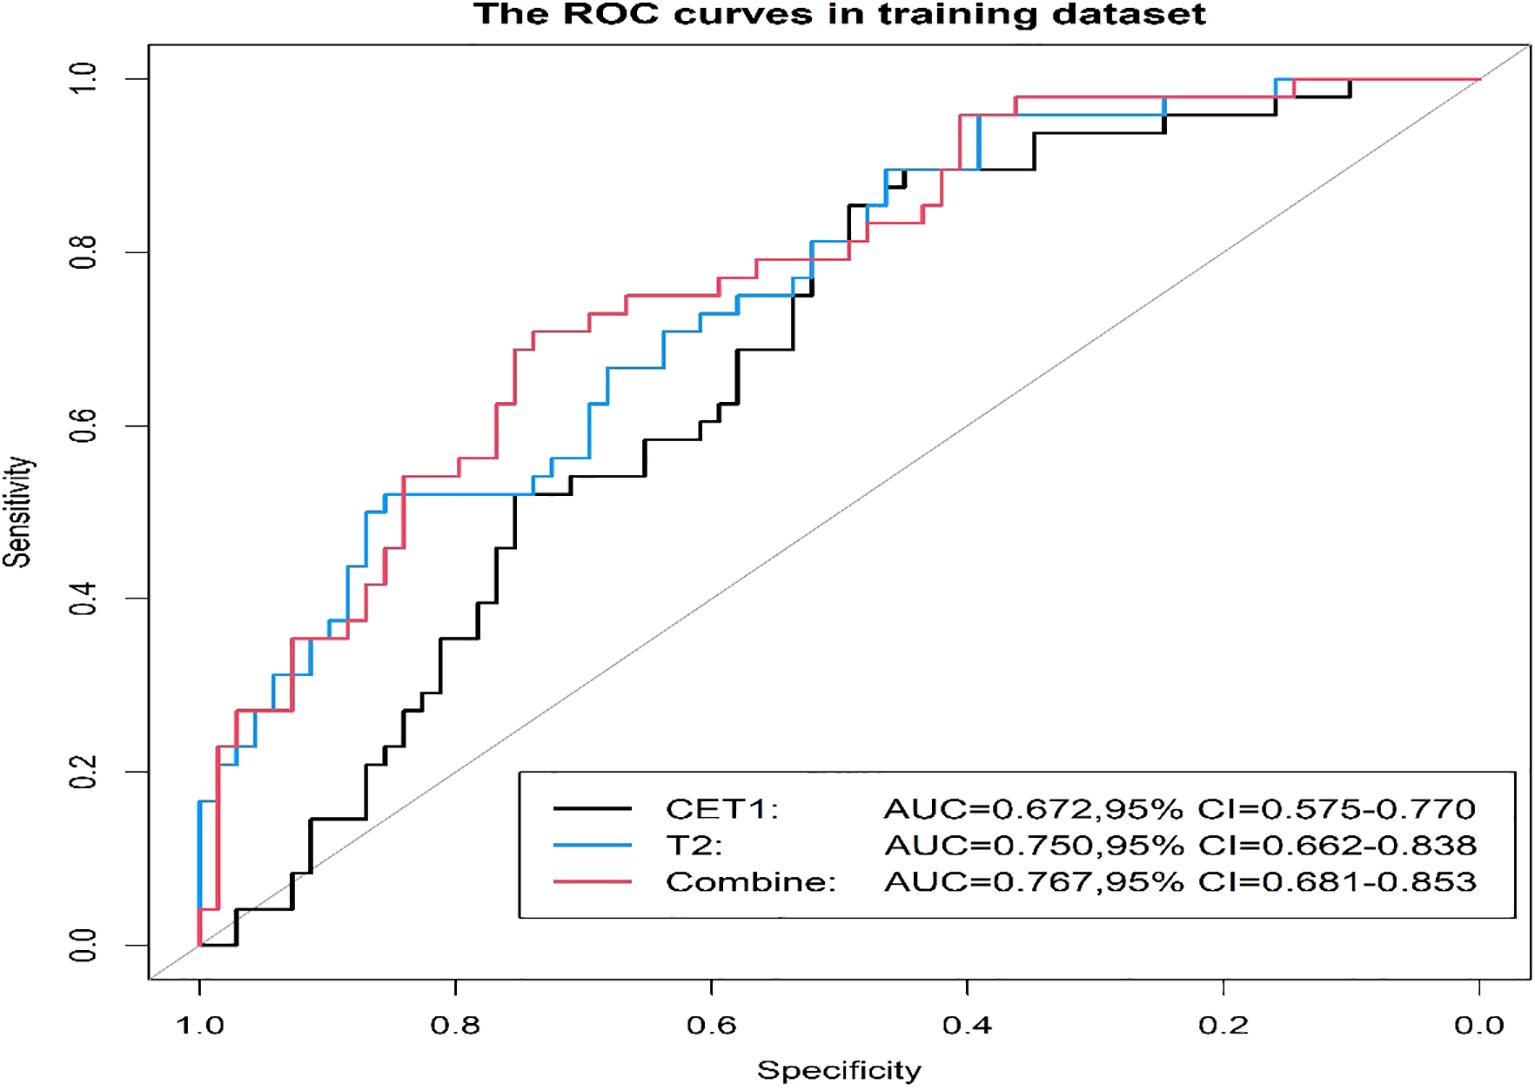
Figure 3. Three prediction models' ROC curves in the training set.
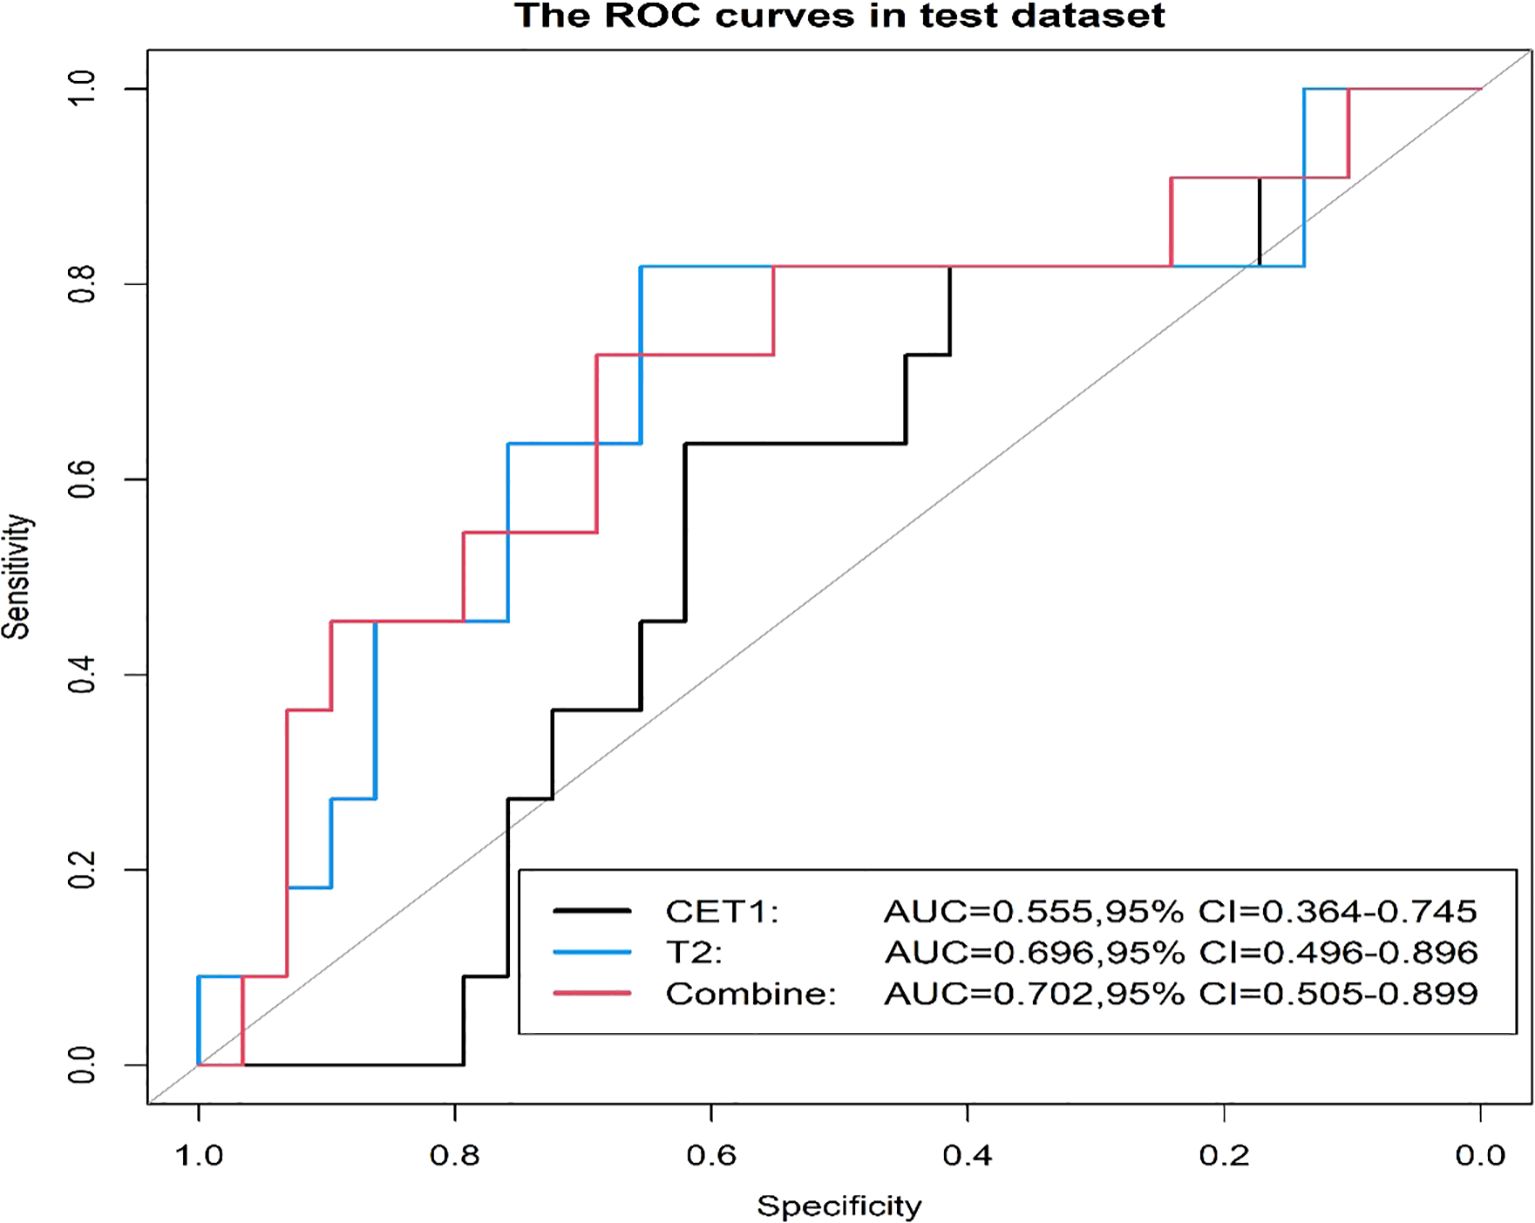
Figure 4. Three prediction models' ROC curves in the test set.
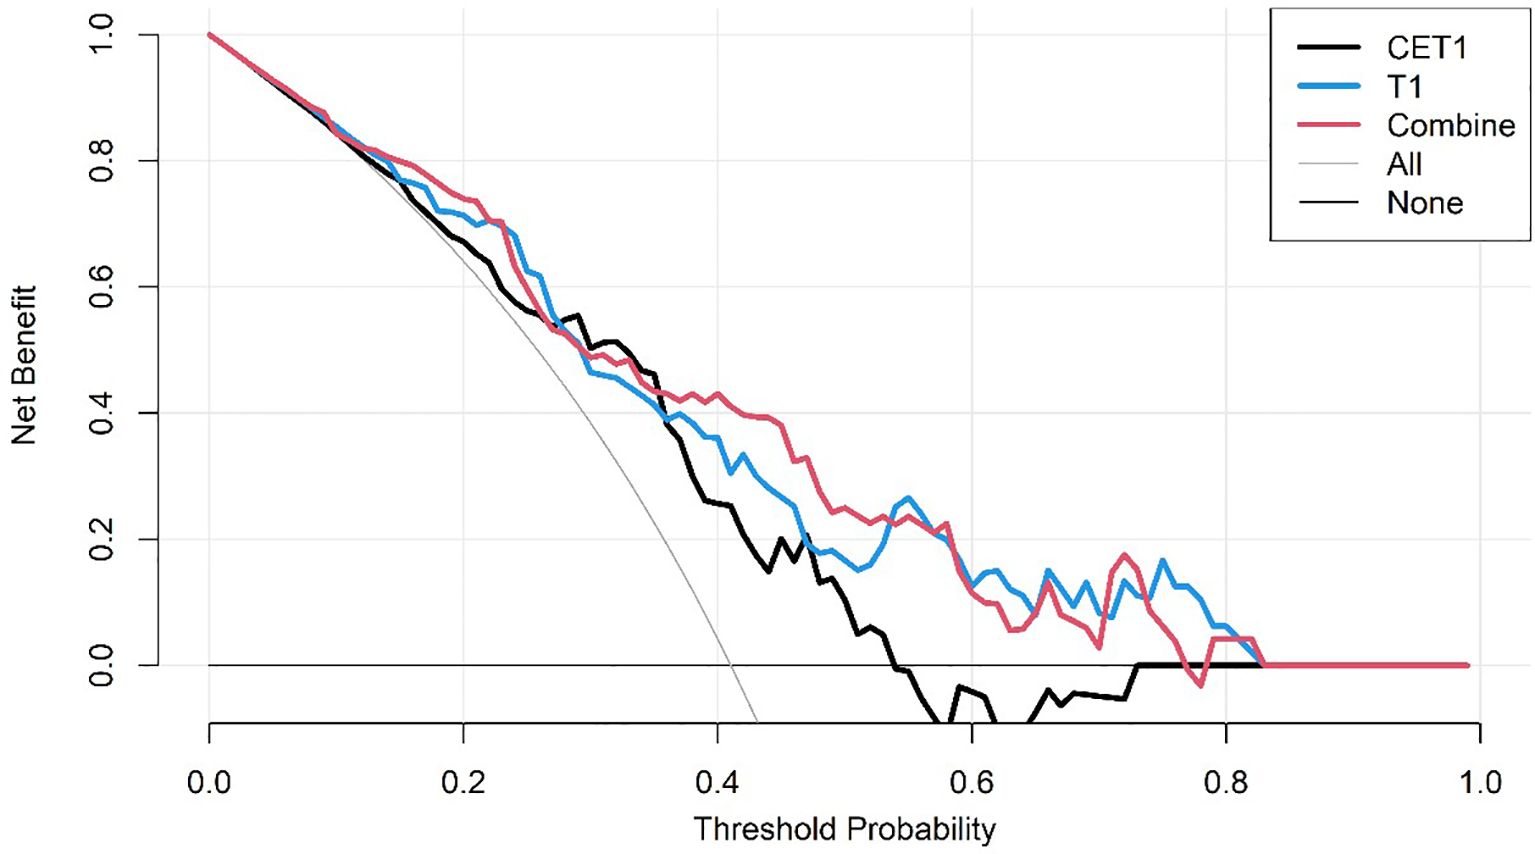
Figure 5. The DCA curves of the three predictive models on the training set.
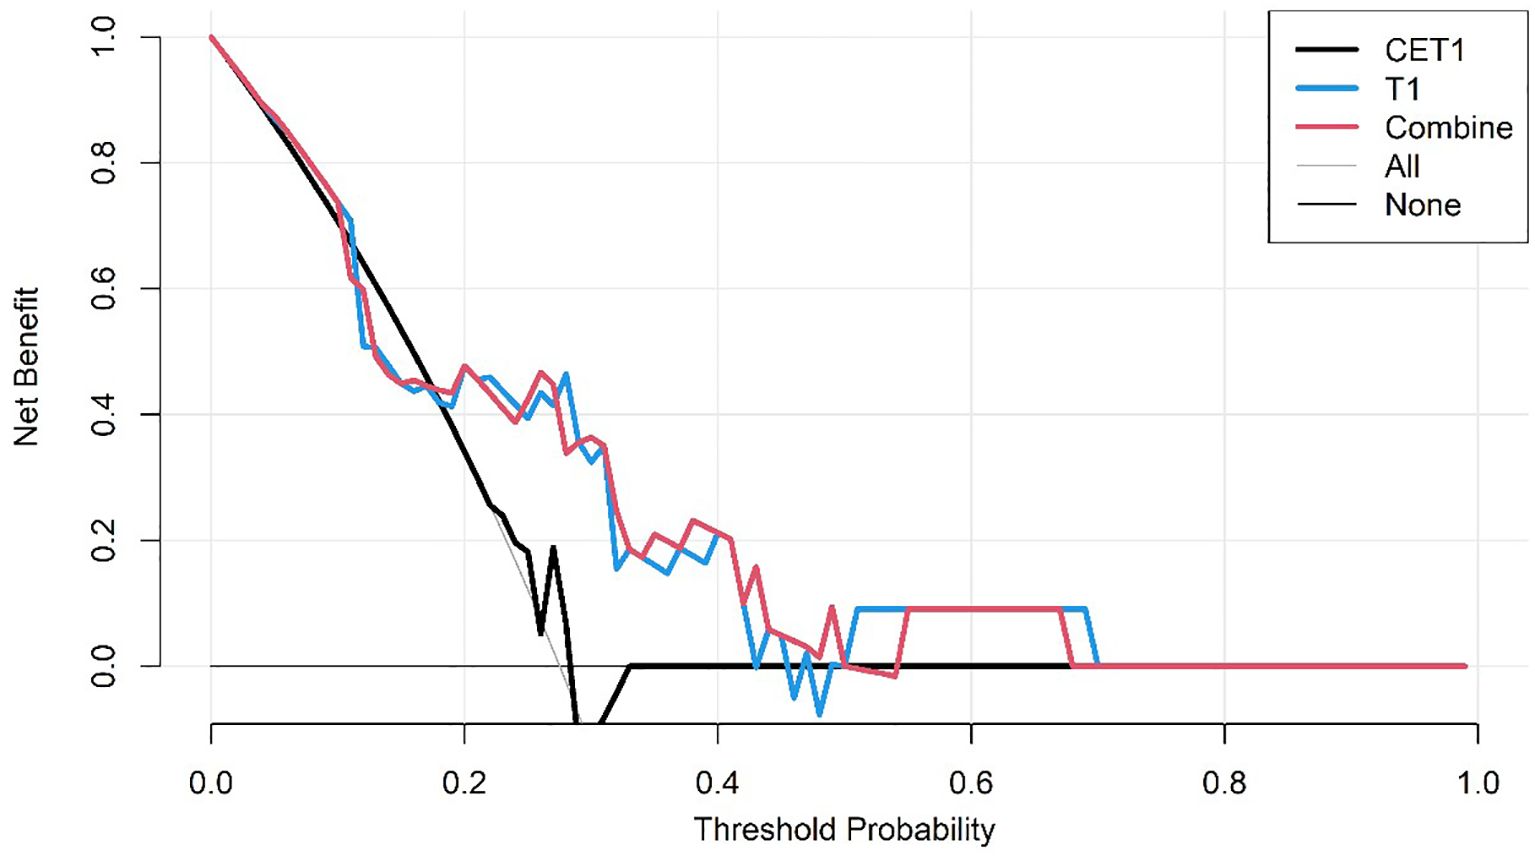
Figure 6. The DCA curves of the three predictive models on the test set.
Corresponding ROC curves are shown in Figures 7, 8. Calibration curves (Figures 9, 10) demonstrated good performance for all three models in both the training and validation cohorts. Decision curve analysis (DCA, Figures 11, 12) indicated that the combined model yielded the highest net benefit across nearly all threshold probabilities.
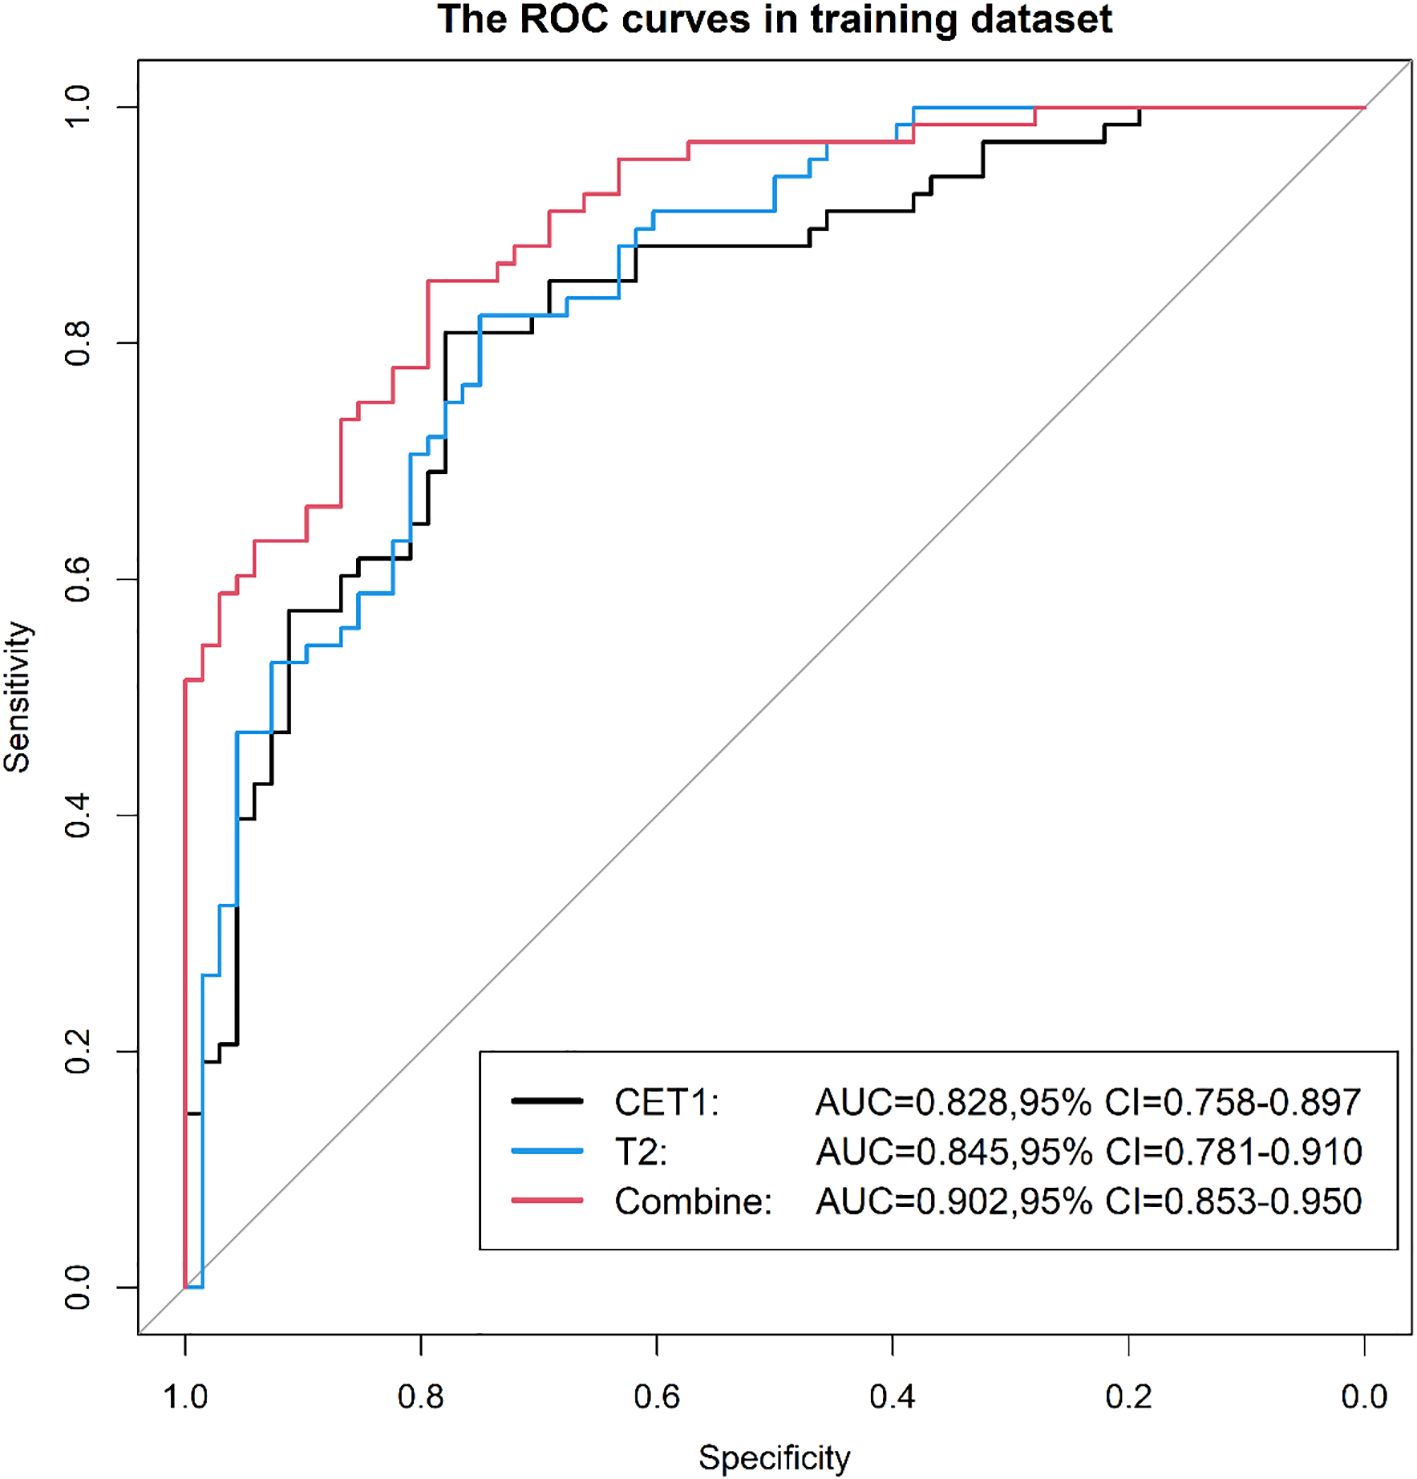
Figure 7. After applying SMOTE, the ROC curves of the three models on the training set.
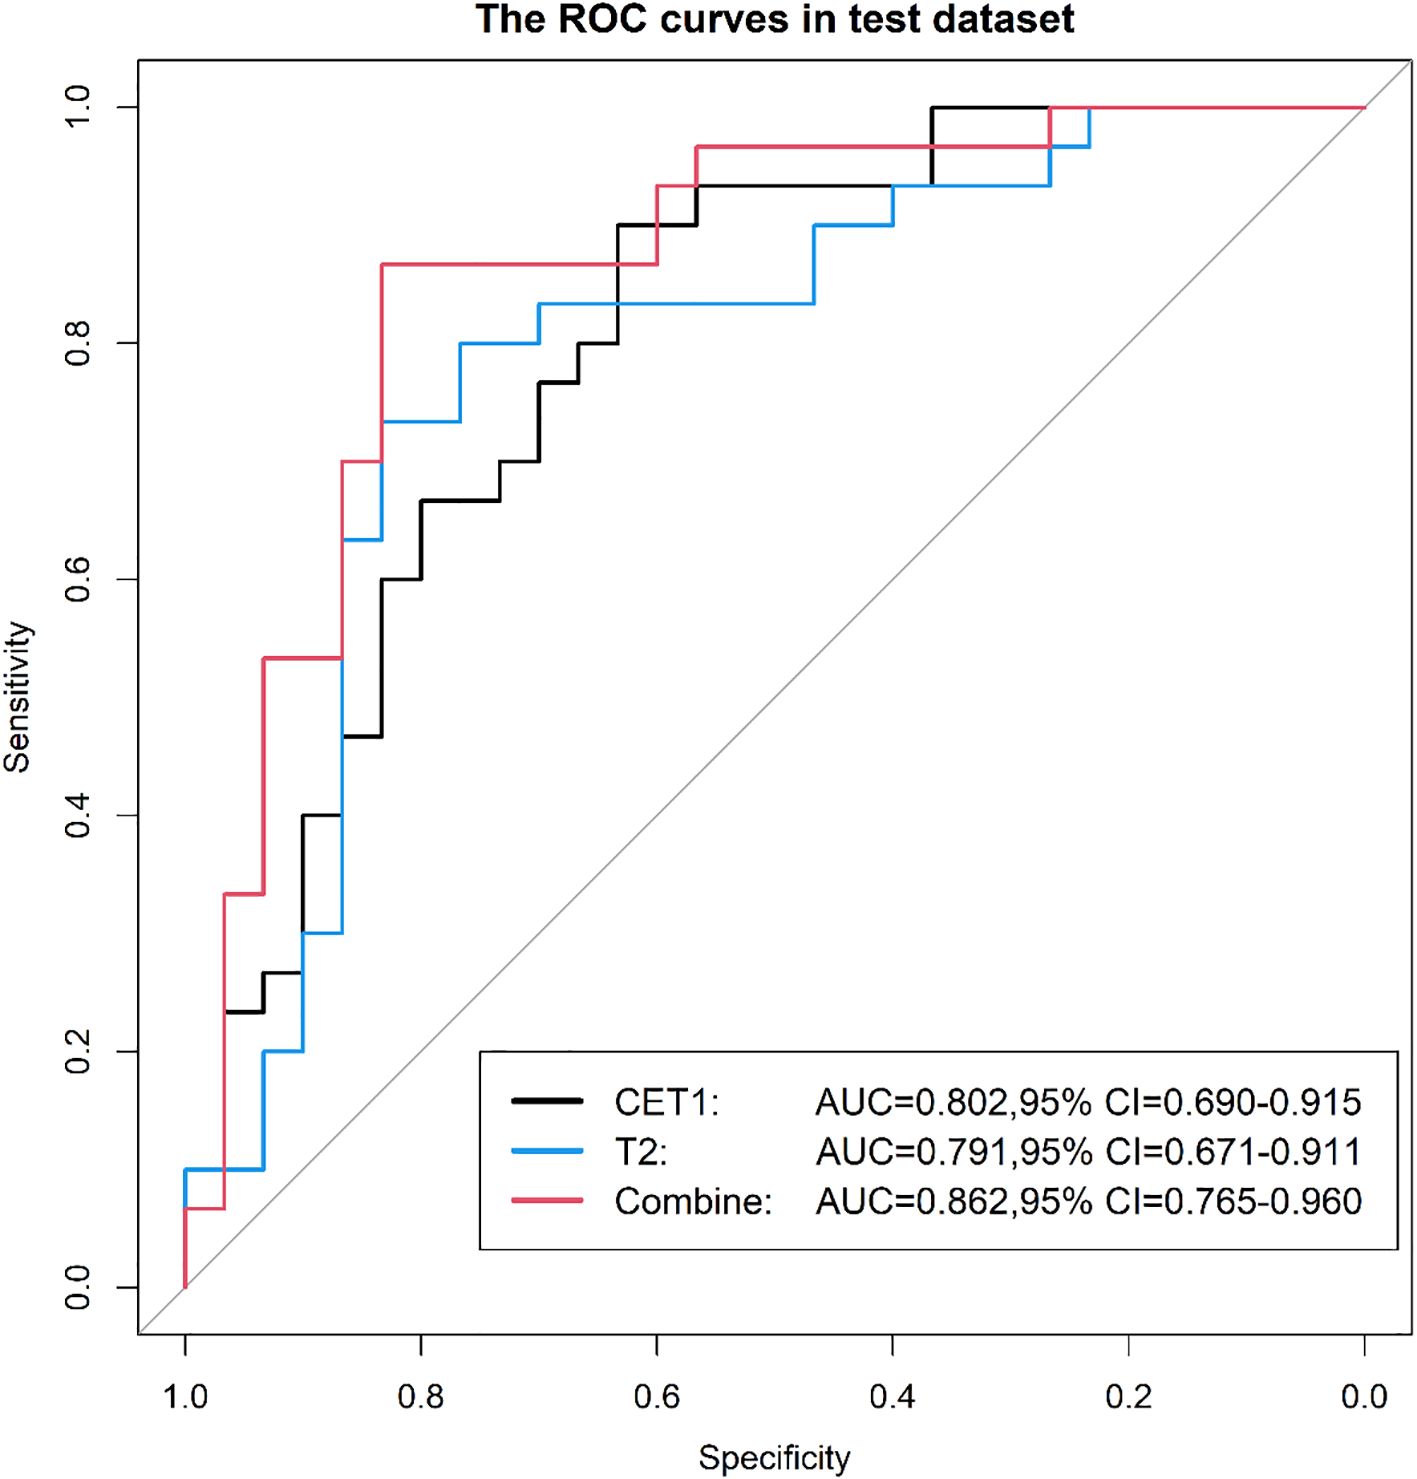
Figure 8. After applying SMOTE, the ROC curves of the three models on the test set.
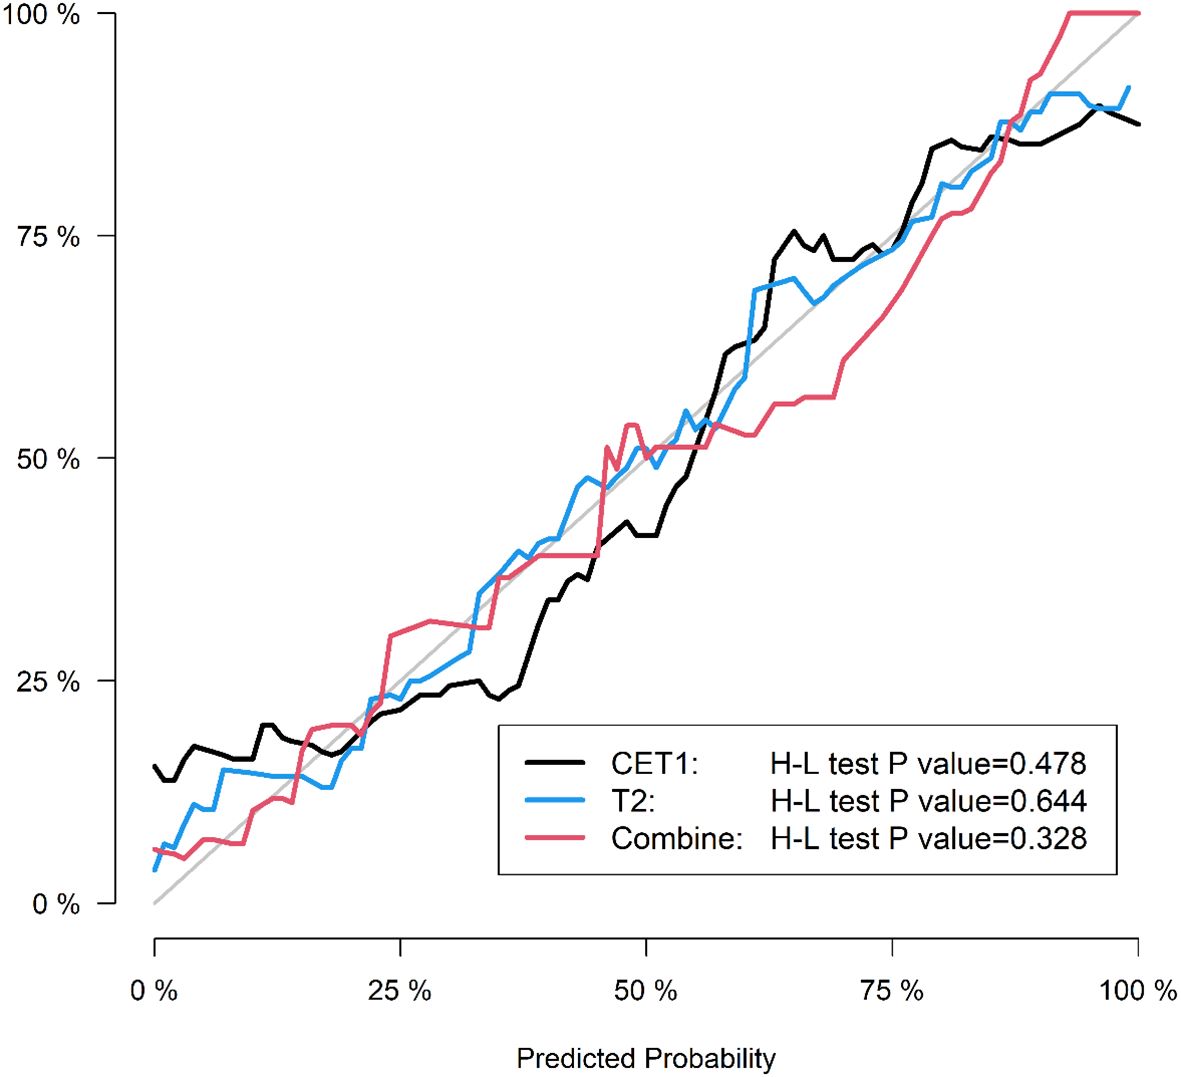
Figure 9. After applying SMOTE, the calibration curves of the three models on the training set.
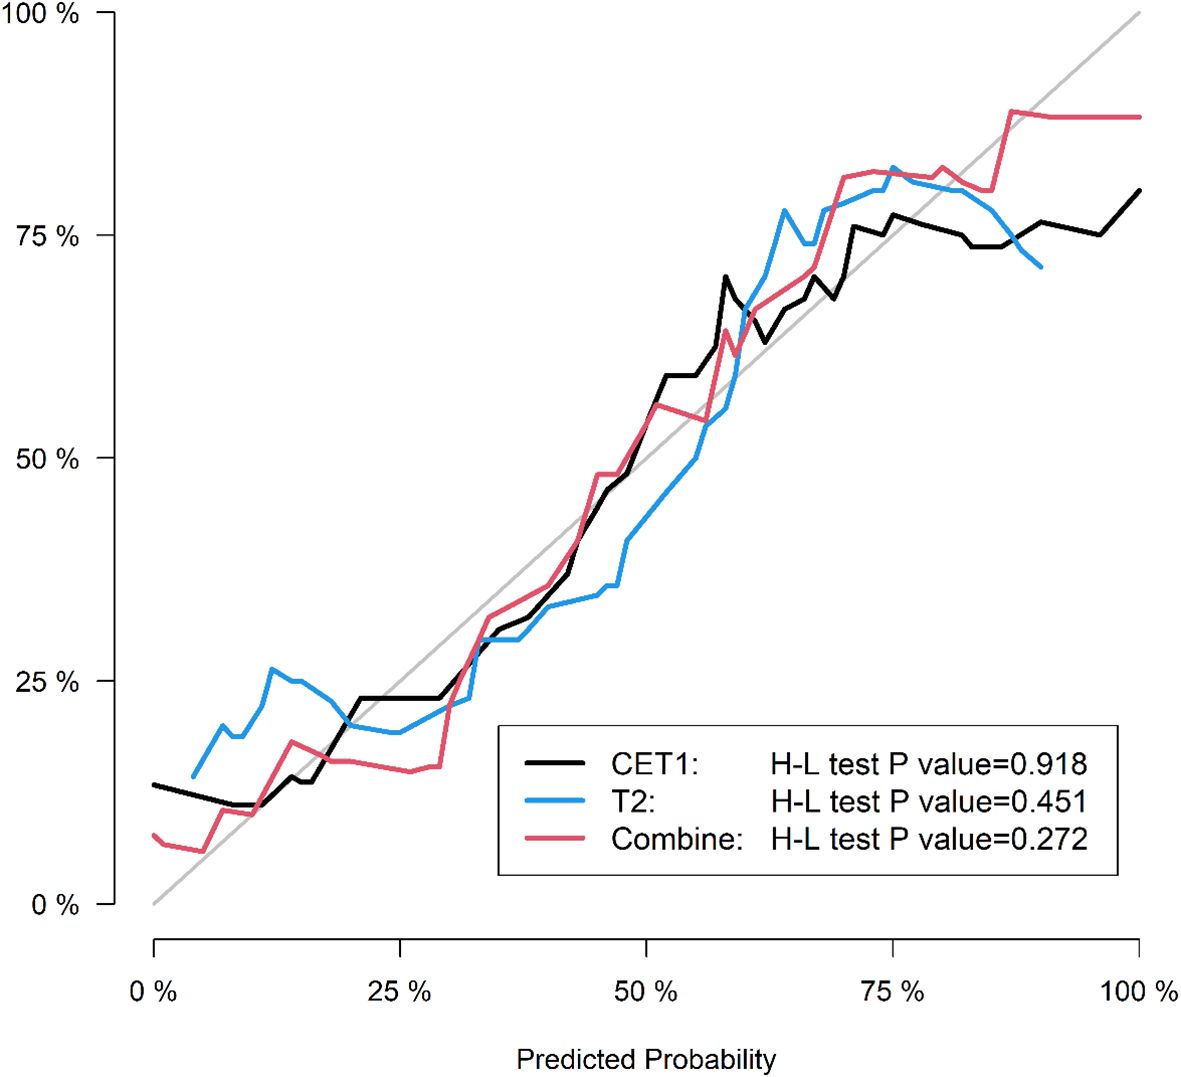
Figure 10. After applying SMOTE, the calibration curves of the three models on the test set.
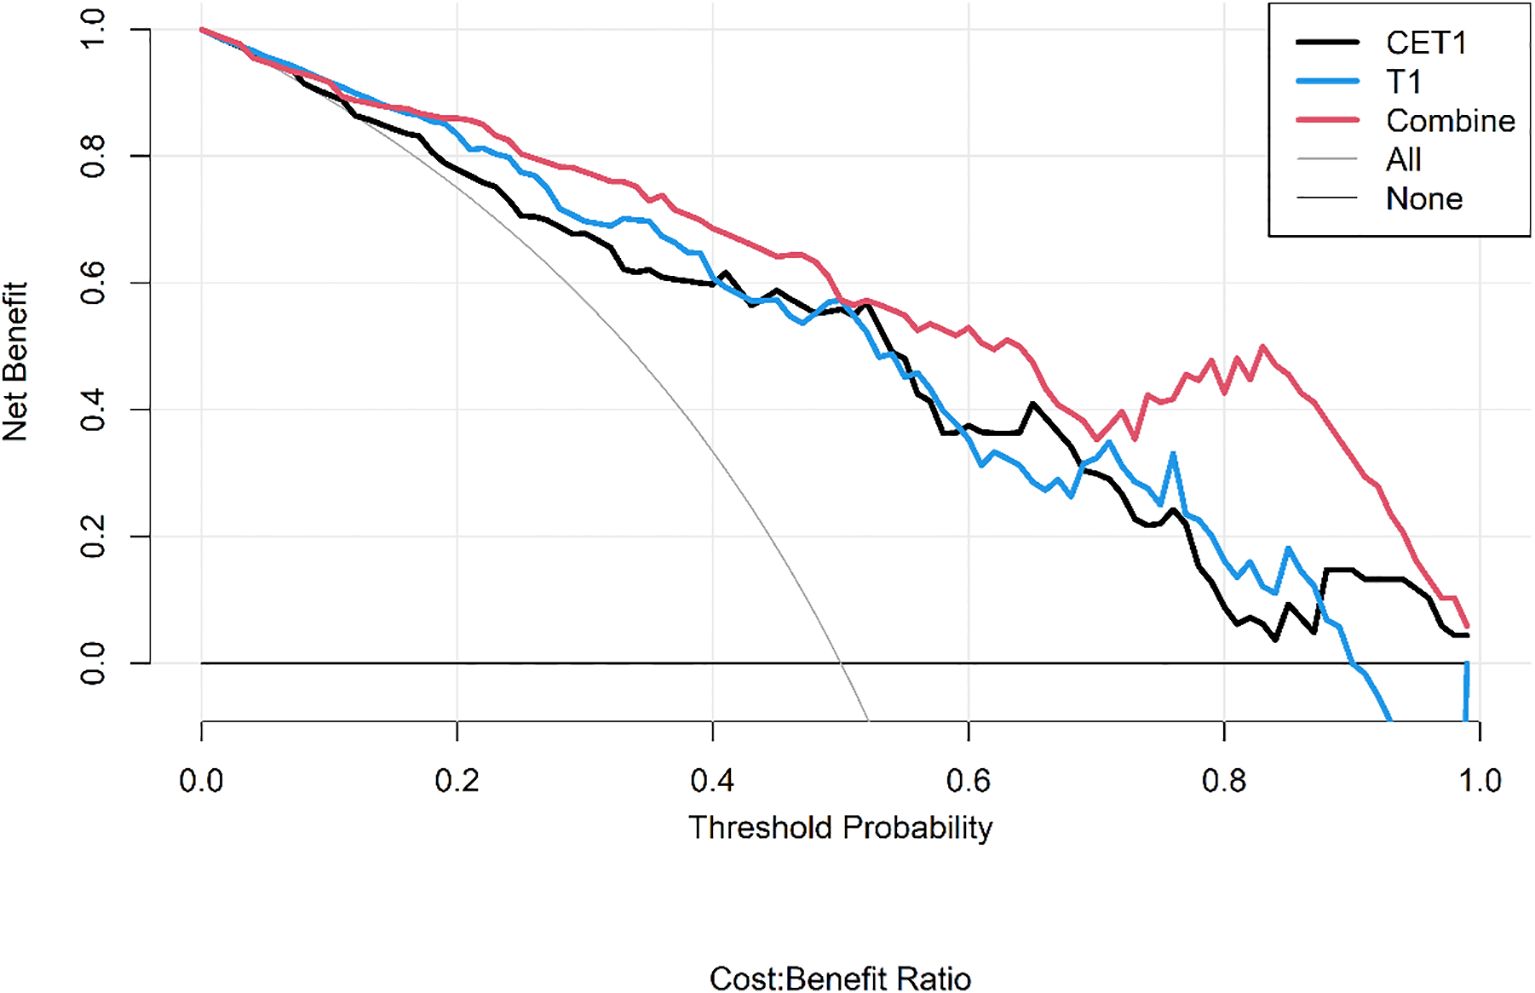
Figure 11. After applying SMOTE, the DCA curves of the three models on the training set.
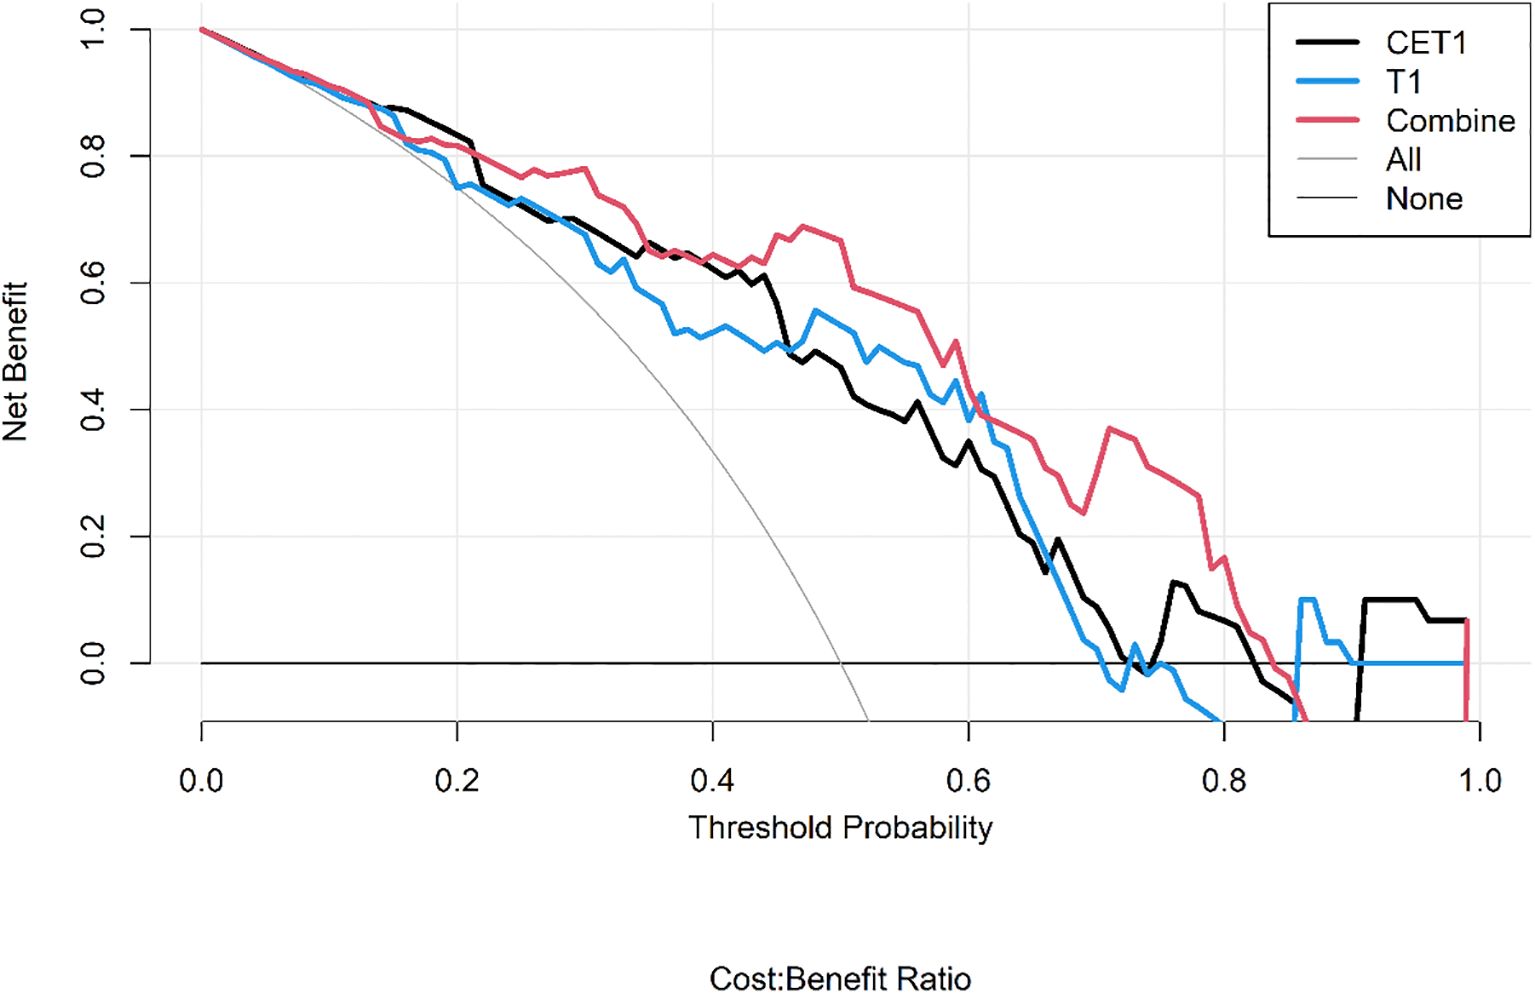
Figure 12. After applying SMOTE, the DCA curves of the three models on the test set.
On the external validation set, the combined model maintained superior performance with an AUC of 0.865, outperforming the CET1 model (AUC 0.765) and the T2 model (AUC 0.811). The ROC curves for external validation are presented in Figure 13.
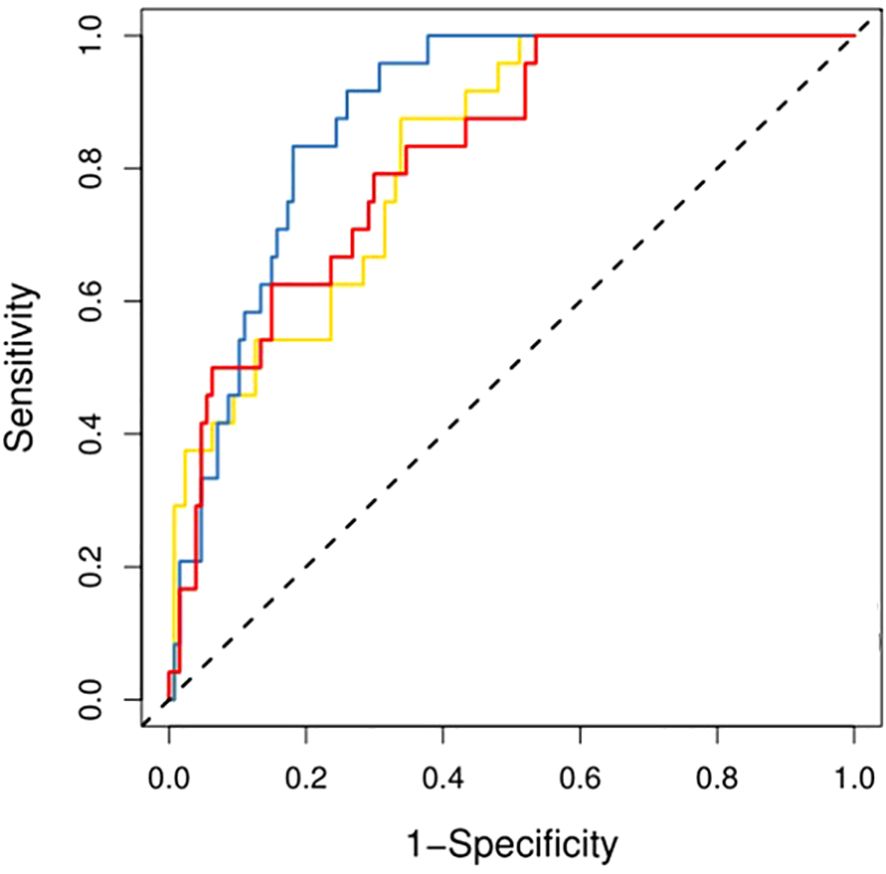
Figure 13. The ROC curves of the three models on the external validation set.
3.3 Evaluation of radiomics model in different equipment (different field strengths and different vendor)
Among 133 included patients, 128 were analyzed by scanner vendor (GE Healthcare [n=5] was excluded from stratified analysis due to small sample size). Scans were performed using Philips Healthcare (all 3.0T; n=39) or Siemens Healthcare equipment (1.5T: n=34; 3.0T: n=55). Results demonstrated that the model derived from T2-weighted images alone exhibited greater stability across different scanner types (both vendors and field strengths) compared to models using CET1-weighted images alone or combined T2 and CET1 images (Figures 14, 15).
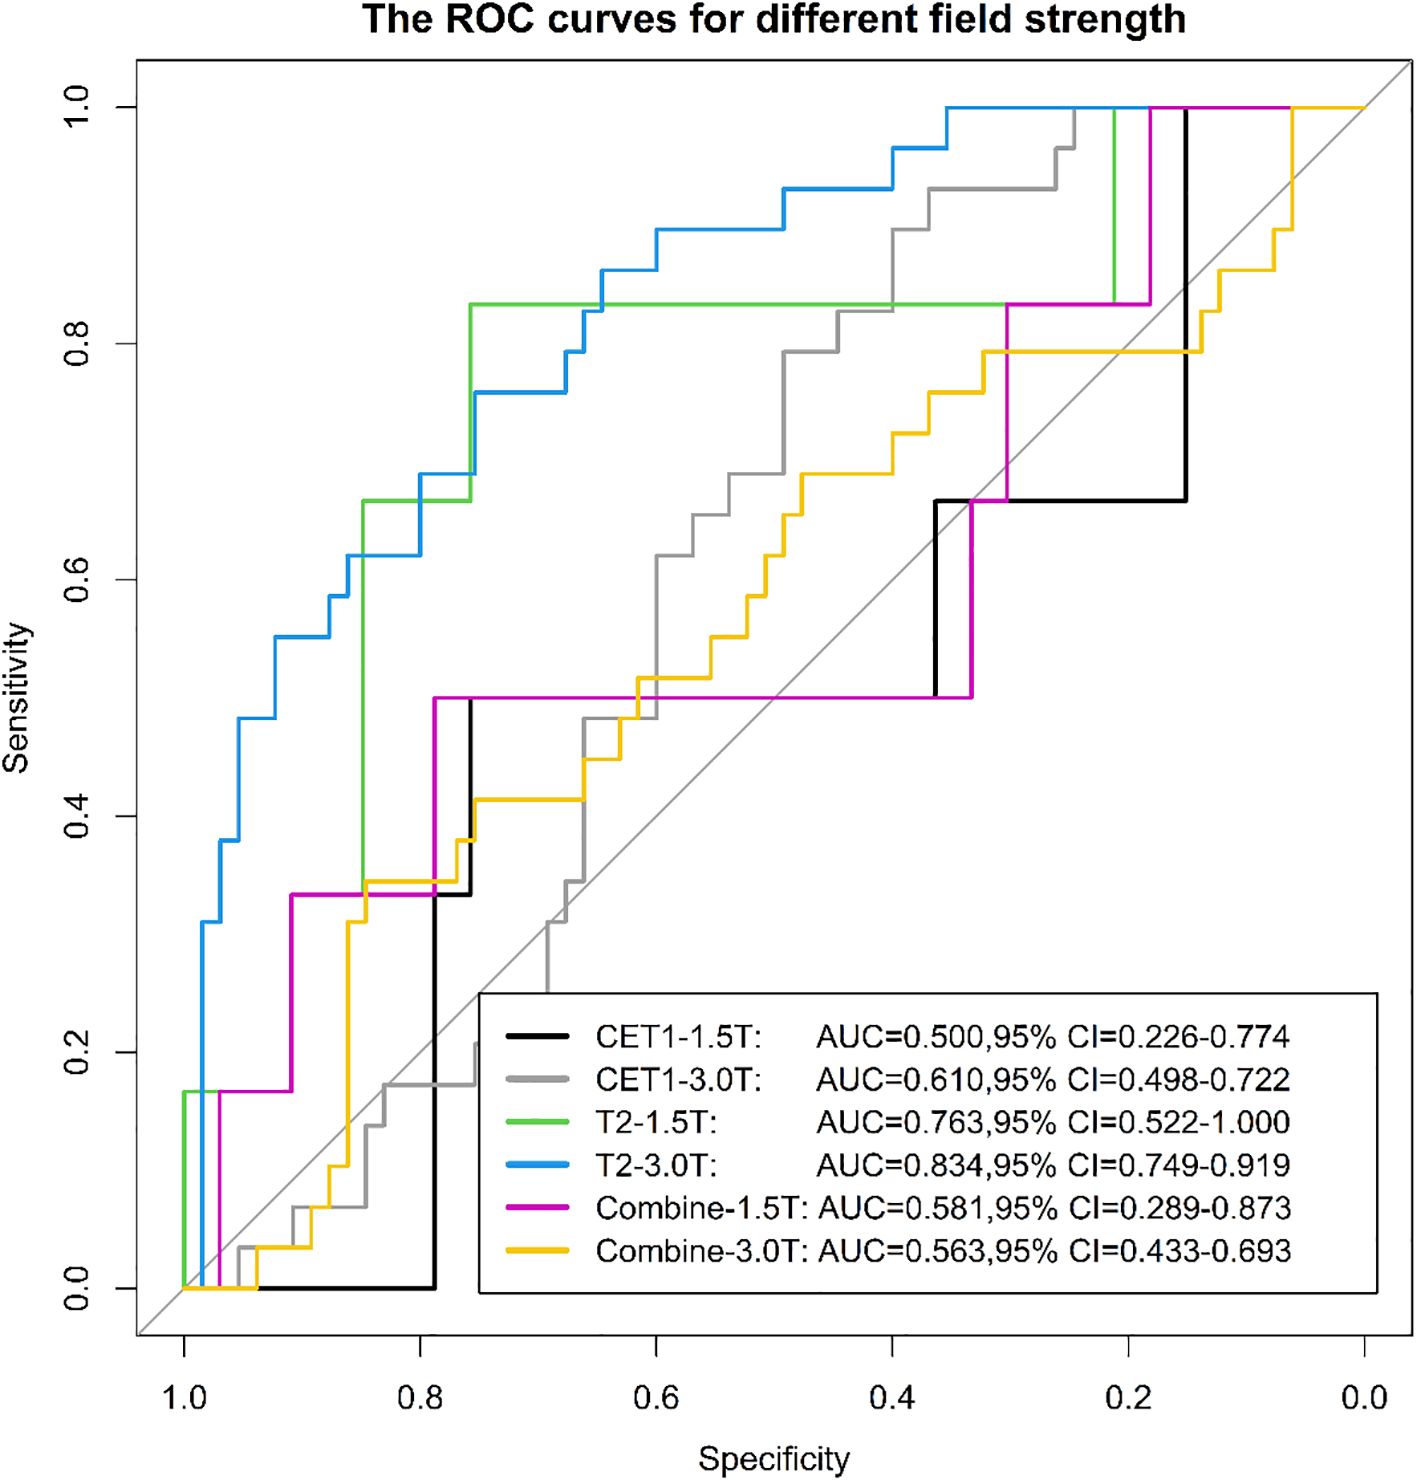
Figure 14. The ROC curves for different field strength.
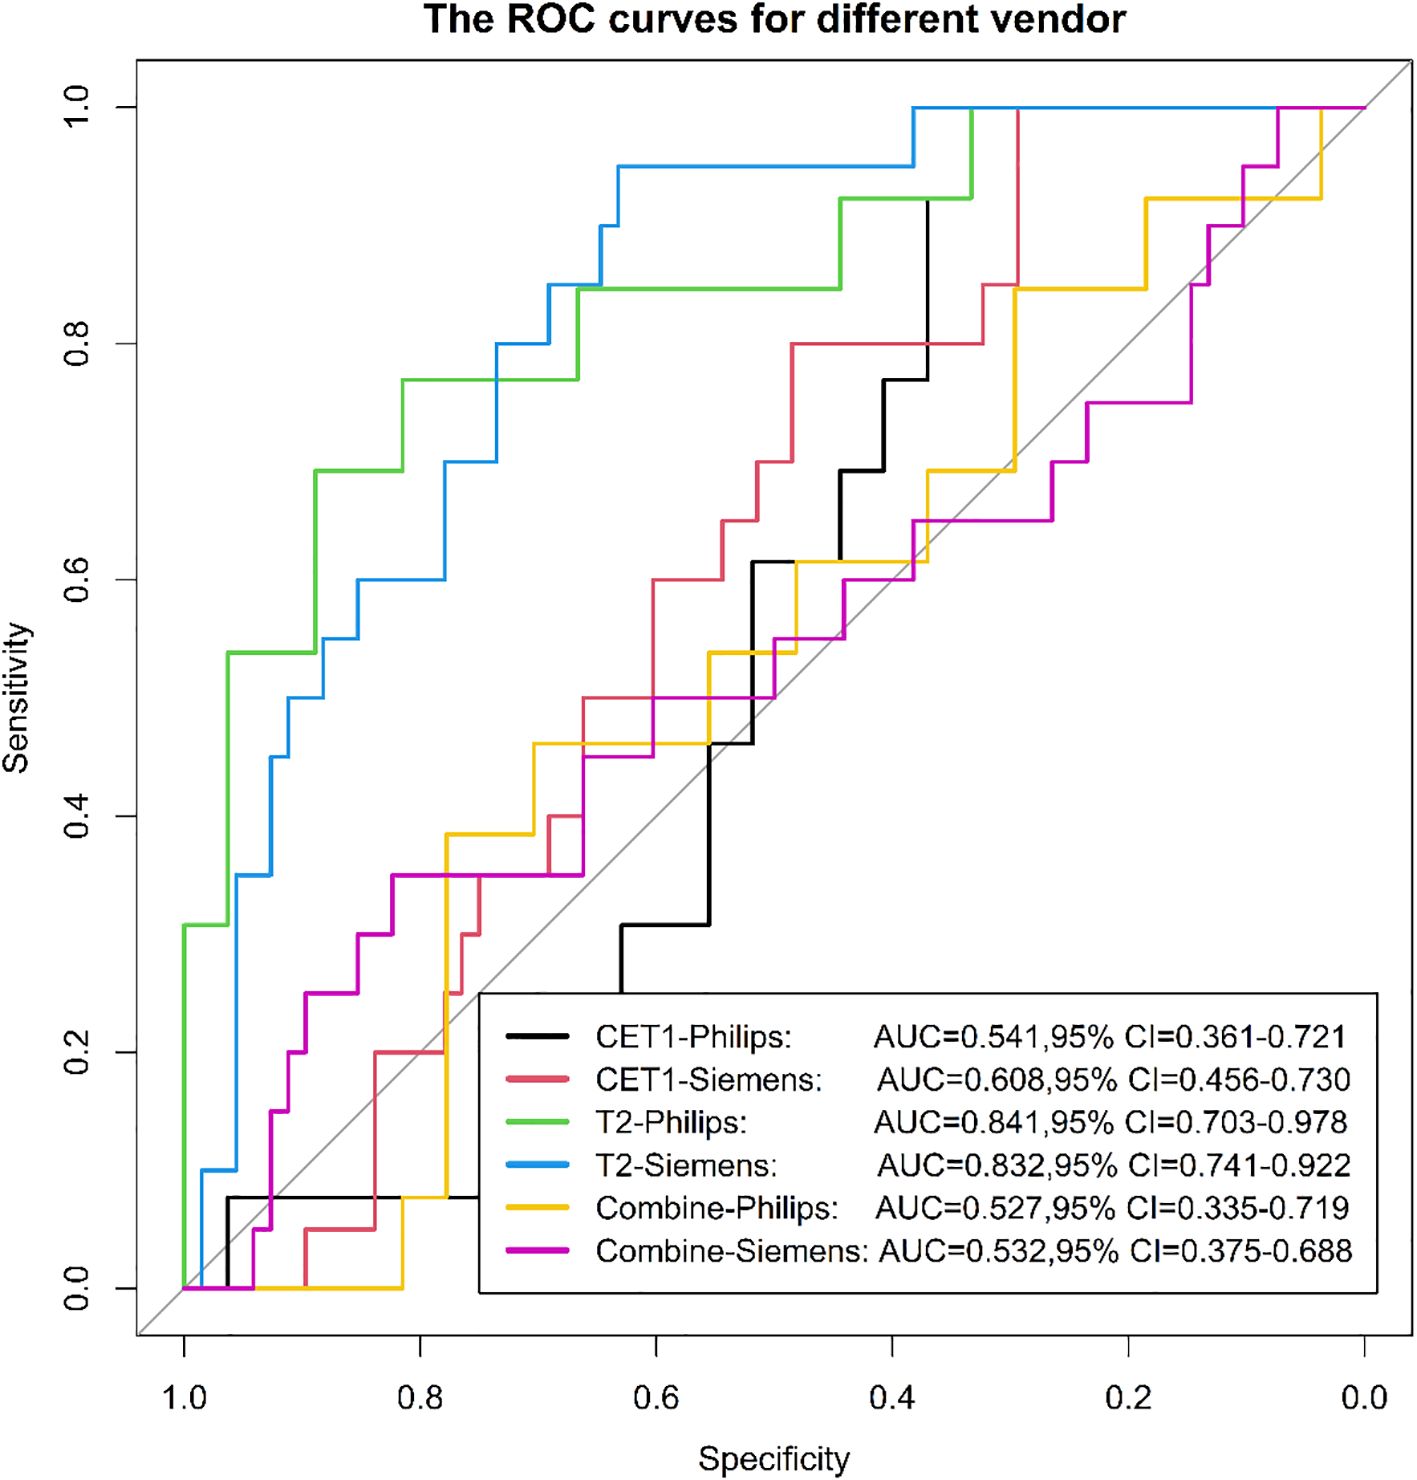
Figure 15. The ROC curves for different vendor.
4 Discussion
In our study, we first developed models to predict pituitary macroadenoma consistency using CET1 images and T2 images separately, then created a combined model using both sequences. The combined model outperformed models based on either sequence alone. However, further stratified analysis revealed that the model built solely on T2 images demonstrated greater stability than either the CET1-only model or the combined model.
The radiomic model combining CET1 and T2 images for preoperative prediction of pituitary macroadenoma consistency achieved an accuracy of 0.833 and an AUC of 0.862. In contrast, prediction models developed by Cuocolo et al. (11) (using T2 images) and Su et al. (23) (using DWI, b=2000 s/mm²) reported higher AUCs of 0.99 and 0.91, respectively, indicating superior diagnostic performance to our model. Several factors may explain this performance difference. First, our study included a larger cohort (133 patients) compared to Cuocolo et al. (89 patients) and Su et al. (50 patients). Second, while the prior studies relied on subjective intraoperative surgeon assessment of tumor consistency (despite initial training), our methodology used Masson staining of pathological sections for classification (18), providing a more objective and accurate standard. Furthermore, regarding imaging sequences, CET1 may offer a more realistic depiction of pituitary macroadenomas than DWI.
We evaluated the stability of three models (T2, CET1, combined) across different field strengths (1.5T and 3.0T) and MRI vendors. The T2-based model demonstrated significantly higher stability than either the CET1 or combined models. We posit that two interrelated factors—field strength-dependent signal heterogeneity and vendor-/field strength-dependent differences in contrast enhancement behavior—likely contributed to this phenomenon, particularly affecting the integrated nature of the combined model.
4.1 Field strength-dependent signal heterogeneity
Fundamental physical differences between 1.5T and 3.0T scanners significantly impact signal-to-noise ratio (SNR), contrast-to-noise ratio (CNR), and spatial resolution. While 3.0T generally offers higher SNR enabling finer texture resolution (24), it also introduces greater susceptibility artifacts, spatial inhomogeneity, and B1 field inhomogeneity. Radiomic features, especially texture descriptors (e.g., GLCM, GLRLM, GLSZM), are inherently sensitive to these variations in image acquisition physics (25, 26). This non-biological, acquisition-driven heterogeneity disrupts the stability and reproducibility of radiomic features across field strengths (27). Consequently, the model weights optimized on the training data (potentially dominated by one field strength) may misrepresent feature-tumor biology relationships in the other field strength subgroup, leading to performance degradation in stratified testing (28).
4.2 Vendor/field strength-dependent contrast enhancement behavior
Gadolinium-based contrast enhancement kinetics and appearance in pituitary macroadenomas are influenced by complex interactions between tumor biology (e.g., vascularity, permeability) and technical factors. Crucially, relaxivity (R1) of gadolinium chelates is field-strength dependent (29), and vendor-specific implementations of pulse sequences (e.g., saturation pulses, flip angle optimization, parallel imaging) further modulate signal dynamics during contrast uptake (30). Our combined model relies heavily on radiomic features extracted from post-contrast T1-weighted sequences (e.g., firstorder_Minimum, firstorder_MeanAbsolute, glcm_JointEntropy), which encode information about enhancement intensity and heterogeneity. Systematic differences in the apparent enhancement patterns—driven by field strength (e.g., different T1-weighting at 1.5T vs 3.0T) and vendor-specific image reconstruction algorithms—can alter these feature values without reflecting true biological differences (31). The combined model, seeking synergy between clinical factors (e.g., hormone status) and radiomic phenotypes, may inadvertently learn spurious correlations between clinical variables and these acquisition-biased enhancement features. When applied to data from a different scanner type or field strength, these learned associations fail, degrading model performance (32). The combined model, however, aims to leverage complementary information. If the radiomic component introduces unstable, acquisition-dependent signals (as described above), the integration process can amplify noise rather than biological signal in heterogeneous test sets (33). This underscores the paradox that combining data sources can reduce robustness if one source (here, radiomics) lacks harmonization across acquisition platforms (34).
This methodological choice carries substantial clinical implications: Firstly, we adopted a more objective method for evaluating the texture of pituitary macroadenomas, defining it by the expression level of collagen within the tumor tissue. This represents the first time collagen quantification has been used to define texture in radiomics model predictions for pituitary macroadenomas. Secondly, we utilized contrast-enhanced sequences for the first time in this context. While these sequences are commonplace in the routine imaging evaluation of pituitary macroadenomas, their application in radiomics texture prediction is novel. It is well-established that fibrous components within tumors exhibit delayed enhancement on contrast-enhanced images. Previously employed sequences, such as T2-weighted images (T2WI) and diffusion-weighted imaging (DWI), fail to adequately capture the presence of these fibrous elements. Furthermore, contrast-enhanced sequences effectively depict necrotic and cystic components within the tumor. Undoubtedly, these components also significantly influence pituitary macroadenoma texture. In addition, we performed a first-ever stratified analysis of the constructed imaging model. Given that different hospitals employ varying imaging equipment for pituitary macroadenoma examinations, conducting this stratified analysis helps identify more stable models. This approach enhances the reproducibility of the radiomics model and facilitates its practical application in real-world clinical settings.
The preoperative prediction of tumor consistency holds significant potential to refine surgical strategies, particularly in selecting optimal operative corridors. Our radiomic model may directly influence decision-making in the following clinical scenarios:
1. Endonasal Approach Selection (Mononostril vs. Binostril): Predicted non-Fibrous Tumors: A mononostril transsphenoidal approach is often sufficient for predominantly soft lesions. These tumors can be efficiently aspirated or curetted through a single naris, minimizing nasal trauma and reducing operative time. Predicted Fibrous Tumors: Binostril endoscopic approaches become preferable when firm consistency is anticipated. The wider exposure facilitates bimanual microdissection, enhances instrument maneuverability for piecemeal resection, and allows safer dissection of adherent tumor capsules from neurovascular structures (e.g., optic apparatus, cavernous sinus). Failure to anticipate firm consistency via a mononostril corridor may lead to incomplete resection or excessive traction injury.
2. Consideration of Transcranial Access: Predicted firm consistency combined with specific anatomical factors may warrant transcranial approaches (e.g., pterional, subfrontal): For tumors exhibiting significant suprasellar extension (>3cm), a potential fibrous capsule may create adhesions tethering the tumor to critical structures like the optic chiasm or anterior cerebral arteries. In these cases, a transcranial approach enables direct visualization and sharp dissection of these adherent interfaces. Similarly, in Knosp Grade 3–4 tumors invading the cavernous sinus, a firm consistency elevates the risk of carotid artery injury during transsphenoidal dissection. Here, a transcranial or combined approach provides superior control for managing the lateral compartments.
The present study also has certain limitations. Firstly, it was a single-center retrospective study and the sample size included was only 133. Secondly, there was a large difference in the number of patients with non-fibrous and fibrous consistency, but this was consistent with the actual clinical situation and the epidemiology of pituitary macroadenoma. Last but at least, some of the cases we included have a long history, and the degradation of collagen in the pathological tissue may affect the qualitative judgment.
In conclusion, in the prediction of the consistency of pituitary macroadenomas, radiomics models based on CET1 images combined with T2 images have higher diagnostic efficacy than models constructed from independent images. However, the model constructed from independent T2 images was more stable across different field strengths and vendors.
Data availability statement
The raw data supporting the conclusions of this article will be made available by the authors, without undue reservation.
Ethics statement
The studies involving humans were approved by ethics committee of Mianyang Third People’s Hospital. The studies were conducted in accordance with the local legislation and institutional requirements. The ethics committee/institutional review board waived the requirement of written informed consent for participation from the participants or the participants’ legal guardians/next of kin because this is a retrospective study using surgical case specimens of patients. The patients had signed an informed consent for the surgery before the operation, while there was no risk of disclosing the patient’s privacy. Written informed consent was obtained from the individual(s) for the publication of any potentially identifiable images or data included in this article.
Author contributions
MZ: Conceptualization, Data curation, Formal analysis, Funding acquisition, Investigation, Methodology, Project administration, Resources, Software, Supervision, Validation, Visualization, Writing – original draft, Writing – review & editing. HL: Conceptualization, Data curation, Methodology, Writing – original draft. HY: Conceptualization, Funding acquisition, Supervision, Validation, Writing – original draft. YL: Data curation, Project administration, Validation, Writing – review & editing. JZ: Conceptualization, Data curation, Formal analysis, Funding acquisition, Project administration, Resources, Writing – original draft, Writing – review & editing.
Funding
The author(s) declare financial support was received for the research and/or publication of this article. This work was supported by the 2022 Youth Research Project of the Sichuan Health and Health Promotion Association (SCHHPA), entitled “Feasibility Study on Predicting Pathological Grading and Early Postoperative Recurrence of Hepatocellular Carcinoma Using Intratumoral and Peritumoral MRI Radiomics and Machine Learning” (Grant Number: KY2022QN0168).
Conflict of interest
The authors declare that the research was conducted in the absence of any commercial or financial relationships that could be construed as a potential conflict of interest.
Generative AI statement
The author(s) declare that no Generative AI was used in the creation of this manuscript.
Any alternative text (alt text) provided alongside figures in this article has been generated by Frontiers with the support of artificial intelligence and reasonable efforts have been made to ensure accuracy, including review by the authors wherever possible. If you identify any issues, please contact us.
Publisher’s note
All claims expressed in this article are solely those of the authors and do not necessarily represent those of their affiliated organizations, or those of the publisher, the editors and the reviewers. Any product that may be evaluated in this article, or claim that may be made by its manufacturer, is not guaranteed or endorsed by the publisher.
Supplementary material
The Supplementary Material for this article can be found online at: https://www.frontiersin.org/articles/10.3389/fonc.2025.1539432/full#supplementary-material
Abbreviations
CET1, T1-weighted contrast enhanced image; T2, T2-weighted image; ROI, Region of interest; SMOTE, Synthetic Minority Oversampling Technique; ROC, Receiver operating characteristic; AUC, Area under the ROC curve; DCA, Decision curve analysis.
References
1. Zheng B, Zhao Z, Zheng P, Liu Q, Li S, Jiang X, et al. The current state of MRI-basedradiomics in pituitary adenoma: promising but challenging[J/OL. Front Endocrinol (Lausanne). (2024) 15:1426781. doi: 10.3389/fendo.2024.1426781
2. Mohamadzadeh O, Sadrehosseini SM, Tabari A, Ghanaati H, and Zeinalizadeh M. Can preoperative diffusion tensor imaging tractography predict the visual outcomes of patients with pituitary macroadenomas? A prospective pilot study[J/OL. World Neurosurg. (2023) 172:e326–34. doi: 10.1016/j.wneu.2023.01.022
3. Hussein Z, Slack RW, Baldeweg SE, Mazomenos EB, and Marcus HJ. Machine learning analysis of post-operative tumour progression in non-functioning pituitary neuroendocrine tumours: A pilot study[J/OL. Cancers (Basel). (2024) 16:1199. doi: 10.3390/cancers16061199
4. Machado LF, Elias PCL, Moreira AC, Santos ACD, and Junior LOM. MRI radiomics for the prediction of recurrence in patients with clinically non-functioning pituitary macroadenomas[J/OL. Comput Biol Med. (2020) 124:103966. doi: 10.1016/j.compbiomed.2020.103966
5. Capatina C, Hanzu FA, Hinojosa-Amaya JM, and Fleseriu M. Medical treatment of functional pituitary adenomas, trials and tribulations. J Neurooncol. (2024) 168:197–213. doi: 10.1007/s11060-024-04670-x
6. Dai C, Liang SY, Sun BW, and Kang J. The progress of immunotherapy in refractory pituitary adenomas and pituitary carcinomas. Front Endocrinol (Lausanne). (2020) 11. doi: 10.3389/fendo.2020.608422
7. Bioletto F, Prencipe N, Berton AM, Aversa LS, Cuboni D, Varaldo E, et al. Radiomic analysis in pituitary tumors: current knowledge and future perspectives[J/OL. J Clin Med. (2024) 13:336. doi: 10.3390/jcm13020336
8. Fiore G, Bertani GA, Conte G, Ferrante E, Tariciotti L, Kuhn E, et al. Predicting tumor consistency and extent of resection in non-functioning pituitary tumors. Pituitary. (2023) 26:209–20. doi: 10.1007/s11102-023-01302-x
9. Fiore G, Bertani GA, Baldeweg SE, Borg A, Conte G, Dorward N, et al. Reappraising prediction of surgical complexity of non-functioning pituitary adenomas after transsphenoidal surgery: the modified TRANSSPHER grade. Pituitary. (2025) 28:26. doi: 10.1007/s11102-024-01495-9
10. Di Somma A, Guizzardi G, Valls Cusiné C, Hoyos J, Ferres A, Topczewski TE, et al. Combined endoscopic endonasal and transorbital approach to skull base tumors: a systematic literature review. J Neurosurg Sci. (2022) 66:406–12. doi: 10.23736/S0390-5616.21.05401-1
11. Cuocolo R, Ugga L, Solari D, Corvino S, D'Amico A, Russo A, et al. Prediction of pituitary adenoma surgical consistency: radiomic data mining and machine learning on T2-weighted MRI. Neuroradiology. (2020) 62:1649–56. doi: 10.1007/s00234-020-02502-z
12. Iuchi T, Saeki N, Tanaka M, and Yamaura A. MRI prediction of fibrous pituitary adenomas. Acta Neurochir. (1998) 140:779–86. doi: 10.1007/s007010050179
13. Smith K, Leever J, and Chamoun R. Prediction of consistency of pituitary adenomas by magnetic resonance imaging. J Neurol Surg Part B Skull Base. (2015) 76:340–3. doi: 10.1055/s-0035-1549005
14. Pierallini A, Caramia F, Falcone C, Pierallini A, Caramia F, Falcone C, et al. Pituitary macroadenomas: Pre-operative evaluation of consistency with diffusion-weighted MR imaging-initial experience. Radiology. (2006) 239:223–31. doi: 10.1148/radiol.2383042204
15. Wei L, Lin SA, Fan K, Xiao D, Hong J, Wang SH, et al. Relationship between pituitary adenoma texture and collagen content revealed by comparative study of MRI and pathology analysis. Int J Clin Exp Med. (2015) 8:12898–905.
16. Lubner MG, Smith AD, Sandrasegaran K, Sandrasegaran K, Sahani DV, Pickhardt PJ, et al. CT texture analysis: definitions, applications, biologic correlates, and challenges. Radiographics. (2017) 37:1483–503. doi: 10.1148/rg.2017170056
17. Gillies RJ, Kinahan PE, and Hricak H. Radiomics: images are more than pictures, they are data. Radiology. (2016) 278:563–77. doi: 10.1148/radiol.2015151169
18. Lu Y. Prediction of the Consistency of pituitary adenoma:A Comparative study on Diffusion-Weighted Imaging and Pathological Results. Fudan University (2014).
19. van Griethuysen JJM, Fedorov A, Parmar C, Hosny A, Aucoin N, Narayan V, et al. Computational radiomics system to decode the radiographic phenotype. Cancer Res. (2017) 2017:e104–7. doi: 10.1158/0008-5472.CAN-17-0339
20. Mathew J, Pang CK, Luo M, and Leong WH. Classification of imbalanced data by oversampling in kernel space of support vector machines. IEEE Trans Neural Netw Learn Syst. (2018) 29:4065–76. doi: 10.1109/TNNLS.5962385
21. Dablain D, Krawczyk B, and Chawla NV. DeepSMOTE: fusing deep learning and SMOTE for imbalanced data. IEEE Trans Neural Netw Learn Syst. (2023) 34:6390–404. doi: 10.1109/TNNLS.2021.3136503
22. Swana EF, Doorsamy W, and Bokoro P. Tomek link and SMOTE approaches for machine fault classification with an imbalanced dataset. Sensors (Basel). (2022) 22:3246. doi: 10.3390/s22093246
23. Su C-Q, Zhang X, Pan T, Chen XT, Chen W, Duan SF, et al. Texture analysis of high b-value diffusion-weighted imaging for evaluating consistency of pituitary macroadenomas. J Magnetic Resonance Imaging. (2019) 7:1–6. doi: 10.1002/jmri.26941
24. JPark JE, Kim HS, Kim D, Park SY, Kim JY, Cho SJ, et al. A systematic review reporting quality of radiomics research in neuro-oncology: toward clinical utility and quality improvement using high-dimensional imaging features. Neuro Oncol. (2020) 22:31–43. doi: 10.1186/s12885-019-6504-5
25. Larue RTHM, van Timmeren JE, de Jong EEC, Feliciani G, Leijenaar RTH, Schreurs WMJ, et al. Influence of gray level discretization on radiomic feature stability for different CT scanners, tube currents and slice thicknesses: a comprehensive phantom study. Acta Oncol. (2017) 56:1544–53. doi: 10.1080/0284186X.2017.1351624
26. Pavic M, Bogowicz M, Würms X, Glatz S, Finazzi T, Riesterer O, et al. Influence of inter-observer delineation variability on radiomics stability in different tumor sites. Front Oncol. (2020) 10:964. doi: 10.1080/0284186X.2018.1445283
27. Park JE, Kim D, Kim HS, Park SY, Kim JY, Cho SJ, et al. Quality of science and reporting of radiomics in oncologic studies: room for improvement according to radiomics quality score and TRIPOD statement. Eur Radiol. (2020) 30:523–36. doi: 10.1007/s00330-019-06360-z
28. Zwanenburg A, Vallières M, Abdalah MA, Aerts HJWL, Andrearczyk V, Apte A, et al. The image biomarker standardization initiative: standardized quantitative radiomics for high-throughput image-based phenotyping. Radiology. (2020) 295:328–38. doi: 10.1148/radiol.2020191145
29. Rohrer M, Bauer H, Mintorovitch J, Martin Requardt M, and Weinmann HJ. Comparison of magnetic properties of MRI contrast media solutions at different magnetic field strengths. Invest Radiol. (2005) 40:715–24. doi: 10.1097/01.rli.0000184756.66360.d3
30. Fedorov A, Clunie D, Ulrich E, Fedorov A, Clunie D, Ulrich E, et al. DICOM for quantitative imaging biomarker development: a standards based approach to sharing clinical data and structured PET/CT analysis results in head and neck cancer research. PeerJ. (2016) 4:e2057. doi: 10.7717/peerj.2057
31. Mackin D, Fave X, Zhang L, Fried D, Yang J, Taylor B, et al. Measuring CT scanner variability of radiomics features. Invest Radiol. (2015) 50:757–65. doi: 10.1097/RLI.0000000000000180
32. Traverso A, Wee L, Dekker A, and Gillies R. Repeatability and reproducibility of radiomic features: A systematic review. Int J Radiat Oncol Biol Phys. (2018) 102:1143–58. doi: 10.1016/j.ijrobp.2018.05.053
33. Ligero M, Torres G, Sanchez-Catasus C, Ligero M, Jordi-Ollero O, Bernatowicz K, et al. Minimizing acquisition-related radiomics variability by image resampling and batch effect correction to allow for large-scale data analysis. Eur Radiol. (2021) 31:1460–70. doi: 10.1007/s00330-020-07174-0
Keywords: radiomics, pituitary macroadenoma, hierarchical analysis, consistency, combined model
Citation: Zou M, Li H, Yao H, Liu Y and Zhang J (2025) MR radiomics in assessment of consistency of pituitary macroadenoma: can T1-weighted contrast enhanced image improve diagnostic performance of T2-weighted image? Front. Oncol. 15:1539432. doi: 10.3389/fonc.2025.1539432
Received: 04 December 2024; Accepted: 12 August 2025;
Published: 03 September 2025.
Edited by:
Liam Chen, University of Minnesota, United StatesReviewed by:
Catharina Lisson, Ulm University Medical Center, GermanyGiorgio Fiore, National Hospital for Neurology and Neurosurgery (NHNN), United Kingdom
Copyright © 2025 Zou, Li, Yao, Liu and Zhang. This is an open-access article distributed under the terms of the Creative Commons Attribution License (CC BY). The use, distribution or reproduction in other forums is permitted, provided the original author(s) and the copyright owner(s) are credited and that the original publication in this journal is cited, in accordance with accepted academic practice. No use, distribution or reproduction is permitted which does not comply with these terms.
*Correspondence: Yang Liu, bHkxMDAxMjAwMkAxNjMuY29t; Jie Zhang, NzE4ODI3MTUxQHFxLmNvbQ==
†These authors have contributed equally to this work