 Hai-yan Yan1†
 Mei Wang
- 1Department of Gynecology, Shanghai Pudong New Area People’s Hospital, Shanghai, China
- 2Department of Gynecology, Chongming Hospital Affiliated to Shanghai University of Medicine and Health Sciences, Shanghai, China
- 3Department of Pathology, Shanghai Pudong New Area People’s Hospital, Shanghai, China
Objective: This study aims to develop and evaluate an artificial intelligence-based model for cervical cancer subtyping using whole-slide images (WSI), incorporating both patch-level and WSI-level analyses to enhance diagnostic accuracy.
Methods: A total of 438 whole slide images were retrieved from three databases, one public dataset for model training and two independent private datasets for evaluation of generalization. It is comprised of two consecutive stages: a patch-level prediction and a WSI-level prediction. Patch-level predictions were performed using the four convolutional neural networks model, while WSI-level predictions were based on five machine learning algorithms with three different aggregation methods. We compared the models in terms of discrimination (accuracy, sensitivity, specificity, and the area under the receiver operating characteristic curve (AUROC)) and calibration.
Results: At the patch level, the Inception-v3 model achieved an AUROC of 0.960 (95% confidence interval(95%CI): 0.943, 0.978) in private dataset one and an AUROC of 0.942 (95% CI: 0.929, 0.956) in private dataset one. For WSI-level predictions, the support vector machine algorithm based on Term Frequency-Inverse Document Frequency (TF-IDF) features performed the best, with an AUROC of 0.964 (95% CI: 0.916, 0.996) in private dataset one and 0.947 (95% CI: 0.879, 0.996) in private dataset two. The decision curve analysis and calibration curves further validated the clinical potential of the model.
Discussion: This study demonstrates the potential of using AI models for cervical cancer subtyping, with strong generalization across multiple datasets and clinical settings.
Introduction
Cervical cancer is one of the leading gynecologic malignancies worldwide, particularly in low-income and developing countries. According to the Global Cancer Statistics, approximately 604,127 cases of cervical cancer and 338,300 deaths were reported in 2020 (1). The two main subtypes of cervical cancer are squamous cell carcinoma (SCC) and adenocarcinoma (AC), which account for 80-85% and 15-20% of all cervical cancer cases, respectively (2). Distinguishing between these two subtypes is essential, as they differ significantly in terms of biological behavior and clinical treatment responses (3). Histological examination by trained pathologists remains the “gold standard” for classifying cancer subtypes in clinical practice. However, there is a growing shortage of anatomic pathologists both in China and globally, leading to an overburdened workforce and compromised diagnostic quality (4). Therefore, new techniques to support histologic diagnosis are urgently needed.
The integration of digital pathology and artificial intelligence (AI) is on the verge of becoming a mainstream tool for routine diagnostic pathology (5). Digital pathology enables the acquisition of high-resolution whole-slide images (WSIs) that contain comprehensive, uncompressed information from entire microscopic slides, while AI can analyze these gigapixel WSIs to provide objective diagnoses, prognoses, and predictions of therapeutic response (6). It has been reported that computational pathology can aid in routine diagnostics by identifying suspected malignant areas across various organs (7). Recent studies have demonstrated that AI models perform well in training binary classifiers for patient stratification (8). However, most AI applications for cervical cancer have focused on diagnosis using colposcopy or cytology images, rather than subtyping (9–11). These approaches have shown potential for early detection by identifying abnormal regions or predicting lesion severity, thus supporting clinicians in diagnostic tasks. Despite these advances, few studies have specifically focused on subtyping cervical cancer, such as distinguishing between SCC and AC (12). Given that accurate subtyping is crucial for personalized treatment planning, there is a pressing need for AI solutions tailored specifically to cervical cancer subtyping.
In this study, we propose a novel AI-based approach to address the subtyping of cervical cancer, specifically differentiating between SCC and AC using WSIs. By focusing on subtyping, our method aims to fill a critical gap in cervical cancer diagnostics, enabling more precise and personalized treatment strategies.
Methods
Patients and datasets
This study utilized three independent datasets, including one public and two private datasets. The public dataset was obtained from The Cancer Genome Atlas Cervical Squamous Cell Carcinoma and Endocervical Adenocarcinoma (TCGA-CESC) (13). The two private datasets consisted of cervical tissue slides from women who underwent surgical resection and were subsequently diagnosed with cervical cancer at Chongming Central Hospital (CCH), affiliated with Shanghai University of Medicine & Health Sciences, and Shanghai Pudong New Area Hospital between January 2020 and December 2023.In accordance with the TRIPOD guidelines, the TCGA-CESC dataset was used for model training and internal validation, while the CCH and SPNAH datasets were used for independent external validation. The exclusion criteria were as follows: (1) cases where cervical pathology was unavailable; (2) cases that were not diagnosed as primary cervical cancer or involved any malignant tumors; (3) tissue sections that were not formalin-fixed, paraffin-embedded (FFPE), or H&E-stained. The ground truth for each patient was derived either from the pathological diagnoses available in the TCGA database or from pathology reports of patients who underwent surgical resection for cervical cancer at the two hospital centers.
WSI annotation and pathologist performance evaluation
Using QuPath (version 0.3.2) (14), two experienced pathologists independently outlined the tumor boundaries for each WSI, while being blinded to the ground truth labels. WSIs with a Dice coefficient lower than 0.9 were flagged for further review by a senior pathologist to reach a consensus. After the tumor regions were delineated, the same pathologists were asked to participate in WSI-level classification to benchmark the AI model’s performance. Pathologist 1 is an associate chief pathologist with 10 years of expertise in cytology; Pathologist 2 is an attending pathologist with 8 years of experience; and Pathologist 3 is a resident pathologist with 4 years of experience. The evaluation followed a rigorous two-step protocol designed to simulate the AI training environment. In the first step, all pathologists jointly reviewed the training set images, discussing challenging cases and consulting a chief pathologist to resolve diagnostic uncertainties related to malignancy on the cell block slides. After a one-week training period, each pathologist independently classified WSIs from the validation set into two categories (“SCC” or “AC”) within a defined time window. To ensure objectivity, all pathologists were blinded to the gold-standard diagnoses based on hysteroscopy or hysterectomy findings during their assessments. This process provided a robust human benchmark against which the AI model’s performance could be compared.
WSI preprocessing
Each WSI was tiled into non-overlapping 512×512-pixel patches at a 20× magnification using the OpenSlide package in Python. After obtaining the patches, a pre-processing pipeline consisting of five steps was applied to exclude patches containing insufficient tissue information (more than 80% background) or artifacts (such as glass reflections, pen markings, tissue folding, and black lines). This pipeline is illustrated in Figure 1, with examples of artifact patches removed at each step (15). First, patches containing significant white background or black regions were discarded using the Red-Green-Blue (RGB) color space. If the percentage of such pixels in the RGB color space exceeded 220 or was lower than 40, the patch was removed. Second, patches containing glass reflections, debris, or scanning artifacts were eliminated if more than 70% of the pixels in the saturation channel had low values, and in the intensity channel, high values were present in the HSV color space. The third step involved removing patches with pen markings by converting them to the Hematoxylin-Eosin-DAB (HED) color space via stain deconvolution. If the intensity in the Eosin channel exceeded 90%, the patch was excluded (16). Fourth, patches with low variance in the Canny edge detection result (below 7000) were removed. Finally, we used the Vahadane method to normalize the color of the images, ensuring consistency across all patches (17).
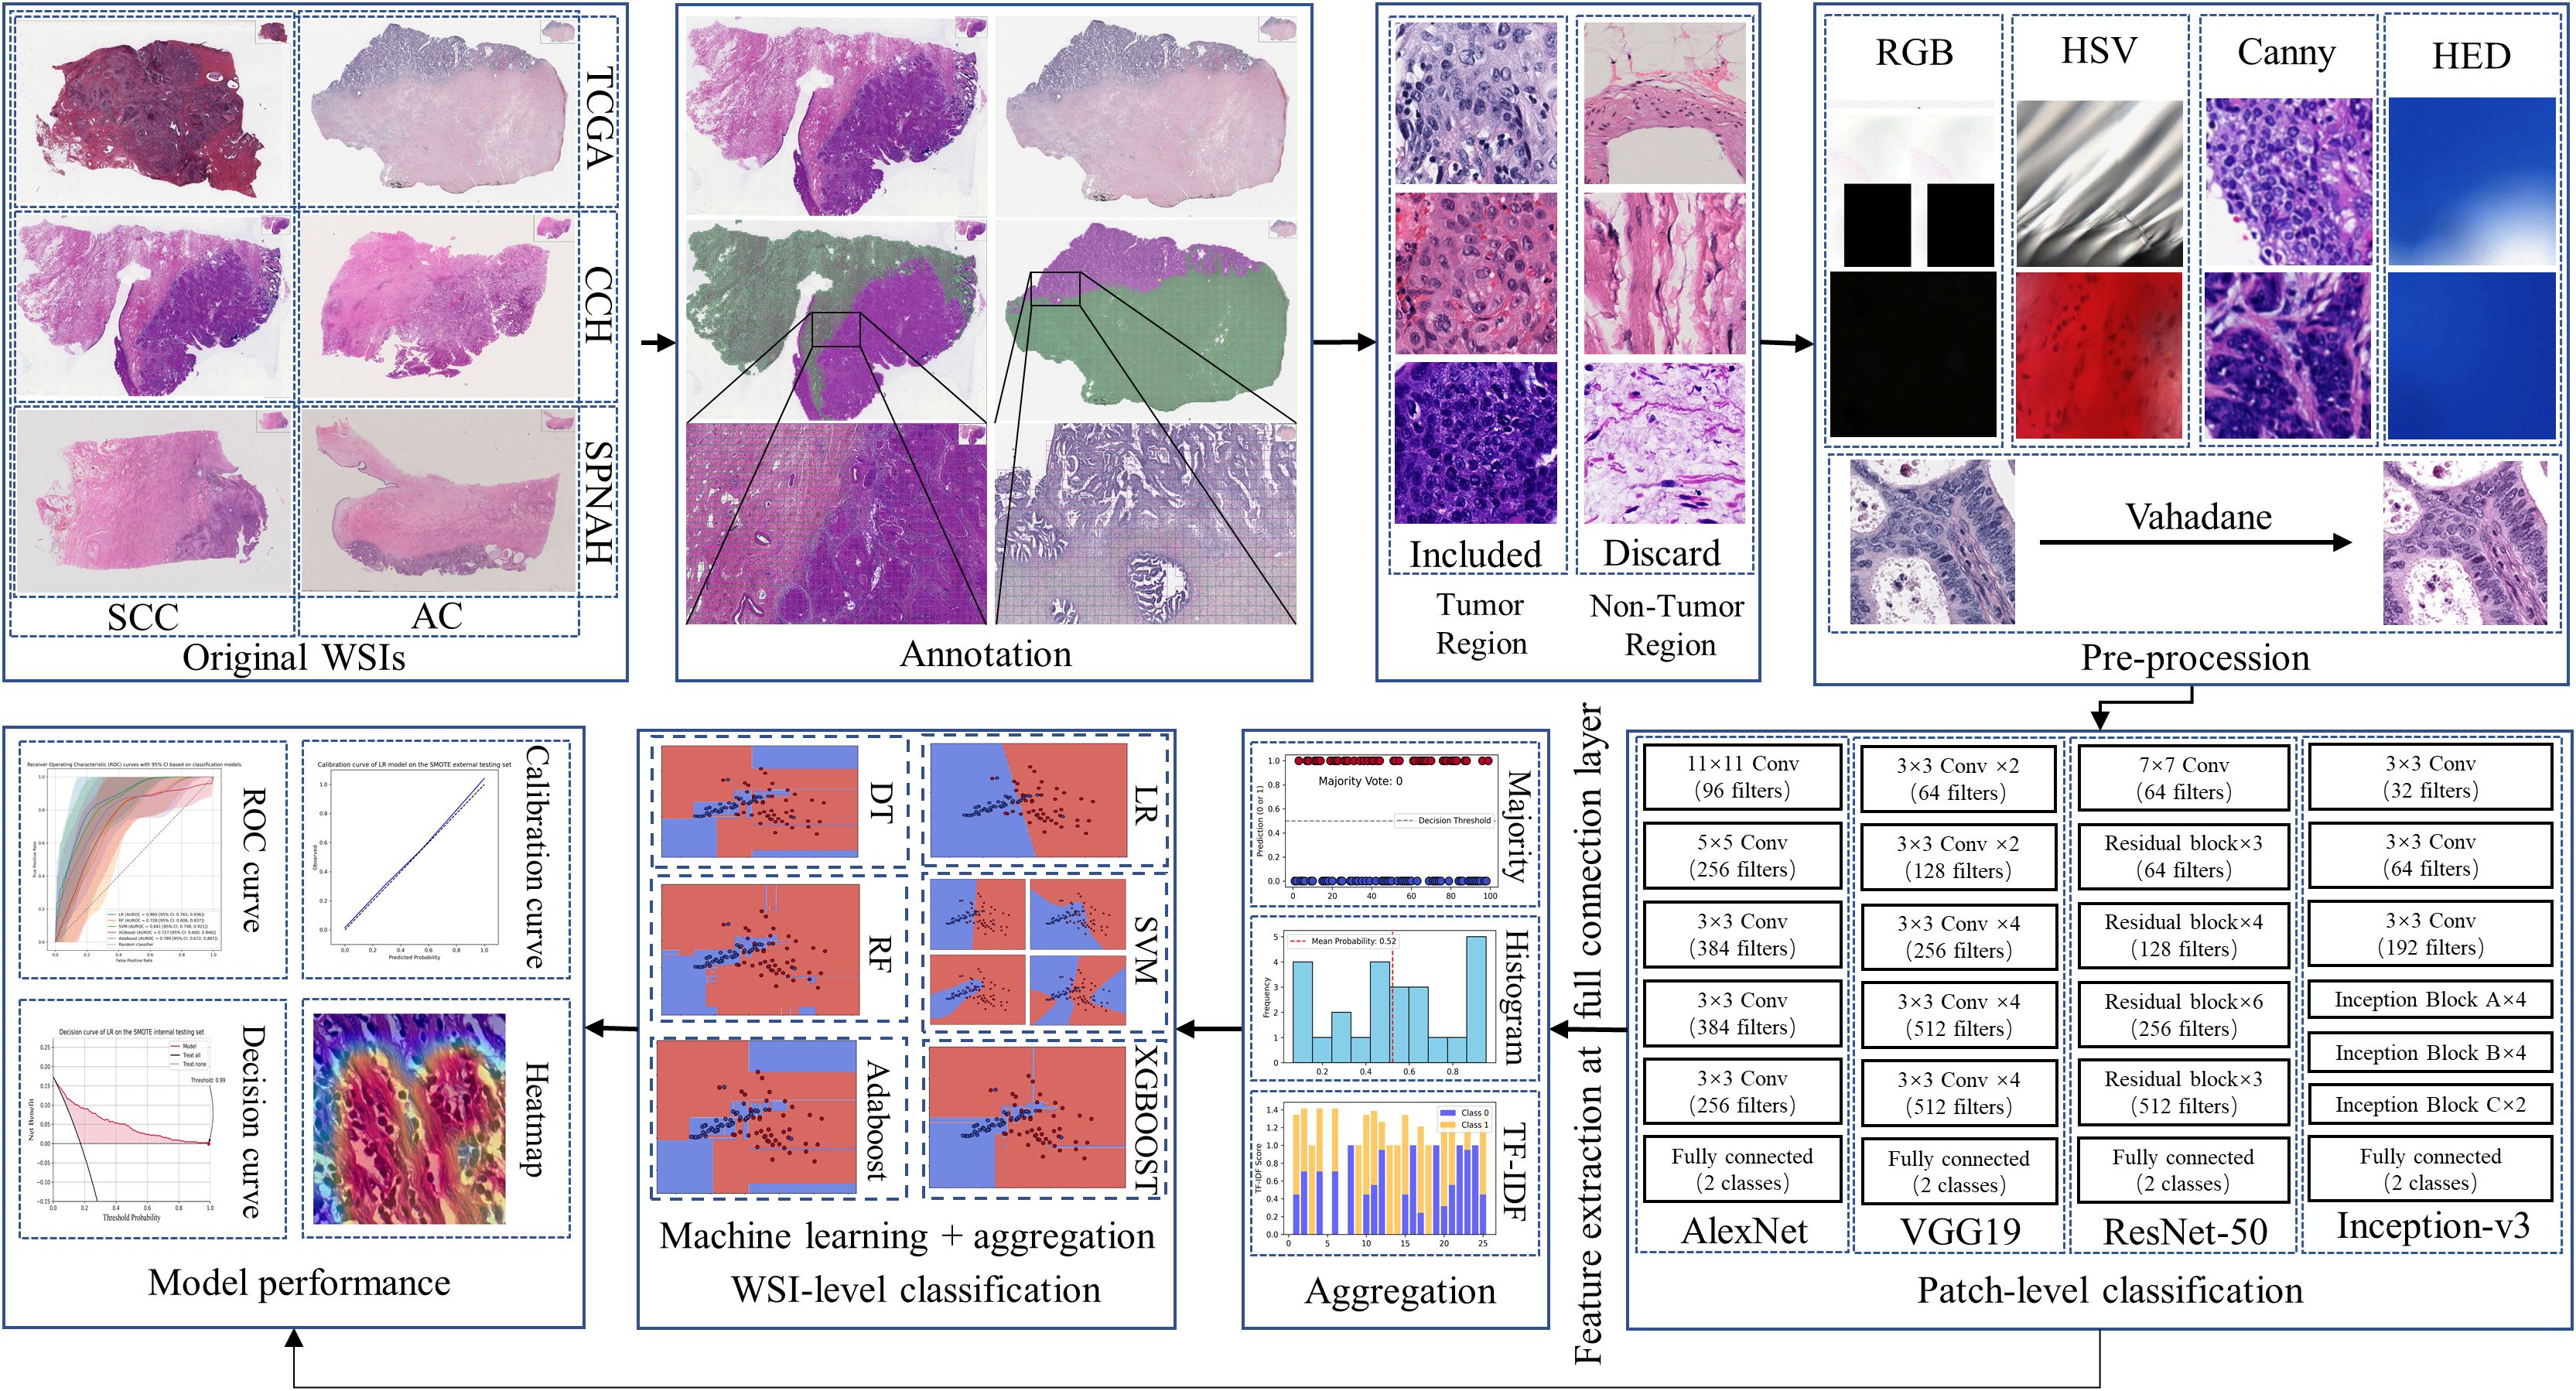
Figure 1. The workflow of the study.
Patch-level classification
Four different CNN algorithms were selected for cervical cancer subtyping: AlexNet, VGG19, ResNet-50, and Inception-v3 (18). Patch-level classification was designed as a binary task to distinguish between SCC and AC, based on tumor regions annotated by experienced pathologists. AlexNet, introduced in 2012, marked a significant breakthrough for CNNs in large-scale image classification tasks. Due to its relatively simple architecture, we used AlexNet as a baseline model to benchmark and compare against more advanced CNN architectures. VGG19 was chosen because it is characterized by deeply homogeneous convolutional filters (19). This algorithm was selected for its significantly larger number of parameters compared to AlexNet, without the additional blocks or sophisticated architecture seen in Inception or ResNet. Inception-v3 is known for its efficient multi-scale feature extraction through parallel Inception modules and its use of factorized convolutions to reduce computational complexity while maintaining strong feature extraction capabilities (20). ResNet, on the other hand, uses residual connections that allow information to bypass multiple layers and pass directly through the network (21). This design addresses the vanishing gradient problem in deep networks, enabling the training of much deeper architectures efficiently. During the training phase, the Adam optimizer was used with a batch size of 64, and the regularization parameter λ was set to 0.001. The learning rate was modified using an exponential decay approach, with the initial value set to 0.0001. The models were trained for 50 epochs. To ensure that the most effective representation was used in subsequent whole-slide image (WSI)-level analysis, the CNN model achieving the best performance at the patch level (measured by AUROC) was selected as the backbone for deep feature extraction.
WSI-level classification
The WSI-level predictions were obtained by aggregating patch-level predictions using three different aggregation methods. The first method was majority voting, which assigns the final label based on the most frequent prediction among all patches in a WSI. The second method was multi-instance learning (histogram and Term Frequency-Inverse Document Frequency, TF-IDF), where patch predictions were transformed into a pre-defined feature dimension and then fed into machine learning algorithms to obtain WSI-level predictions (22). For TF-IDF, each WSI was treated as a document and the patch-level predictions (SCC or AC) as tokens; we used the TfidfVectorizer from the scikit-learn library to generate a 10-dimensional feature vector, which was then input into machine learning classifiers for WSI-level prediction. During the testing phase, WSI classification relied on tumor regions manually delineated by experienced pathologists. Only patches extracted from within these annotated regions were used for inference.
Logistic regression (LR), random forest (RF), support vector machine (SVM), adaptive boosting (AdaBoost), and extreme gradient boosting (XGBoost) were used to construct classifiers (23). To address the class imbalance between SCC and AC, we manually set class weights in the machine learning algorithms according to the inverse class frequencies, assigning a higher weight to the minority class (AC) in proportion to its underrepresentation in the TCGA-CESC dataset (24). Five-fold cross-validation was performed during training to optimize the hyperparameters for each model, and the final selected hyperparameters are listed in Supplementary Table S1.
The performance of both patch-level and slide-level classifiers was evaluated using accuracy, sensitivity, specificity, positive predictive value, negative predictive value, and the area under the receiver operating characteristic curve (AUROC). AUROC was used as the primary performance metric to optimize the models. Calibration was visually assessed using calibration plots, and decision curve analysis was conducted to calculate the net benefit, estimating its potential clinical application.
Implementation environment
All data analyses were conducted on a PC with the following configuration: Windows 10 (64-bit) operating system, a single CPU (AMD Ryzen 9 7950X), a GPU (NVIDIA GeForce RTX 4090, 24 GB), and 96 GB of system memory. The code was written in Python (Version 3.11.0), with libraries used for histology image processing and classification including NumPy (1.20.3), Matplotlib (3.5.0), OpenCV (4.5.4.60), Seaborn (0.11.2), PyTorch (1.10.0), and scikit-learn (1.0.2).
Results
Overview of WSI and patches
The TCGA-CESC dataset included 461 slides from 214 SCC cases and 60 slides from 31 AC cases; the CCH dataset contained 223 slides from 47 SCC cases and 56 slides from 12 AC cases; and the SPNAH dataset comprised 84 slides from 38 SCC cases and 39 slides from 10 AC cases. A total of 238 slides were excluded due to being flash-frozen, and 223 slides were excluded because they were immunohistochemically stained. Additionally, four patients were excluded for having non-primary cervical cancer, and two patients were excluded due to the presence of other malignant tumors. Ultimately, 438 WSIs from 346 cases were included in the analysis: 245 WSIs from 214 SCC cases and 36 WSIs from 31 AC cases in the TCGA-CESC dataset; 67 WSIs from 44 SCC cases and 18 WSIs from 12 AC cases in the CCH dataset; and 55 WSIs from 36 SCC cases and 15 WSIs from 9 AC cases in the SPNAH dataset. The flowchart illustrating the dataset inclusion and exclusion process is depicted in Figure 1. After preprocessing, a total of 1,273,455 patches were generated from the TCGA-CESC dataset, 845,774 patches from the CCH dataset, and 614,831 patches from the SPNAH dataset.
The performance of patch-level classification
Four CNN algorithms were trained on the dataset and evaluated on two independent external validation datasets. The discrimination results are summarized in Table 1, and Figures 2a, b. Among the models, Inception-v3 demonstrated superior performance in both the CCH and SPNAH datasets. In the CCH dataset, it achieved an AUROC of 0.960 (95% CI: 0.943, 0.978), sensitivity of 0.920 (95% CI: 0.914, 0.926), and specificity of 0.826 (95% CI: 0.816, 0.835). In the SPNAH dataset, the model obtained an AUROC of 0.942 (95% CI: 0.929, 0.956), sensitivity of 0.964 (95% CI: 0.955, 0.972), and specificity of 0.776 (95% CI: 0.772, 0.781). As Inception-v3 achieved the best overall performance across both external validation datasets, it was subsequently adopted as the backbone model for deep feature extraction and further analysis in this study. On our hardware setup, processing one patch took approximately 0.04 seconds, resulting in a total training time of ~7–8 hours for the entire dataset.
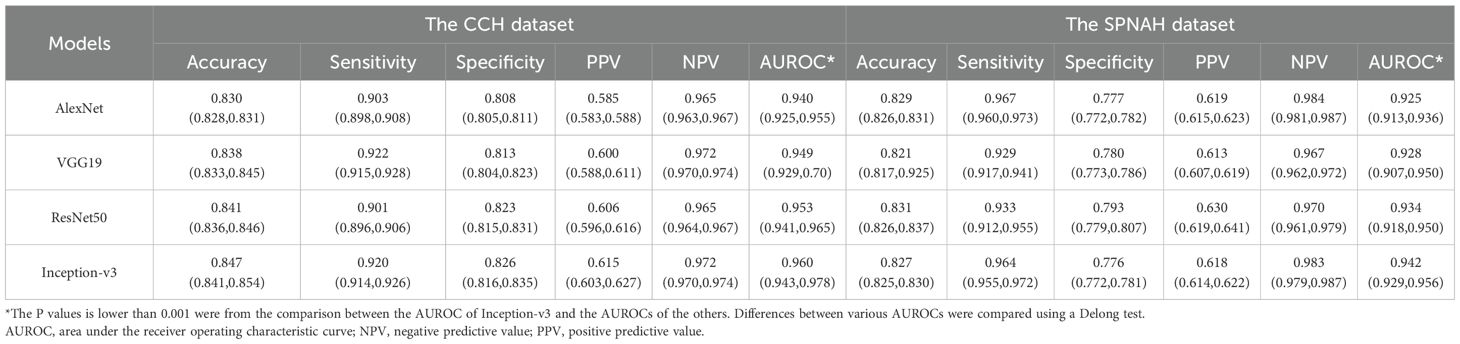
Table 1. Comparison of the diagnostic performances of CNN models for cervical cancer subtyping at patch-level.
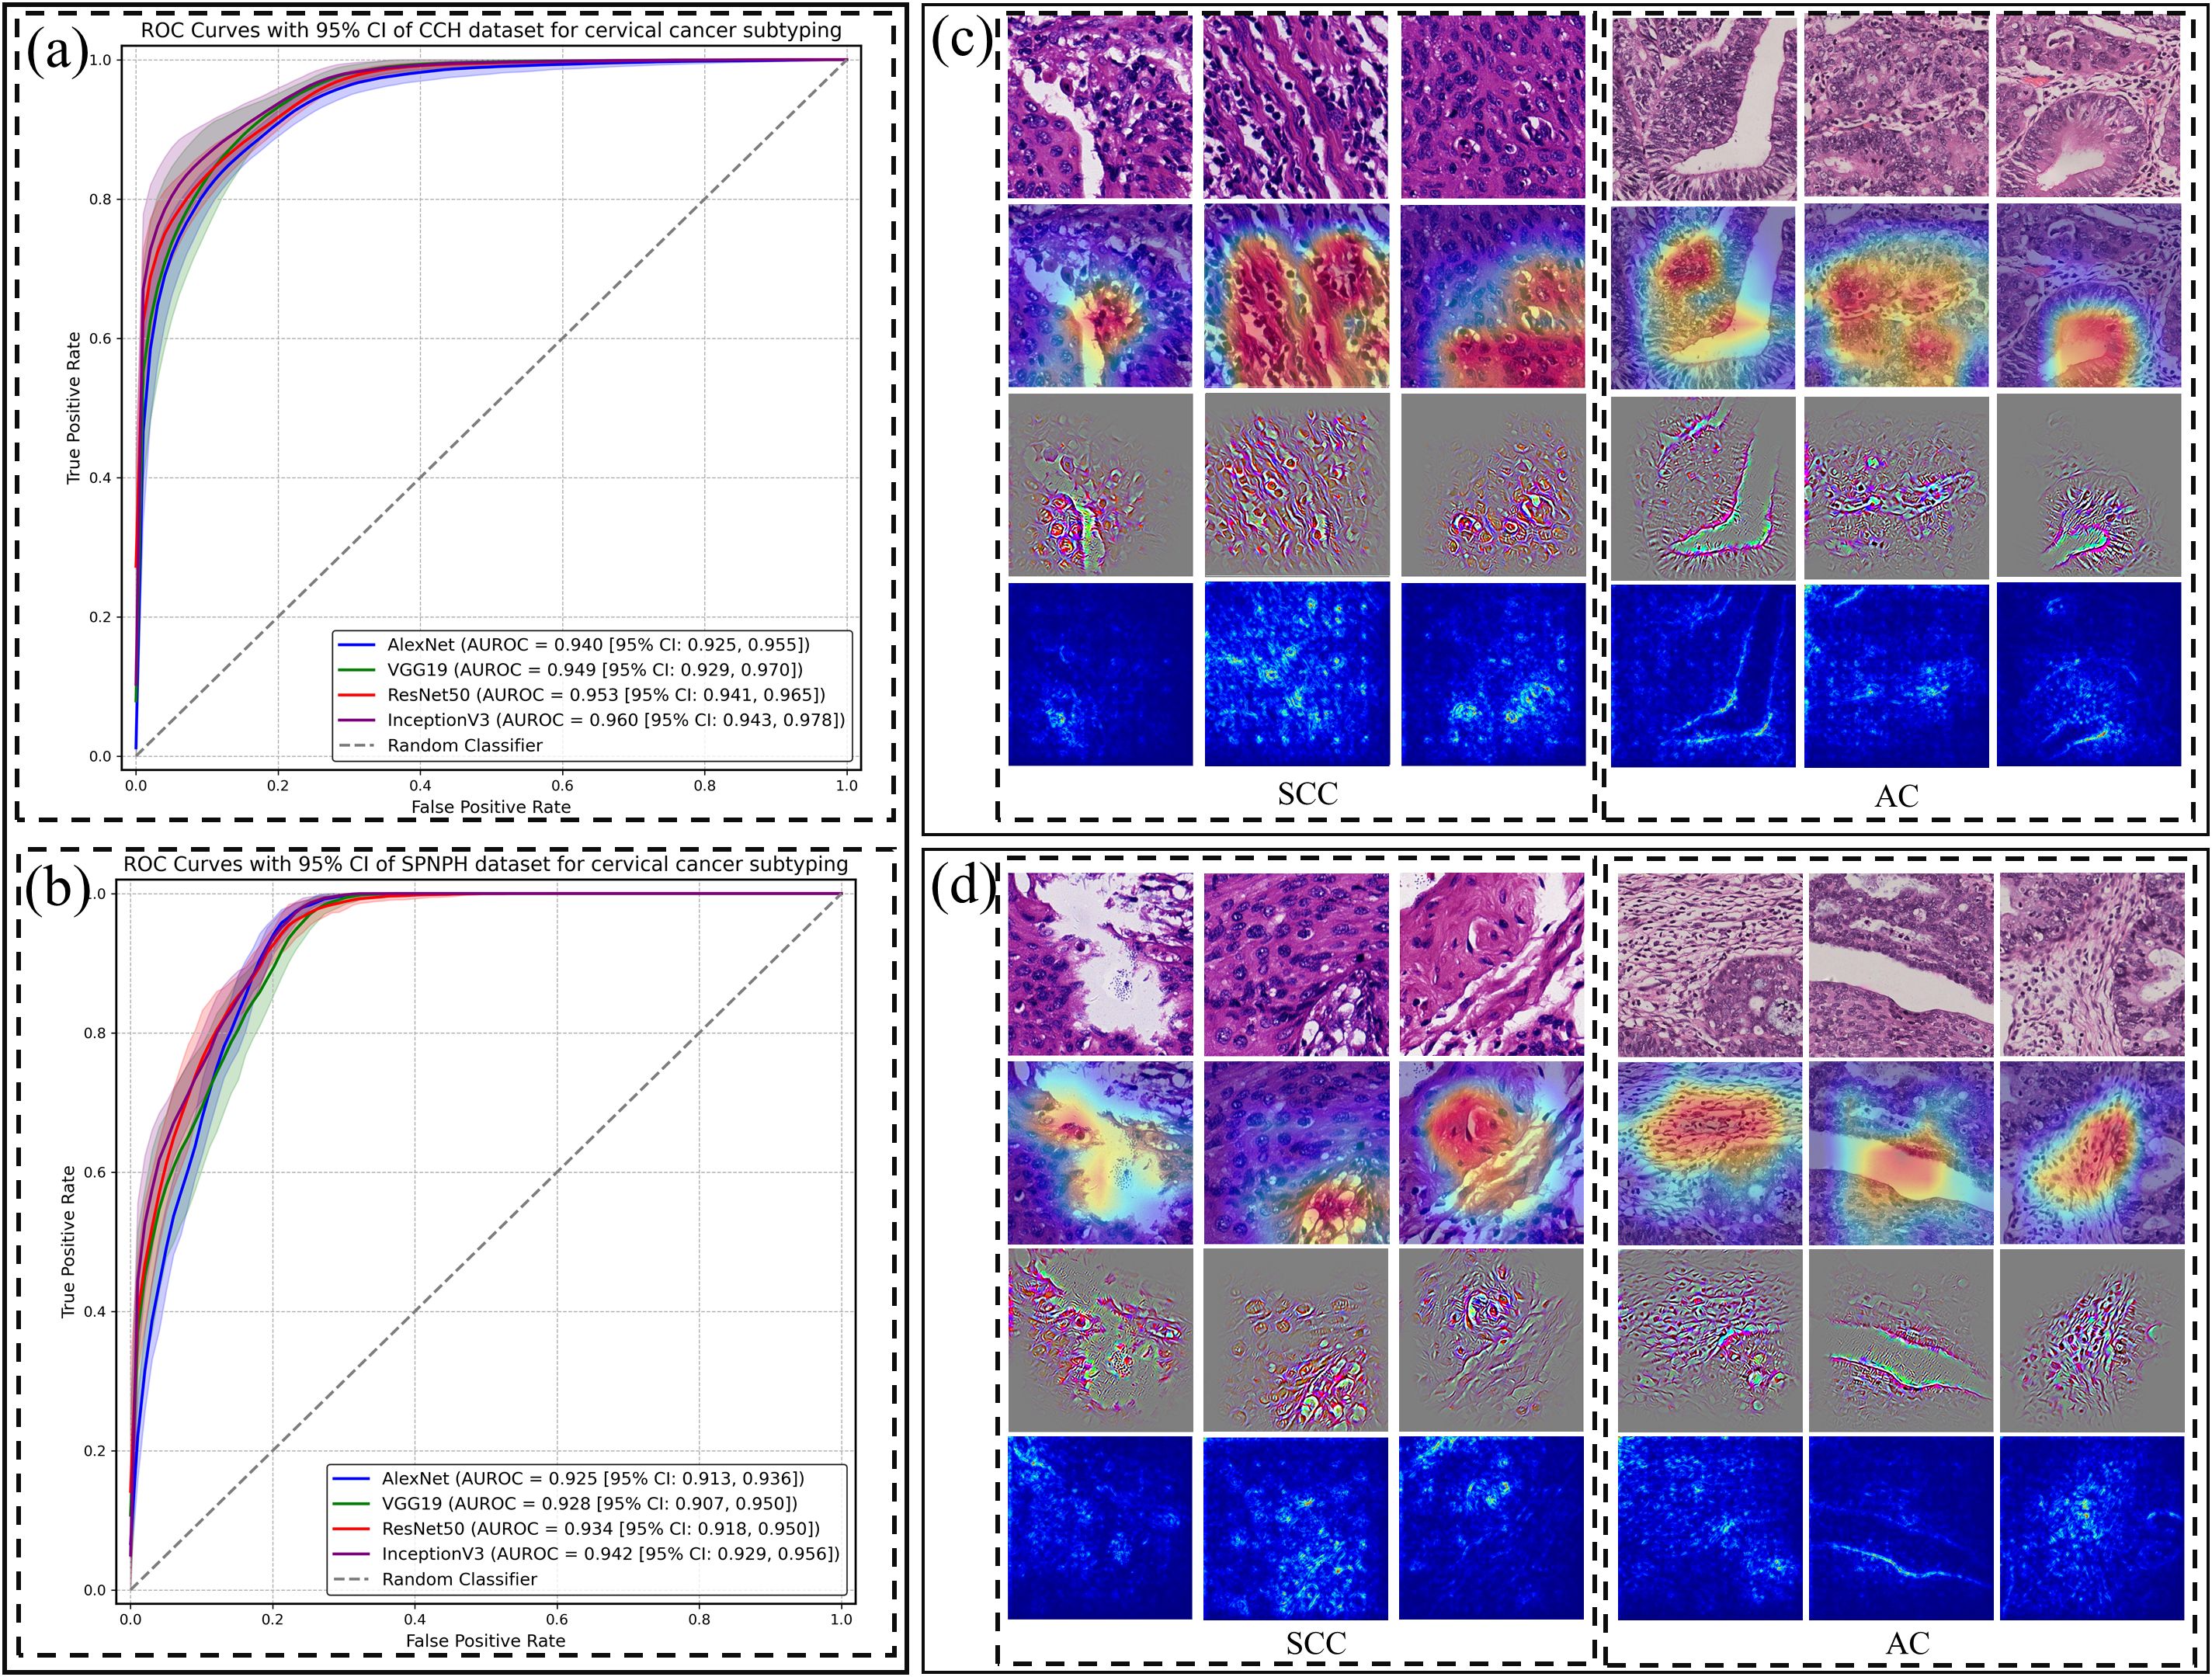
Figure 2. Patch-level classification performance of CNN models and their visualizations for cervical cancer subtyping. Receiver Operating Characteristic (ROC) curves of four CNN models (AlexNet, VGG19, ResNet-50, and Inception-v3) for distinguishing cervical cancer subtypes at the patch level in the (a) CCH and (b) SPNAH datasets. Saliency maps, Grad-CAM, and Guided Grad-CAM visualizations for correctly classified (c) and misclassified (d) SCC and AC cases.
Figures 2c, d present raw H&E images, saliency maps, Grad-CAM, and Guided Grad-CAM visualizations for patches from two representative WSIs—one from an SCC case and the other from an AC case. In Figure 2c, the left dashed box highlights the malignant features in the SCC image, including large, hyperchromatic nuclei with coarse chromatin, as indicated by both the Grad-CAM and Guided Grad-CAM. The right dashed box shows the malignant characteristics in the AC case, such as poorly defined glandular contours, the loss of “back-to-back” (B2B) gland arrangements, minimal intervening stroma, and diffusely infiltrative glands accompanied by extensive desmoplastic responses.
In Figure 2d, the Grad-CAM and Guided Grad-CAM visualizations demonstrate the CNN’s misclassification of the images, likely due to its inability to capture key malignant features. In the SCC case, the model failed to highlight areas with nuclear alterations, such as the large, hyperchromatic nuclei with coarse chromatin. In the AC case, the model did not focus on the glandular structures, further illustrating the challenge of detecting subtle malignant features.
The performance of WSI-level classification
The results of machine learning algorithms using TF-IDF features for both the CCH and SPNAH datasets are presented in Table 2 and Figure 3. In the CCH dataset, the logistic regression model demonstrated the highest performance, achieving an AUROC of 0.964 (95% CI: 0.916, 0.996), sensitivity of 0.938 (95% CI: 0.8, 1), and specificity of 0.921 (95% CI: 0.815, 0.988). The decision curve analysis revealed a consistently high net benefit across a range of threshold probabilities, peaking at a threshold of 0.91, indicating its strong diagnostic potential (Supplementary Figure S1a). The calibration curve for logistic regression also showed good agreement between the predicted probabilities and actual outcomes, suggesting that the model is well-calibrated (Supplementary Figure S1c). WSI-level inference using the trained model required approximately 1–2 seconds per slide.
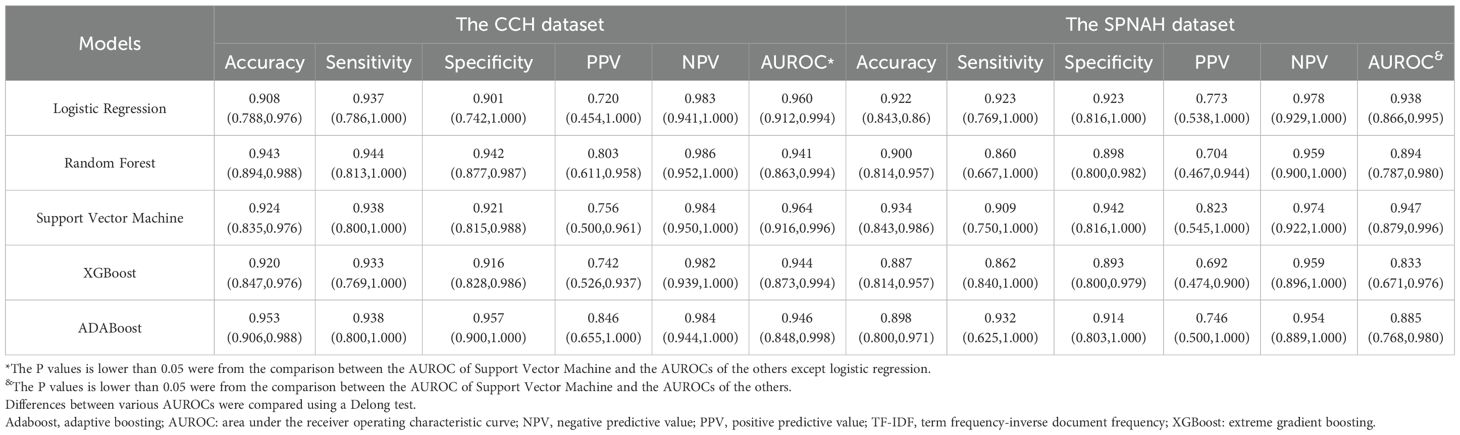
Table 2. Comparison of the diagnostic performances among ML models for models for cervical cancer subtyping at WSI-level using TF-IDF features.
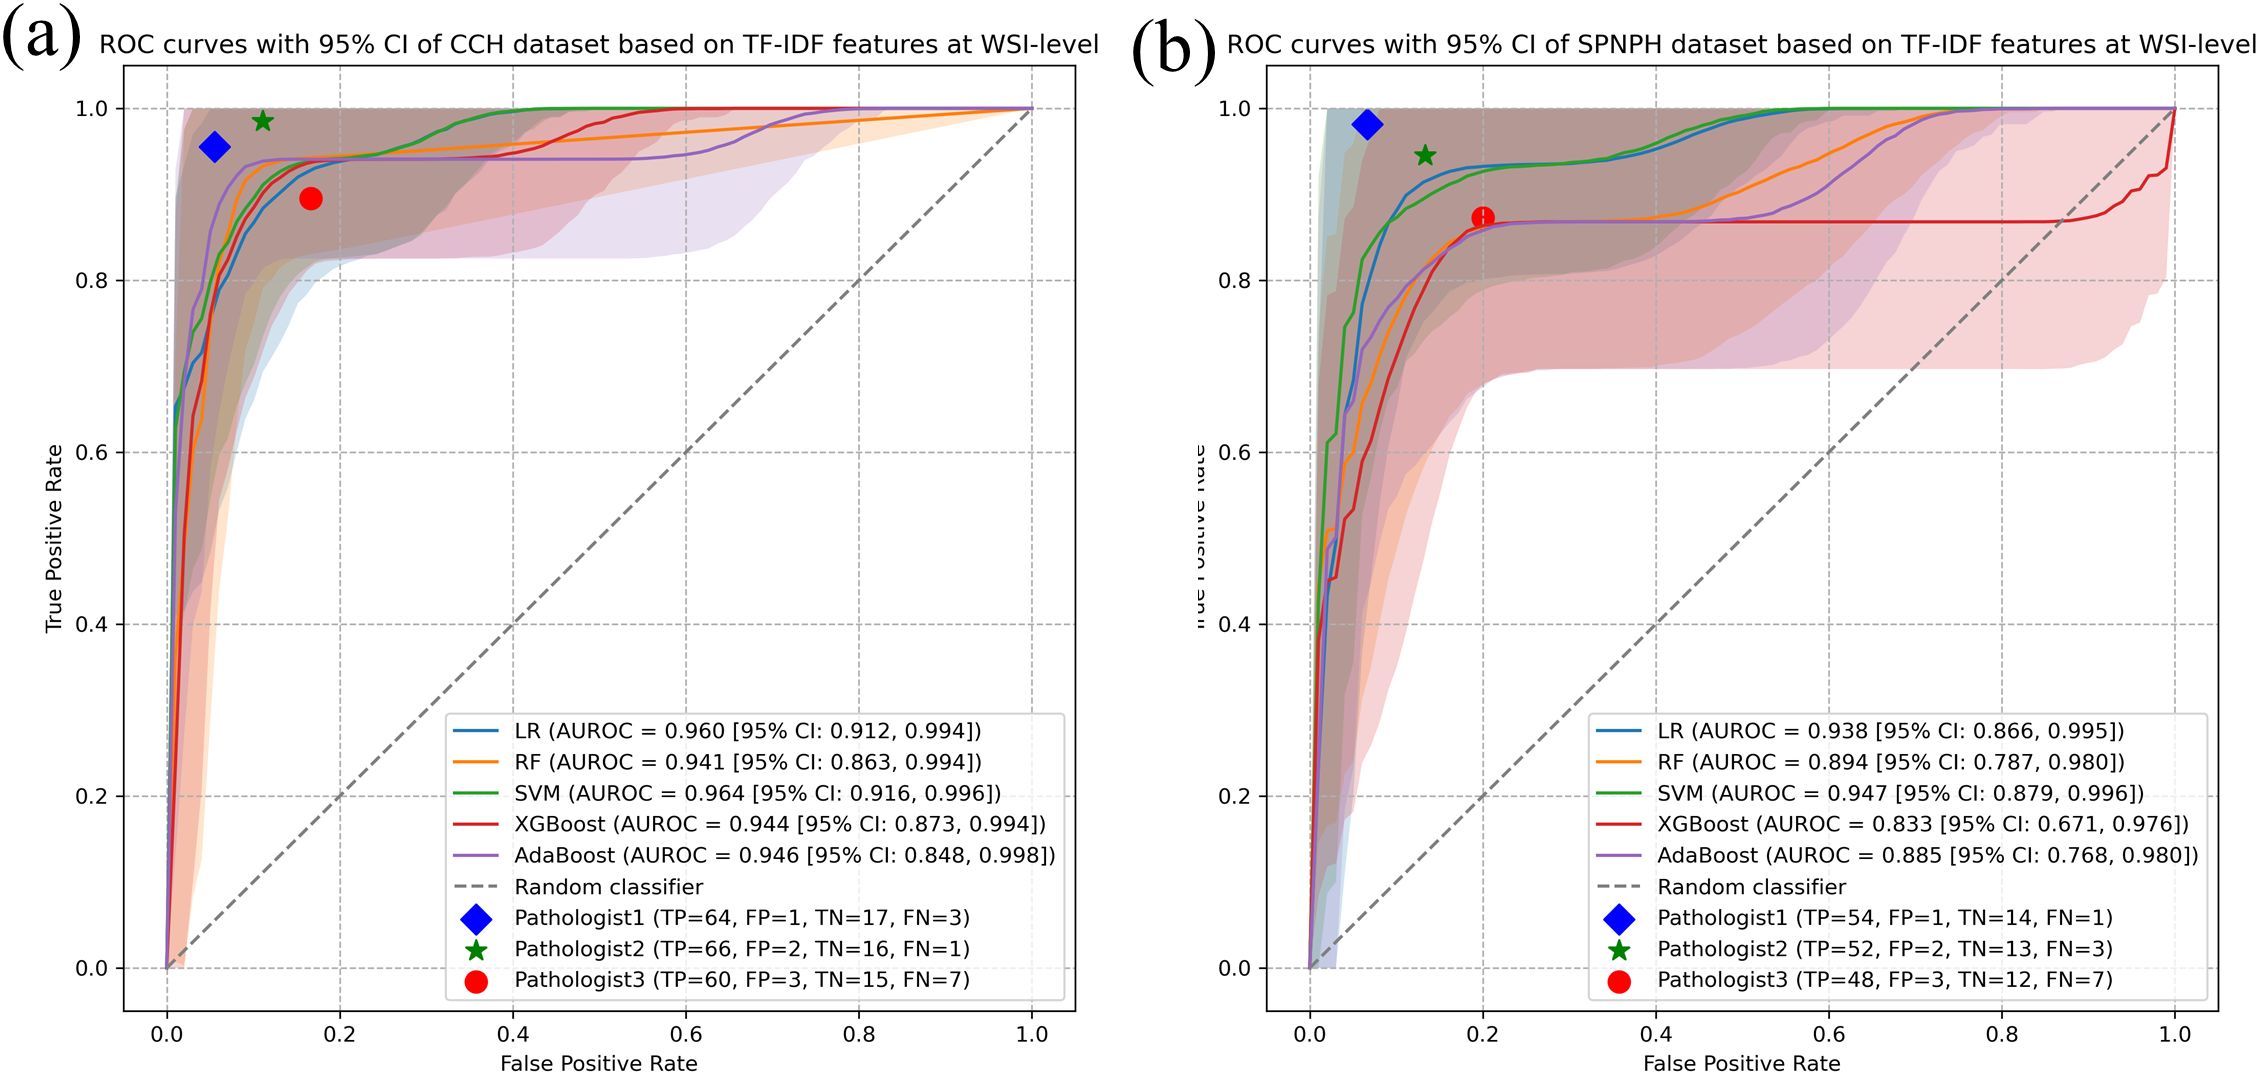
Figure 3. WSI-level classification performance of ML models for cervical cancer subtyping using TF-IDF features. Receiver Operating Characteristic (ROC) curves of five ML models (Logistic Regression, Random Forest, Support Vector Machine, AdaBoost, and XGBoost) for distinguishing cervical cancer subtypes at the WSI level using TF-IDF features in the (a) CCH dataset and (b) SPNAH dataset.
In the SPNAH dataset, the SVM model outperformed others, achieving an AUROC of 0.947 (95% CI: 0.879, 0.996), sensitivity of 0.862 (95% CI: 0.840, 1), and specificity of 0.893 (95% CI: 0.800, 0.979). Interestingly, two pathologists showed slightly better performance than the CNN models. The decision curve analysis highlighted a high net benefit across a range of thresholds, with the maximum benefit at a threshold of 0.73, further supporting the diagnostic value of the SVM model (Supplementary Figure S1b).
As shown in Figure 3, Pathologists 1 and 2 achieved higher classification accuracy than the AI model, demonstrating their strong diagnostic capabilities based on years of clinical experience. In contrast, Pathologist 3, who had relatively less experience, showed lower performance than both the senior pathologists and the AI model.
Additionally, the results for each machine learning algorithm using histogram-based features in both datasets are provided in Supplementary Table S2 and Supplementary Figures S2 and S3. Models based on histogram features generally exhibited lower performance compared to those using TF-IDF features, with the DeLong test confirming a statistically significant difference. The decision curve analysis for histogram-based models also revealed a narrower net benefit area (Supplementary Figures S3a, b). Calibration curves for the SVM and logistic regression models using histogram features are shown in Supplementary Figures S3c, d. Compared to the models using TF-IDF features, the histogram-based calibration curves demonstrated poorer alignment between predicted probabilities and actual outcomes, suggesting that these models were less optimally calibrated.
Discussion
In this study, we proposed a deep learning-based patch-level model and a machine learning-based WSI-level model for cervical cancer subtyping. Using WSI from the TCGA-CESC, CCH, and SPNAH datasets, the results showed that Inception-v3 achieved an AUROC of 0.960 at the patch level. At the WSI level, the model based on TF-IDF features outperformed the one based on histogram features, particularly in the CCH and SPNAH datasets, where SVM and logistic regression models demonstrated excellent performance. Decision curve analysis and calibration curves further confirmed the clinical potential of the proposed method.
Our previous study, which developed a CNN model based on 8,496 labeled histology images, reported an AUROC of 0.974 for cervical cancer subtyping (25). However, screenshots captured through a microscope’s optics are mainly used for documentation and teaching purposes in research settings rather than in routine diagnostics (10, 26). Therefore, we used WSIs in this study to better mimic routine diagnostics, as they offer excellent consistency with glass slides, achieving an AUROC of 0.960. The slightly lower AUROC may be attributed to screenshots focusing primarily on tumor regions, whereas WSI patches include surrounding tissues, combined with variations in staining and preparation across different hospitals. Several previous studies have reported classification performance on the TCGA-CESC dataset (27, 28). Song et al. (2022) reported an InceptionV3-based model trained on manually annotated tumor regions from TCGA-CESC, achieving an AUC of 0.977 using patch-level classification aggregated by majority voting (12). In contrast, our study trained on TCGA and tested on two independent private datasets, employing four CNNs with a combined TF-IDF, histogram, and majority voting approach for WSI-level classification, achieving an AUC of 0.964. The slightly lower performance likely reflects increased variability across centers, demonstrating better generalizability in real-world settings. Another study using their own dataset trained an EfficientNetB0 model to classify cervical histopathology images into normal, precancer, AC, and SCC (29). The model perfectly classified all 22 AC and 40 SCC. Unlike studies using TCGA data, this study’s model benefited from a smaller, more controlled dataset, which likely contributed to its high accuracy but may limit generalizability to diverse clinical settings. Table 3 summarizes the performance of our best model compared with previously published models.
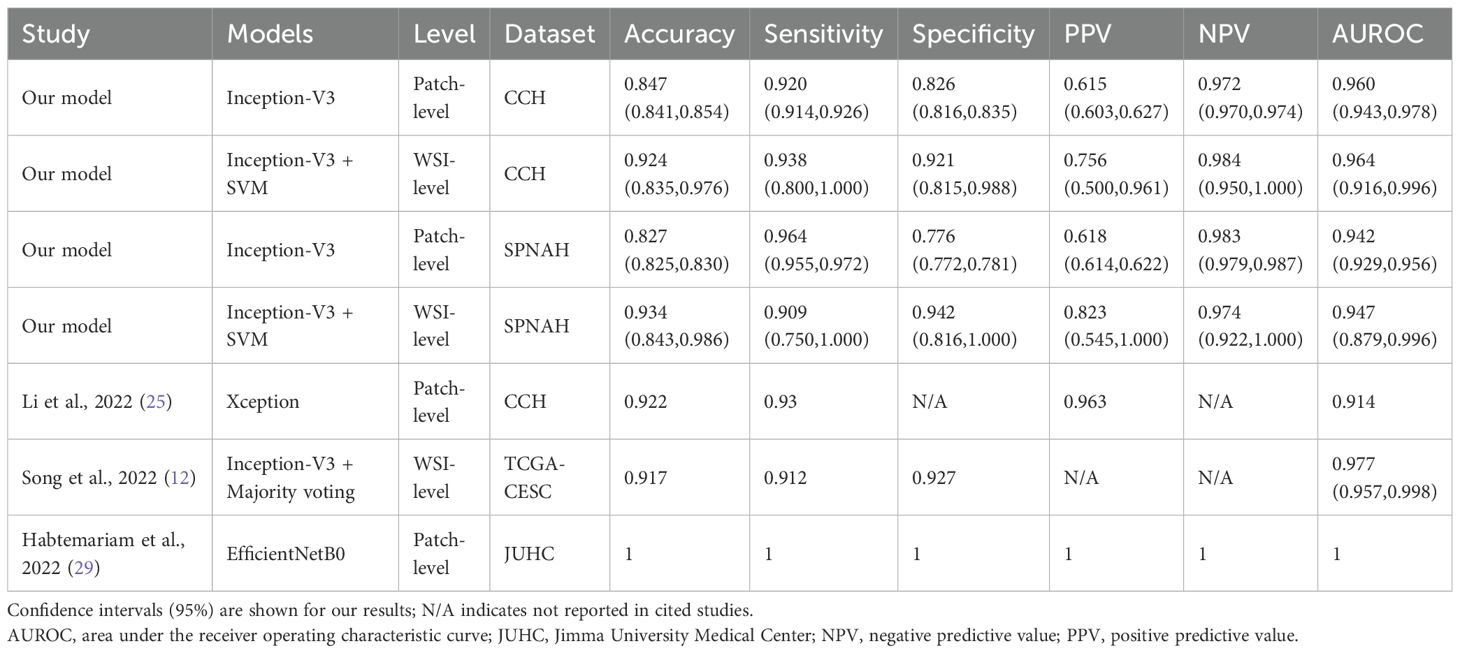
Table 3. Comparison of diagnostic performance of our best model with previously published models at patch-level and WSI-level.
It is important to note that aggregation approaches are crucial to convert the classifiers from patch-level to WSI-level as they determine what features can be extracted from patches. The majority voting method (MV) is the simplest approach which counts the tile number per class and assigns a slide with the label corresponding to the most numerous classes (30). This approach has been applied to predict the HER2 positive level of gastric cancer as each patch contribute equally to the final prediction (31). However, it is not reasonable to be applied to solve cervical cancer subtyping as tumor regions only accounts for a small portion of each large gigapixel image. Multiple instance learning can automatically adjust the contribution of each patch to the overall WSI-level prediction in a learnable way by giving key patches higher weights. It has been proven that MIL is superior than MV in construction of WSI-level feature descriptors (32). Our MIL models achieved an AUROC of 0.964 at the WSI-level, which is slightly lower than that of pathologists. This result suggests that the model holds potential for clinical application, particularly as an adjunct to pathologists in diagnostic workflows.
A key strength of this study is the use of three independent datasets to assess generalization. Unlike models trained on a single dataset, our approach emphasizes adaptability and stability by training on TCGA data and validating on two independent hospital datasets. Given variations in tissue preparation, staining, and scanning across institutions, such validation enhances robustness and reliability in diverse clinical settings. Despite these encouraging results, several limitations should be noted. First, although this study includes three independent datasets with a total of 438 WSIs, future research would benefit from larger, international, multicenter, and multiracial datasets. Second, our model discriminates only between the two main subtypes of cervical cancer. While these are the most representative subtypes, rare cancers, such as neuroendocrine or mesenchymal tumors, cannot be accurately identified with the current tool (33). Future studies should focus on collecting images of these rarer types to develop a more comprehensive diagnostic system for cervical cancer. Third, although our model performs well, it lacks direct comparison with recent MIL-based methods such as CLAM and TransMIL, which achieve strong results by modeling spatial context and inter-patch dependencies more effectively through attention or transformer-based mechanisms (34, 35). Fourth, our current method uses TF-IDF to aggregate patch-level predictions. While effective, TF-IDF was originally developed for text data and does not account for spatial relationships between image patches. This may limit the model’s ability to fully capture spatial context in whole-slide images. Future studies may consider attention-based pooling or graph neural networks to better model spatial dependencies and further improve classification accuracy (36, 37). Fifth, our model currently lacks direct validation of the whole-slide level features (e.g., TF-IDF) with molecular or biological mechanisms, which may limit clinical interpretability and trustworthiness. Future studies integrating multi-omics data and applying explainable AI techniques are needed to better elucidate the pathological significance and decision logic (38).
In conclusion, this study demonstrates a robust two-tiered model for cervical cancer subtyping, validated across multiple datasets. High generalization ability and effective feature combinations highlight its diagnostic potential, while future expansion to rare subtypes could further enhance clinical applicability.
Data availability statement
The raw data supporting the conclusions of this article will be made available by the authors, without undue reservation.
Ethics statement
The study received ethical approval from the Shanghai Pudong New area people’s Hospital (approval number: IRB2023-002). The studies were conducted in accordance with the local legislation and institutional requirements. The ethics committee/institutional review board waived the requirement of written informed consent for participation from the participants or the participants’ legal guardians/next of kin due to the anonymized information of all individual participants included in this study.
Author contributions
H-YY: Conceptualization, Data curation, Methodology, Writing – original draft. X-PS: Conceptualization, Formal Analysis, Methodology, Writing – original draft. P-PT: Data curation, Writing – original draft. LJ: Data curation, Writing – original draft. Y-LZ: Data curation, Methodology, Supervision, Writing – original draft. MW: Conceptualization, Funding acquisition, Methodology, Writing – original draft, Writing – review & editing.
Funding
The author(s) declare that financial support was received for the research and/or publication of this article. The study is supported by The Medical Discipline Construction Program of Shanghai Pudong New Area Health Commission (the Key Disciplines Program) (Grant number: PWZxkz2022-28).
Acknowledgments
We are grateful to all TCGA participants and the TCGA researchers for making this data publicly available.
Conflict of interest
The authors declare that the research was conducted in the absence of any commercial or financial relationships that could be construed as a potential conflict of interest.
Generative AI statement
The author(s) declare that no Generative AI was used in the creation of this manuscript.
Any alternative text (alt text) provided alongside figures in this article has been generated by Frontiers with the support of artificial intelligence and reasonable efforts have been made to ensure accuracy, including review by the authors wherever possible. If you identify any issues, please contact us.
Publisher’s note
All claims expressed in this article are solely those of the authors and do not necessarily represent those of their affiliated organizations, or those of the publisher, the editors and the reviewers. Any product that may be evaluated in this article, or claim that may be made by its manufacturer, is not guaranteed or endorsed by the publisher.
Supplementary material
The Supplementary Material for this article can be found online at: https://www.frontiersin.org/articles/10.3389/fonc.2025.1574639/full#supplementary-material
Supplementary Figure 1 | Decision and calibration curves of the WSI-level SVM models using TF-IDF features. Decision curves of the SVM model based on TF-IDF features in the (a) CCH and (b) SPNAH datasets. Calibration curves of the SVM model based on TF-IDF features in the (c) CCH and (d) SPNAH datasets.
Supplementary Figure 2 | the WSI-level classification performance of ML models for cervical cancer subtyping using Histogram features. Receiver Operating Characteristic (ROC) curves of five ML models (Logistic Regression, Random Forest, Support Vector Machine, AdaBoost, and XGBoost) for distinguishing cervical cancer subtypes at the WSI level using Histogram features in the (a) CCH dataset and (b) SPNAH dataset.
Supplementary Figure 3 | Decision and calibration curves of the WSI-level LR model using Histogram features. Decision curves of the SVM model based on Histogram features in the (a) CCH and (b) SPNAH datasets. Calibration curves of the SVM model based on Histogram features in the (c) CCH and (d) SPNAH datasets.
References
1. Sung H, Ferlay J, Siegel RL, Laversanne M, Soerjomataram I, Jemal A, et al. Global cancer statistics 2020: GLOBOCAN estimates of incidence and mortality worldwide for 36 cancers in 185 countries. CA Cancer J Clin. (2021) 71:209–49. doi: 10.3322/caac.21660
2. Xu Y, Luo H, Hu Q, and Zhu H. Identification of potential driver genes based on multi-genomic data in cervical cancer. Front Genet. (2021) 12:598304. doi: 10.3389/fgene.2021.598304
3. Gadducci A, Guerrieri ME, and Cosio S. Adenocarcinoma of the uterine cervix: Pathologic features, treatment options, clinical outcome and prognostic variables. Crit Rev Oncol Hematol. (2019) 135:103–14. doi: 10.1016/j.critrevonc.2019.01.006
4. Sun H, Zeng X, Xu T, Peng G, and Ma Y. Computer-aided diagnosis in histopathological images of the endometrium using a convolutional neural network and attention mechanisms. IEEE J BioMed Health Inform. (2020) 24:1664–76. doi: 10.1109/JBHI.2019.2944977
5. Jahn SW, Plass M, and Moinfar F. Digital pathology: advantages, limitations and emerging perspectives. J Clin Med. (2020) 9:3697. doi: 10.3390/jcm9113697
6. Bankhead P, Loughrey MB, Fernández JA, Dombrowski Y, McArt DG, Dunne PD, et al. QuPath: Open source software for digital pathology image analysis. Sci Rep. (2017) 7:16878. doi: 10.1038/s41598-017-17204-5
7. Zhang X, Ba W, Zhao X, Wang C, Li Q, Zhang Y, et al. Clinical-grade endometrial cancer detection system via whole-slide images using deep learning. Front Oncol. (2022) 12:1040238. doi: 10.3389/fonc.2022.1040238
8. Campanella G, Hanna MG, Geneslaw L, Miraflor A, Werneck Krauss Silva V, Busam KJ, et al. Clinical-grade computational pathology using weakly supervised deep learning on whole slide images. Nat Med. (2019) 25:1301–9. doi: 10.1038/s41591-019-0508-1
9. Bhatt AR, Ganatra A, and Kotecha K. Cervical cancer detection in pap smear whole slide images using convNet with transfer learning and progressive resizing. PeerJ Comput Sci. (2021) 7:e348. doi: 10.7717/peerj-cs.348
10. Clarke E, Doherty D, Randell R, Grek J, Thomas R, Ruddle RA, et al. Faster than light (microscopy): superiority of digital pathology over microscopy for assessment of immunohistochemistry. J Clin Pathol. (2023) 76:333–8. doi: 10.1136/jclinpath-2021-207961
11. Yu H, Fan Y, Ma H, Zhang H, Cao C, Yu X, et al. Segmentation of the cervical lesion region in colposcopic images based on deep learning. Front Oncol. (2022) 12:952847. doi: 10.3389/fonc.2022.952847
12. Song J, Im S, Lee SH, and Jang HJ. Deep learning-based classification of uterine cervical and endometrial cancer subtypes from whole-slide histopathology images. Diagnostics (Basel). (2022) 12:2623. doi: 10.3390/diagnostics12112623
13. Xu H, Usuyama N, Bagga J, Zhang S, Rao R, Naumann T, et al. A whole-slide foundation model for digital pathology from real-world data. Nature. (2024) 630:181–8. doi: 10.1038/s41586-024-07441-w
14. Humphries MP, Maxwell P, and Salto-Tellez M. QuPath: The global impact of an open source digital pathology system. Comput Struct Biotechnol J. (2021) 19:852–9. doi: 10.1016/j.csbj.2021.01.022
15. Baheti B, Innani S, Nasrallah M, and Bakas S. Prognostic stratification of glioblastoma patients by unsupervised clustering of morphology patterns on whole slide images furthering our disease understanding. Front Neurosci. (2024) 18:1304191. doi: 10.3389/fnins.2024.1304191
16. Ruifrok AC and Johnston DA. Quantification of histochemical staining by color deconvolution. Anal Quant Cytol Histol. (2001) 23:291–9. doi: 10.1097/00000478-200112000-00003
17. Sethi A, Sha L, Vahadane AR, Deaton RJ, Kumar N, Macias V, et al. Empirical comparison of color normalization methods for epithelial-stromal classification in H and E images. J Pathol Inform. (2016) 7:17. doi: 10.4103/2153-3539.179984
18. Mathivanan SK, Francis D, Srinivasan S, Khatavkar V, P K, Shah MA, et al. Enhancing cervical cancer detection and robust classification through a fusion of deep learning models. Sci Rep. (2024) 14:10812. doi: 10.1038/s41598-024-61063-w
19. Simonyan K and Zisserman A. Very deep convolutional networks for large-scale image recognition. Comput Sci. (2014). doi: 10.48550/arXiv.1409.1556
20. Szegedy C, Vanhoucke V, Ioffe S, Shlens J, and Wojna Z. Rethinking the inception architecture for computer vision, in: 2016 IEEE Conference on Computer Vision and Pattern Recognition (CVPR), (2016). Las Vegas, NV, USA: IEEE .
21. He K, Zhang X, Ren S, and Sun J. Deep Residual Learning for Image Recognition. In Proceedings of the 2016 IEEE Conference on Computer Vision and Pattern Recognition (CVPR), Las Vegas, NV, USA: IEEE (2016). p. 770–778 doi: 10.1109/CVPR.2016.90
22. Cai X, Zhang H, Wang Y, Zhang J, and Li T. Digital pathology-based artificial intelligence models for differential diagnosis and prognosis of sporadic odontogenic keratocysts. Int J Oral Sci. (2024) 16:16. doi: 10.1038/s41368-024-00287-y
23. Xiao X, Yi X, Soe NN, Latt PM, Lin L, Chen X, et al. A web-based tool for cancer risk prediction for middle-aged and elderly adults using machine learning algorithms and self-reported questions. Ann Epidemiol. (2025) 101:27–35. doi: 10.1016/j.annepidem.2024.12.003
24. Ghosh K, Bellinger C, Corizzo R, Branco P, Krawczyk B, Japkowicz N, et al. The class imbalance problem in deep learning. Mach Learn. (2024) 113:4845–901. doi: 10.1007/s10994-022-06268-8
25. Li YX, Chen F, Shi JJ, Huang YL, and Wang M. Convolutional neural networks for classifying cervical cancer types using histological images. J Digit Imaging. (2023) 36:441–9. doi: 10.1007/s10278-022-00722-8
26. Zia S, Yildiz-Aktas IZ, Zia F, and Parwani AV. An update on applications of digital pathology: primary diagnosis; telepathology, education and research. Diagn Pathol. (2025) 20:17. doi: 10.1186/s13000-025-01610-9
27. Wang YL, Gao S, Xiao Q, Li C, Grzegorzek M, Zhang YY, et al. Role of artificial intelligence in digital pathology for gynecological cancers. Comput Struct Biotechnol J. (2024) 24:205–12. doi: 10.1016/j.csbj.2024.03.007
28. Xu T, Jiang J, Xiang X, Jahanshahi H, Zhang Y, Chen X, et al. Conduction and validation of a novel prognostic signature in cervical cancer based on the necroptosis characteristic genes via integrating of multiomics data. Comput Biol Med. (2024) 168:107656. doi: 10.1016/j.compbiomed.2023.107656
29. Habtemariam LW, Zewde ET, and Simegn GL. Cervix type and cervical cancer classification system using deep learning techniques. Med Devices (Auckl). (2022) 15:163–76. doi: 10.2147/MDER.S366303
30. Kather JN, Pearson AT, Halama N, Jäger D, Krause J, Loosen SH, et al. Deep learning can predict microsatellite instability directly from histology in gastrointestinal cancer. Nat Med. (2019) 25:1054–6. doi: 10.1038/s41591-019-0462-y
31. Han Z, Lan J, Wang T, Hu Z, Huang Y, Deng Y, et al. A deep learning quantification algorithm for HER2 scoring of gastric cancer. Front Neurosci. (2022) 16:877229. doi: 10.3389/fnins.2022.877229
32. Cao R, Yang F, Ma SC, Liu L, Zhao Y, Li Y, et al. Development and interpretation of a pathomics-based model for the prediction of microsatellite instability in Colorectal Cancer. Theranostics. (2020) 10:11080–91. doi: 10.7150/thno.49864
33. N SV, Dhanabal D, Sundaram S, V P, and Balasubramanian S. Uncommon histopathological subtypes and variants of cervical carcinoma diagnosed at a tertiary care centre: A case series. Cureus. (2024) 16:e66783.
34. Dominguez-Morales JP, Duran-Lopez L, Marini N, Vicente-Diaz S, Linares-Barranco A, Atzori M, et al. A systematic comparison of deep learning methods for Gleason grading and scoring. Med Image Anal. (2024) 95:103191. doi: 10.1016/j.media.2024.103191
35. Maher NG, Danaei Mehr H, Cong C, Adegoke NA, Vergara IA, Liu S, et al. Weakly supervised deep learning image analysis can differentiate melanoma from naevi on haematoxylin and eosin-stained histopathology slides. J Eur Acad Dermatol Venereol. (2024) 38:2250–8. doi: 10.1111/jdv.20307
36. Brussee S, Buzzanca G, Schrader AMR, and Kers J. Graph neural networks in histopathology: Emerging trends and future directions. Med Image Anal. (2025) 101:103444. doi: 10.1016/j.media.2024.103444
37. Ding K, Zhou M, Wang H, Zhang S, and Metaxas DN. Spatially aware graph neural networks and cross-level molecular profile prediction in colon cancer histopathology: a retrospective multi-cohort study. Lancet Digit Health. (2022) 4:e787–95. doi: 10.1016/S2589-7500(22)00168-6
38. Fremond S, Andani S, Barkey Wolf J, Dijkstra J, Melsbach S, Jobsen JJ, et al. Interpretable deep learning model to predict the molecular classification of endometrial cancer from haematoxylin and eosin-stained whole-slide images: a combined analysis of the PORTEC randomised trials and clinical cohorts. Lancet Digit Health. (2023) 5:e71–82. doi: 10.1016/S2589-7500(22)00210-2
Keywords: cervical cancer, convolutional neural networks, machine learning, multiple instance learning, subtyping, whole slide image
Citation: Yan H-y, Shen X-p, Tao P-p, Jin L, Zhang Y-l and Wang M (2025) Deep learning models for cervical cancer subtyping using whole slide images. Front. Oncol. 15:1574639. doi: 10.3389/fonc.2025.1574639
Received: 11 February 2025; Accepted: 19 November 2025; Revised: 27 August 2025;
Published: 04 December 2025.
Edited by:
Robert Fruscio, University of Milano Bicocca, ItalyReviewed by:
Shenghua Cheng, Southern Medical University, ChinaDevan Lakshmi, St. Joseph’s College of Engineering, India
Copyright © 2025 Yan, Shen, Tao, Jin, Zhang and Wang. This is an open-access article distributed under the terms of the Creative Commons Attribution License (CC BY). The use, distribution or reproduction in other forums is permitted, provided the original author(s) and the copyright owner(s) are credited and that the original publication in this journal is cited, in accordance with accepted academic practice. No use, distribution or reproduction is permitted which does not comply with these terms.
*Correspondence: Mei Wang, d2FuZ21laTA4MDNAMTI2LmNvbQ==
†These authors have contributed equally to this work