 Angela M. Mickle1,2
 Lisa H. Domenico3
 Jared J. Tanner4
 Ellen L. Terry2,3
 Josue Cardoso2Toni L. Glover5
 Staja Booker2,3
 Adriana Addison6
 Cesar E. Gonzalez6Cynthia S. Garvan7David Redden8Roland Staud9Burel R. Goodin6
 Roger B. Fillingim2
 Kimberly T. Sibille1,2,7*
- 1College of Medicine, Department of Physical Medicine and Rehabilitation, University of Florida, Gainesville, FL, United States
- 2College of Dentistry, Pain Research and Intervention Center of Excellence (PRICE), University of Florida, Gainesville, FL, United States
- 3College of Nursing, Department of Biobehavioral Nursing Science, University of Florida, Gainesville, FL, United States
- 4College of Public Health and Health Professionals, Department of Clinical and Health Psychology, University of Florida, Gainesville, FL, United States
- 5School of Nursing, Oakland University, Rochester, MI, United States
- 6Department of Psychology, College of Arts and Science, University of Birmingham Alabama, Birmingham, AL, United States
- 7College of Medicine, Department of Anesthesiology, University of Florida, Gainesville, FL, United States
- 8Department of Biostatistics, School of Public Health, University of Birmingham Alabama, Birmingham, AL, United States
- 9College of Medicine, Department of Rheumatology, University of Florida, Gainesville, FL, United States
Background and purpose: We and others have reported ethnic/race group differences in clinical pain, physical function, and experimental pain sensitivity. However, recent research indicates that with consideration for socioenvironmental factors, ethnicity/race differences become less or non-significant. Understanding of factors contributing to pain inequities are needed. Guided by the NIA and NIMHD Health Disparities Research Frameworks, we evaluate the contributions of environmental and behavioral factors on previously reported ethnic/race group differences in: (1) clinical pain, (2) physical function, and (3) experimental pain in individuals with knee pain.
Methods: Baseline data from Understanding of Pain and Limitations in Osteoarthritis Disease (UPLOAD) and UPLOAD-2 studies were analyzed. Participants were adults 45 to 85 years old who self-reported as non-Hispanic white (NHW) or black (NHB) with knee pain. A health assessment and quantitative sensory testing were completed. Sociodemographics, environmental, health, clinical and experimental pain, and physical functioning measures were included in nested regressions.
Results: Pooled data from 468 individuals, 57 ± 8 years of age, 63% women, and 53% NHB adults. As NHB adults were younger and reported greater socioenvironmental risk than the NHW adults, the term sociodemographic groups is used. With inclusion of recognized environmental and behavioral variables, sociodemographic groups remained a significant predictor accounting for <5% of the variance in clinical pain and physical function and <10% of variance in experimental pain.
Conclusion: The incorporation of environmental and behavioral factors reduced relationships between sociodemographic groups and pain-related outcomes. Pain sites, BMI, and income were significant predictors across multiple models. The current study adds to a body of research on the complex array of factors contributing to disparities in pain-related outcomes.
1. Introduction
It is currently estimated that over 116 million individuals within the United States live with chronic pain making it a leading cause of disability, loss of work productivity, and loss of participation in life activities (1, 2). It has been reported that under-represented ethnic/race groups are disproportionately affected by both the prevalence and deleterious impact of chronic pain conditions (3, 4). A plethora of research over the previous twenty years indicates that non-Hispanic black (NHB) individuals along with other ethnic/race groups experience greater clinical pain, functional limitations, and experimental pain compared to non-Hispanic white (NHW) individuals (5–11). However, recent studies suggest socioenvironmental factors may account for some of the previously reported ethnic/race group differences. As many observational studies have not been able to match study participants on relevant socioenvironmental factors, imbalances in the representation by different ethnic/race groups likely contributed to observed disparities (12).
Health outcomes are greatly influenced by environmental and sociocultural factors (13–18). Several initiatives are underway to better understand factors contributing to health disparities and to design interventions to improve outcomes. Healthy People 2030 objectives target social determinants of health to reduce disparities and improve overall health (19). Another effort in the pain research community is Antiracism in Pain (12, 20, 21). Additionally, two research frameworks are available. The NIA Health Disparities Research Framework was developed to improve the evaluation of and identify needs in aging and disparity research (22). The National Institute on Minority Health and Health Disparities Framework expanded on the NIA Framework by incorporating concepts from the socioecological model (23). The NIA Framework provides four levels of analysis and lists associated factors by topic and subtopic that are highly useful when trying to identify where a factor or measure aligns. The NIMHD Framework includes levels of influence and domains of influence which encompass and expand on the NIA Framework.
Our studies, Understanding of Pain and Limitations in Osteoarthritis Disease (UPLOAD) and UPLOAD-2, were designed to better understand the array of biopsychosocial factors contributing to ethnic/racial differences in pain-related outcomes in mid to older adults with knee pain with or at risk for knee osteoarthritis (OA). Across both studies, we have reported significant ethnic/race group differences in clinical pain and physical function (24–29) and experimental pain (24, 30–33). We have also shown ethnic/race group differences in factors associated with chronic pain including discrimination, pain catastrophizing, perceived stress, resilience, evening cortisol, nutritional supplement status, and sociodemographic factors (25, 26, 30, 34–42).
Aligning with the national initiatives underway, the purpose of our study is to investigate relationships between pain measures and environmental and behavioral factors as identified in the NIA and the NIMHD Health Disparities Research Frameworks. Working with combined and unduplicated data from the UPLOAD and UPLOAD-2 studies, the goal is to better understand the contribution of environmental and behavioral factors on the previously reported ethnic/race group differences in pain related measures. We aim to determine the contributions of environmental and behavioral factors specific to: (1) clinical pain, (2) physical function, and (3) experimental pain in mid to older adults with knee pain with or at risk for osteoarthritis.
2. Methods
2.1. Participants
Baseline data from two studies, UPLOAD and UPLOAD-2, were combined. Both are multi-site studies conducted at the University of Florida and the University of Alabama at Birmingham. Cross-sectional in design, the UPLOAD study was completed between January 2010 and October 2013 (n = 280). UPLOAD-2 is a prospective cohort study, which began in August 2015. Inclusion and exclusion criteria for both studies are described in detail (24, 34). The inclusion/exclusion criteria was the same for both studies. Participants were included if they were between the ages of 45 and 85 years and had knee pain for at least one month prior to screening. Participants were excluded from the primary studies if they: (1) had cognitive impairment; (2) used opioids on a daily basis; (3) were hospitalized for a psychiatric illness in the preceding year; (4) had a history of acute myocardial infarction, heart failure or uncontrolled hypertension (BP > 150/95 mm Hg); (5) had prosthetic knee replacements or other clinically significant surgery to the affected knee; (6) had peripheral neuropathy; and/or (7) had systemic diseases including rheumatoid arthritis, systemic lupus erythematosus or fibromyalgia. Pooled data included the cross-sectional baseline time points only combining identical measures. For both studies, participants were non-Hispanic black (NHB) and non-Hispanic white (NHW) community-dwelling adults between 45 and 85 years of age with knee pain consistent with or at risk for knee osteoarthritis (OA) as previously reported (24, 34). The University of Florida Institutional Review Board and the University of Alabama at Birmingham Institutional Review Board approved the studies and all participants provided informed consent. This manuscript follows the STROBE guidelines (43).
2.2. Procedures
Descriptions are limited to the procedures and measures relevant to address the study questions. Participants completed a baseline health assessment and a quantitative sensory testing session approximately one week apart. All participants who met inclusion/exclusion criteria who reported knee pain and completed the baseline health assessment were included. Participant characteristics of those screened but did not complete the baseline assessment were not collected. The measures below were selected from those available in both studies and align with the environmental and behavioral levels of analysis identified in the NIA and NIMHD Health Disparities Research Frameworks (22, 23). The studies did not include a sufficient number of measures to address sociocultural and biological levels of analysis and are not included in this investigation. Both studies used self-report measures to better understand the individual experiences of pain, function/disability and biobehavioral factors.
2.3. Measures
2.3.1. Baseline characteristics
Data included age, sex, ethnicity/race, and current comorbidities. Per National Institutes of Health guidelines, individuals self-reported their ethnicity/race. Comorbidities were identified from the following list of conditions: high blood pressure, heart disease, cancer, diabetes, asthma/breathing problems, kidney disease, thyroid problem, stroke, seizure, chronic pain, neurological disorder, depression, other mental health condition, or other health problem. Height and weight measurements were taken, and body mass index (BMI) calculated.
2.3.2.Environmental
2.3.2.1. Individual
Education was combined from six categories into three categories (1 = high school or less, 2 = some college/bachelor's degree, 3 = graduate degree). Employment status data was combined from seven categories into three categories (0 = not working, temporarily laid off, 1 = student, disabled, other, 2 = working, retired). Income was collected based on the following financial categories (1 = $0–$9,999, 2 = $10,000–$19,999, 3 = $20,000–$29,999, 4 = $30,000–$39,999, 5 = $40,000–$49,999, 6 = $50,000–$59,999, 7 = $60,000–$79,999, 8 = $80,000–$99,999, 9 = $100,000–$149,999, 10 = $150,000 or higher). Current health insurance status was dichotomous (0 = no, 1 = yes).
2.3.2.2. Community/ecological
The Area Deprivation Index (ADI) is a validated measure of objective socioeconomic status using 17 indicators such as housing, income, employment and education (44). The nine-digit zip code for each participant was used to identify the state (n = 466) and national (n = 466) level ADI. The Center for Disease Control Social Vulnerability Index (SVI) is another validated objective socioeconomic status using 15 indicators such as race/ethnicity, housing, employment and language (45). The census tract ID and county for each participant were used to assign the county SVI (n = 465) and census SVI (n = 422). A total of 44 participants provided a PO Box which was used as a proxy for SVI county. Two participants did not provide an address. Higher values on either index represent a worse social disadvantage. Due to the high correlation between ADI variables, spearman correlation was completed to select one variable. After correlation analysis, ADI national was most correlated with the outcomes of interest and included in the later analysis. Due to the homogeneity of participants living in the same county, the census SVI was used in the analysis rather than county SVI.
2.3.3. Behavioral
2.3.3.1. Perceived stress scale (PSS)
The PSS is a 14-item self-report questionnaire that measures perceived stress over the previous month using a five-point Likert scale from 0 = “Never” to 4 = “Very Often” (46). Total scores range from 0 to 40 with higher scores indicating greater perceived stress (n = 457). The PSS has been shown to have good internal consistency in previous research (α = 0.84–0.86) (46) with good consistency in our sample (α = 0.85).
2.3.3.2. Smoking status
Participants were asked if they smoked at least 100 cigarettes in their lifetime. If yes, whether they were current smokers or had quit (0 = never smoked, 1 = previous smoker, 2 = current smoker) (n = 463).
2.3.3.3. Life orientation test-revised (LOT-R)
The LOT-R is a 10-item self-report questionnaire that is a measure of optimism vs. pessimism (47). Items are rated on a 5-point Likert scale where 0 = “I disagree a lot” to 4 = “I agree a lot”. Scores range from 0 to 24 with higher scores indicating greater optimism (n = 462). The LOT-R has shown to have good internal consistency in previous research (α = 0.75) (48) and good consistency in our sample (α = 0.73).
2.3.3.4. Experience of discrimination (EOD)
The EOD is an 18-item self-report questionnaire that measures how often people feel they have experienced unfairness on the basis of race, ethnicity, gender, age, religion, physical appearance, sexual orientation, or other characteristics (49, 50). It contains nine settings of “yes” or “no” whether discrimination occurred and the number of times. Settings include school, job seeking, at work, seeking housing, getting medical care, in a store or restaurant, getting credit, on the street or public setting, with the police or in the courts. The other nine items ask on a day to day how often observed indicators occurred ranging from never, once, two or three times, or four or more times. Scores range from 10 to 60 with higher scores indicating greater lifetime discrimination (n = 459). The EOD has shown to have good internal consistency (α = 0.74 or greater), and test-re-test reliability coefficients (α = 0.70) in previous research and good consistency in our sample (α = 0.76)(50).
2.3.3.5. The multidimensional scale of perceived social support (MSPSS)
The MSPSS is a 12-item self-report measure that assesses an individual's perceived level of social support with family, friends, and significant others (51). Statements are rated on a 7-point Likert scale from 1 = “very strongly disagree” to 7 = “very strongly agree”. Scores range from 0 to 72 with higher scores indicating greater perceived level of support (n = 452). The MSPSS is one of the most extensively used social support measure and has shown high internal consistency (α = 0.88), and stability after three months (α = 0.85) in previous research and excellent consistency in our sample (α = 0.96) (52).
2.3.4. Clinical pain and physical function
2.3.4.1. Graded chronic pain scale (GCPS)
The GCPS is a self-report measure that assesses the severity of knee pain and the impact on daily activities over a 6-month period (53). The measure is comprised of two subscales. The characteristic pain intensity (CPI) (0–100 score) is calculated as the mean rating for current, worst and average pain from 0 to 10 where 0 = “no pain” and 10 = “pain as bad as it could be”. The disability score (0–100 score) is calculated as the mean rating for difficulty performing daily, social and work activities from 0 to 10 where 0 = “no change” to 10 = “extreme change”. Greater scores indicate higher pain intensity and greater physical disability (n = 466). The GCPS has demonstrated good internal consistency in previous research (α = 0.74) and the current sample (α = 0.84) (53).
2.3.4.2. Western Ontario and McMaster universities osteoarthritis index (WOMAC)
The WOMAC is a validated measure of clinical knee pain and functioning over the previous 48-hours on three sub-scales including pain (0–20 score), stiffness (0–8 score), and function (0–68) (54). Sub-scores are summed for a total score ranging from 0 to 96 with higher scores indicating worse physical pain, stiffness, and functioning. For this study, pain (n = 467) and function (n = 468) subscales were used. The WOMAC has demonstrated good internal consistency (α = 0.84–0.95) across several previous studies (55–57) and in the current sample (α = 0.91).
2.3.4.3. Pain sites
Participants were asked if they had pain on more days than not over the past three months based on bilateral areas including hands, arms, shoulders, neck, head/face, chest, stomach, upper back, lower back, knees, legs (other than knees), and/or feet/ankles (n = 468) (0–24 sites). Pain sites served as a covariate for pain severity in the model (58). Increasing number of pain sites has been linked to worse health outcomes and three or more pain sites is considered widespread pain (59, 60).
2.3.5. Experimental pain
2.3.5.1. Punctate temporal summation (hand and knee)
Punctate testing was conducted on the index knee and the back of the hand using a nylon monofilament calibrated to deliver a force of 300 grams (31). Participants were asked to provide a verbal pain rating of 0–100, where 0 = “no pain” and 100 = “the worst pain imaginable”, after a single contact of the monofilament. Then the participants were asked to provide a pain rating after a series of ten contacts delivered approximately one per second. The procedure was repeated twice at each location. Temporal summation (TS) was determined by subtracting the average pain rating of the series of ten contacts for each site minus the average of the single contact (n = 436).
3. Statistical methods
Data were checked for missingness, normality, and outliers. Chi-squared, Wilcoxon rank sum tests, or Spearman correlational tests were performed for all bivariate analyses between clinical pain (GCPS pain intensity, WOMAC pain), physical function (GCPS disability, WOMAC physical function), experimental pain (punctate TS) and environmental (education, employment, income, insurance, ADI, SVI) and behavioral (PSS, smoking, LOT-R, EOD, MSPSS) variables. Environmental and behavioral variables, except for health insurance, were significantly correlated with the outcome variables and were retained in the adjusted models. Multi-collinearity exclusion was set at 0.7. ADI National and SVI Census were associated at rho = 0.66 and retained.
Nested Linear Regression models were built with 3 sets of variables. Set 1 included environmental and behavioral variables including income, employment status, education level, ADI National, SVI Census, smoking history, LOT-R, EOD, MSPSS and PSS. Set 2 included the same measures with the additional explanatory variables including age, sex, income, number of pain sites, total comorbidities, and BMI. Finally, set 3 included all variables from set 2 and indicator variables for sociodemographic groups, NHB adults with low sociodemographic resources and NHW adults with high sociodemographic resources. All statistics were completed using SAS v9.4 (SAS Institute, Cary, North Carolina, United States). All tests were considered statistically significant at a 0.05 level of significance.
4. Results
4.1. Study sample
The sample included 468 individuals, 57.3 ± 7.7 years of age, 63.0% women, and 52.8% NHB participants. NHB participants were younger, had a higher BMI, reported significantly lower income, education, and employment status compared to NHW participants. Due to the significant sociodemographic differences between the NHB and NHW participants, only a subgroup for each are represented, ethnic/race group interpretations would be inaccurate. Therefore, we use the term sociodemographic group when reporting findings. Descriptive information is provided in Table 1.

Table 1. Study sample.
4.2. Clinical pain
Combined, environmental and behavioral factors explained 22.3% of the GCPS CPI and 16.2% of the WOMAC pain (Table 2). Covariates accounted for an additional 8.0% of the GCPS CPI and 9.3% of the WOMAC pain. Sociodemographic group accounted for an additional 5.0% variance of the GCPS CPI and 1.0% of the WOMAC pain. In the final model, lower income, social vulnerability index, perceived social support, sociodemographic resources, greater number of pain sites and BMI were significantly associated with higher GCPS CPI. Lower income, employment status, social vulnerability index, sociodemographic resources, greater number of pain sites and BMI were significantly associated with higher WOMAC pain.
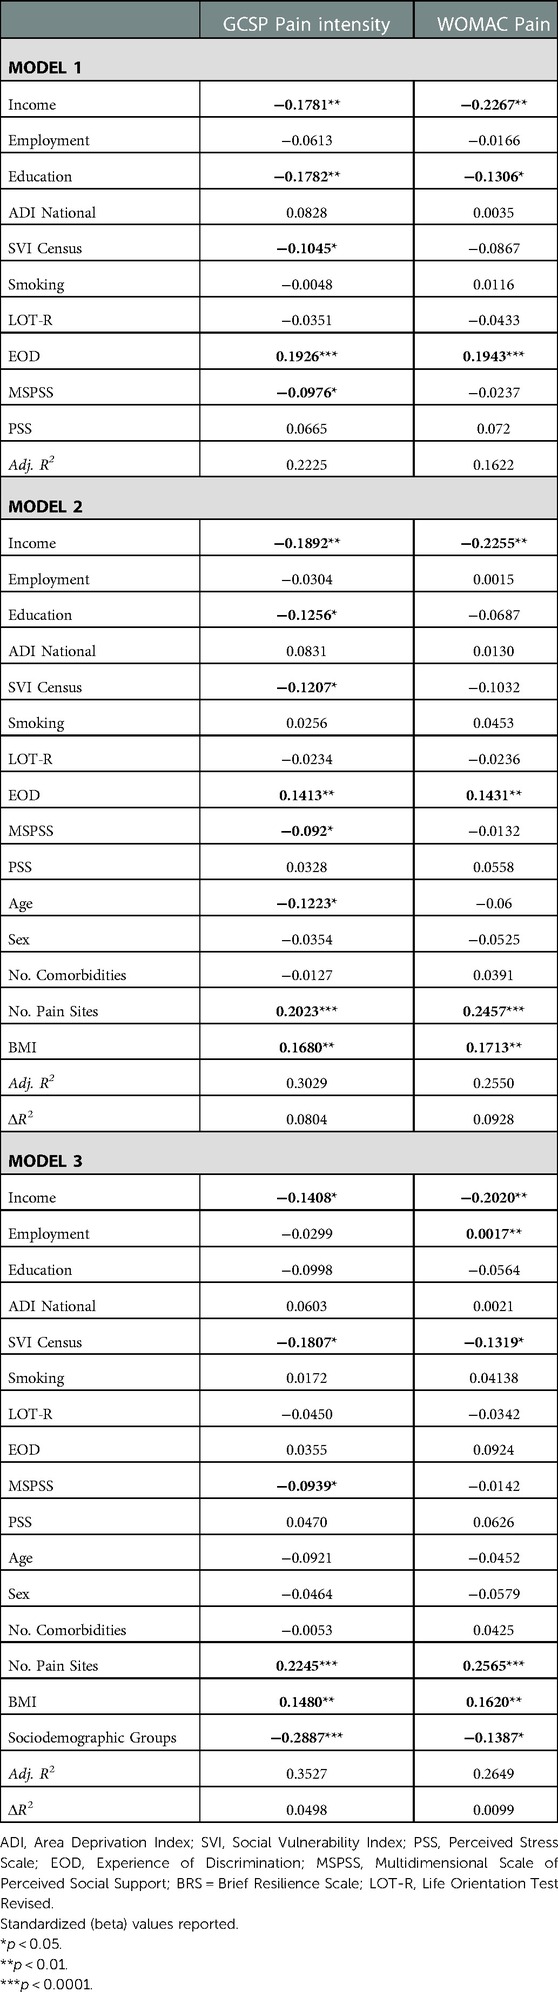
Table 2. Nested linear regression models assessing environmental and behavioral factors on clinical pain.
4.3. Physical function
Environmental and behavioral factors explained 18.5% of the GCPS disability and 18.8% of the WOMAC function (Table 3). Covariates explained an additional 6.8% of the GCPS disability and 8.9% WOMAC function. Sociodemographic group accounted for an additional 1.4% variance in GCPS disability and 1.3% of variance in WOMAC function. In the final model, greater perceived stress, number of pain sites, BMI and lower sociodemographic resources were associated with higher GCPS disability. Lower income, social vulnerability index, sociodemographic resources, greater experience of discrimination, perceived stress, number of pain sites, and BMI were associated with worse WOMAC function.
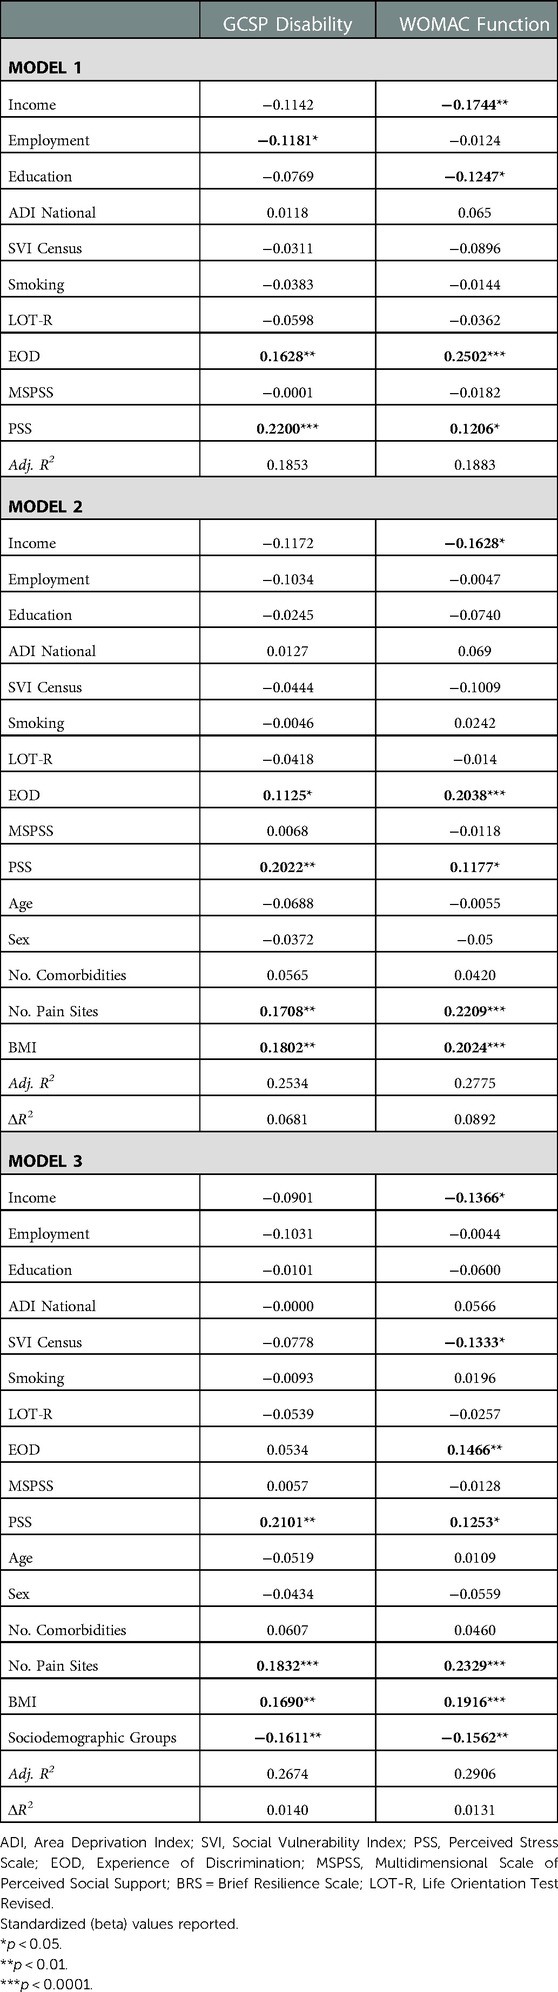
Table 3. Nested linear regression models assessing environmental and behavioral factors on physical function.
4.4. Experimental pain
Environmental and behavioral factors explained 1.6% of the variance of punctate temporal summation (TS) at the knee and 3.2% of the variance at the hand (Table 4). Covariates explained an additional 3.6% of variance for TS at knee and 0.3% at the hand. Sociodemographic groups accounted for an additional 5.7% variance at the knee and 9.6% variance at the hand. In the final model, higher age, female sex and lower sociodemographic resources were associated with punctate TS at the knee. In the final model, only lower sociodemographic resources were associated with punctate TS at the hand.
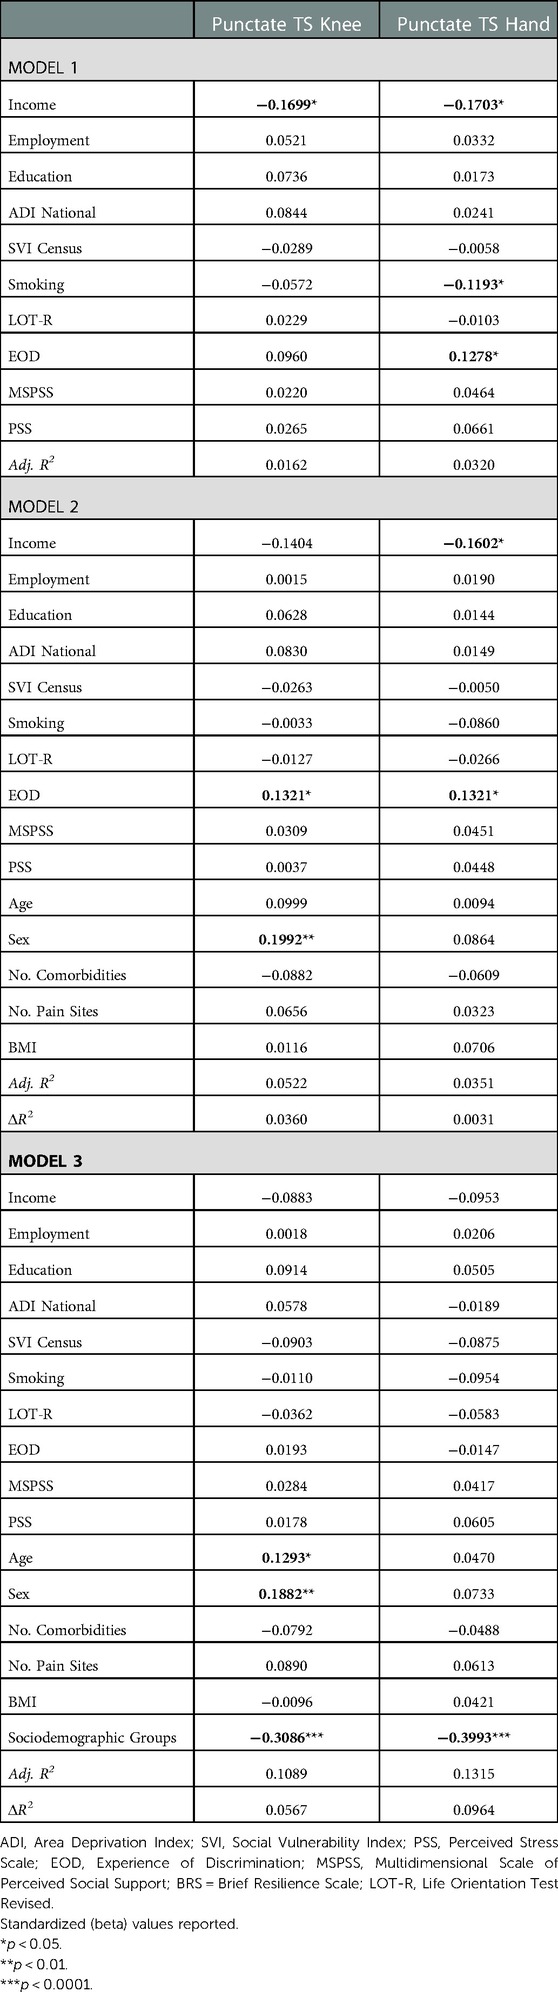
Table 4. Nested linear regression models assessing environmental and behavioral factors on experimental pain.
5. Discussion
The purpose of our study was to investigate factors that may contribute to previously reported ethnic/race group differences in pain-related outcomes. Based on available measures in the UPLOAD and UPLOAD-2 studies, we evaluated the contributions of environmental and behavioral factors as defined by the NIA and NIMHD Health Disparities Research Frameworks specific to 1) clinical pain, 2) physical function, and 3) experimental pain in mid to older adults with knee pain with or at risk for OA. The NHB and NHW participants differed significantly across numerous sociodemographic variables. As only subgroups from each ethnic/race group were represented, ethnic/race groups comparisons were not interpretable and the term sociodemographic groups is used. Our findings indicate that the inclusion of environmental and behavioral factors improved the models and reduced the variance observed between sociodemographic groups and the outcome measures. Additionally, pain sites, BMI, and income were predictive across several models. The current study provides initial findings in the development of an improved understanding of the complex array of factors contributing to previously reported ethnic/race group differences, a critical first step in addressing health disparities (61).
5.1. Clinical pain
Although investigations of environmental and sociocultural influences on clinical pain are not new, the body of findings have not shifted the general perception of ethnic/race group differences. However, evidence is building frequently showing environmental and sociocultural factors account for previously reported ethnic/race group differences (62, 63). Limited by available measures, our findings align with the growing body of research showing that environmental and behavioral factors with inclusion of known covariates explained 22 to 26% of the variance observed in clinical pain with sociodemographic groups adding only an additional 1 to 5%. Surprisingly, although the ADI national and SVI census show a positive correlation (rho = 0.66) and patterns are consistent with other environmental measures, the SVI census had a negative and significant association with the GCPS CPI and both measures of WOMAC. Mirroring our observed patterns, a recent population study by Zajacova and colleagues (2022), working with 2010–2018 data from the National Health Interview Survey, investigated pain prevalence across primary U.S. race groups with consideration for demographic and socioeconomic factors. Among an array of findings, investigators found black adults experience more severe clinical pain and lower prevalence of less severe pains than white adults. However, after accounting for SES and other covariates, black adults experienced significantly lower levels of severe pain than white adults (64). A second cross-sectional study with the 2019 data from the National Health Interview Survey essentially replicated prior findings with lower educational attainment predictive of higher odds of chronic pain and lower odds of effective pain management (65). Thus, consideration of environmental and sociocultural factors is not only conveying a reduction in previously indicated ethnic/race group differences, but a pattern of findings is developing elucidating which factors are the greater contributors to pain related disparities.
5.2. Physical function
Many self-report pain questionnaires include physical function questions, thus physical function is frequently included as an outcome with clinical pain. Not surprisingly, our physical function findings were similar to those for clinical pain. Environmental and behavioral factors with inclusion of known covariates explained 25 to 26% of the variance observed in physical function with sociodemographic groups adding only an additional 1% of explanatory value. Performance based physical function with consideration for environmental and sociocultural factors is further informative. Clay and colleagues compared the Short Performance Physical Battery (SPPB) in older NHW and NHB men with consideration for sociodemographic factors. NHB men had significantly lower SPPB performance (66). Cognitive functioning was the strongest predictor of physical performance. The study was bolstered by a large sample size and approximately equal number of participants for both groups. However, the groups were not balanced on sociodemographic and health related factors with the NHB having the greatest sociodemographic and health related risk factors. Thus, ethnicity/race differences need to be interpreted with caution. A number of studies have evaluated sociodemographic factors, housing conditions, and physical function using the SPPB (67–69). Addressing the sociodemographic and environmental group disparities in prior studies, Thorpe and colleagues analyzed data from NHB and NHW adults with similar socioeconomic and community backgrounds. Findings indicated the NHW adults had lower physical function than NHB adults (70). Progress is underway toward disentangling the complex array of factors contributing to previously reported ethnic/race group physical function disparities.
5.3. Experimental pain
Previous research on ethnic/race group differences in experimental pain have mirrored clinical pain and physical functioning findings (10). In the current study, environmental and behavioral factors and covariates accounted for less of the variance in punctate TS with sociodemographic groups explaining <10% of the variance. Cautions are warranted regarding comparisons with the meta-analysis cited as the UPLOAD findings were included multiple times in some categories (10). Ethnic/race group differences in nociceptive sensitivity have also been reported in individuals without chronic pain (71–73). Losin and colleagues found however, the difference in sensitivity in pain free NHB compared to Hispanic and NHW adults was not in brain-related nociceptive areas but frontostriatal activation associated with pain rating, discrimination, trust, and other external factors (74). Relationships between experimental pain and marital status have been reported (75). Additionally, income satisfaction accounted for differences observed in morning waking cortisol and morning waking slope (40). Further, socioeconomic status influences brain functional networks and anatomy (76, 77). Thus, as socioenvironmental stress gets “under the skin,” life experiences and chronic stress alter physiological systems, including nociceptive sensitivity (78, 79).
5.4. Additional considerations
First, research moving forward should consider if ethnic/race groups are similar based on sociodemographic factors. When groups significantly differ on relevant sociodemographic resources, a complete representation of either group has not been obtained. Inclusion of the imbalanced variables as a covariate in modeling does not “balance” the groups. Thus, ethnic/race group interpretations would be misleading. Reporting findings with consideration for various sociodemographic variables aligns with the concept of “intersectionality” (80, 81). For example, a sample description might be older, lower sociodemographic resources, NHB group compared to a younger, greater sociodemographic resources, NHW group. Such specificity will improve interpretability of findings and comparisons across studies. Second, studies with larger sample sizes of underrepresented groups are needed (7). Third, much of the existing research investigating differences in pain experiences between ethnic/race groups has focused on identifying and examining behavioral factors, with fewer studies evaluating environmental and sociocultural factors and the combination of factors across different levels of analysis (7). Fourth, two Health Disparities Research Frameworks have been developed (22, 23). Researchers, funders, and reviewers have the opportunity to combine efforts and promote the similarities between the two models, forging ahead together collaboratively to move the science forward expediently with the intention of reducing disparate outcomes in under-represented ethnic/race groups.
5.5. Strengths, limitations, and future directions
This study has many notable strengths. This study includes a large sample of community-dwelling mid to older adults with knee pain. Second, we measured clinical pain, physical function, and experimental pain. Third, the studies included different levels of analysis (environmental and behavioral) and different levels of influence (individual and ecological data). There are also limitations to acknowledge. First, environmental and behavioral factors were limited to the data available in the datasets. There may be other measures that better capture the factors addressed and extend beyond the measures included in this study. Additionally, future research, including investigations of the role of sociocultural factors are needed. Second, improved collection of environmental data are needed. Employment and insurance status measures were nominal in nature. Also, improved measures of income that take into consideration cumulative household finances and number of members would be more informative. Additionally, community/ecological variables are helpful however, we observed varied direction between the ADI and SVI measures and significance between the SVI and clinical pain and function in an unanticipated direction. Further research is needed to better understand how to incorporate community level measures in studies investigating health-related outcomes. Third, many of the questionnaires are specific to short time periods. Studies show that childhood stressors such as income inequality may have long lasting negative consequences for adult health (82). Finally, as the NHW and NHB participants differed significantly on multiple sociodemographic factors, interpretability and generalizability are limited.
6. Conclusion
There are a plethora of publications reporting ethnic/race group differences in pain-related experiences. To address the observed disparities, contributing factors need to be identified. Research across health conditions including pain show that with consideration for environmental and sociodemographic factors, ethnic/race differences are reduced or eliminated (62–65, 70, 83, 84). Our findings indicate a combined consideration of environmental and behavioral factors explained a significant proportion of variance in clinical pain, physical function and some of the variance for experimental pain. Although sociodemographic group differences remained, inclusion of the environmental and behavioral variables helped elucidate factors contributing to disparities in pain-related outcomes. An improved understanding of the complex array of factors contributing to health disparities is needed in advance of initiatives to improve health outcomes.
Data availability statement
The raw data supporting the conclusions of this article will be made available by the authors, without undue reservation.
Ethics statement
The studies involving human participants were reviewed and approved by University of Florida, University of Alabama at Birmingham. The patients/participants provided their written informed consent to participate in this study.
Author contributions
All individuals listed in the author byline, made significant contributions toward the conceptualization and development of the manuscript. AMM contributed toward writing the Introduction, Methods, and Results sections; developing the tables, and completing the statistical analyses. LHD contributed toward conceptualization, data analysis plan and the Discussion. JJT was involved in analysis plan and conducting the statistical analyses. ELT contributed to data acquisition and study design. JC contributed to data acquisition and dataset development. TLG contributed to data acquisition, study design, oversight of participant safety for UPLOAD and UPLOAD-2. SB contributed to UPLOAD-2 data acquisition and data analyses. JAA contributed to data acquisition for UPLOAD and UPLOAD-2. CG contributed to data acquisition for the UPLOAD-2. DR contributed to oversite of UPLOAD and UPLOAD-2 data acquisition and analyses. CG contributed to the development of the data analysis plan. RS contributed to the UPLOAD and UPLOAD-2 study design, methodology and oversight of participant safety. BRG contributed to study designs and served as UPLOAD Co-I and UPLOAD-2 UAB PI. RF served as the PI for UPLOAD and UPLOAD-2 projects. KTS served as Co-I and PI for components of the UPLOAD and UPLOAD-2 studies. She provided oversite and guidance to manuscript conceptualization, development, and contributed to all sections of the manuscript particularly the Introduction and Discussion. All authors contributed to the article and approved the submitted version.
Funding
The UPLOAD study was funded and supported by the National Institute on Aging R01AG054370, National Institute of Arthritis and Musculoskeletal and Skin Diseases K23AR062099, the University of Florida Clinical and Translational Science Institute UL1TR000064, the University of Alabama at Birmingham Center for Clinical and Translational Science UL1TR003096. The UPLOAD-2 study was funded and supported by NIA Grants R37AG033906 and R01AG054370, UF CTSA Grant UL1TR001427, UAB CTSA Grant UL1TR001417 and NINDS K22NS102334. The content of this manuscript is solely the responsibility of the authors and does not necessarily represent the official views of the National Institutes of Health.
Acknowledgments
We greatly appreciate the funding that has supported our research efforts over the years, the assistance of the UF and UAB CTSI nurses, and the UPLOAD and UPLOAD-2 Research Teams and participants at UF and UAB. An additional thank you is extended to Brittany Addison for her informative and helpful literature review efforts.
Conflict of interest
The authors declare that the research was conducted in the absence of any commercial or financial relationships that could be construed as a potential conflict of interest.
Publisher's note
All claims expressed in this article are solely those of the authors and do not necessarily represent those of their affiliated organizations, or those of the publisher, the editors and the reviewers. Any product that may be evaluated in this article, or claim that may be made by its manufacturer, is not guaranteed or endorsed by the publisher.
References
1. Hunter DJ, Bierma-Zeinstra S. Osteoarthritis. Lancet. (2019) 393(10182):1745–59. doi: 10.1016/S0140-6736(19)30417-9
2. Barbour KE, Moss S, Croft JB, Helmick CG, Theis KA, Brady TJ, et al. Geographic variations in arthritis prevalence, health-related characteristics, and management — united States, 2015. MMWR Surveill Summ. (2018) 67(No. SS-4):1–28. doi: 10.15585/mmwr.ss6704a1
3. Deshpande BR, Katz JN, Solomon DH, Yelin EH, Hunter DJ, Messier SP, et al. Number of persons with symptomatic knee osteoarthritis in the US: impact of race and ethnicity, age, sex, and obesity. Arthritis Care Res (Hoboken). (2016) 68(12):1743–50. doi: 10.1002/acr.22897
4. Barbour KE, Boring M, Helmick CG, Murphy LB, Qin J. Prevalence of severe joint pain among adults with doctor-diagnosed arthritis - United States, 2002-2014. MMWR Morb Mortal Wkly Rep. (2016) 65(39):1052–6. doi: 10.15585/mmwr.mm6539a2
5. Campbell CM, Edwards RR. Ethnic differences in pain and pain management. Pain Manag. (2012) 2(3):219–30. doi: 10.2217/pmt.12.7
6. Vaughn IA, Terry EL, Bartley EJ, Schaefer N, Fillingim RB. Racial-Ethnic differences in osteoarthritis pain and disability: a meta-analysis. J Pain. (2019) 20(6):629–44. doi: 10.1016/j.jpain.2018.11.012
7. Patel M, Johnson AJ, Booker SQ, Bartley EJ, Palit S, Powell-Roach K, et al. Applying the NIA health disparities research framework to identify needs and opportunities in chronic musculoskeletal pain research. J Pain. (2022) 23(1):25–44. doi: 10.1016/j.jpain.2021.06.015
8. Burnight T, Uysal A, Lu Q. Ethnic differences in experimental pain perception. J Pain. (2011) 12(4):84. doi: 10.1016/j.jpain.2011.02.343
9. Ahn H, Weaver M, Lyon DE, Kim J, Choi E, Staud R, et al. Differences in clinical pain and experimental pain sensitivity between Asian Americans and whites with knee osteoarthritis. Clin J Pain. (2017) 33(2):174–80. doi: 10.1097/AJP.0000000000000378
10. Kim HJ, Yang GS, Greenspan JD, Downton KD, Griffith KA, Renn CL, et al. Racial and ethnic differences in experimental pain sensitivity: systematic review and meta-analysis. Pain. (2017) 158(2):194–211. doi: 10.1097/j.pain.0000000000000731
11. Kim HJ, Greenspan JD, Ohrbach R, Fillingim RB, Maixner W, Renn CL, et al. Racial/ethnic differences in experimental pain sensitivity and associated factors - cardiovascular responsiveness and psychological status. PLoS One. (2019) 14(4):e0215534. doi: 10.1371/journal.pone.0215534
12. Letzen JE, Mathur VA, Janevic MR, Burton MD, Hood AM, Morais CA, et al. Confronting racism in all forms of pain research: reframing study designs. J Pain. (2022) 23(6):893–912. doi: 10.1016/j.jpain.2022.01.010
13. Adler NE, Newman K. Socioeconomic disparities in health: pathways and policies. Health Aff. (2002) 21(2):60–76. doi: 10.1377/hlthaff.21.2.60
14. Chen E, Miller GE. Socioeconomic status and health: mediating and moderating factors. Annu Rev Clin Psychol. (2013) 9:723–49. doi: 10.1146/annurev-clinpsy-050212-185634
15. Jones NL, Gilman SE, Cheng TL, Drury SS, Hill CV, Geronimus AT. Life course approaches to the causes of health disparities. Am J Public Health. (2019) 109(S1):S48–55. doi: 10.2105/AJPH.2018.304738
16. Louie GH, Ward MM. Socioeconomic and ethnic differences in disease burden and disparities in physical function in older adults. Am J Public Health. (2011) 101(7):1322–9. doi: 10.2105/AJPH.2010.199455
17. Craig KD, Holmes C, Hudspith M, Moor G, Moosa-Mitha M, Varcoe C, et al. Pain in persons who are marginalized by social conditions. Pain. (2020) 161(2):261–5. doi: 10.1097/j.pain.0000000000001719
18. Eachus J, Chan P, Pearson N, Propper C, Davey Smith G. An additional dimension to health inequalities: disease severity and socioeconomic position. J Epidemiol Community Health. (1999) 53(10):603–11. doi: 10.1136/jech.53.10.603
19. ODPHP. Healthy People 2030 (2021). Available at: https://health.gov/healthypeople/objectives-and-data/browse-objectives
20. Morais CA, Aroke EN, Letzen JE, Campbell CM, Hood AM, Janevic MR, et al. Confronting racism in pain research: a call to action. J Pain. (2022) 23(6):878–92. doi: 10.1016/j.jpain.2022.01.009
21. Hood AM, Booker SQ, Morais CA, Goodin BR, Letzen JE, Campbell LC, et al. Confronting racism in all forms of pain research: a shared commitment for engagement, diversity, and dissemination. J Pain. (2022) 23(6):913–28. doi: 10.1016/j.jpain.2022.01.008
22. Hill CV, Perez-Stable EJ, Anderson NA, Bernard MA. The national institute on aging health disparities research framework. Ethn Dis. (2015) 25(3):245–54. doi: 10.18865/ed.25.3.245
23. Alvidrez J, Castille D, Laude-Sharp M, Rosario A, Tabor D. The national institute on minority health and health disparities research framework. Am J Public Health. (2019) 109(S1):S16–20. doi: 10.2105/AJPH.2018.304883
24. Cruz-Almeida Y, Sibille KT, Goodin BR, Petrov ME, Bartley EJ, Riley JL 3rd, et al., Racial and ethnic differences in older adults with knee osteoarthritis. Arthritis Rheumatol. (2014) 66(7):1800–10. doi: 10.1002/art.38620
25. Thompson KA, Terry EL, Sibille KT, Gossett EW, Ross EN, Bartley EJ, et al. At the intersection of ethnicity/race and poverty: knee pain and physical function. J Racial Ethn Health Disparities. (2019) 6(6):1131–43. doi: 10.1007/s40615-019-00615-7
26. Terry EL, Fullwood MD, Booker SQ, Cardoso JS, Sibille KT, Glover TL, et al. Everyday discrimination in adults with knee pain: the role of perceived stress and pain catastrophizing. J Pain Res. (2020) 13:883–95. doi: 10.2147/JPR.S235632
27. Johnson AJ, Vasilopoulos T, Booker SQ, Cardoso J, Terry EL, Powell-Roach K, et al. Knee pain trajectories over 18 months in non-hispanic black and non-hispanic white adults with or at risk for knee osteoarthritis. BMC Musculoskelet Disord. (2021) 22(1):415. doi: 10.1186/s12891-021-04284-8
28. Booker S, Cardoso J, Cruz-Almeida Y, Sibille KT, Terry EL, Powell-Roach KL, et al. Movement-evoked pain, physical function, and perceived stress: an observational study of ethnic/racial differences in aging non-hispanic blacks and non-hispanic whites with knee osteoarthritis. Exp Gerontol. (2019) 124:110622. doi: 10.1016/j.exger.2019.05.011
29. Johnson AJ, Sibille KT, Cardoso J, Terry EL, Powell-Roach KL, Goodin B, et al. Patterns and correlates of self-management strategies for osteoarthritis-related pain among older non-hispanic black and non-hispanic white adults. Arthritis Care Res (Hoboken). (2021) 73(11):1648–58. doi: 10.1002/acr.24396
30. Glover TL, Goodin BR, Horgas AL, Kindler LL, King CD, Sibille KT, et al. Vitamin D, race, and experimental pain sensitivity in older adults with knee osteoarthritis. Arthritis Rheum. (2012) 64(12):3926–35. doi: 10.1002/art.37687
31. Goodin BR, Bulls HW, Herbert MS, Schmidt J, King CD, Glover TL, et al. Temporal summation of pain as a prospective predictor of clinical pain severity in adults aged 45 years and older with knee osteoarthritis: ethnic differences. Psychosom Med. (2014) 76(4):302–10. doi: 10.1097/PSY.0000000000000058
32. Petrov ME, Goodin BR, Cruz-Almeida Y, King C, Glover TL, Bulls HW, et al. Disrupted sleep is associated with altered pain processing by sex and ethnicity in knee osteoarthritis. J Pain. (2015) 16(5):478–90. doi: 10.1016/j.jpain.2015.02.004
33. Riley JL 3rd, Cruz-Almeida Y, Glover TL, King CD, Goodin BR, Sibille KT, et al. Age and race effects on pain sensitivity and modulation among middle-aged and older adults. J Pain. (2014) 15(3):272–82. doi: 10.1016/j.jpain.2013.10.015
34. Bartley EJ, Hossain NI, Gravlee CC, Sibille KT, Terry EL, Vaughn IA, et al. Race/ethnicity moderates the association between psychosocial resilience and movement-evoked pain in knee osteoarthritis. ACR Open Rheumatology. (2019) 1(1):16–25. doi: 10.1002/acr2.1002
35. Terry EL, Tanner JJ, Cardoso JS, Sibille KT, Lai S, Deshpande H, et al. Associations of pain catastrophizing with pain-related brain structure in individuals with or at risk for knee osteoarthritis: sociodemographic considerations. Brain Imaging Behav. (2020) 15(4):1769–77. doi: 10.1007/s11682-020-00372-w
36. Tanner JJ, Cardoso J, Terry EL, Booker SQ, Glover TL, Garvan C, et al. Chronic pain severity and sociodemographics: an evaluation of the neurobiological interface. J Pain. (2021) 23(2):248–62. doi: 10.1016/j.jpain.2021.07.010
37. Fullwood D, Gomez RN, Huo Z, Cardoso JS, Bartley EJ, Booker SQ, et al. A mediation appraisal of catastrophizing, pain-related outcomes, and race in adults with knee osteoarthritis. J Pain. (2021) 22(11):1452–66. doi: 10.1016/j.jpain.2021.04.018
38. Tanner JJ, Hanchate S, Price CC, Garvan C, Lai S, Staud R, et al. Relationships between chronic pain stage, cognition, temporal lobe Cortex, and sociodemographic variables. J Alzheimer's Dis. (2021) 80(4):1539–51. doi: 10.3233/JAD-201345
39. Tanner JJ, Johnson AJ, Terry EL, Cardoso J, Garvan C, Staud R, et al. Resilience, pain, and the brain: relationships differ by sociodemographics. J Neurosci Res. (2021) 99(5):1207–35. doi: 10.1002/jnr.24790
40. Mickle AM, Garvan C, Service C, Pop R, Marks J, Wu S, et al. Relationships between pain, life stress, sociodemographics, and cortisol: contributions of pain intensity and financial satisfaction. Chronic Stress. (2020) 4:2470547020975758. doi: 10.1177/2470547020975758
41. Goodin BR, Pham QT, Glover TL, Sotolongo A, King CD, Sibille KT, et al. Perceived racial discrimination, but not mistrust of medical researchers, predicts the heat pain tolerance of African Americans with symptomatic knee osteoarthritis. Health Psychol. (2013) 32(11):1117–26. doi: 10.1037/a0031592
42. Sibille KT, King C, Garrett TJ, Glover TL, Zhang H, Chen H, et al. Omega-6: omega-3 PUFA ratio, pain, functioning, and distress in adults with knee pain. Clin J Pain. (2018) 34(2):182–9. doi: 10.1097/AJP.0000000000000517
43. Cuschieri S. The STROBE guidelines. Saudi J Anaesth. (2019) 13(Suppl 1):S31–S4. doi: 10.4103/sja.SJA_543_18
44. Kind AJH, Buckingham WR. Making neighborhood-disadvantage metrics accessible — the neighborhood atlas. N Engl J Med. (2018) 378(26):2456–8. doi: 10.1056/NEJMp1802313
45. Flanagan BE, Gregory EW, Hallisey EJ, Heitgerd JL, Lewis B. A social vulnerability Index for disaster management. J Homel Secur Emerg Manag. (2011) 8(1):1–24. doi: 10.2202/1547-7355.1792
46. Cohen S, Kamarck T, Mermelstein R. A global measure of perceived stress. J Health Soc Behav. (1983) 24(4):385–96. doi: 10.2307/2136404
47. Scheier MF, Carver CS, Bridges MW. Distinguishing optimism from neuroticism (and trait anxiety, self-mastery, and self-esteem): a reevaluation of the life orientation test. J Pers Soc Psychol. (1994) 67(6):1063–78. doi: 10.1037/0022-3514.67.6.1063
48. Schou-Bredal I, Heir T, Skogstad L, Bonsaksen T, Lerdal A, Grimholt T, et al. Population-based norms of the life orientation test-revised (LOT-R). Int J Clin Health Psychol. (2017) 17(3):216–24. doi: 10.1016/j.ijchp.2017.07.005
49. Krieger N. Racial and gender discrimination: risk factors for high blood pressure? SocSciMed. (1990) 30(12):1273–81. doi: 10.1016/j.socscimed.2005.03.006
50. Krieger N, Smith K, Naishadham D, Hartman C, Barbeau EM. Experiences of discrimination: validity and reliability of a self-report measure for population health research on racism and health. Soc Sci Med. (2005) 61(7):1576–96. doi: 10.1016/j.socscimed.2005.03.006
51. Zimet GD, Dahlem NW, Zimet SG, Farley GK. The multidimensional scale of perceived social support. J Pers Assess. (1988) 52(1):30–41. doi: 10.1207/s15327752jpa5201_2
52. Dambi JM, Corten L, Chiwaridzo M, Jack H, Mlambo T, Jelsma J. A systematic review of the psychometric properties of the cross-cultural translations and adaptations of the multidimensional perceived social support scale (MSPSS). Health Qual Life Outcomes. (2018) 16(1):80. doi: 10.1186/s12955-018-0912-0
53. Von Korff M, Ormel J, Keefe FJ, Dworkin SF. Grading the severity of chronic pain. Pain. (1992) 50(2):133–49. doi: 10.1016/0304-3959(92)90154-4
54. Bellamy N, Buchanan WW, Goldsmith CH, Campbell J, Stitt LW. Validation study of WOMAC: a health status instrument for measuring clinically important patient relevant outcomes to antirheumatic drug therapy in patients with osteoarthritis of the hip or knee. J Rheumatol. (1988) 15(12):1833–40.3068365
55. Basaran S, Guzel R, Seydaoglu G, Guler-Uysal F. Validity, reliability, and comparison of the WOMAC osteoarthritis index and lequesne algofunctional index in turkish patients with hip or knee osteoarthritis. Clin Rheumatol. (2010) 29(7):749–56. doi: 10.1007/s10067-010-1398-2
56. Bruce B, Fries J. Longitudinal comparison of the health assessment questionnaire (HAQ) and the western Ontario and McMaster universities osteoarthritis Index (WOMAC). Arthritis Care Res (Hoboken). (2004) 51(5):730–7. doi: 10.1002/art.20695
57. Stratford PW, Kennedy DM, Woodhouse LJ, Spadoni GF. Measurement properties of the WOMAC LK 3.1 pain scale. Osteoarthritis Cartilage. (2007) 15(3):266–72. doi: 10.1016/j.joca.2006.09.005
58. Macfarlane GJ, Barnish MS, Jones GT. Persons with chronic widespread pain experience excess mortality: longitudinal results from UK biobank and meta-analysis. Ann Rheum Dis. (2017) 76(11):1815–22. doi: 10.1136/annrheumdis-2017-211476
59. Mose S, Kent P, Smith A, Andersen JH, Christiansen DH. Number of musculoskeletal pain sites leads to increased long-term healthcare contacts and healthcare related costs – a danish population-based cohort study. BMC Health Serv Res. (2021) 21(1):980. doi: 10.1186/s12913-021-06994-0
60. Wolfe F, Butler SH, Fitzcharles M, Häuser W, Katz RL, Mease PJ, et al. Revised chronic widespread pain criteria: development from and integration with fibromyalgia criteria. Scand J Pain. (2019) 20(1):77–86. doi: 10.1515/sjpain-2019-0054
61. National Academies of Sciences E, Medicine, National Academy of M, Committee on the Future of Nursing. In: Flaubert JL, Le Menestrel S, Williams DR, Wakefield MK, editors. The future of nursing 2020-2030: Charting a path to achieve health equity. Washington (DC): National Academies Press (US) Copyright 2021 by the National Academy of Sciences. All rights reserved (2021). p. 31–51.
62. Grol-Prokopczyk H. Sociodemographic disparities in chronic pain, based on 12-year longitudinal data. Pain. (2017) 158(2):313–22. doi: 10.1097/j.pain.0000000000000762
63. Janevic MR, McLaughlin SJ, Heapy AA, Thacker C, Piette JD. Racial and socioeconomic disparities in disabling chronic pain: findings from the health and retirement study. J Pain. (2017) 18(12):1459–67. doi: 10.1016/j.jpain.2017.07.005
64. Zajacova A, Grol-Prokopczyk H, Fillingim R. Beyond black vs white: racial/ethnic disparities in chronic pain including hispanic, Asian, native American, and multiracial US adults. Pain. (2022) 163(9):1688–99. doi: 10.1097/j.pain.0000000000002574
65. Mullins PM, Yong RJ, Bhattacharyya N. Impact of demographic factors on chronic pain among adults in the United States. Pain Rep. (2022) 7(4):e1009. doi: 10.1097/PR9.0000000000001009
66. Clay OJ, Thorpe RJ Jr., Wilkinson LL, Plaisance EP, Crowe M, Sawyer P, et al. An examination of lower extremity function and its correlates in older African American and white men. Ethn Dis. (2015) 25(3):271–8. doi: 10.18865/ed.25.3.271
67. García-Esquinas E, Pérez-Hernández B, Guallar-Castillón P, Banegas JR, Ayuso-Mateos JL, Rodríguez-Artalejo F. Housing conditions and limitations in physical function among older adults. J Epidemiol Community Health. (2016) 70(10):954–60. doi: 10.1136/jech-2016-207183
68. Kowitt SD, Aiello AE, Callahan LF, Fisher EB, Gottfredson NC, Jordan JM, et al. How are neighborhood characteristics associated with mental and physical functioning among older adults with radiographic knee osteoarthritis? Arthritis Care Res (Hoboken). (2021) 73(3):308–17. doi: 10.1002/acr.24125
69. Samuel LJ, Glass TA, Thorpe RJ Jr., Szanton SL, Roth DL. Household and neighborhood conditions partially account for associations between education and physical capacity in the national health and aging trends study. Soc Sci Med. (2015) 128:67–75. doi: 10.1016/j.socscimed.2015.01.009
70. Thorpe RJ Jr., McCleary R, Smolen JR, Whitfield KE, Simonsick EM, LaVeist T. Racial disparities in disability among older adults: finding from the exploring health disparities in integrated communities study. J Aging Health. (2014) 26(8):1261–79. doi: 10.1177/0898264314534892
71. Hastie BA, Riley JL 3rd, Kaplan L, Herrera DG, Campbell CM, Virtusio K, et al. Ethnicity interacts with the OPRM1 gene in experimental pain sensitivity. Pain. (2012) 153(8):1610–9. doi: 10.1016/j.pain.2012.03.022
72. Rahim-Williams FB, Riley JL 3rd, Herrera D, Campbell CM, Hastie BA, Fillingim RB. Ethnic identity predicts experimental pain sensitivity in African Americans and hispanics. Pain. (2007) 129(1–2):177–84. doi: 10.1016/j.pain.2006.12.016
73. Rahim-Williams B, Riley JL III, Williams AK, Fillingim RB. A quantitative review of ethnic group differences in experimental pain response: do biology, psychology, and culture matter? Pain Med. (2012) 13(4):522–40. doi: 10.1111/j.1526-4637.2012.01336.x
74. Losin EAR, Woo CW, Medina NA, Andrews-Hanna JR, Eisenbarth H, Wager TD. Neural and sociocultural mediators of ethnic differences in pain. Nat Hum Behav. (2020) 4(5):517–30. doi: 10.1038/s41562-020-0819-8
75. Miljković A, Stipčić A, Braš M, Dorđević V, Brajković L, Hayward C, et al. Is experimentally induced pain associated with socioeconomic status? Do poor people hurt more? Med Sci Monit. (2014) 20:1232–8. doi: 10.12659/MSM.890714
76. Chan MY, Na J, Agres PF, Savalia NK, Park DC, Wig GS. Socioeconomic status moderates age-related differences in the brain's functional network organization and anatomy across the adult lifespan. Proc Natl Acad Sci U S A. (2018) 115(22):E5144–53. doi: 10.1073/pnas.1714021115
77. Farah MJ. The neuroscience of socioeconomic Status: correlates, causes, and consequences. Neuron. (2017) 96(1):56–71. doi: 10.1016/j.neuron.2017.08.034
78. Glover TL, Horgas AL, Fillingim RB, Goodin BR. Vitamin D status and pain sensitization in knee osteoarthritis: a critical review of the literature. Pain Manag. (2015) 5(6):447–53. doi: 10.2217/pmt.15.43
79. Khalatbari-Soltani S, Blyth FM. Socioeconomic position and pain: a topical review. Pain. (2022) 163(10):1855–61. doi: 10.1097/j.pain.0000000000002634
80. Newman AK, Thorn BE. Intersectional identity approach to chronic pain disparities using latent class analysis. Pain. (2022) 163(4):e547–56. doi: 10.1097/j.pain.0000000000002407
81. Brady B, Veljanova I, Chipchase L. The intersections of chronic noncancer pain: culturally diverse perspectives on disease burden. Pain Med. (2019) 20(3):434–45. doi: 10.1093/pm/pny088
82. Zheng H, Choi Y, Dirlam J, George L. Rising childhood income inequality and declining Americans’ health. Soc Sci Med. (2022) 303:115016. doi: 10.1016/j.socscimed.2022.115016
83. LaVeist T, Pollack K, Thorpe R Jr., Fesahazion R, Gaskin D. Place, not race: disparities dissipate in southwest Baltimore when blacks and whites live under similar conditions. Health Aff (Millwood). (2011) 30(10):1880–7. doi: 10.1377/hlthaff.2011.0640
Keywords: health disparities, clinical pain, physical function, experimental pain, social determinants of health, knee osteoarthritis
Citation: Mickle AM, Domenico LH, Tanner JJ, Terry EL, Cardoso J, Glover TL, Booker S, Addison A, Gonzalez CE, Garvan CS, Redden D, Staud R, Goodin BR, Fillingim RB and Sibille KT (2023) Elucidating factors contributing to disparities in pain-related experiences among adults with or at risk for knee osteoarthritis. Front. Pain Res. 4:1058476. doi: 10.3389/fpain.2023.1058476
Received: 30 September 2022; Accepted: 25 January 2023;
Published: 22 February 2023.
Edited by:
Paul Geha, University of Rochester, United StatesReviewed by:
Soham Al Snih, University of Texas Medical Branch at Galveston, United StatesPriscilla Grace Harrell, City of Hope National Medical Center, United States
Ming Zhang, Chinese Academy of Sciences (CAS), China
© 2023 Mickle, Domenico, Tanner, Terry, Cardoso, Glover, Booker, Addison, Gonzalez, Garvan, Redden, Staud, Goodin, Fillingim and Sibille. This is an open-access article distributed under the terms of the Creative Commons Attribution License (CC BY). The use, distribution or reproduction in other forums is permitted, provided the original author(s) and the copyright owner(s) are credited and that the original publication in this journal is cited, in accordance with accepted academic practice. No use, distribution or reproduction is permitted which does not comply with these terms.
*Correspondence: Kimberly T. Sibille a3NpYmlsbGVAdWZsLmVkdQ==
Specialty Section: This article was submitted to Pain Research Methods, a section of the journal Frontiers in Pain Research