 John M. O'Toole
 Geraldine B. Boylan
- Department of Paediatrics and Child Health, INFANT Research Centre, University College Cork, Cork, Ireland
Hemodynamic changes during neonatal transition increase the vulnerability of the preterm brain to injury. Real-time monitoring of brain function during this period would help identify the immediate impact of these changes on the brain. Neonatal EEG provides detailed real-time information about newborn brain function but can be difficult to interpret for non-experts; preterm neonatal EEG poses even greater challenges. An objective quantitative measure of preterm brain health would be invaluable during neonatal transition to help guide supportive care and ultimately protect the brain. Appropriate quantitative measures of preterm EEG must be calculated and care needs to be taken when applying the many techniques available for this task in the era of modern data science. This review provides valuable information about the factors that influence quantitative EEG analysis and describes the common pitfalls. Careful feature selection is required and attention must be paid to behavioral state given the variations encountered in newborn EEG during different states. Finally, the detrimental influence of artifacts on quantitative EEG analysis is illustrated.
1. Introduction
Postnatal adaption presents many challenges for the preterm infant, with hemodynamic changes increasing the risk of brain injury. An immature cardiovascular system may not be able to maintain hemodynamic stability, resulting in injuries such as peri/intra-ventricular hemorrhage with associated adverse outcomes ranging from neurodevelopmental delay to death (1). It is therefore important to monitor preterm brain function during the transition period. EEG is the only cot-side tool available in the neonatal intensive care unit (NICU) to do this effectively, as developing brain injury manifests as changes to baseline EEG (2–8)
Multichannel neonatal EEG contains complex spatiotemporal information that can be difficult to interpret, especially for non-EEG experts. In preterm infants, the EEG develops in the most immature neonates at 23/24 weeks' gestational age through to full term age with three major trends: increasing continuity, with defined periods of normal EEG quiescence for specific gestational ages; appearance of several normal transient waveforms of prematurity; and the appearance of sleep cycling. Assessment of an infant's EEG against these parameters can indicate whether the maturity of the brain is appropriate for gestational age. In addition, serial EEGs starting soon after birth have been shown to be of use in both determining the timing and severity of brain injury and for outcome prognosis (9). Therefore, the EEG is critical for diagnosis, treatment, and prognosis in the newborn period.
Experts with the level of experience required to interpret neonatal EEG are scarce and are certainly not always available when this information is needed, which, in the NICU, can be at any time, day or night. As a result, in many NICUs around the world, a simpler EEG method, using a restricted number of spatial channels (1–2 channels) and a compressed EEG display has been adopted—the amplitude integrated EEG or aEEG, see example in Figure 1. aEEG was developed in the 1960s for monitoring comatose adults in intensive care and was never intended for monitoring the neonatal brain. However, it was launched into a technology vacuum and adopted rapidly by NICUs for use in full-term infants in the late 1980s because there was simply nothing else available to provide the much-needed insight into newborn brain function. Over the years, this device has proved very useful in the hands of experienced users, and digital machines now also provide 2 channels of uncompressed raw EEG data as output (Figure 1). Non-experts still struggle to interpret the patterns produced and to distinguish seizures from noisy signals caused by excessive biological or environmental interference (10, 11). The aEEG is essentially just one way to represent the EEG quantitatively and has been used extensively in preterm infants (including during the transitional period) and scores of aEEG maturation have also been devised. However, this has happened gradually without any thorough evaluation of the aEEG as an appropriate tool for the assessment of preterm brain function. In addition, other forms of quantitative analysis of the preterm EEG are now being used, as outlined in the next section.
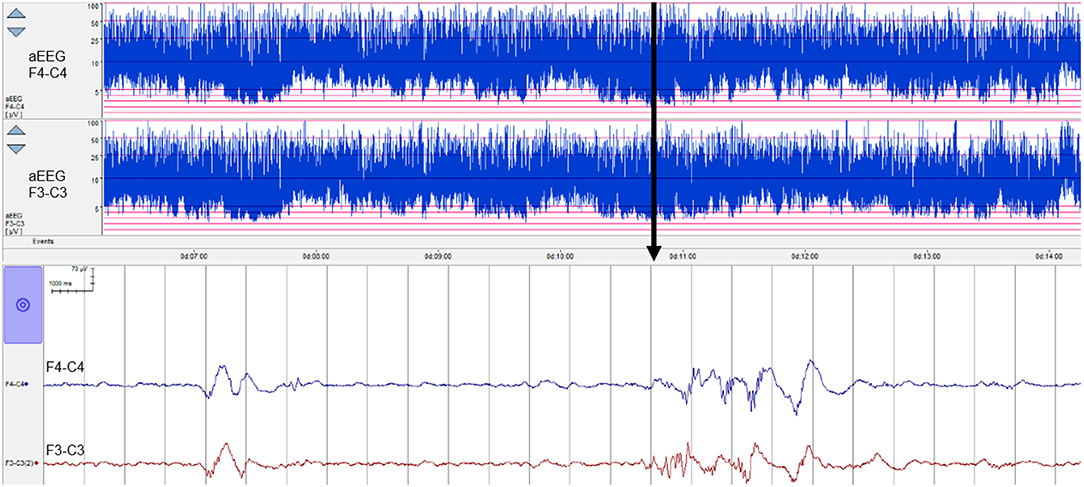
Figure 1. Eight hours of aEEG from a preterm neonate (28 weeks' gestational age) from 6 h of birth. Top two channels show the aEEG from the right and left fronto-central region of the brain and the bottom two channels show 26 s of raw EEG for a point in time marked with an arrow. The aEEG is a compressed EEG signal that has been heavily filtered and then displayed on a semi-log scale. Short duration features of the EEG are impossible to recognize but overall trends are evident.
The aim of this paper is to provide an overview of quantitative measures for the analysis of neonatal EEG that can be used to assess neonatal brain function during transition and to highlight the challenges that can be encountered from both a neurophysiological and signal processing perspective. The measures derived from the EEG using quantitative methods are only of use if there is careful data preparation and management prior to analysis but these steps are easy to overlook in the current era of powerful data science techniques.
2. Quantitative EEG Analysis
Quantitative EEG (qEEG) represents an alternative to the visual interpretation of the EEG. This quantitative approach has the potential to replace the complex, time-consuming, and subjective process of the human interpretation of the EEG with a simple, quick, and reproducible computer-based approach. As a computer requires clear instructions, a mathematical approach is needed to compute a characteristic of the EEG. This characteristic, known as a feature, is a mathematical summary of the EEG which reduces 1 epoch (time period) of EEG into 1 number. For example, if we calculate the standard deviation of the EEG voltage for the two 40-s EEG epochs in Figure 3, we find that this feature, averaged over the 6 EEG channels, is 37 μV in Figure 3A and 53 μV in Figure 3B. Thus, we have reduced the 40-s epoch, across the 6-channels, to 1 number. The term qEEG typically refers to a collection, or set, of these features. This set can include a diverse range of statistical and signal processing features, from the simple, such as the standard-deviation of the EEG, to the more complex, such as the nonlinear, time-varying connectivity among the EEG channels.
Quantitative EEG has been used extensively in preterm EEG analysis. For example, for preterm infants <32 weeks of gestation, qEEG has been shown to mirror maturation (12–26) and has been used to identify and quantify a temporal evolution of the EEG after birth (27–30). Quantitative EEG has also been used to detect bursts within the EEG (23, 31–39), detect early brain injury (7), and to predict neurodevelopmental outcomes (29, 40–42). However, the real power of qEEG may lie in coupling the feature set with machine learning methods to develop specific classification and regression algorithms. These algorithms are trained and tested on human annotations of the EEG. Recent developments in this area include regression algorithms for estimating the functional maturation of cortical activity (30, 43–45) and classification algorithms for determining sleep cycles (46–48).
We now present examples of qEEG features used in this report. Probably the most common qEEG feature is spectral power. This feature describes the average power for different frequency bands. Suitable bands for preterm EEG are 0.5–3, 3–8, 8–15, and 15–30 Hz (30, 39, 49). An example of these different frequencies are presented in Figure 2A, where a filter splits the EEG into the four frequency bands. The higher frequencies comprise of the faster oscillations whereas the lower frequencies comprise of the slower oscillations. Figure 2B shows the spectrum of the same EEG signal, plotted in decibels (dB) to highlight the contribution of the higher frequencies. (Without this logarithmic plot it is difficult to visually assess the contribution of the higher frequencies because they are of such low power.) Also included in Figure 2B is the spectral power values (in units of μV2) for each frequency band. Relative spectral power, another qEEG feature, is the proportion of power in each frequency band. For our example in Figure 2B, we find that 95.6% of the spectral power is concentrated in the 0.5–3 Hz band, compared to just 0.3% of the spectral power in the 15–30 Hz band. And the last frequency-related feature presented here is the fractal dimension. This feature captures a measure of the shape of the frequency spectrum. If we plot the spectrum on a log–log scale and then fit a line to this plot, the slope of the line is proportional to the fractal dimension (50, 51). Figure 2C shows an example of this, where we find that the slope of the fitted line, −26 dB/decades, equates to a fractal dimension of 1.2 (50, 51).
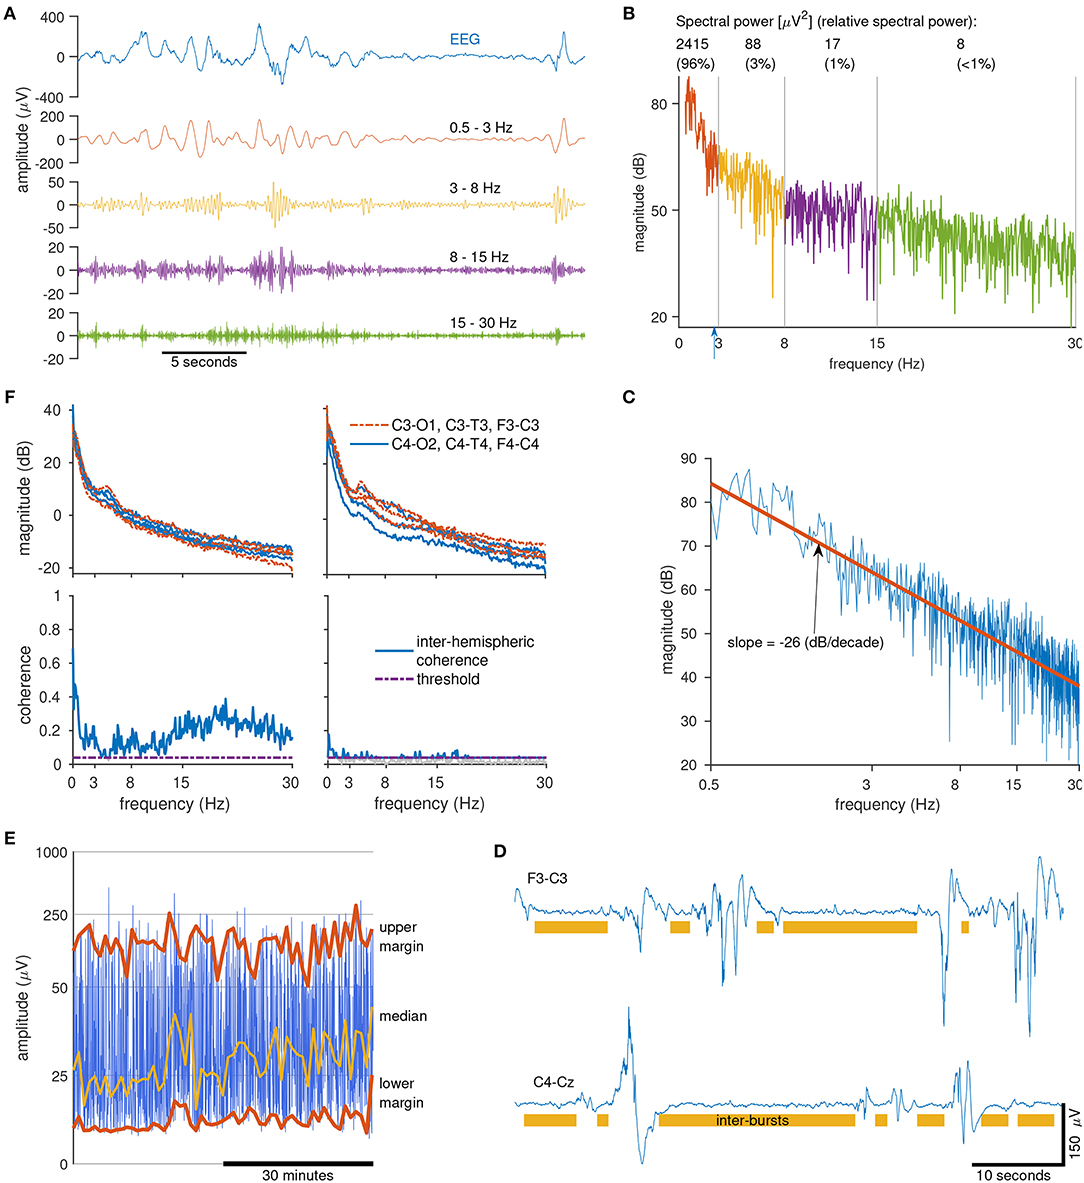
Figure 2. Calculating quantitative EEG features. Clockwise from top left (A): sample of 1 channel of EEG (top) filtered into 4 frequency bands (below). Note the low-amplitude of the higher frequency bands (>15 Hz). (B) Spectrum of the EEG signal in (A) in decibels. Includes spectral power values and relative-spectral power for each frequency band. Blue arrow at 2.7 Hz marks the spectral edge frequency, indicating that 95% of the signal power is contained within 0–2.7 Hz. (C) Log-log plot of the spectrum of the EEG signal from (A). Fractal dimension is a measure of the slope of the line (red line) fitted to the spectrum. (D) Two epochs of EEG (from 2 preterms) with annotated inter-bursts (the area not annotated is considered as a burst). Burst/inter-bursts annotation generated from a preterm burst-detector algorithm. (E) Range-EEG (rEEG) for 1 h of EEG for 1 channel with median, lower-, and upper-margins highlighted. (F) Inter-hemispheric coherence (bottom) estimated from 10 min of EEG (spectra, top) from 2 preterm infants (left and right).
Other qEEG features are estimated directly on the time-domain EEG signal. An example of this is the maximum duration of the inter-burst interval (IBI). To distinguish the bursts from the inter-bursts, we use an automated method to detect the inter-bursts (39). Everything not detected as inter-burst is classified as bursts, which may include continuous EEG activity (39). Figure 2D shows an example of the annotations generated by this automated method. From this burst/inter-burst annotation, we then generate quantitative features such as maximum IBI or percentage of bursts. Next, to capture a long-duration trend of the EEG we use the range-EEG (rEEG) (18, 38). This was proposed as an alternative to the aEEG because the aEEG—despite its widespread use—is lacking a common definition and will differ from EEG machine to EEG machine. From the rEEG, we estimate trends such as the median, lower- and upper-margins as plotted in example in Figure 2E, and then average over time to generate the feature.
And finally, to quantify some form of connectivity between brain regions, a simple and robust approach is to quantify inter-hemispheric connectivity using EEG coherence. This approach summarizes global connectivity by estimating the coherence between all channel pairs on the 2 hemispheres, for example between F3-C3 and F4-C4, C3-T3, and C4-T4, and so on. Figure 2F shows 2 examples for 2 preterm infants, one with a higher level of coherence (left) comparative to the other (right). After coherence is estimated between channel pairs, a global average (median value) is generated as the frequency-dependent inter-hemispheric coherence. This coherence value is then summarized by taking the average for each of the four frequency bands, similar to the process for spectral power. The threshold in Figure 2F eliminates spurious coherence values by re-defining the zero-coherence level (52).
Before implementing qEEG analysis, it is important to consider a number of factors. First, the selected epoch must be representative of the EEG record, as different EEG activity states influence the qEEG. Second, the feature set is dependant on the application. And third, the EEG must be free from artifacts, otherwise this will distort the analyses. Therefore, it is important to consider the different activity states, before analysis. To highlight the seriousness of these points, we next present 3 qEEG examples generated from different cohorts of newborn EEG. The qEEG features are generated using NEURAL [a neonatal EEG feature set in Matlab, version 0.3.3 (53)]; full implementation details can be found in O'Toole and Boylan (54). We also recommend a procedural approach for qEEG analysis to avoid common pitfalls.
3. Example 1: Quantitative Features to Capture Different EEG States
This first example examines the importance of selecting the right feature set. We compared quantitative features in different EEG vigilance states in preterm infants <32 weeks of gestation. The EEG of preterm infants at this age cycles between two different states of EEG activity. Discontinuous activity consists of short-duration, high-amplitude bursts intermixed with periods of low-amplitude activity, known as inter-bursts; continuous activity consists of mixed frequency activity, without bursts or inter-burst periods. Figure 3 shows an example to illustrate the large differences between these two types of EEG activity.
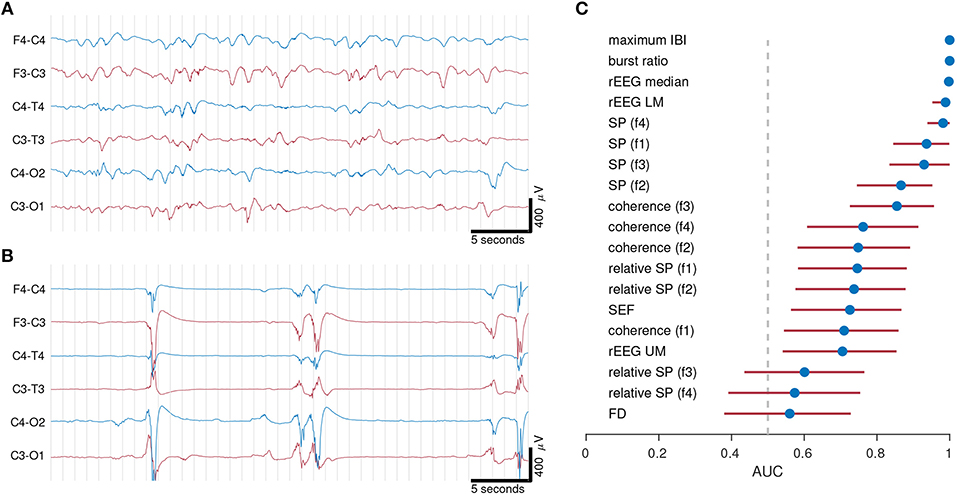
Figure 3. Examples of continuous (A) and discontinuous (B) EEG activity from 2 preterm infants of gestational age 30 weeks 0 days in (A) and 27 weeks 0 days in (B). Quantitative features in (C) distinguish between continuous and discontinuous EEG activity. EEG from 21 infants recorded within days after birth. Dots represents AUC (area under the receiver operator characteristic) and lines represent 95% confidence intervals. AUC values of 0.5 represents random chance and 1 represents maximum separation. IBI, inter-burst interval; rEEG, range-EEG; LM, lower margin; UM, upper margin; SP, spectral power; FD, fractal dimension. Frequency bands: f1, 0.5–3 Hz; f2, 3–8 Hz; f3, 8–15 Hz; and f4, 15–30 Hz.
To be of use, quantitative analysis should be able to capture the complexity of the preterm EEG, and thus should discriminate between segments of discontinuous and continuous activity. Standard deviation of the EEG, the first example feature we presented in the previous section, would not be a useful feature, as there is little difference between the two values (37 and 53 μV) for the two visually different epochs in Figure 3.
We used fully anonymized EEGs from 21 preterm infants recorded within the first few days of birth and selected 2–3 epochs of well-defined continuous activity, and 2–3 epochs of well-defined discontinuous activity, from each EEG record. Each epoch was selected to be artifact free and was approximately 60 s in duration. The median gestational age of the infants was 27.7 weeks, ranging from 25.1 to 31.3 weeks of gestation.
We then estimated qEEG features on each epoch, taking the median across the 2–3 segments for each infant for each activity type. The feature set included spectral power, relative spectral power, interhemispheric coherence, spectral edge frequency, fractal dimension, the median, lower-margin, and upper margin of the rEEG (54). Absolute and relative spectral power, in addition to coherence, were estimated in the four frequency bands: 0.5–3, 3–8, 8–15, and 15–30 Hz (39, 44); rEEG was estimated in 1–20 Hz bandwidth. We also included a burst detection algorithm to estimate the burst ratio and maximum IBI (39). This feature set was introduced in the previous section and in Figure 2. We then calculated the area under the receiver operator characteristic (AUC), with 95% confidence intervals (CIs) using bootstrapping with 1,000 iterations.
The features were ranked according to AUC in Figure 3C. Maximum IBI and burst-ratio were the most discriminating features—not surprising given that discontinuous activity is defined by the presence of bursts and inter-burst. Features of the range EEG (median and lower-margin) also performed well, indicating that the peak-to-peak analysis of the EEG is a good discriminating factor for the two activity types. Lower down the list is spectral power, with relative spectral power even lower. We concluded from this experiment that multiple features, in this case features of the temporal organization of the EEG, are relevant to this specific application. Whereas, the more common features such as spectral power (absolute and relative) and spectral edge frequency are less useful at describing the visually obvious differences between EEG activity types.
4. Example 2: Maturation and qEEG
To highlight again the importance of the right feature for the right application, we show how some features are representative of increasing maturation of the preterm brain, whereas other features do not quantify this change. For this we use the same feature set from the preceding example, which includes spectral measures (absolute and relative powers, coherence, fractal dimension, and spectral edge), connectivity (interhemispheric coherence), measures of peak-to-peak amplitude (features of the range EEG), and measures of the burst-inter-burst pattern (features from the burst annotation).
We then selected a 1 h fully anonymized EEG epoch from 23 preterm infants at 24 h postnatal age. Gestational age ranged from 24 to 31.6 weeks, with a median of 28.4 weeks. These EEGs were determined to be appropriate for gestational age, without abnormalities and free from major artifacts (44). The infants had a normal clinical course, without significant adverse events or medication likely to alter the EEG at this time point. An algorithm was used to identify and remove segments of the EEG epoch with artifacts, such as movements or electrode problems (54).
The feature set was generated from the 1 h epochs and each feature was correlated with gestational age. We used gestational age as a marker for functional brain maturation, as functional activity is linked to growth (maturation) of the preterm brain (55). We generated Pearson's correlation with 95% CI for each feature, using bootstrapping to generate the CIs. Features are ranked accorded to correlation in Figure 4B, and we observed varying degrees of performance for the different features. Note that the highest ranking features in Figure 3C for the previous application are not always the same features ranked highly in Figure 4B. For example, fractal dimension is the highest (1st) ranking feature in Figure 4B but the lowest (last) in Figure 3C. Again, the common spectral power measures (absolute and relative) are not the highest ranking features. Figure 4A shows an example of significant correlation between the features and gestational age for both the fractal dimension feature and the maximum inter-burst interval features. Figure 4A also shows how the 0.5–3 Hz relative spectral power is, for this example, completely independent (|r| < 0.01) of gestational age.
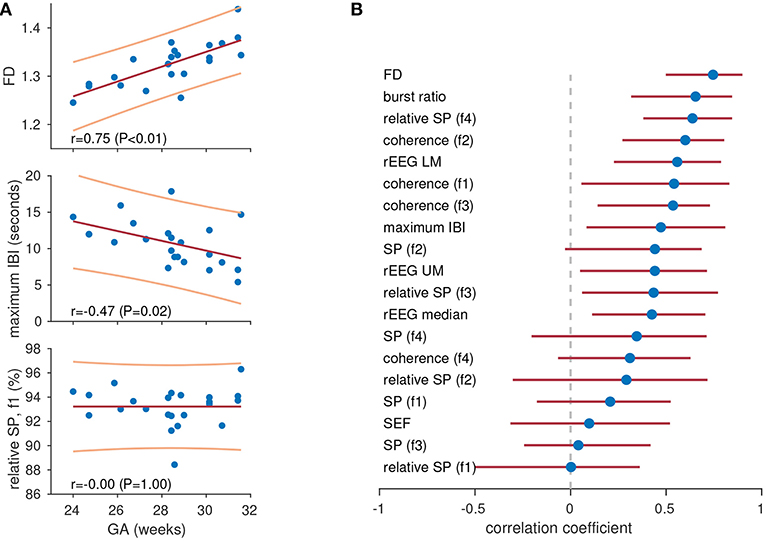
Figure 4. Tracking maturation with quantitative features. Three features in (A) showing high (top), medium (centre), and low (bottom) levels of correlation with gestational age (GA). Lines represent least-squares fit (red, centre) with 95% prediction intervals (yellow, top and bottom). Plots show features for 1-h epochs of EEG (dots) in 23 preterm infants. Pearson's correlation coefficient for all features in (B). Dots represents Pearson's correlation coefficient and lines represent 95% confidence intervals. IBI, inter-burst interval; rEEG, range-EEG; LM, lower margin; UM, upper margin; SP, spectral power; FD, fractal dimension. Frequency bands: f1, 0.5–3 Hz; f2, 3–8 Hz; f3, 8–15 Hz; and f4, 15–30 Hz.
5. Example 3: Artifact and EEG
In this last example we examined the effects of artifacts on the qEEG. Artifacts can be biological in origin, such as muscle movement or ECG, and non-biological in origin, such as electrical interference or changing electrode impedance; a more thorough description of common neonatal EEG artifacts can be found elsewhere (56, 57). In a clinical setting it is difficult to record neonatal EEG without encountering some artifacts. Typically, the quantity of artifacts increases with duration of EEG monitoring and the frequency of clinical or routine interventions. The purpose of this example is to show how the qEEG features change when EEG becomes contaminated with artifacts.
We examined the fully anonymized EEG from 38 term infants recorded in the NICU within days after birth. Artifacts were annotated on a channel-by-channel basis and included artifacts from cardiac and respiratory sources, artifacts caused by movement and muscle activation, and artifacts caused by poor electrode contact. Examples of different artifacts are presented in Figure 5. This cohort was used in a previous study to develop an automated artifact detection system (58). For each EEG recording from each infant, one epoch of artifact-free EEG was selected and combined with the artifact to build varying percentages of artifact-to-EEG. Specifically, we generated epochs with 15, 30, 60, and 100% of the duration consisting of artifacts.
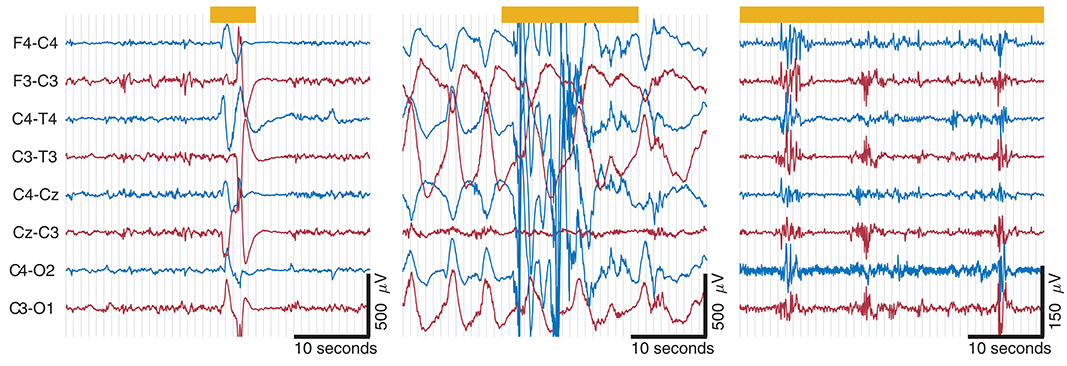
Figure 5. Examples of artifacts taken from EEG records from 3 term infants. Thick yellow line at top represents artifact annotation. Artifact is present across all channels in (A,B); artifact in (C) is located in C4-O2, C3-O1, and F4-C4. Note that both (A,B) have the same amplitude scaling; high-amplitude slow waves in (B) outside of artifact annotation is from a seizure. Movement artifact in (A,B) and muscle artifact on C4-O2 in (C). Also ECG artifact present on C3-O1 and F4-C4 in (C).
A set of qEEG features were computed for each epoch, consisting of spectral power (absolute and relative), spectral edge frequency, fractal dimension, skewness of the EEG, and 3 rEEG features (mean, lower- and upper-margins). The spectral power and EEG skew features were computed for four frequency bands: 0.5–4, 4–7, 7–13, and 13–30 Hz; the rEEG was computed on the 1–20 Hz band. Before generating the feature set, the EEG was low-pass filtered to 30 Hz and then downsampled to 64 Hz. Figure 6 shows how a feature (spectral power at different frequency bands) changes over time in response to an artifact, thus highlighting the deleterious nature of the presence of artifacts.
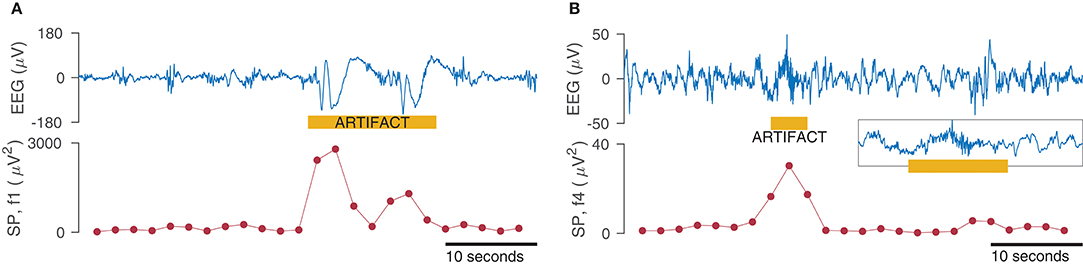
Figure 6. Effect of artifacts on spectral power (SP) measures for the frequency bands 0.5–3 Hz (f1 in A) and 15–30 Hz (f4 in B). SP is calculated within a 4 s window with 50% overlap for the 50 s EEG (1-channel only). Inset in (B) shows zoom of EEG artifact.
To assess the influence of artifacts on the estimation of the features, we compare the segments of each epoch without artifacts to the epoch containing a percentage of the epoch. For example, we compared the spectral power generated using an artifact-free epoch to the spectral power generated from an epoch containing 10% artifact. These results are plotted in Figure 7 for the four different percentage of artifacts. To plot all features side-by-side, the features are normalized by subtracting the median and dividing by the interquartile range of the feature estimated on the artifact-free epoch. Figures 7A,B show that there is no difference for all features between the epochs without artifacts and the epochs containing 15 and 30% artifacts. In Figure 7C, only 4/17 features significantly (P < 0.05) differ for the different epochs. But in Figure 7D, which compares the EEG to the artifact (100% artifact), we see greater differences with 12/17 significant features. This last result is as expected: qEEG features generated from artifacts will differ to the features generated from non-artifact EEG. Although what may be of concern is that the 4–7 Hz spectral power feature, the 13–30 Hz relative-spectral power feature, and none of the rEEG features differed between the EEG and artifacts. This implies that these features are incapable of distinguishing between cortical activity generated EEG and non-cortical activity generated EEG. For the other features, we could say that these features are robust to EEG contaminated with a large percentage of artifacts, in some cases up to 30% or even 60%. Or we could say that because the majority (60%) of the EEG is artifact in Figure 7C, only a few features differ significantly to the artifact-free EEG, thus indicating that these features are incapable of distinguishing between EEG and artifact.
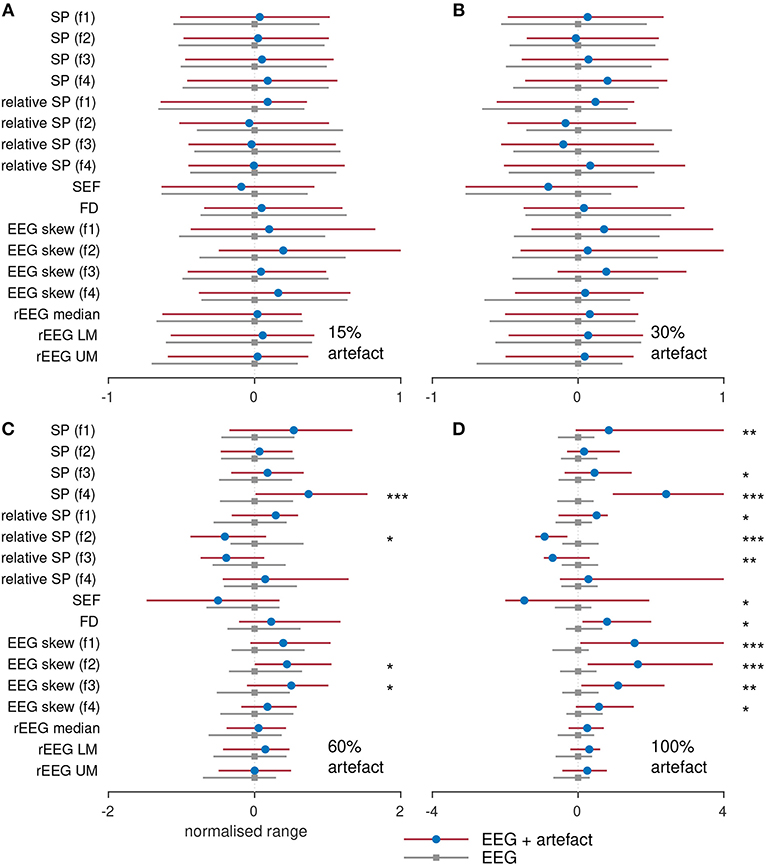
Figure 7. Comparing features with and without varying degrees of artifact. Features generated from 38 term infants EEG with (A) 15%, (B) 30%, (C) 60%, and (D) 100% artifacts. SP, spectral power; FD, fractal dimension; SEF, spectral edge frequency; rEEG, range-EEG; LM, lower margin; UM, upper margin; Frequency bands: f1, 0.5–4 Hz; f2, 4–7 Hz; f3, 7–13 Hz; and f4, 13–30 Hz. Stars denote statistical significance from Mann–Whitney tests: ***P < 0.001, **P < 0.01, and *P < 0.05 comparing between EEG epochs and EEG epochs with artifacts. Dots represent median values and lines represents inter-quartile range.
6. Procedure for Computing qEEG
Figure 8 presents a process for generating qEEG considering the issues explored in the previous three examples. The first step in Figure 8 requires an experienced clinical neurophysiologist to prune an epoch from the total EEG recording. This epoch should be as free as possible from contaminating artifacts and also be of appropriate duration for the application. The second step acknowledges that there will often be some artifacts still present in the EEG and that these segments of the epoch should be excluded from further analysis. This can be achieved either manually, from visual inspection by the EEG expert, or using an automated procedure, such as existing artifact-detection algorithms (54, 58). The third step should stress the importance of selecting the right feature set for the application: there is no generic feature that will be optimal for all applications in preterm EEG. For example, as the results in Figure 3 show, spectral power does not sufficiently describe the EEG when distinguishing between different activity states nor is it sufficient to estimate functional maturation of the EEG.
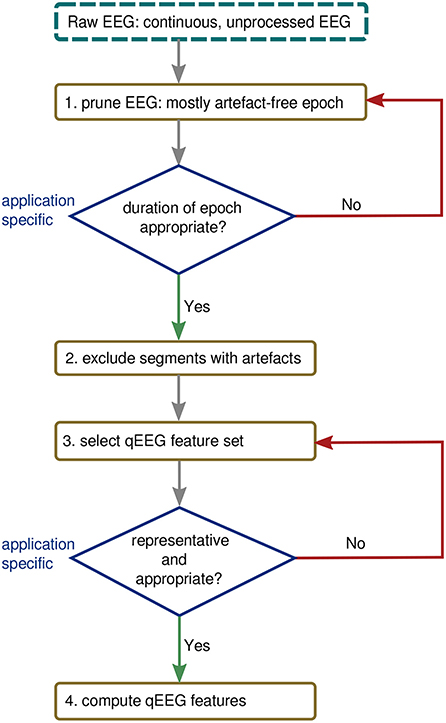
Figure 8. Procedure for generating qEEG from continuous EEG.
7. Discussion
Quantitative EEG is a powerful tool for the objective analysis of the EEG. Artifacts have a detrimental effect on the qEEG and should be minimized. Many features are sensitive to maturation and activity states and both should be considered before analysis. Different applications will require different feature sets, and common features such as spectral power or relative spectral power are not sufficient to represent the complexity of the preterm EEG.
As we have shown, it is important that the EEG is free from artifact or contains only minimal artifact. At the very least, it is essential to be aware of the quantity and nature of this artifact before qEEG analysis. This requires human intervention: an EEG expert must review the EEG and select segments that are relatively artifact-free before computing the qEEG features. In the future, automated methods may be able to replace this step (58–60), but to-date none exist for preterm EEG. Even when an expert prunes a segment of EEG for analysis, some artifacts are unavoidable and in this instance it may be helpful to remove periods of artifacts using a simple rule-based procedure (54) or more sophisticated algorithms (60).
Although artifact is a consequence of EEG monitoring in an intensive care environment, there are specific challenges unique to the preterm EEG. First, the epoch used to generate the qEEG must either be long enough, such as 1 h or more, to encompass different states; or, care must be taken to ensure that the EEG activity states are similar between comparison groups. We have demonstrated in section 3 that for many qEEG features, there is a clear separation between activity states. Second, as highlighted in section 4, many features are dependent on gestational age; this extends to maturation in general as there is also a similar progression for postmenstrual age when the EEG monitoring is beyond the first days of life (13–26). This relation is so strong that a combination of qEEG features can be used to predict gestational age with a high level of accuracy (30, 44, 45). Thus, in studies comparing between different preterm groups it may be necessary to control for gestational or postmenstrual age. And third, a recent study has quantified the impact of postnatal adaption to extrauterine life on the qEEG (30). Increased cerebral perfusion during this period may significantly alter cortical activity and thus the qEEG. This study finds an increase in cortical activity, as measured by the qEEG, over the first 3 days of life that is similar to 2–6 weeks of intra-uterine maturation (30). Thus just as gestational age is integral to the assessment of preterm EEG, postnatal age (hours after birth) is also an important factor for preterm qEEG. Postnatal age over the transitional period should also be considered in addition to gestational age.
And lastly, two other important considerations for qEEG are worth mentioning. The first is the problem of how to define the qEEG feature set. There is no one-size-fits-all solution to this problem, as there is an ever-increasing array of statistical and signal processing features that could be considered as qEEG features. The best approach to tackling this problem is to focus on the specific application: what feature set best represents the EEG epochs for this problem? For example, in Figure 4 we see that fractal dimension is the best feature for estimating gestational age whereas it is the worst feature for distinguishing between discontinuous and continuous activity (Figure 3). In addition, it is better to include a large array of qEEG features instead of one or two, such as the commonly used spectral power and relative spectral power measures. A handful of measures may not be sufficient to represent the complex, dynamic preterm EEG. For example, the fractal dimension feature in Figure 4 has the highest ranking correlation with gestational age of r = 0.75, however when multiple features are combined using machine learning methods this correlation has been reported to be as high as r = 0.89 (44) and r = 0.94 (45).
The second problem is that there is no standard for how qEEG features are defined. As most publications do not provide the computer code to generate the features or provide enough details to implement the features, this presents an obstacle to reproducible research. But possibly more troublesome is that the lack of a standard for qEEG makes it difficult to compare results across different studies. We have made an attempt to address this problem by producing open and freely available computer code (53, 61), with full implementation details (54), to define a standard for some of the most common qEEG features. This can only succeed, of course, if the research community engages on this issue.
In conclusion, qEEG in preterms has been successfully applied to many applications of clinical relevance, such as tracking functional maturation, detecting, and even predicting early brain injury, and predicting long-term outcome. We have outlined some key issues that should be considered before implementation, such as artifacts, use of representative epochs, appropriate feature sets for the right application, and the advantages associated with a standard qEEG implementation. Future directions could include the development of an automated scoring system of the preterm EEG using qEEG, a system to quantify the level of abnormalities in the EEG with application to grading EEGs and predicting long-term neurodevelopmental outcome. Clearly, there are many problems to solve before qEEG can be used for routine preterm EEG analysis and more specifically during the vulnerable transition period.
Author Contributions
GB and JO made substantial contributions to the conception and design of this paper work. GB and JO drafted and revised the paper extensively. Both authors approved this work for publication. Both authors agree to be accountable for all aspects of the work in ensuring that questions related to the accuracy or integrity of any part of the work are appropriately investigated and resolved.
Funding
This work was supported by two awards from Science Foundation Ireland, a Research Centre Award (INFANT-12/RC/2272) and an Investigator Award to JO (15/SIRG/3580).
Conflict of Interest Statement
The authors declare that the research was conducted in the absence of any commercial or financial relationships that could be construed as a potential conflict of interest.
References
1. Gill AW. Postnatal cardiovascular adaptation. Arch Dis Child Fetal Neonatal Ed. (2019) 104:F220–4. doi: 10.1136/archdischild-2017-314453
2. Clancy RR, Tharp BR. Positive rolandic sharp waves in the electroencephalograms of premature neonates with intraventricular hemorrhage. Electroencephalogr Clin Neurophysiol. (1984) 57:395–404. doi: 10.1016/0013-4694(84)90068-3
3. Okumura A, Hayakawa F, Kato T, Kuno K, Watanabe K. Developmental outcome and types of chronic-stage EEG abnormalities in preterm infants. Dev Med Child Neurol. (2002) 44:729–34. doi: 10.1111/j.1469-8749.2002.tb00278.x
4. Hellström-Westas L, Rosén I. Electroencephalography and brain damage in preterm infants. Early Hum Dev. (2005) 81:255–61. doi: 10.1016/j.earlhumdev.2005.01.006
5. Sohn JA, Kim HS, Lee EH, Lee J, Lee JA, Choi CW, et al. Developmental change of amplitude-integrated electroencephalographic activity in preterm infants with intraventricular hemorrhage. Early Hum Dev. (2013) 89:961–6. doi: 10.1016/j.earlhumdev.2013.09.009
6. Benavente-Fernández I, Lubián-López SP, Jiménez-Gómez G, Lechuga-Sancho AM, Garcia-Alloza M. Low-voltage pattern and absence of sleep-wake cycles are associated with severe hemorrhage and death in very preterm infants. Eur J Pediatr. (2015) 174:85–90. doi: 10.1007/s00431-014-2360-0
7. Iyer KK, Roberts JA, Hellström-Westas L, Wikström S, Hansen Pupp I, Ley D, et al. Early detection of preterm intraventricular hemorrhage from clinical electroencephalography. Crit Care Med. (2015) 43:2219–27. doi: 10.1097/CCM.0000000000001190
8. Pavlidis E, Lloyd RO, Boylan GB. EEG - a valuable biomarker of brain injury in preterm infants. Dev Neurosci. (2017) 39:23–35. doi: 10.1159/000456659
9. Watanabe K, Hayakawa F, Okumura A. Neonatal EEG: a powerful tool in the assessment of brain damage in preterm infants. Brain Dev. (1999) 21:361–72. doi: 10.1021/ct500507f
10. Rennie JM, Chorley G, Boylan G, Pressler R, Nguyen Y, Hooper R. Non-expert use of the cerebral function monitor for neonatal seizure detection. Arch Dis Child Fetal Neonatal Ed. (2004) 89:F37–40. doi: 10.1136/fn.89.1.F37
11. Shah N, Van Meurs K, Davis A. Amplitude-integrated electroencephalography: a survey of practices in the United States. Am J Perinatol. (2014) 32:755–60. doi: 10.1055/s-0034-1395483
12. Hayakawa M, Okumura A, Hayakawa F, Watanabe K, Ohshiro M, Kato Y, et al. Background electroencephalographic (EEG) activities of very preterm infants born at less than 27 weeks gestation: a study on the degree of continuity. Arch Dis Child Fetal Neonatal Ed. (2001) 84:F163–7. doi: 10.1136/fn.84.3.F163
13. Okumura A, Kubota T, Tsuji T, Kato T, Hayakawa F, Watanabe K. Amplitude spectral analysis of theta/alpha/beta waves in preterm infants. Pediatr Neurol. (2006) 34:30–4. doi: 10.1016/j.pediatrneurol.2005.06.005
14. Niemarkt HJ, Andriessen P, Pasman J, Vles JS, Zimmermann LJ, Oetomo SB. Analyzing EEG maturation in preterm infants: the value of a quantitative approach. J Neonat Perinat Med. (2008) 1:131–44. Available online at: https://content.iospress.com/articles/journal-of-neonatal-perinatal-medicine/npm00021
15. Zhang D, Ding H, Liu Y, Zhou C, Ding H, Ye D. Neurodevelopment in newborns: a sample entropy analysis of electroencephalogram. Physiol Meas. (2009) 30:491–504. doi: 10.1088/0967-3334/30/5/006
16. Niemarkt HJ, Andriessen P, Peters CHL, Pasman JW, Zimmermann LJ, Bambang Oetomo S, et al. Quantitative analysis of maturational changes in EEG background activity in very preterm infants with a normal neurodevelopment at 1 year of age. Early Hum Dev. (2010) 86:219–24. doi: 10.1016/j.earlhumdev.2010.03.003
17. Niemarkt HJ, Jennekens W, Pasman JW, Katgert T, Van Pul C, Gavilanes AWD, et al. Maturational changes in automated EEG spectral power analysis in preterm infants. Pediatr Res. (2011) 70:529–34. doi: 10.1203/PDR.0b013e31822d748b
18. O'Reilly D, Navakatikyan MA, Filip M, Greene D, Van Marter LJ. Peak-to-peak amplitude in neonatal brain monitoring of premature infants. Clin Neurophysiol. (2012) 123:2139–53. doi: 10.1016/j.clinph.2012.02.087
19. Jennekens W, Niemarkt HJ, Engels M, Pasman JW, van Pul C, Andriessen P. Topography of maturational changes in EEG burst spectral power of the preterm infant with a normal follow-up at 2 years of age. Clin Neurophysiol. (2012) 123:2130–8. doi: 10.1016/j.clinph.2012.03.018
20. Meijer EJ, Hermans KHM, Zwanenburg A, Jennekens W, Niemarkt HJ, Cluitmans PJM, et al. Functional connectivity in preterm infants derived from EEG coherence analysis. Eur J Paediatr Neurol. (2014) 18:780–9. doi: 10.1016/j.ejpn.2014.08.003
21. Benders MJ, Palmu K, Menache C, Borradori-Tolsa C, Lazeyras F, Sizonenko S, et al. Early brain activity relates to subsequent brain growth in premature infants. Cereb Cortex. (2014) 25:1–11. doi: 10.1093/cercor/bhu097
22. Shany E, Meledin I, Gilat S, Yogev H, Golan A, Berger I. In and ex utero maturation of premature infants electroencephalographic indices. Clin Neurophysiol. (2014) 125:270–6. doi: 10.1016/j.clinph.2013.06.185
23. Murphy K, Stevenson NJ, Goulding RM, Lloyd RO, Korotchikova I, Livingstone V, et al. Automated analysis of multi-channel EEG in preterm infants. Clin Neurophysiol. (2015) 126:1692–702. doi: 10.1016/j.clinph.2014.11.024
24. Koolen N, Dereymaeker A, Ra O, Jansen K, Vervisch J, Matic V, et al. Early development of synchrony in cortical activations in the human. Neuroscience. (2016) 322:298–307. doi: 10.1016/j.neuroscience.2016.02.017
25. Saji R, Hirasawa K, Ito M, Kusuda S, Konishi Y, Taga G. Probability distributions of the electroencephalogram envelope of preterm infants. Clin Neurophysiol. (2015) 126:1132–40. doi: 10.1016/j.clinph.2014.08.022
26. Suppiej A, Cainelli E, Cappellari A, Trevisanuto D, Balao L, Di Bono MG, et al. Spectral analysis highlight developmental EEG changes in preterm infants without overt brain damage. Neurosci Lett. (2017) 649:112–5. doi: 10.1016/j.neulet.2017.04.021
27. Victor S, Appleton RE, Beirne M, Marson AG, Weindling AM. Spectral analysis of electroencephalography in premature newborn infants: normal ranges. Pediatr Res. (2005) 57:336–41. doi: 10.1203/01.PDR.0000153868.77623.43
28. West CR, Harding JE, Williams CE, Gunning MI, Battin MR. Quantitative electroencephalographic patterns in normal preterm infants over the first week after birth. Early Hum Dev. (2006) 82:43–51. doi: 10.1016/j.earlhumdev.2005.07.009
29. Schumacher EM, Larsson PG, Sinding-Larsen C, Aronsen R, Lindeman R, Skjeldal OH, et al. Automated spectral EEG analyses of premature infants during the first three days of life correlated with developmental outcomes at 24 months. Neonatology. (2013) 103:205–12. doi: 10.1159/000345923
30. O'Toole JM, Pavlidis E, Korotchikova I, Boylan GB, Stevenson NJ. Temporal evolution of quantitative EEG within 3 days of birth in early preterm infants. Sci Rep. (2019) 9:4859. doi: 10.1038/s41598-019-41227-9
31. Vanhatalo S, Palva JM, Andersson S, Rivera C, Voipio J, Kaila K. Slow endogenous activity transients and developmental expression of K+–Cl- cotransporter 2 in the immature human cortex. Eur J Neurosci. (2005) 22:2799–804. doi: 10.1111/j.1460-9568.2005.04459.x
32. Palmu K, Stevenson N, Wikström S, Hellström-Westas L, Vanhatalo S, Palva JM. Optimization of an NLEO-based algorithm for automated detection of spontaneous activity transients in early preterm EEG. Physiol Meas. (2010) 31:N85–93. doi: 10.1088/0967-3334/31/11/N02
33. Palmu K, Wikström S, Hippeläinen E, Boylan G, Hellström-Westas L, Vanhatalo S. Detection of ‘EEG bursts’ in the early preterm EEG: visual vs. automated detection. Clin Neurophysiol. (2010) 121:1015–22. doi: 10.1016/j.clinph.2010.02.010
34. Jennekens W, Ruijs LS, Lommen CML, Niemarkt HJ, Pasman JW, van Kranen-Mastenbroek VHJM, et al. Automatic burst detection for the EEG of the preterm infant. Physiol Meas. (2011) 32:1623–37. doi: 10.1088/0967-3334/32/10/010
35. Chauvet PE, Tich SNT, Schang D, Clément A. Evaluation of automatic feature detection algorithms in EEG: application to interburst intervals. Comput Biol Med. (2014) 54:61–71. doi: 10.1016/j.compbiomed.2014.08.011
36. O' Toole JM, Temko A, Stevenson NJ. Assessing instantaneous energy in the EEG: a non-negative, frequency-weighted energy operator. In: International Conference of the IEEE Engineering in Medicine and Biology Society. Chicago, IL (2014). p. 3288–91. doi: 10.1109/EMBC.2014.6944325
37. Koolen N, Jansen K, Vervisch J, Matic V, De Vos M, Naulaers G, et al. Line length as a robust method to detect high-activity events: automated burst detection in premature EEG recordings. Clin Neurophysiol. (2014) 125:1985–94. doi: 10.1016/j.clinph.2014.02.015
38. Navakatikyan MA, O'Reilly D, Van Marter LJ. Automatic measurement of interburst interval in premature neonates using range EEG. Clin Neurophysiol. (2016) 127:1233–46. doi: 10.1016/j.clinph.2015.11.008
39. O'Toole JM, Boylan GB, Lloyd RO, Goulding RM, Vanhatalo S, Stevenson NJ. Detecting bursts in the EEG of very and extremely premature infants using a multi-feature approach. Med Eng Phys. (2017) 45:42–50. doi: 10.1016/j.medengphy.2017.04.003
40. Williams IA, Tarullo AR, Grieve PG, Wilpers A, Vignola EF, Myers MM, et al. Fetal cerebrovascular resistance and neonatal EEG predict 18-month neurodevelopmental outcome in infants with congenital heart disease. Ultrasound Obstet Gynecol. (2012) 40:304–9. doi: 10.1002/uog.11144
41. Iyer KK, Roberts JA, Hellström-Westas L, Wikström S, Hansen Pupp I, Ley D, et al. Cortical burst dynamics predict clinical outcome early in extremely preterm infants. Brain. (2015) 138:2206–18. doi: 10.1093/brain/awv129
42. El Ters NM, Vesoulis ZA, Liao SM, Smyser CD, Mathur AM. Term-equivalent functional brain maturational measures predict neurodevelopmental outcomes in premature infants. Early Hum Dev. (2018) 119:68–72. doi: 10.1016/j.earlhumdev.2018.02.010
43. Holthausen K, Breidbach O, Scheidt B, Frenzel J. Brain dysmaturity index for automatic detection of high-risk infants. Pediatr Neurol. (2000) 22:187–91. doi: 10.1016/S0887-8994(99)00154-X
44. O'Toole JM, Boylan GB, Vanhatalo S, Stevenson NJ. Estimating functional brain maturity in very and extremely preterm neonates using automated analysis of the electroencephalogram. Clin Neurophysiol. (2016) 127:2910–8. doi: 10.1016/j.clinph.2016.02.024
45. Stevenson NJ, Oberdorfer L, Koolen N, O'Toole JM, Werther T, Klebermass-Schrehof K, et al. Functional maturation in preterm infants measured by serial recording of cortical activity. Sci Rep. (2017) 7:12969. doi: 10.1038/s41598-017-13537-3
46. Palmu K, Kirjavainen T, Stjerna S, Salokivi T, Vanhatalo S. Sleep wake cycling in early preterm infants: comparison of polysomnographic recordings with a novel EEG-based index. Clin Neurophysiol. (2013) 124:1807–14. doi: 10.1016/j.clinph.2013.03.010
47. Dereymaeker A, Pillay K, Vervisch J, Van Huffel S, Naulaers G, Jansen K, et al. An automated quiet sleep detection approach in preterm infants as a gateway to assess brain maturation. Int J Neural Syst. (2017) 27:1750023. doi: 10.1142/S012906571750023X
48. Koolen N, Oberdorfer L, Rona Z, Giordano V, Werther T, Klebermass-Schrehof K, et al. Automated classification of neonatal sleep states using EEG. Clin Neurophysiol. (2017) 128:1100–8. doi: 10.1016/j.clinph.2017.02.025
49. Tokariev A, Palmu K, Lano A, Metsäranta M, Vanhatalo S. Phase synchrony in the early preterm EEG: development of methods for estimating synchrony in both oscillations and events. NeuroImage. (2012) 60:1562–73. doi: 10.1016/j.neuroimage.2011.12.080
50. Higuchi T. Relationship between the fractal dimension and the power law index for a time series: a numerical investigation. Phys D. (1990) 46:254–64.
51. Finn D, O'Toole JM, Dempsey EM, Boylan GB. EEG for the assessment of neurological function in newborn infants immediately after birth. Arch Dis Child Fetal Neonatal Ed. (2018). doi: 10.1136/archdischild-2018-315231. [Epub ahead of print].
52. Halliday DM, Rosenberg JR, Amjad AM, Breeze P, Conway BA, Farmer SF. A framework for the analysis of mixed time series/point process data—theory and application to the study of physiological tremor, single motor unit discharges and electromyograms. Prog Biophys Mol Biol. (1995) 64:237–78. doi: 10.1016/S0079-6107(96)00009-0
53. O'Toole JM. NEURAL: Quantitative Features for Newborn EEG in Matlab [Software] (version 0.3.3) Zenodo (2017). doi: 10.5281/zenodo.1052811
54. O'Toole JM, Boylan GB. NEURAL: quantitative features for newborn EEG using Matlab. ArXiv E-Prints:arXiv:1704.05694. (2017).
55. Pavlidis E, Lloyd RO, Mathieson S, Boylan GB. A review of important EEG features for the assessment of brain maturation in premature infants. Acta Paediatr. (2017) 38:42–9. doi: 10.1111/apa.13956
56. Boylan GB. Principles of EEG. Neonatal Cerebral Investigation. Cambridge University Press (2008).
57. André M, Lamblin MD, D'Allest AM, Curzi-Dascalova L, Moussalli-Salefranque F, Nguyen The Tich S, et al. Electroencephalography in premature and full-term infants. Developmental features and glossary. Neurophysiol Clin. (2010) 40:59–124. doi: 10.1016/j.neucli.2010.02.002
58. Stevenson NJ, O' Toole JM, Korotchikova I, Boylan GB. Artefact detection in neonatal EEG. In: International Conference of the IEEE Engineering in Medicine and Biology Society. Chicago, IL (2014). p. 926–9. doi: 10.1109/EMBC.2014.6943743
59. Boashash B, Azemi G, Ali Khan N. Principles of time–frequency feature extraction for change detection in non-stationary signals: applications to newborn EEG abnormality detection. Pattern Recogn. (2015) 48:616–27. doi: 10.1016/J.PATCOG.2014.08.016
60. Kauppila M, Vanhatalo S, Stevenson N. Artifact detection in neonatal EEG using Gaussian mixture models. IFMBE Proc. (2017) 65:221–4. doi: 10.1007/978-981-10-5122-7_56
Keywords: EEG, aEEG, preterm, newborn, quantitative analysis, transition, maturation, spectral power
Citation: O'Toole JM and Boylan GB (2019) Quantitative Preterm EEG Analysis: The Need for Caution in Using Modern Data Science Techniques. Front. Pediatr. 7:174. doi: 10.3389/fped.2019.00174
Received: 25 February 2019; Accepted: 16 April 2019;
Published: 03 May 2019.
Edited by:
Arjan Te Pas, Leiden University, NetherlandsReviewed by:
Ronny Knol, Erasmus University Rotterdam, NetherlandsFlora Wong, Monash University, Australia
Copyright © 2019 O'Toole and Boylan. This is an open-access article distributed under the terms of the Creative Commons Attribution License (CC BY). The use, distribution or reproduction in other forums is permitted, provided the original author(s) and the copyright owner(s) are credited and that the original publication in this journal is cited, in accordance with accepted academic practice. No use, distribution or reproduction is permitted which does not comply with these terms.
*Correspondence: Geraldine B. Boylan, Zy5ib3lsYW5AdWNjLmll