Abstract
Introduction:
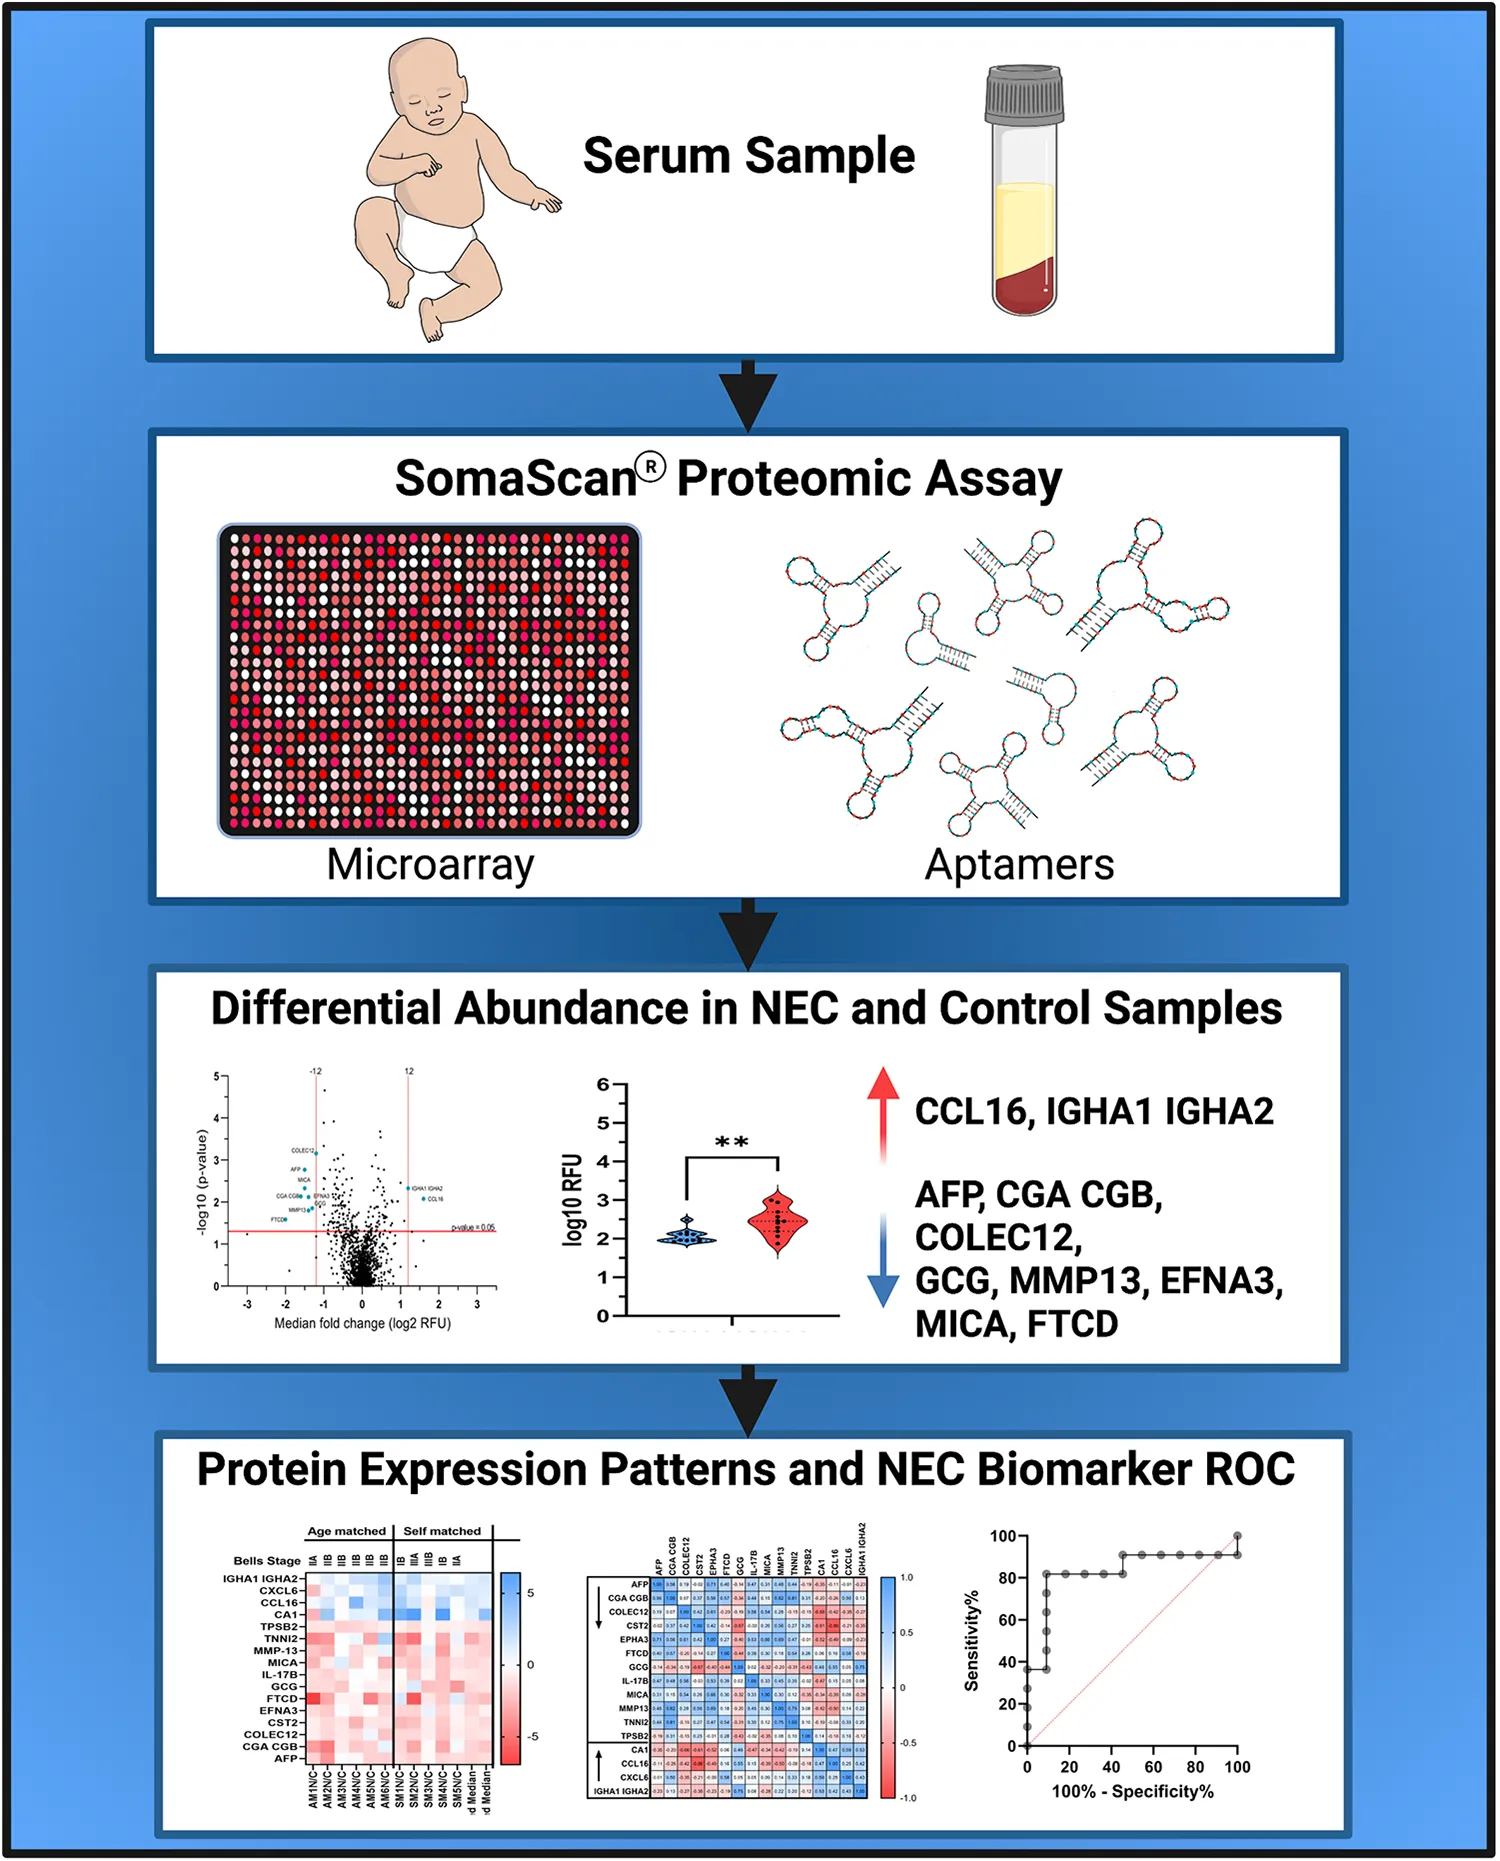
Necrotizing enterocolitis (NEC) is a potentially fatal intestinal disease primarily affecting preterm infants. Early diagnosis of neonates with NEC is crucial to improving outcomes; however, traditional diagnostic tools remain inadequate. Biomarkers represent an opportunity to improve the speed and accuracy of diagnosis, but they are not routinely used in clinical practice.
Methods:
In this study, we utilized an aptamer-based proteomic discovery assay to identify new serum biomarkers of NEC. We compared levels of serum proteins in neonates with and without NEC and identified ten differentially expressed serum proteins between these groups.
Results:
We detected two proteins, C-C motif chemokine ligand 16 (CCL16) and immunoglobulin heavy constant alpha 1 and 2 heterodimer (IGHA1 IGHA2), that were significantly increased during NEC and eight that were significantly decreased. Generation of receiver operating characteristic (ROC) curves revealed that alpha-fetoprotein (AUC = 0.926), glucagon (AUC = 0.860), and IGHA1 IGHA2 (AUC = 0.826) were the proteins that best differentiated patients with and without NEC.
Discussion:
These findings indicate that further investigation into these serum proteins as a biomarker for NEC is warranted. In the future, laboratory tests incorporating these differentially expressed proteins may improve the ability of clinicians to diagnose infants with NEC rapidly and accurately.
Overview of the study. Figure made with Biorender.com.
Introduction
Premature and low birthweight infants are at risk for necrotizing enterocolitis (NEC), a severe inflammatory intestinal disease. The incidence of NEC is as high as 7% in preterm infants born at <32 weeks and 5%–22% in extremely low birth weight (ELBW, <1,000 g) infants (1). The symptoms of NEC are often nonspecific and subtle; however, neonates who develop NEC can rapidly worsen and progress to requiring emergency surgery or death within hours of diagnosis. Thus, accurately diagnosing NEC early in the disease course is crucial for initiating potentially life-saving clinical interventions (2). Unfortunately, diagnostic tools and treatment options for NEC have not improved despite decades of intensive research (3).
During NEC, intestinal barrier dysfunction resulting from epithelial injury and inadequate repair mechanisms can lead to bacterial translocation across the gut barrier, systemic inflammation, and potentially sepsis (4–8). Due to this systemic inflammatory response, symptoms of NEC can be nonspecific and difficult to distinguish from other disease processes. Identification of biomarkers for NEC that are both sensitive and specific would be a significant advance in clinical care and facilitate early diagnosis and treatment of neonates with NEC. Serum biomarkers for NEC are a potentially powerful tool that could rapidly differentiate infants with or without disease, but there are currently no effective predictive biomarkers routinely used in clinical practice.
Biomarkers for NEC have previously been investigated using liquid chromatography-tandem mass spectrometry (LC-MS/MS) (9) and enzyme-linked immunosorbent assay (ELISA) (10). This study uses an aptamer-based screening method to determine the relative expression of >1,300 protein targets (SomaScan®). This technology has been used to identify biomarkers in adult and pediatric diseases, including Duchenne's muscular dystrophy, ulcerative colitis, coronary heart disease, and cancer (11–21). Using this assay, we detected ten differentially expressed proteins in the serum of patients with and without NEC. This includes two that were upregulated and eight that were downregulated during NEC. ROC curves indicated that these proteins could effectively discriminate between patients with disease compared to those without. Future studies will focus on validating the efficacy of these potential NEC biomarkers in a larger patient population.
Materials and methods
Study design
In this prospective study, infants admitted to the St. Louis Children's Hospital Neonatal Intensive Care Unit (NICU) in St. Louis, Missouri, USA, were enrolled according to protocols approved by the Washington University in St. Louis School of Medicine Institutional Review Board (IRB protocol numbers 201706182 and 201802101). Infants were eligible for enrollment if they were born between 22 and 42 weeks gestation and either developed NEC or were age-matched controls who did not develop NEC. Infants with any major congenital anomalies were excluded. Clinical information from the infant's medical record was collected from admission until discharge. For the present study, the cohort consisted of infants (n = 18) born between 24 and 36 weeks gestation diagnosed with NEC (n = 12) and age-matched controls (n = 6). Clinical information, demographic information, and NEC severity are summarized in Table 1. Modified Bell's Staging for NEC (7, 22, 23) was used to determine NEC severity.
Table 1
| Infant data | Pregnancy and delivery details | Disease severity | ||||||||||
|---|---|---|---|---|---|---|---|---|---|---|---|---|
| Sample ID | NEC (N) Control (C) | Gestational age | Sex | Birth weight (g) | Race (maternal) | Delivery route | Enrollment | NEC | Highest Bell’s stage | Surgical NEC | Radiographic Findings | Final disposition |
| Age-matched | ||||||||||||
| AM1N | N | 34 0/7 | Female | 2360 | White | CS | Case | Yes | IIA | No | PN | Discharged |
| AM1C | C | 34 6/7 | Female | 1740 | Black | CS | Control | No | Discharged | |||
| AM2N | N | 26 0/7 | Male | 480 | White | CS | Case | Yes | IIB | No | PN | Death |
| AM2C | C | 33 4/7 | Female | 1940 | Unknown | V | Control | No | Discharged | |||
| AM3N | N | 36 2/7 | Female | 2330 | White | CS | Case | Yes | IIB | No | PN, PVG | Discharged |
| AM3C | C | 36 3/7 | Male | 3161 | White | V | Control | No | Discharged | |||
| AM4N | N | 24 5/7 | Male | 640 | White | CS | Case | Yes | IIB | No | PN | Discharged |
| AM4C | C | 26 3/7 | Female | 710 | Black | CS | Control | No | Discharged | |||
| AM5N | N | 31 0/7 | Female | 1190 | White | CS | Case | Yes | IIB | No | PN, PVG | Discharged |
| AM5C | C | 34 0/7 | Male | 2030 | White | V | Control | No | Discharged | |||
| AM6N | N | 24 2/7 | Male | 700 | White | CS | Case | Yes | IIIB | PD, PR | # | Death |
| AM6C | C | 27 0/7 | Male | 1150 | White | V | Control | No | Discharged | |||
| Self-matched | ||||||||||||
| SM1N/C | C+N | 26 0/7 | Female | 830 | Black | CS | Control/Case | Yes | IB | No | N/A | Discharged |
| SM2N/C | C+N | 28 6/7 | Male | 1220 | Black | CS | Control/Case | Yes | IIIA | No | PN, PVG | Discharged |
| SM3N/C | C+N | 25 4/7 | Female | 760 | White | V | Control/Case | Yes | IIIB | PD | PN, PVG, P | Death |
| SM4N/C | C+N | 25 1/7 | Male | 1620 | Black | CS | Control/Case | Yes | IB | No | N/A | Discharged |
| SM5N/C | C+N | 25 0/7 | Male | 760 | Black | CS | Control/Case | Yes | IIA | No | PN | Discharged |
| SM6N/C* | C+N | 24 4/7 | Female | 630 | White | CS | Control/Case | Yes | IIIA | PD | PN, PVG | Death |
Description of patient cohort.
SM6N/C* failed the assay quality control checks and was not included in the study analysis.
N = NEC, C = Control, CS = cesarean section, V = Vaginal delivery, PR = Laparotomy, partial resection, PD = Peritoneal drain, PN = Pneumatosis, PVG = Portal Venous Gas, P = Pneumoperitoneum, # = gasless abdomen, bowel perforation, multiple surgeries for NEC. N/A = Not applicable
Sample collection
Serum samples were collected once at enrollment for all participants (n = 18). A second serum sample was collected at the time of diagnosis if the infant developed NEC after enrollment (n = 6 self-matched infants). Age-matching was performed based on the post-menstrual age (PMA) of infants at the time of NEC diagnosis. There were six age-matched pairs included in this study (n = 12 infants). After collection, serum samples were centrifuged at 3,000 r.p.m. for 10 min, then subsequently aliquoted and stored at −80°C until analysis.
Proteomics assay
An aptamer-based SomaScan® (24) 1,300 serum protein microarray kit was used by the Genome Technology Access Center at the McDonnell Genome Institute at Washington University School of Medicine to identify biomarkers for each of the serum samples and respective controls according to the manufacturer's guidelines (SOMAlogic®, Boulder, CO, USA). Aptamers are 40 base pair oligonucleotides consisting of natural and modified nucleotides. These aptamers, called SOMAmers®, were immobilized on streptavidin beads. Proteins from serum were tagged with biotin, captured as a SOMAmer® reagent/protein pair, cleaved, denatured, and eluted prior to hybridization on a customized Agilent SureScan DNA microarray. We utilized a resolution of 5 µm and detected Cy3 fluorescence expressed as relative fluorescence units (RFU). Off-scanner raw signal values were calibrated, standardized, scaled at 40%, 1%, and 0.005%, and normalized. The RFU readout intensities are directly proportional to the amount of target protein, performed using Agilent Feature Extraction v10.7.3.1. Differential abundance was calculated using the SomaScan® statistical analysis tool v4.1 (SOMAlogic®) and subjected to a linear model fitting of the signal data and an empirical Bayesian statistical test for group comparisons. Samples were screened by row check intensity scaling and target biomarkers by column check quality control intensity scaling, where aberrant intensities are flagged for exclusion during data analysis. One self-matched sample pair (SM6N and SM6C) was excluded from further analysis due to aberrant scaling in the quality control row check. The raw data file is available in Supplementary Table S1.
Statistical analysis
RFU data was normalized by log transformation. Log2 transformations were used to generate volcano plots and heat maps for median and individual sample and target comparisons. A median fold change cut-off value of ≥1.2 and a P-value cut-off of ≤0.05 were used for differentially abundant biomarker selection based on the proteomics data using unmatched and matched sampling. Log2 median fold change transformations of significant proteins were used to create Pearson's correlation matrices and calculate the area under the curve (AUC) for Receiver Operating Characteristics (ROC). Confidence intervals of 95% were calculated by Wilson/Brown method. Log10 transformations, of case and control samples, were used to generate violin plots using the Tukey method and a paired parametric one tailed t-test. A z-score heat map was used to test for variation in case and control samples for each of the differentially abundant targets. All figures and statistics were generated using GraphPad Prism 9.3.1. Gene classification was standardized using the DAVID functional annotation tool (25).
Results
The clinical characteristics of the infants in this study (n = 18) are summarized in Table 1. Patients (n = 6) enrolled at the time of NEC diagnosis were paired with age-matched (n = 6) controls based on post-menstrual age. In addition, patients that were enrolled in our prospective study as controls and subsequently developed NEC (n = 6) were grouped in a self-matched cohort. For the self-matched cohort, we analyzed protein levels in samples obtained at the time of enrollment and upon a diagnosis of NEC. One self-matched pair, patient SM6N/C, was excluded from further analysis due to failed quality control measures, as delineated in the methods section. Thus, 17 infants in total, including 12 in the age-matched and 5 in the self-matched cohort, were included in further analysis.
In this study, we measured the relative abundance of over 1,300 serum proteins using an aptamer-based proteomic assay. Of the over 1,300 analyzed proteins, ten proteins (two increased and eight decreased in relative abundance) were significantly different between patients with NEC and controls (Figure 1). Proteins of interest were selected based on meeting the criteria of a median fold-change of ±1.2 and P-values <0.05 for the log transformed RFU data. Serum proteins that were increased during NEC included C-C motif chemokine ligand 16 (CCL16) and immunoglobulin heavy constant alpha 1 and 2 heterodimer (IGHA1 IGHA2). Proteins that were decreased during NEC included collectin subfamily member 12 (COLEC12), glucagon (GCG), alpha fetoprotein (AFP), formimidoyltransferase cyclodeaminase (FTCD), matrix metallopeptidase 13 (MMP13), glycoprotein hormone alpha polypeptide heterodimer (CGA CGB), MHC class I polypeptide-related sequence A (MICA), and Ephrin A3 (EFNA3). Differentially abundant protein biomarkers are summarized in Table 2.
Figure 1
Table 2
| Protein | Function | Tissue origin | Role in intestinal development, inflammation, and NEC | References | |
|---|---|---|---|---|---|
| Increased in NEC vs. controls | |||||
| C-C motif chemokine 16 | CCL16 | Chemokine | Neonatal liver, macrophages, and lymphocytes |
| (26) |
| (27) | |||||
| (28) | |||||
| Immunoglobulin A | IGHA1 IGHA2 | Mucosal antibody | Maternal milk in neonates |
| (29) |
| (30–32) | |||||
| C-X-C motif chemokine 6 | CXCL6 | Chemokine | Macrophages |
| (33) |
| (34) | |||||
| Decreased in NEC vs. controls | |||||
| Collectin-12 | COLEC12 | Scavenger receptor | Placenta, small intestine, and colon |
| (35) |
| Pro-glucagon | GCG | Intestinal barrier development | Enteroendocrine cells |
| (36) |
| (37) | |||||
| Ephrin-A3 | EFNA3 | Epithelial development | Small intestine and peripheral leukocytes |
| (38) |
| Collagenase 3 | MMP13 | Intestinal barrier function | Chondrocytes, connective and soft tissues |
| (39) |
| MHC class I polypeptide-related sequence A | MICA | Intestinal stress signaling | Gastric epithelium, endothelium, and monocytes |
| (40) |
| Alpha-Fetoprotein | AFP | Plasma transport protein | Fetal liver |
| (41) |
| Human chorionic gonadotropin | CGA CGB | Developmental hormone | Placenta |
| (42) |
| Formimidoyltransferase-cyclodeaminase | FTCD | Histidine metabolism | Fetal liver |
| (43) |
Details of differentially expressed proteins in the serum of neonates with NEC relative to controls.
The relative abundance of the proteins of interest, as determined by Log10 transformations of the RFU values, was compared in serum samples from patients with NEC and controls. We found that all 10 proteins identified in Figure 1 were significantly different between these groups (P < 0.05, Figure 2). CXCL6 was not considered statistically significant (P = 0.051) but was included due to its potential clinical significance as an inflammatory protein. We next generated a heat map to provide a visual representation of the relative abundance of the proteins of interest across self- and age-matched pairs (Figure 3A). There was a remarkable degree of consistency in the patterns of protein expression across patient pairings. Using a heat map (Figure 3B), we observed that protein expression was similar across control samples and that the greatest variation in the matched pairs was present between patients with NEC.
Figure 2
Figure 3
To determine if there was a statistical correlation between different protein levels, parametric two-tailed Pearson's correlation matrixes were generated. We found that the proteins increased in samples from patients with NEC shared positive correlations with each other and an inverse correlation with proteins of decreased abundance in patients with NEC (Figure 4A). All samples correlated positively with the median (Figure 4B) except sample pairs AM1N/C-SM5N/C, SM5N/C-SM2N/C, and SM1N/C-SM3N/C. These sample pairs had significant variations for the following specific proteins (Figure 3A); AM1N/C-SM5N/C for FTCD and CXCL6; SN5N/C-SM2N/C for FTCD and GCG, SM1N/C-SM3/NC for FTCD and CCL16.
Figure 4
Individual biomarker sensitivity vs. specificity for identifying patients with NEC was measured by Receiver Operator Characteristic (ROC) curves and area under the curve (AUC) (Figure 5). ROC curves generated from combined self- and age-matched pairs identify values for given biomarkers where true positive (sensitivity) and percentage of true negative (100% specificity) are the most effective. An AUC value approaching 1 is a perfect diagnostic test. AUC values above 0.7 are considered acceptable, while AUC values above 0.8 are considered good for diagnostic tests. The AUC for proteins increased in the serum of patients with NEC relative to controls were as follows: CCL16 (AUC = 0.744, 95% CI = 0.535–0.953), CXCL6 (AUC = 0.802, 95% CI = 0.587–0.966) and IGHA1 IGHA2 (AUC = 0.826, 95% CI = 0.630–1.00). The AUC for proteins decreased in the serum of patients with NEC relative to controls were: AFP (AUC = 0.926, 95% CI = 0.813–1.00), MMP13 (AUC = 0.777, 95% CI = 0.574–0.980), FTCD (AUC = 0.793, 95% CI = 0.589–0.997), MICA (AUC = 0.802, 95% CI = 0.611–0.992), EFNA3 (AUC = 0.785, 95% CI = 0.589–0.981), GCG (AUC = 0.860, 95% CI = 0.6994–1.00), COLEC12 (AUC = 0.826, 95% CI = 0.650–1.00), and CGA CGB (AUC = 0.752, 95% CI = 0.539–0.966). These values demonstrate high sensitivity vs. specificity for all biomarkers of interest.
Figure 5
Discussion
NEC is a rapidly progressive disease that can be difficult to diagnose using currently available tools. Identification of highly sensitive and specific biomarkers would allow for earlier initiation of potentially lifesaving treatments for neonates with NEC. In this study, we utilized an aptamer-based approach to identify serum proteins that were differentially abundant in samples from infants with NEC relative to controls. Serum proteins that were significantly different between the groups are described in Table 2.
Two proteins were upregulated in the serum of patients with NEC compared to controls, CCL16 and IGHA1 IGHA2. CCL16 is a chemokine produced primarily in the liver and secreted into the blood (27). Its production is induced in monocytes by the cytokines interleukin (IL)-10 and interferon-gamma (IFN-γ) as well as by lipopolysaccharide (LPS) expressed by Gram-negative bacteria (27, 28). CCL16 has been shown to induce lymphocyte and monocyte chemotaxis (26). Increased levels of CCL16 in the serum of neonates with NEC may reflect the inflammatory milieu of the intestine, which would support its use as a biomarker of NEC.
Serum IgA is monomeric (∼90% IGHA1, 10% IGHA2), whereas IgA derived from maternal milk and present in the intestinal mucosa in the form of secretory IgA (s-IgA), is typically a heterodimer of IGHA1 IGHA2 (44). In infants, IgA is derived solely from maternal milk for the first four weeks of life, until B-lymphocytes populate the intestine (30). The increased abundance of IGHA1 IGHA2 in the serum from neonates with NEC may be reflective of the gut barrier dysfunction observed during NEC (45), which would result in increased circulating levels of this primarily intestinal antibody. The level of IgA bound to the Gram-negative Enterobacteriaceae in the stool of preterm neonates is inversely correlated with the risk of NEC (30); however, how serum levels of IGHA1 IGHA2 correlate with NEC has not been previously explored.
We also detected eight proteins that were decreased in the serum of patients with NEC relative to controls. The two proteins that were the most effective at discriminating between patients with and without NEC included AFP (AUC = 0.926) and GCG (AUC = 0.860). AFP is elevated in preterm infants (<37 weeks) and normally decreases rapidly after birth (by 50% in the first 5 days of life in term infants) (41). AFP has been associated with the downregulation of inflammation (46); thus, decreased levels may contribute to the exaggerated inflammatory response observed in neonates with NEC.
GCG regulates blood glucose levels by promoting gluconeogenesis and glycogenolysis. Pro-glucagon is cleaved into several peptides involved in glucose metabolism and gastric function. Importantly, one of the peptide products, glucagon-like peptide 2 (GLP-2), decreases enterocyte apoptosis and stimulates intestinal growth, crypt cell proliferation, and villus formation (36). GLP-2 was also shown to have a protective and anti-inflammatory role in a rat model of NEC (37). It is possible that reduced levels of GCG found in the serum of patients with NEC may indicate that decreased GCG-mediated intestinal protection was associated with increased intestinal injury.
To our knowledge, this is the first study to analyze serum proteins using an aptamer-based assay on samples derived from infants with or without NEC. The traditional technique for differential analysis and quantitative proteomics is liquid chromatography coupled with mass spectrometry (LC-MS/MS). However, improvements in affinity capture and quantitation methods have allowed for alternative methods, which can address biases and limitations in LC-MS/MS and other platforms. A comparative analysis of LC-MS/MS, RNA sequencing, and SomaScan® analysis of mesenchymal and human embryonic stem cells showed a greater identification of unique markers using SomaScan® than LC-MS/MS and RNA sequencing. The benefits of this aptamer-based technology include a high dynamic range, low sample requirements (20 µg protein to 50 µl serum), and high sensitivity with improved detection of small molecule targets (47). This improvement in technology facilitated our detection of new potential serum biomarkers for NEC.
Limitations of this study included the relatively small sample size, the inability to match patients based on factors other than age, and the inclusion of two patients with Stage 1B NEC. This is a pilot study that will be expanded upon in future studies involving larger patient cohorts, which will allow for more detailed matching of patient characteristics and stratification of patients based on disease severity.
Studies analyzing serum biomarkers in preterm infants are complicated by several factors, including limited sample volumes, inflammatory proteins not specific for NEC, and age-specific changes in protein levels (48). We attempted to overcome these challenges by using an assay with high sensitivity, which allowed the detection of protein levels with a small volume of blood. In addition, we utilized age matching to limit confounding in our comparison of serum protein levels. We also found similar patterns of protein abundance in the age-matched and self-matched cohorts, which pointed to differences in protein levels being related to NEC and not post-menstrual age in the self-matched group. Finally, this study employed an unbiased screening approach, which provided the highest likelihood of identifying new biomarkers for NEC.
In conclusion, serum protein levels from infants with NEC were compared to controls using an aptamer-based proteomic assay with the successful identification of 10 proteins that were able to differentiate between the groups. Future studies will focus on the validation of these results in a larger patient cohort. The overarching goal is to improve the speed and accuracy in which clinicians can diagnose NEC to improve outcomes for critically ill neonates.
Statements
Data availability statement
The original data presented in the study are included in the article/Supplementary Material, further inquiries can be directed to the corresponding author.
Ethics statement
The studies involving human participants were reviewed and approved by the Washington University in St. Louis School of Medicine Institutional Review Board (IRB protocol numbers 201706182 and 201802101). Written informed consent to participate in this study was provided by the participants’ legal guardian/next of kin.
Author contributions
SM, LF, GB, and MG: contributed to the writing—original draft preparation, review, and editing all versions of the manuscript. SM and DS: analyzed data. GB, QG, OD, and MG: consented patients and/or obtained samples. CM, LF, and MG: created/edited the graphical abstract. All authors contributed to the article and approved the submitted version.
Funding
LF is supported by a Thrasher Research Fund Early Career Award and a UNC Children's Development Early Career Investigator Grant through the generous support of donors to UNC. MG is supported by National Institutes of Health (NIH) grants R01DK124614, R01DK118568, and R01HD105301, the Chan Zuckerberg Initiative Grant number 2022-316749, the University of North Carolina at Chapel Hill Department of Pediatrics, and appreciates the kind support from Washington University in St. Louis Department of Pediatrics.
Acknowledgments
We would like to thank the patients and their families for their contributions to the NEC Biorepository. We are also grateful to the nurses and research coordinators at St. Louis Children's Hospital Neonatal Intensive Care Unit for assistance in patient recruitment and sample collection. Additionally, we thank the Genome Technology Access Center (GTAC) at the McDonnell Genome Institute at Washington University School of Medicine for performing the proteomics assay. GTAC is partially supported by NCI Cancer Center Support Grant #P30 CA91842 to the Siteman Cancer Center from the National Center for Research Resources (NCRR), a component of the National Institutes of Health (NIH), and NIH Roadmap for Medical Research. We also would like to thank Chelsea Anderson, PhD, MPH at the UNC Center for Gastrointestinal Biology and Disease for her biostatistical support. This publication is solely the responsibility of the authors and does not necessarily represent the official view of NCRR or NIH.
Conflict of interest
The authors declare that the research was conducted in the absence of any commercial or financial relationships that could be construed as a potential conflict of interest.
Publisher’s note
All claims expressed in this article are solely those of the authors and do not necessarily represent those of their affiliated organizations, or those of the publisher, the editors and the reviewers. Any product that may be evaluated in this article, or claim that may be made by its manufacturer, is not guaranteed or endorsed by the publisher.
Supplementary material
The Supplementary Material for this article can be found online at: https://www.frontiersin.org/articles/10.3389/fped.2023.1184940/full#supplementary-material
References
1.
BattersbyCSanthalingamTCosteloeKModiN. Incidence of neonatal necrotising enterocolitis in high-income countries: a systematic review. Arch Dis Child Fetal Neonatal Ed. (2018) 103(2):F182–9. 10.1136/archdischild-2017-313880
2.
VaidyaRYiJO’SheaTJensenEJosephRShenbergerJet alLong-term outcome of necrotizing enterocolitis and spontaneous intestinal perforation. Pediatrics. (2022) 150(5):e2022056445. 10.1542/peds.2022-056445
3.
ZozayaCGarcía GonzálezIAvila-AlvarezAOikonomopoulouNSánchez TamayoTSalgueroEet alIncidence, treatment, and outcome trends of necrotizing enterocolitis in preterm infants: a multicenter cohort study. Front Pediatr. (2020) 8:188. 10.3389/fped.2020.00188
4.
NagpalRTsujiHTakahashiTNomotoKKawashimaKNagataSet alGut dysbiosis following C-section instigates higher colonisation of toxigenic clostridium perfringens in infants. Benef Microbes. (2017) 8(3):353–65. 10.3920/BM2016.0216
5.
NiñoDFSodhiCPHackamDJ. Necrotizing enterocolitis: new insights into pathogenesis and mechanisms. Nat Rev Gastroenterol Hepatol. (2016) 13(10):590–600. 10.1038/nrgastro.2016.119
6.
SampahMESHackamDJ. Dysregulated mucosal immunity and associated pathogeneses in preterm neonates. Front Immunol. (2020) 11:899. 10.3389/fimmu.2020.00899
7.
NeuJModiNCaplanM. Necrotizing enterocolitis comes in different forms: historical perspectives and defining the disease. Semin Fetal Neonatal Med. (2018) 23(6):370–3. 10.1016/j.siny.2018.07.004
8.
SinghDKMillerCMOrgelKADaveMMackaySGoodM. Necrotizing enterocolitis: bench to bedside approaches and advancing our understanding of disease pathogenesis. Front Pediatr. (2022) 10:1107404. 10.3389/fped.2022.1107404
9.
WangKTaoGSunZSylvesterKG. Recent potential noninvasive biomarkers in necrotizing enterocolitis. Gastroenterol Res Pract. (2019) 2019:8413698. 10.1155/2019/8413698
10.
HoffstenAMarkaszLLiljaHEOlssonKWSindelarR. Early postnatal comprehensive biomarkers cannot identify extremely preterm infants at risk of developing necrotizing enterocolitis. Front Pediatr. (2021) 9:755437. 10.3389/fped.2021.755437
11.
OstroffRMBigbeeWLFranklinWGoldLMehanMMillerYEet alUnlocking biomarker discovery: large scale application of aptamer proteomic technology for early detection of lung cancer. PLoS One. (2010) 5(12):e15003. 10.1371/journal.pone.0015003
12.
OstroffRMMehanMRStewartAAyersDBrodyENWilliamsSAet alEarly detection of malignant pleural mesothelioma in asbestos-exposed individuals with a noninvasive proteomics-based surveillance tool. PLoS One. (2012) 7(10):e46091. 10.1371/journal.pone.0046091
13.
GanzPHeideckerBHveemKJonassonCKatoSSegalMRet alDevelopment and validation of a protein-based risk score for cardiovascular outcomes among patients with stable coronary heart disease. JAMA. (2016) 315(23):2532–41. 10.1001/jama.2016.5951
14.
MehanMRWilliamsSASiegfriedJMBigbeeWLWeissfeldJLWilsonDOet alValidation of a blood protein signature for non-small cell lung cancer. Clin Proteomics. (2014) 11(1):32. 10.1186/1559-0275-11-32
15.
StanleySVanarsaKSolimanSHabaziDPedrozaCGidleyGet alComprehensive aptamer-based screening identifies a spectrum of urinary biomarkers of lupus nephritis across ethnicities. Nat Commun. (2020) 11(1):2197. 10.1038/s41467-020-15986-3
16.
HathoutYBrodyEClemensPRCripeLDeLisleRKFurlongPet alLarge-scale serum protein biomarker discovery in duchenne muscular dystrophy. Proc Natl Acad Sci U S A. (2015) 112(23):7153–8. 10.1073/pnas.1507719112
17.
De GrooteMANahidPJarlsbergLJohnsonJLWeinerMMuzanyiGet alElucidating novel serum biomarkers associated with pulmonary tuberculosis treatment. PLoS One. (2013) 8(4):e61002. 10.1371/journal.pone.0061002
18.
SattleckerMKiddleSJNewhouseSProitsiPNelsonSWilliamsSet alAlzheimer’s disease biomarker discovery using SOMAscan multiplexed protein technology. Alzheimers Dement. (2014) 10(6):724–34. 10.1016/j.jalz.2013.09.016
19.
AlbabaDSoomroSMohanC. Aptamer-based screens of human body fluids for biomarkers. Microarrays. (2015) 4(3):424–31. 10.3390/microarrays4030424
20.
SoomroSVenkateswaranSVanarsaKKharboutliMNidhiMSusarlaRet alPredicting disease course in ulcerative colitis using stool proteins identified through an aptamer-based screen. Nat Commun. (2021) 12(1):3989. 10.1038/s41467-021-24235-0
21.
BonarotiJBilliarIMoheimaniHWuJNamasRLiSet alPlasma proteomics reveals early, broad release of chemokine, cytokine, TNF, and interferon mediators following trauma with delayed increases in a subset of chemokines and cytokines in patients that remain critically ill. Front Immunol. (2022) 13:1038086. 10.3389/fimmu.2022.1038086
22.
BellMJTernbergJLFeiginRDKeatingJPMarshallRBartonLet alNeonatal necrotizing enterocolitis. Therapeutic decisions based upon clinical staging. Ann Surg. (1978) 187(1):1–7. 10.1097/00000658-197801000-00001
23.
WalshMCKliegmanRM. Necrotizing enterocolitis: treatment based on staging criteria. Pediatr Clin North Am. (1986) 33(1):179–201. 10.1016/S0031-3955(16)34975-6
24.
GoldLAyersDBertinoJBockCBockABrodyENet alAptamer-based multiplexed proteomic technology for biomarker discovery. PLoS One. (2010) 5(12):e15004. 10.1371/journal.pone.0015004
25.
DennisGShermanBTHosackDAYangJGaoWLaneHCet alDAVID: database for annotation, visualization, and integrated discovery. Genome Biol. (2003) 4(5):3. 10.1186/gb-2003-4-5-p3
26.
YounBSZhangSBroxmeyerHEAntolKFraserMJJrHangocGet alIsolation and characterization of LMC, a novel lymphocyte and monocyte chemoattractant human CC chemokine, with myelosuppressive activity. Biochem Biophys Res Commun. (1998) 247(2):217–22. 10.1006/bbrc.1998.8762
27.
NakayamaTKatoYHieshimaKNagakuboDKunoriYFujisawaTet alLiver-expressed chemokine/CC chemokine ligand 16 attracts eosinophils by interacting with histamine H4 receptor. J Immunol. (2004) 173(3):2078–83. 10.4049/jimmunol.173.3.2078
28.
NomiyamaHHieshimaKNakayamaTSakaguchiTFujisawaRTanaseSet alHuman CC chemokine liver-expressed chemokine/CCL16 is a functional ligand for CCR1, CCR2 and CCR5, and constitutively expressed by hepatocytes. Int Immunol. (2001) 13(8):1021–9. 10.1093/intimm/13.8.1021
29.
WoofJMRussellMW. Structure and function relationships in IgA. Mucosal Immunol. (2011) 4(6):590–7. 10.1038/mi.2011.39
30.
GopalakrishnaKPMacadangdangBRRogersMBTometichJTFirekBABakerRet alMaternal IgA protects against the development of necrotizing enterocolitis in preterm infants. Nat Med. (2019) 25(7):1110–5. 10.1038/s41591-019-0480-9
31.
GopalakrishnaKPHandTW. Influence of maternal milk on the neonatal intestinal microbiome. Nutrients. (2020) 12(3):823. 10.3390/nu12030823
32.
BrawnerKMYeramilliVAKennedyBAPatelRKMartinCA. Prenatal stress increases IgA coating of offspring microbiota and exacerbates necrotizing enterocolitis-like injury in a sex-dependent manner. Brain Behav Immun. (2020) 89:291–9. 10.1016/j.bbi.2020.07.008
33.
WangXLiJWangZDengA. Wound exudate CXCL6: a potential biomarker for wound healing of diabetic foot ulcers. Biomark Med. (2019) 13(3):167–74. 10.2217/bmm-2018-0339
34.
WangXDaiYZhangXPanKDengYWangJet alCXCL6 regulates cell permeability, proliferation, and apoptosis after ischemia-reperfusion injury by modulating Sirt3 expression via AKT/FOXO3a activation. Cancer Biol Ther. (2021) 22(1):30–9. 10.1080/15384047.2020.1842705
35.
BogieJFJMailleuxJWoutersEJorissenWGrajchenEVanmolJet alScavenger receptor collectin placenta 1 is a novel receptor involved in the uptake of myelin by phagocytes. Sci Rep. (2017) 7:44794. 10.1038/srep44794
36.
DruckerDJ. Glucagon-like peptides: regulators of cell proliferation, differentiation, and apoptosis. Mol Endocrinol. (2003) 17(2):161–71. 10.1210/me.2002-0306
37.
NakameKKajiTMukaiMShinyamaSMatsufujiH. The protective and anti-inflammatory effects of glucagon-like peptide-2 in an experimental rat model of necrotizing enterocolitis. Peptides. (2016) 75:1–7. 10.1016/j.peptides.2015.07.025
38.
IvanovAIRomanovskyAA. Putative dual role of ephrin-eph receptor interactions in inflammation. IUBMB Life. (2006) 58(7):389–94. 10.1080/15216540600756004
39.
VandenbrouckeREDejonckheereEVan HauwermeirenFLodensSDe RyckeRVan WonterghemEet alMatrix metalloproteinase 13 modulates intestinal epithelial barrier integrity in inflammatory diseases by activating TNF. EMBO Mol Med. (2013) 5(7):1000–16. 10.1002/emmm.201202100
40.
AllegrettiYLBondarCGuzmanLCueto RuaEChopitaNFuertesMet alBroad MICA/B expression in the small bowel mucosa: a link between cellular stress and celiac disease. PLoS One. (2013) 8(9):e73658. 10.1371/journal.pone.0073658
41.
BlohmMEVesterling-HörnerDCalaminusGGöbelU. Alpha 1-fetoprotein (AFP) reference values in infants up to 2 years of age. Pediatr Hematol Oncol. (1998) 15(2):135–42. 10.3109/08880019809167228
42.
BarjaktarovicMKorevaarTIJaddoeVWde RijkeYBVisserTJPeetersRPet alHuman chorionic gonadotropin (hCG) concentrations during the late first trimester are associated with fetal growth in a fetal sex-specific manner. Eur J Epidemiol. (2017) 32(2):135–44. 10.1007/s10654-016-0201-3
43.
JiangYNYeYXSangildPTThymannTEngelsenSBKhakimovBet alPlasma metabolomics to evaluate progression of necrotising enterocolitis in preterm pigs. Metabolites. (2021) 11(5):283. 10.3390/metabo11050283
44.
LeongKWDingJL. The unexplored roles of human serum IgA. DNA Cell Biol. (2014) 33(12):823–9. 10.1089/dna.2014.2639
45.
HalpernMDDenningPW. The role of intestinal epithelial barrier function in the development of NEC. Tissue Barriers. (2015) 3(1-2):e1000707. 10.1080/21688370.2014.1000707
46.
LinsonEAHanauerSB. More than a tumor marker…a potential role for alpha-feto protein in inflammatory bowel disease. Inflamm Bowel Dis. (2019) 25(7):1271–6. 10.1093/ibd/izy394
47.
BillingAMBen HamidaneHBhagwatAMCottonRJDibSSKumarPet alComplementarity of SOMAscan to LC-MS/MS and RNA-seq for quantitative profiling of human embryonic and mesenchymal stem cells. J Proteomics. (2017) 150:86–97. 10.1016/j.jprot.2016.08.023
48.
ZhongWDanielssonHTebaniAKarlssonMJElfvinAHellgrenGet alDramatic changes in blood protein levels during the first week of life in extremely preterm infants. Pediatr Res. (2021) 89(3):604–12. 10.1038/s41390-020-0912-8
Summary
Keywords
necrotizing enterocolitis, prematurity, aptamer, SomaScan, serum, biomarker
Citation
Mackay S, Frazer LC, Bailey GK, Miller CM, Gong Q, Dewitt ON, Singh DK and Good M (2023) Identification of serum biomarkers for necrotizing enterocolitis using aptamer-based proteomics. Front. Pediatr. 11:1184940. doi: 10.3389/fped.2023.1184940
Received
12 March 2023
Accepted
10 May 2023
Published
31 May 2023
Volume
11 - 2023
Edited by
Zhangbin Yu, First Affiliated Hospital of Southern University of Science and Technology, China
Reviewed by
Alain Cuna, Children's Mercy Kansas City, United States Yuying Liu, University of Texas Health Science Center at Houston, United States
Updates
Copyright
© 2023 Mackay, Frazer, Bailey, Miller, Gong, DeWitt, Singh and Good.
This is an open-access article distributed under the terms of the Creative Commons Attribution License (CC BY). The use, distribution or reproduction in other forums is permitted, provided the original author(s) and the copyright owner(s) are credited and that the original publication in this journal is cited, in accordance with accepted academic practice. No use, distribution or reproduction is permitted which does not comply with these terms.
*Correspondence: Misty Good mistygood@unc.edu
Disclaimer
All claims expressed in this article are solely those of the authors and do not necessarily represent those of their affiliated organizations, or those of the publisher, the editors and the reviewers. Any product that may be evaluated in this article or claim that may be made by its manufacturer is not guaranteed or endorsed by the publisher.