 Yiwei Yue
 Qian Zhang
 Ji Li
Ji Li- Department of Pediatric Surgery, The First Affiliated Hospital of Zhengzhou University, Zheng Zhou, China
Background: Urogenital congenital anomalies (UCAs) are among the most common organ system abnormalities in the neonate. This study employs Global Burden of Disease, Injury, and Risk Factor Study 2021 (GBD 2021) to systematically quantify the global epidemiological burden of UCAs from 1990 to 2021, examining geographic variations and temporal trends.
Materials and methods: Data were extracted from the GBD 2021. We focused on UCAs-related metrics: prevalence, incidence, deaths, and disability-adjusted life years (DALYs) across 204 countries and territories, grouped into 5 or 21 GBD regions by the socio-demographic index (SDI). Data analysis encompassed relative change calculations, as well as annual percentage change (APC) and average annual percentage change (AAPC), both of which are based on joinpoint regression analysis. The study additionally employed decomposition analysis, frontier analysis and cross-country health inequality analysis. Analyses utilized R version 4.3.1.
Results: From 1990 to 2021, the global prevalence of UCAs cases surged by 21%, exceeding 6.34 million, accompanied by an increase in age-standardized rates. Incidence, mortality, and DALYs experienced declines in both absolute figures and age-standardized rates. Gender-specific trends from 1990 to 2021 revealed that females dominated in prevalence, while males had higher mortality and DALYs burden. Regionally, Southern Sub-Saharan Africa exhibited the highest prevalence, while Oceania and East Asia showed significant increases and decreases, respectively. Decomposition analysis of change in prevalence indicated that, globally, population contributed the most to changes in prevalence, followed by aging and epidemiological change. Frontier analysis of 204 countries and regions linked higher SDIs to lower UCAs prevalence. However, unexpected deviations were observed in some high SDI countries, such as Singapore and South Korea. Health inequality analysis revealed that the health inequality in prevalence between high-income and low-income countries decreased in 2021, although the burden became more concentrated in low-income countries.
Conclusion: Our analysis highlights the intricate relationship between socio-demographic factors and UCAs trends, underscoring the urgent need for targeted and context-specific healthcare interventions. While significant advancements have been made, sustained vigilance and ongoing research remain critical to achieving effective global management of UCAs.
Introduction
Urogenital congenital anomalies (UCAs) are defined as “any live birth with a urinary or genital condition.” These conditions are often detected either prenatally or immediately after birth, though a significant proportion is identified in older children, presenting with varying degrees of severity (1). UCAs frequently manifest as urinary incontinence, recurrent urinary tract infections, atypical genitalia, or other abdominal complications resulting from congenital abnormalities of the urinary system (2). Unfortunately, UCAs are not only a significant cause of postnatal mortality but also contribute to poor long-term health outcomes (3). With the global population increasing and demographic structures shifting, understanding the comprehensive burden of these conditions has become critically important.
The Global Burden of Disease (GBD) study provides a valuable platform for assessing the health impact of a wide range of diseases and injuries (4). By leveraging this resource, researchers and policymakers can gain insights into the prevalence, incidence, mortality, and disability-adjusted life years (DALYs) associated with specific conditions, offering a panoramic view of their global, regional, and national impacts (5–7). Although the impact of urogenital congenital anomalies on global health is well-established, systematic analyses of their comprehensive burden, particularly those utilizing GBD data, remain sparse.
Furthermore, while statistical assessments provide a foundational understanding, complementary analyses such as decomposition, frontier, and health inequality analyses offer deeper insights into the complexities of the data, painting a more nuanced picture of disease impacts. Decomposition analysis disaggregates the changes in key indicators of UCAs from 1990 to 2021 into three explanatory factors: population growth, aging, and epidemiological changes (8). Frontier analysis establishes a benchmark based on countries with the lowest disease burden at each respective SDI level, defining an efficiency frontier. The greater the distance between a country's actual disease burden and this frontier, the larger the potential for improvement in reducing its burden (9). Health inequality analysis assesses both absolute and relative disparities in UCAs burden by calculating the slope index of inequality and the concentration index, respectively (10). These advanced analyses benchmark health performance against the best-performing counterparts, providing insights into potential areas for improvement and driving more effective health responses.
Given these gaps in research and the immense value such studies can bring, our research aims to systematically elucidate the global, regional, and national burdens of urogenital congenital anomalies. Utilizing the GBD dataset, this study offers a comprehensive perspective on the prevalence, incidence, mortality, and DALYs associated with these conditions. We identified and discussed critical trends, conducted decomposition analyses, and performed cross-country health inequality analyses that account for the sociodemographic index (SDI) to gain a deeper understanding of the global burden of UCAs. Through this rigorous exploration, our work seeks to reveal the scale and intricacies of UCAs worldwide, providing evidence to inform healthcare decisions and contributing significantly to the existing body of knowledge. This cross-sectional study has been reported in line with the STROCSS guidelines (11).
Methods
Research population and data compilation
Data on the UCAs burden from 1990 to 2021 were obtained from the Global Health Data Exchange GBD Results Tool (http://ghdx.healthdata.org/gbd-results-tool) (date of data extraction, November 12, 2024). In this study, UCAs were defined as any live births with a urinary or genital condition, including congenital malformation of the collecting system, ureter, bladder, and kidney; bladder exstrophy and epispadias; hypospadias; ambiguous or indeterminate sex; and other genital malformations according to GBD (https://www.healthdata.org).
Our study focused on four key metrics: prevalence, incidence, mortality, and DALYs associated with UCAs. In accordance with the GBD framework, 95% uncertainty intervals (UIs) were computed for all final estimates as the 2.5th and 97.5th percentiles values of 500 or 1,000 draws. The analysis covered the time span from 1990 to 2021, including annual statistics across different age groups, sexes, and regions. Our study encompassed 204 countries and territories, grouped into 21 GBD regions based on geographic proximity and further categorized into five categories according to the socio-demographic index (SDI).
SDI
The SDI is a composite metric developed by GBD researchers to assess the socio-economic status of a region. It integrates per capita income, educational attainment, and fertility rates into a single index ranging from 0 to 1, reflecting the socio-economic health and progress of a region or country (4, 12). Higher SDI values correspond to better socio-economic conditions and improved health outcomes. Based on SDI values, regions are divided into five quintiles: low-SDI, low-middle-SDI, middle-SDI, high-middle-SDI, and high-SDI.
Data analysis
Our data analysis began with an exploration of the dataset's structure, calculating counts and rates for key measures such as prevalence, incidence, mortality, and DALYs of UCAs at the global, regional, and national levels. We then analyzed changes in these metrics across different regions from 1990 to 2021. To determine relative changes, we used the formula:
This formula was applied to both case numbers and age-standardized rates (ASRs) per 100,000 population (13).
To analyze trends in UCAs, we used statistical methods, including annual percentage change (APC) to assess year-to-year variations and average annual percentage change (AAPC) to capture average trend over specified periods (14, 15).
Significant changes in data trends over time were identified using joinpoint regression analysis, which differentiates genuine trends from random fluctuations. This method uses statistical criteria to determine the minimum number of linear segments required to describe a trend. The software calculates the APC for each segment, as well as the AAPC over the entire study period, along with the corresponding 95% CIs, allowing us to assess the direction, magnitude, and significance of the observed trends. Pearson correlation was applied to explore the relationship between the SDI and UCAs indicators, assessing the strength and direction of these relationships across regions.
Decomposition analysis was performed to examine the underlying factors contributing to changes in UCAs epidemiology over the defined time periods at the global, regional and national levels (8). Changes in prevalence, mortality, and DALYs due to UCAs were decomposed into population, aging and epidemiological change. This allowed for a quantified understanding of the drivers behind these trends.
To benchmark UCAs burdens, frontier analysis compared the performance of countries and regions against the best-performing counterparts, identifying gaps and opportunities for improvement (9). We calculated the “effective difference,” representing the disparity between observed and potential burden, while accounting for SDI.
Health inequalities in UCAs burdens were assessed using the slope index of inequality and the concentration index of health inequality (10). Regression analyses were performed with incidence, prevalence, mortality and DALYs as dependent variables and socioeconomic status (defined as the midpoint of the cumulative class interval of the population sorted by gross domestic product per capita) as the independent variable. Heteroskedasticity was calculated using a weighted regression model. The concentration index of health inequality was calculated by fitting a Lorenz curve, with the area under the curve reflecting the degree of concentration of health burden among income groups. Statistical analyses were executed using R version 4.3.1.
Results
Global trends
From 1990 to 2021, the global UCAs prevalence increased from 5.22 million to 6.34 million, representing a 21% rise in number (Table 1). The age-standardized prevalence rates also increased, from 86.34 per 100,000 to 89.76 per 100,000, a growth of 3.96%. However, the global incidence decreased from 1.16 million to 1.09 million, reflecting a 6.25% absolute reduction (Table 2). The age-standardized incidence rate declined from 18.21 per 100,000 to 17.49 per 100,000, a 2.86% decrease. Mortality dropped by 22.56%, with the age-standardized mortality rate falling by 20% (Table 3). Similarly, DALYs, a measure of global disease burden, decreased by 15.44% in absolute numbers, with age-standardized DALYs dropping by 18.46% (Table 4).
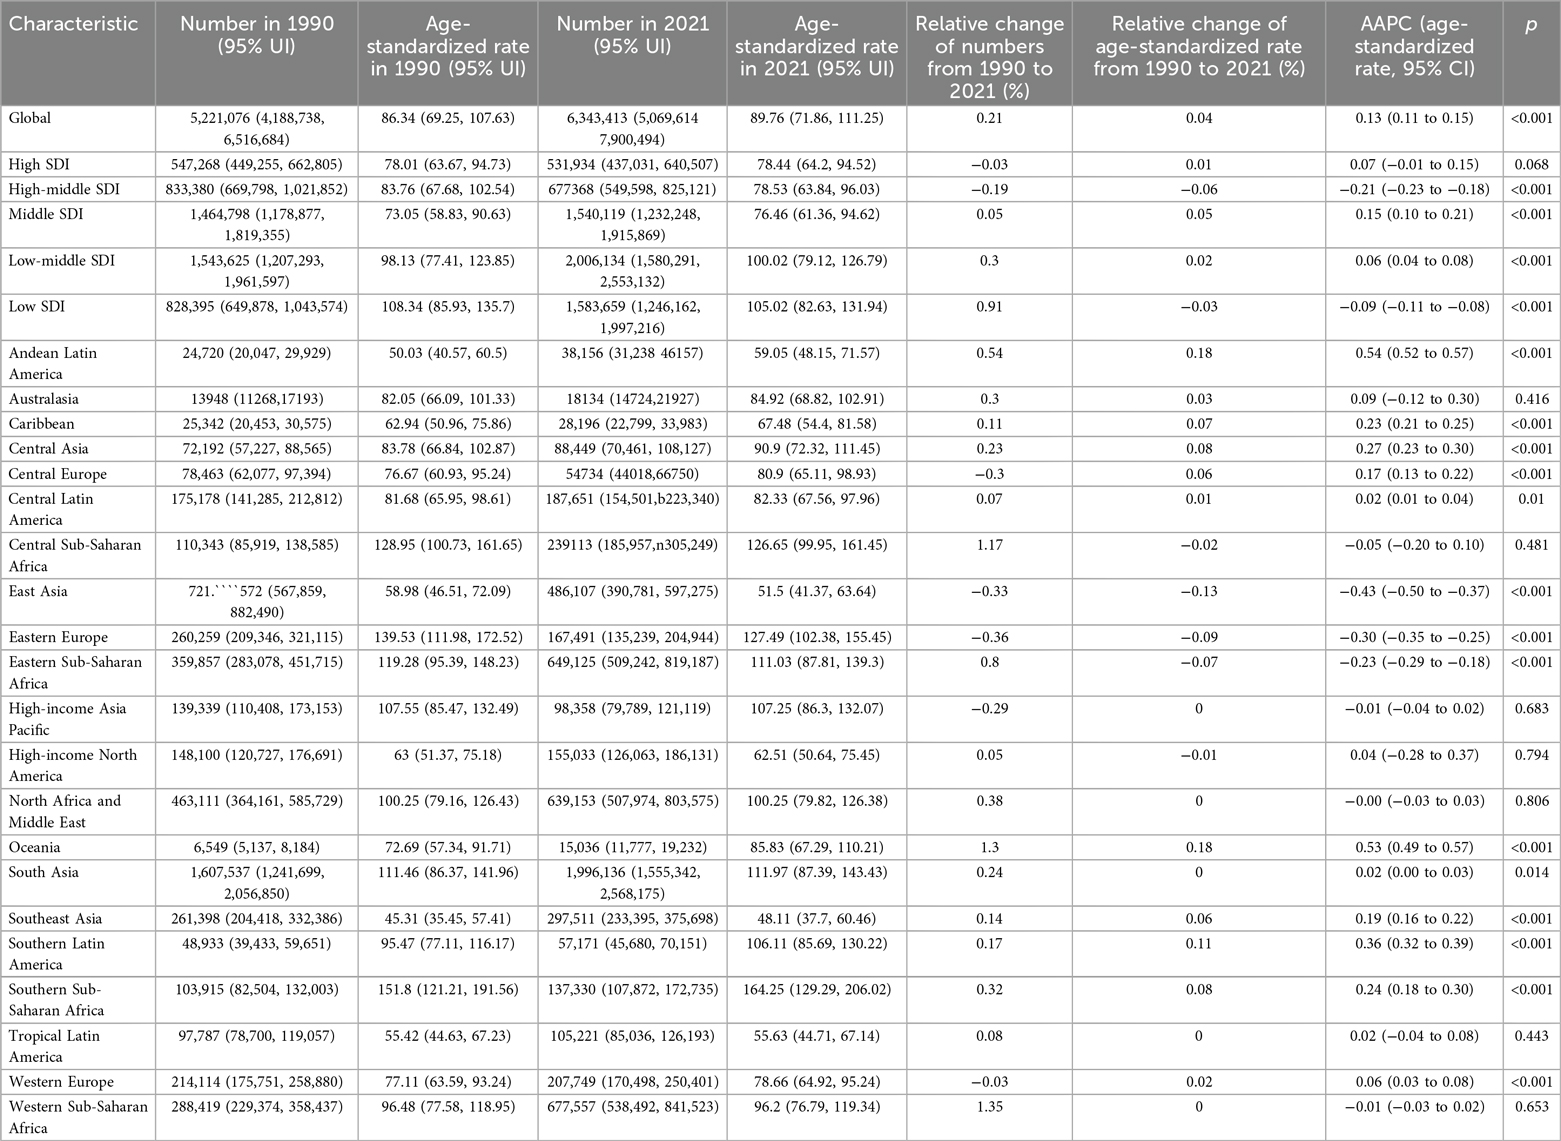
Table 1. Numbers and ASRs per 100,000 cases of prevalence of urogenital congenital anomalies in 1990 and 2021, along with the relative changes and AAPC in ASRs per 100 000 cases from 1990 to 2021, categorized by global, SDI, and GBD regions.
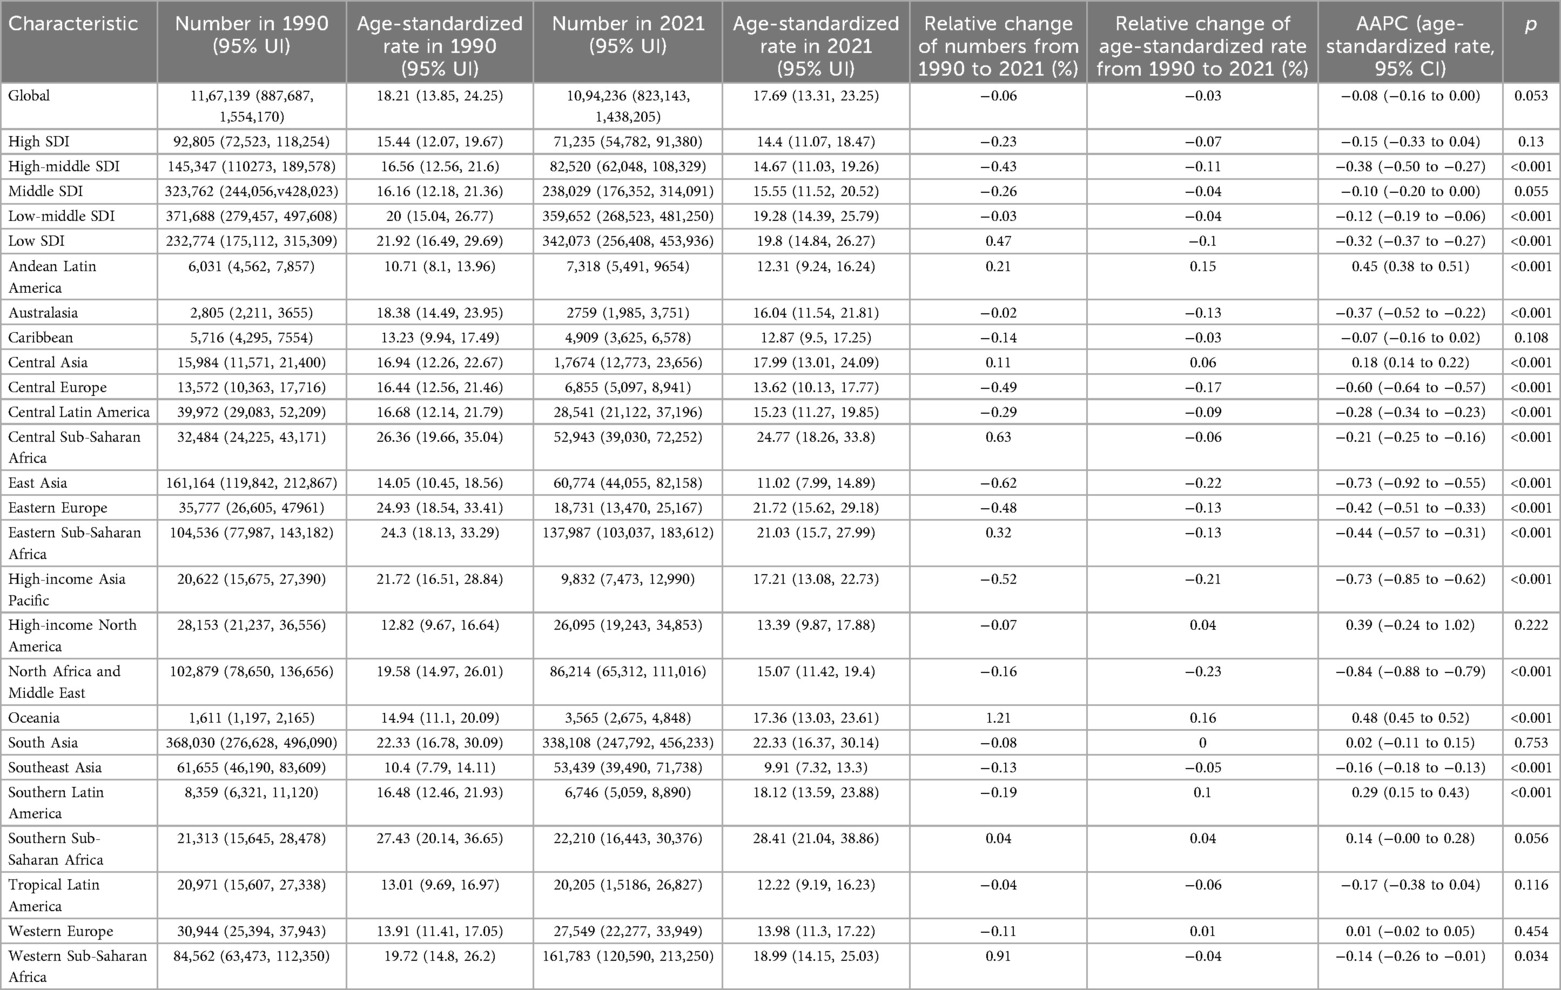
Table 2. Numbers and ASRs per 100,000 cases of incidence of urogenital congenital anomalies in 1990 and 2021, along with the relative changes and AAPC in ASRs per 100 000 cases from 1990 to 2021, categorized by global, SDI, and GBD regions.
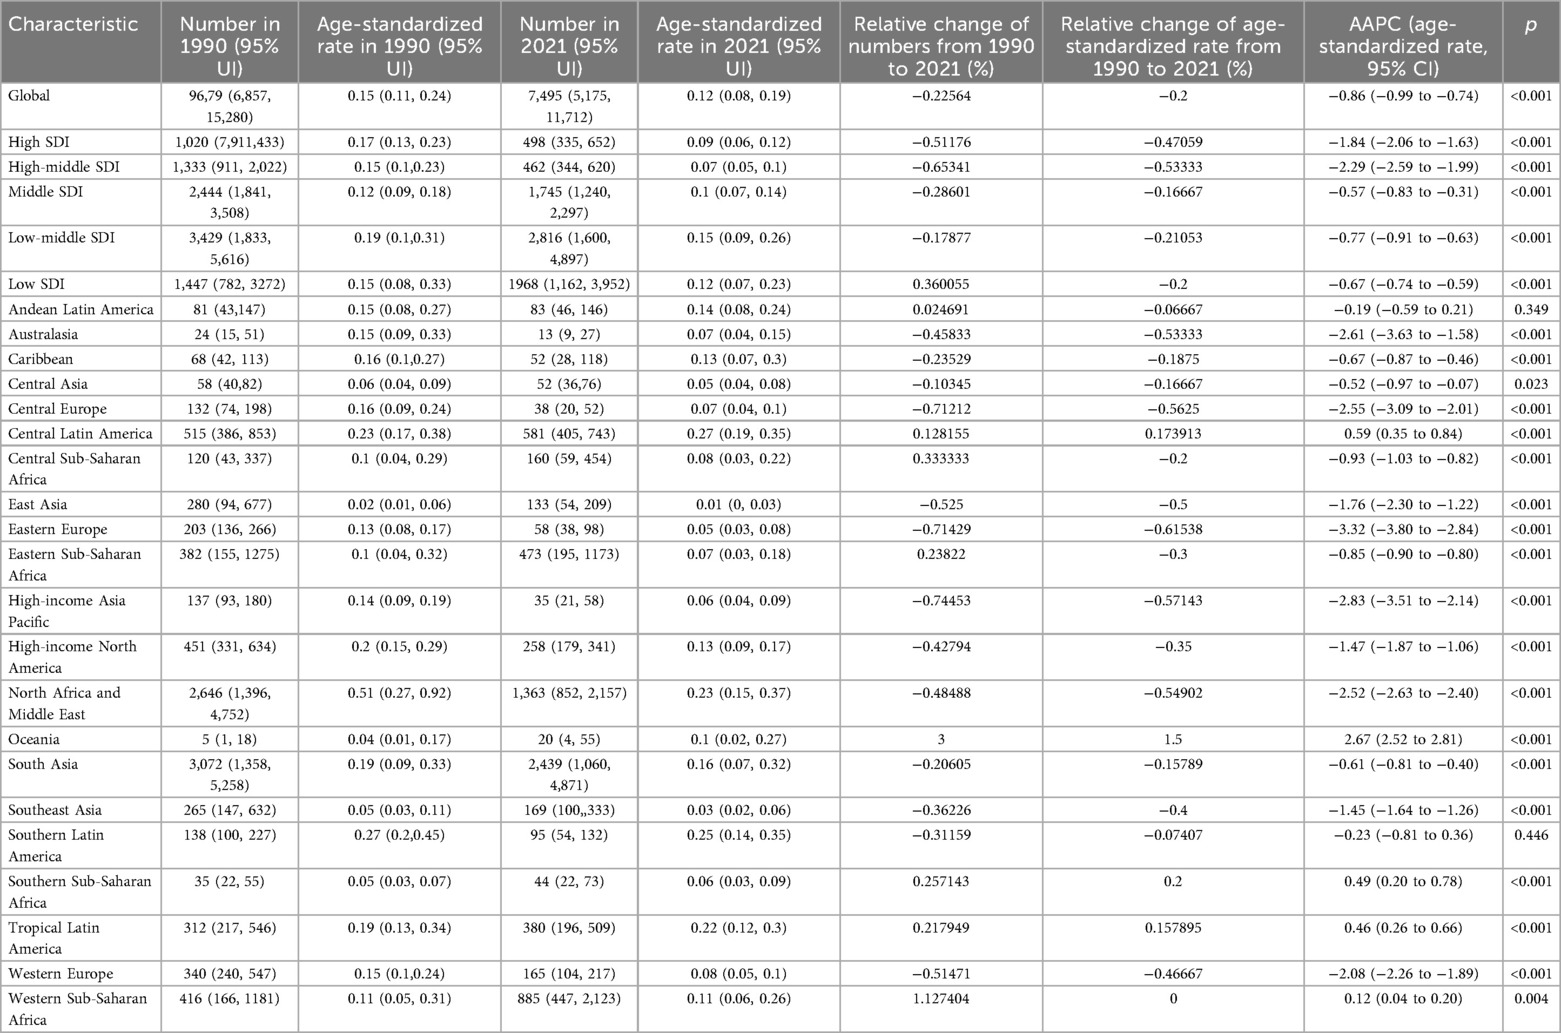
Table 3. Numbers and ASRs per 100,000 cases of deaths of urogenital congenital anomalies in 1990 and 2021, along with the relative changes and AAPC in ASRs per 100,000 cases from 1990 to 2021, categorized by global, SDI, and GBD regions.
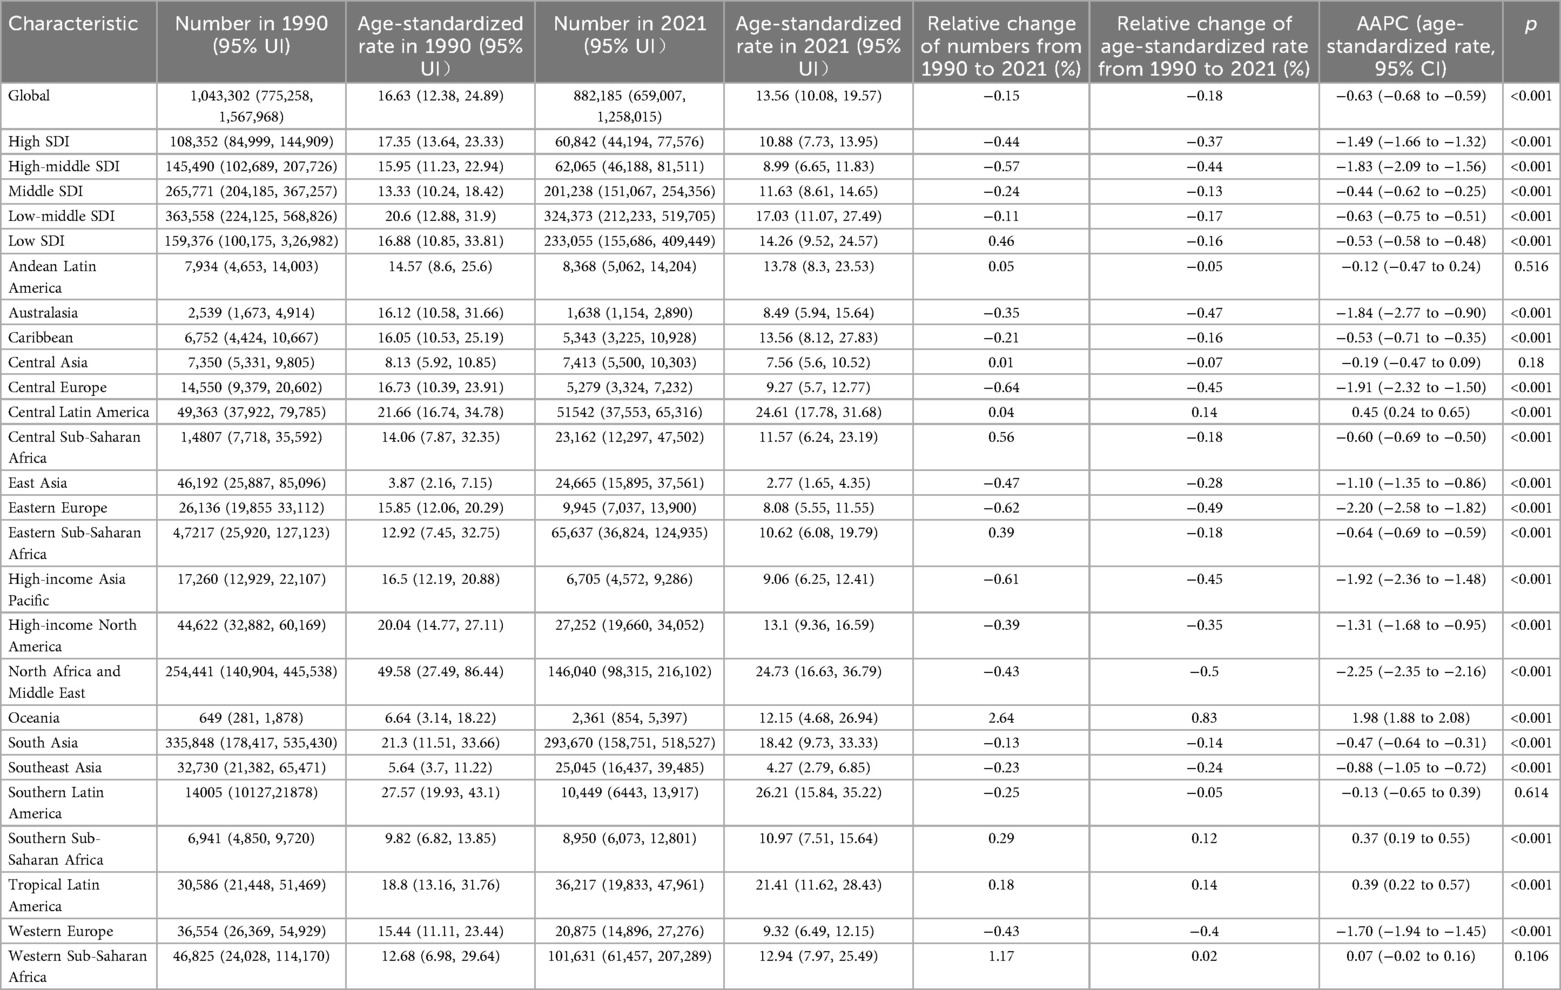
Table 4. Numbers and ASRs per 100,000 cases of DALYs of urogenital congenital anomalies in 1990 and 2021, along with the relative changes and AAPC in ASRs per 100 000 cases from 1990 to 2021, categorized by global, SDI, and GBD regions.
Further analysis using APC and AAPC revealed varying trends. Prevalence showed notable increases during 1999–2005 and 2019–2021, with APC values of 0.35% (95% CI: 0.32%, 0.39%) and 1.09% (95% CI: 0.95%, 1.23%), respectively, and an overall AAPC of 0.13% (95% CI: 0.11%, 0.15%) (Figure 1A). Incidence exhibited a declining trend from 1990 to 2016, with the largest decrease between 2006 and 2016 (APC: −0.58%; 95% CI: −0.66%, −0.50%), but it increased from 2016 to 2021 (APC: 1.67%; 95% CI: 1.46%, 1.88%), resulting in an overall AAPC of −0.08% (95% CI: −0.16%, 0.00%) (Figure 1B). Mortality demonstrated a consistent downward trend from 1990 to 2021, with a slight increase during 2007–2010 (APC: 0.35%; 95% CI: −0.44%, 1.14%), yielding an overall AAPC of −0.86% (95% CI: −0.98%, −0.74%) (Figure 1C). DALYs also declined steadily over the period, with a notable reduction between 2013 and 2021 (APC: −1.49%; 95% CI: −1.49%, −1.61%) and an overall AAPC of −0.63% (95% CI: −0.68%, −0.58%) (Figure 1D).
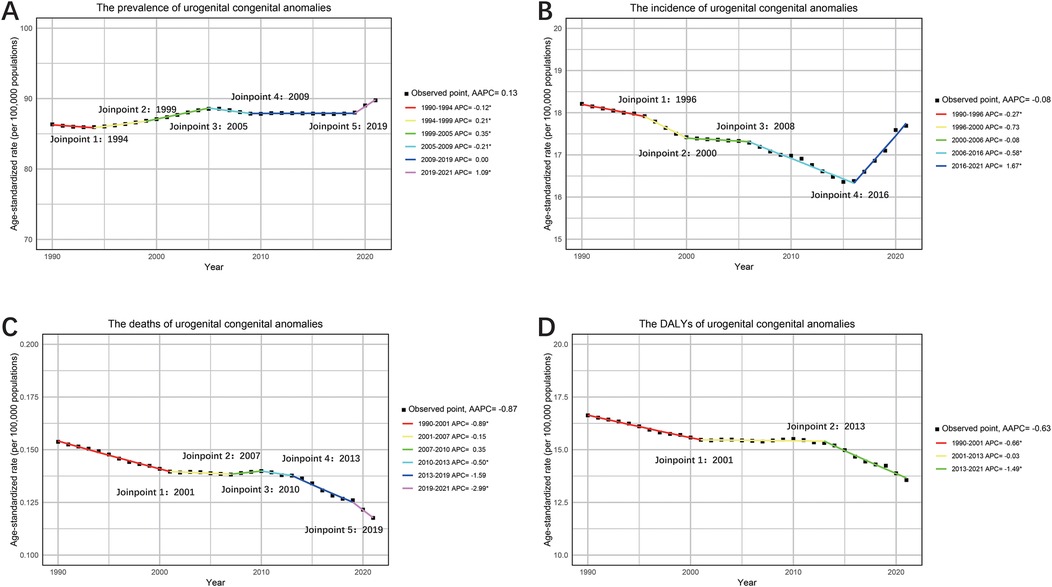
Figure 1. The APC and AAPC of ASR for prevalence (A), incidence (B), deaths (C) and DALYs (D) in urogenital congenital anomalies at the global level based on the joinpoint regression analysis model.
Global trends by sex
Over the past three decades, ASRs indicate that males consistently had higher rates in mortality and DALYs, while females had higher rates in prevalence and incidence. However, when focusing on absolute numbers, the incidence among males gradually surpassed that of females (Figures 2A–D).
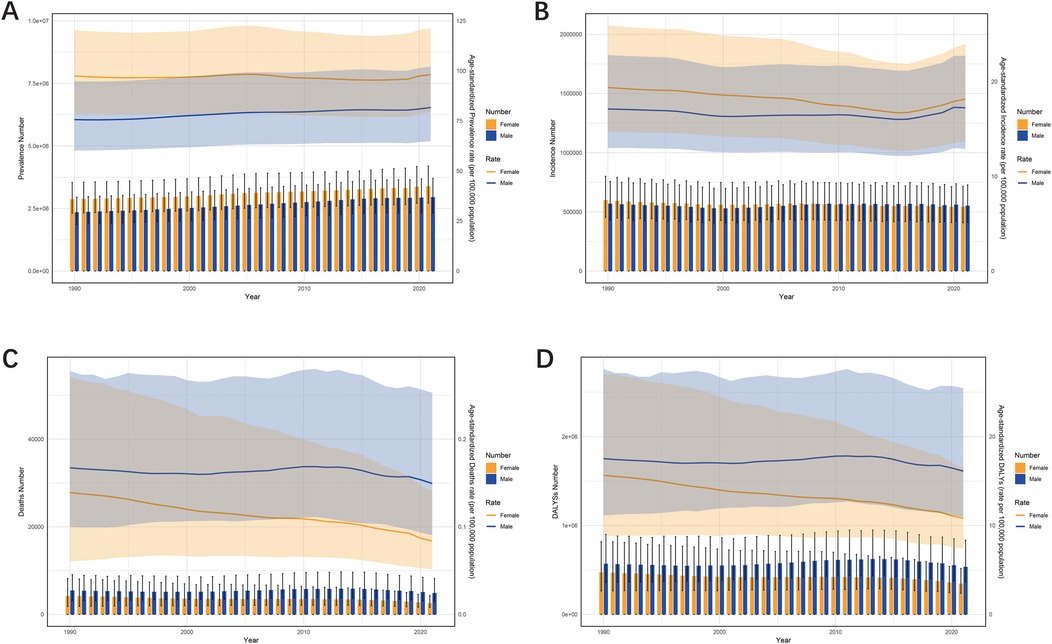
Figure 2. The trends in numbers and ASR of prevalence (A), incidence (B), deaths (C), and DALYs (D) for urogenital congenital anomalies hernias among different sexes, female and male, from 1990 to 2021.
From 1990 to 2021, a gender-specific analysis of UCAs prevalence showed that prevalence in females remained relatively stable (AAPC: 0.03%; 95% CI: −0.02%, 0.88%), while prevalence in males increased significantly (AAPC: 0.25%; 95% CI: 0.23%, 0.27%) (Figure 3A). Notably, both sexes experienced a rapid increase in age-standardized prevalence rates between 2019 and 2021. Incidence rates in females declined from 1990 to 2016, with significant decreases during 1990–2005 (APC: −0.42%; 95% CI: −0.45%, −0.38%) and 2005–2016 (APC: −0.84%; 95% CI: −0.89%, −0.78%), but showed an increasing trend from 2016 to 2021 (APC: 1.8%; 95% CI: 1.63%, 1.96%) (Figure 3B). For males, incidence rates fluctuated over the 30 years, with increases during 2000–2012 and 2016–2021, and declines in other periods. Compared to 1990, male incidence showed a slight overall increase (AAPC: 0.04%; 95% CI: −0.05%, 0.13%), while female incidence declined (AAPC: −0.21%; 95% CI: −0.25%, −0.17%).
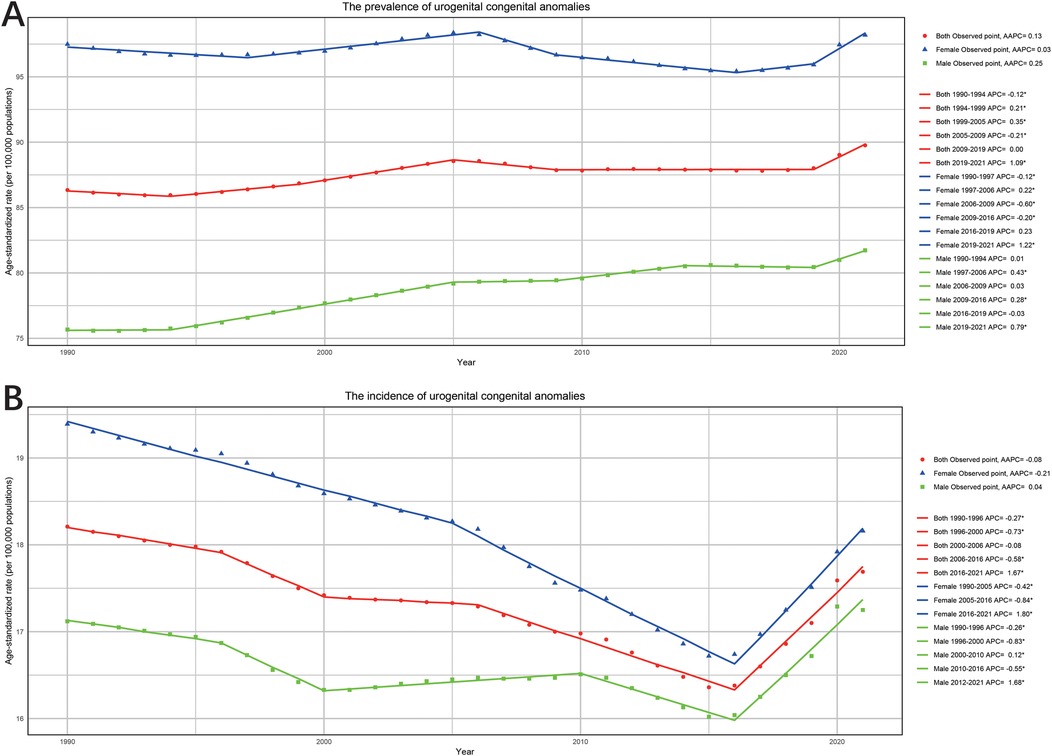
Figure 3. The APC and AAPC of ASR for prevalence (A) and incidence (B) by gender (both, female and male) in urogenital congenital anomalies at the global level based on the joinpoint regression analysis model.
Significant trends were also observed in ASRs for mortality and DALYs between genders. For mortality, males experienced a decline during 1990–2001(APC: −0.41%; 95% CI: −0.52%, −0.31%) and 2012–2021 (APC: −1.28%; 95% CI: −1.43%, −1.14%), but an increase during 2001–2012 (APC: 0.58%; 95% CI: 0.46%, 0.70%), with an overall AAPC of −0.31% (95% CI: −0.38%, −0.25%) (Figure 4A). In contrast, female mortality declined consistently over the 30 years, with the sharpest decline occurring from 2019 to 2021(APC: −4.82%; 95% CI: −5.73%, −3.90%), resulting in an overall AAPC of −1.63% (95% CI: −1.71%, −1.53%). Similarly, trends in DALYs mirrored this positive trajectory, with reductions observed in both sexes (Figure 4B). Females experienced the greatest decline in DALYs during 1993–2001 (APC: −1.27%; 95% CI: −1.38%, −1.16%). For males, DALYs declined during 1990–2001 (APC: −0.26%; 95% CI: −0.35%, −0.17%) and 2012–2021 (APC: −1.10%; 95% CI: −1.21%, −0.98%), but showed an upward trend from 2001 to 2012 (APC: 0.52%; 95% CI: 0.42%, 0.62%). The overall downward trend in DALYs was reflected by an AAPC of −0.23% (95% CI: −0.28%, −0.17%) for male and −1.19% (95% CI: −1.25%, −1.12%) for female.
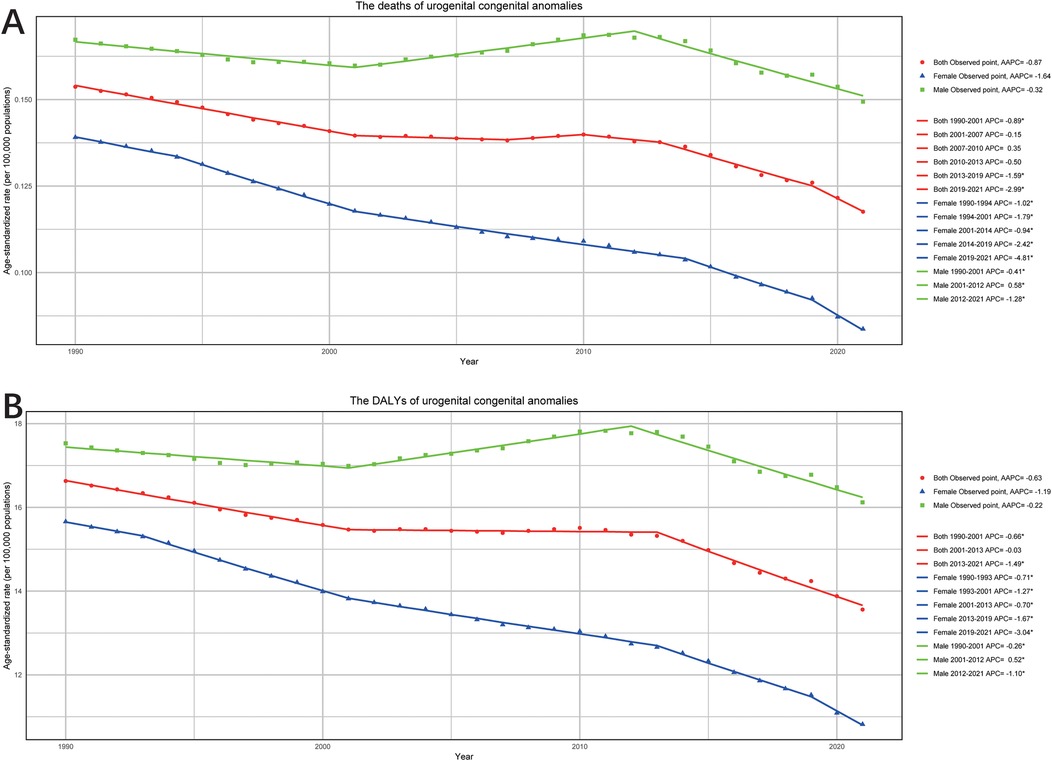
Figure 4. The APC and AAPC of ASR for deaths (A) and DALYs (B) by gender (both, female and male) in urogenital congenital anomalies at the global level based on the joinpoint regression analysis model.
Regional trends
From 1990 to 2021, the prevalence of UCAs showed significant variation across 21 regions. In 2021, the ASR was observed in Southern Sub-Saharan Africa at 164.25 (95% UI: 129.29–206.02) per 100,000 cases, while the lowest was in Southeast Asia at 48.1 (95% UI: 37.7–60.46) per 100,000 cases. The ASPR in East Asia demonstrated a significant decline, with a relative change of −12.68% and an AAPC of −0.73% (95% CI: −0.54% to −0.91%). In contrast, Oceania experienced an increasing trend, with a relative change of 18.07% and an AAPC of 0.48% (95% CI: −0.45% to −0.52%). For incidence, Southern Sub-Saharan Africa also recorded the highest ASR at 28.41 (95% UI: 21.04–38.86) per 100,000 cases, while Southeast Asia had the lowest at 9.91 (95% UI: 7.32–13.3) per 100,000 cases (Tables 1, 2).
In terms of mortality, Eastern Europe experienced a substantial 61.54% reduction in ASR over the 30 years, with an AAPC of −3.32% (95% CI: −2.84% to −3.80%). Conversely, Oceania's ASR increased by 150%, with the absolute number of deaths rising by 300% and an AAPC of 2.67% (95% CI: 2.52%–2.81%). Regions such as High-Income Asia Pacific, Central Europe, and North Africa showed significant declines in both numbers of deaths and ASRs. The trends in DALYs associated with UCAs varied across regions. For example, Oceania exhibited the largest relative increase, with DALYs rising by 263.79% in numbers and 82.98% in ASR, with an AAPC of 1.98% (95% CI: 1.88% to 2.08%). In sharp contrast, Central Europe and Northern Europe experienced substantial declines in DALYs, with absolute numbers decreasing by −63.72% and −61.95%, respectively. Their AAPCs were −2.20% (95% CI: −1.82% to −2.58%) and −1.70% (95% CI: −1.45% to −1.94%), respectively (Tables 3, 4).
National trends
From 1990 to 2021, significant changes were observed in the number of UCAs across 204 countries and territories. In terms of prevalence, 137 countries experienced an increase, with Qatar showing the most significant growth at 476.47%. Conversely, 67 countries, including the United States Virgin Islands at −54.44% and the Republic of Moldova at −55.65%, exhibited a decline. For incidence, 187 out of 204 countries showed an upward trend, with Qatar again leading the increase at 184.40%. However, Puerto Rico recorded the largest decline, at −72.19%. Mortality trends varied widely, with Papua New Guinea at 402.45% experiencing the largest increase, while Puerto Rico showed the greatest decline at −96.23%. Regarding DALYs, Papua New Guinea saw the most significant increase at 334.20%, while Puerto Rico again exhibited the largest reduction at −89.42% (Supplementary Table S1–S4).
From the perspective of ASRs, 51 countries consistently demonstrated declines across different parameters. For example, Sweden showed a 90% reduction in mortality, the Islamic Republic of Iran experienced a 79% decline in DALYs and a 16% reduction in prevalence, while the Republic of Serbia reported a 33.9% decrease in incidence. In contrast, 37 countries consistently displayed increases in different parameters. Tokelau recorded a 600% rise in mortality, Niue experienced a 54% increase in DALYs and a 33.4% increase in prevalence, while American Samoa saw a 43.3% rise in incidence (Supplementary Tables S1–S4; Supplementary Figures S1–S8). Moreover, the AAPC of incidence, prevalence, mortality, and DALYs for 204 countries and territories from1990 to 2021 provided deeper insights (Figures 5A–D).
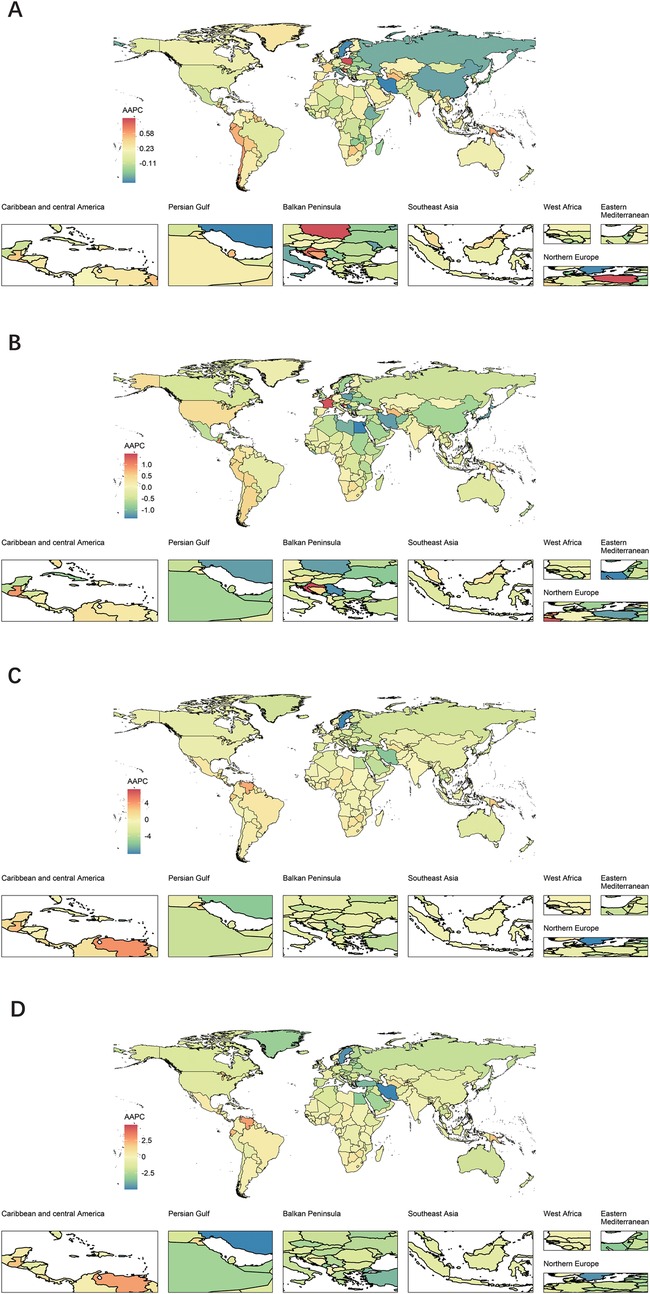
Figure 5. Global map of AAPC of ASR for prevalence (A), incidence (B), deaths (C) and DALYs (D) of urogenital congenital anomalies for both sexes by 204 countries and territories in 2021.
Decomposition analysis of change in UCAs
The decomposition analysis examined changes in prevalence, deaths, and DALYs at the global level and across five SDI strata, attributing these changes to three population-level determinants: aging, population growth, and epidemiological change. Globally, the change in prevalence was primarily driven by population (203.03%), followed by epidemiological change (17.28%), while aging contributed negatively (−120.32%). Changes in deaths were largely attributable to population (−147.82%), followed by epidemiological change (136.47%) and aging (111.35%). Similarly, the change in DALYs was influenced primarily by population (−240.38%), followed by epidemiological change (180.14%) and aging (160.24%). The contributions of these three determinants to changes in the UCAs burden varied significantly across different SDI regions. Population was the main driver of increased disease burden in most SDI regions, whereas aging was identified as the key factor reducing disease burden in these regions (Figures 6A–C).
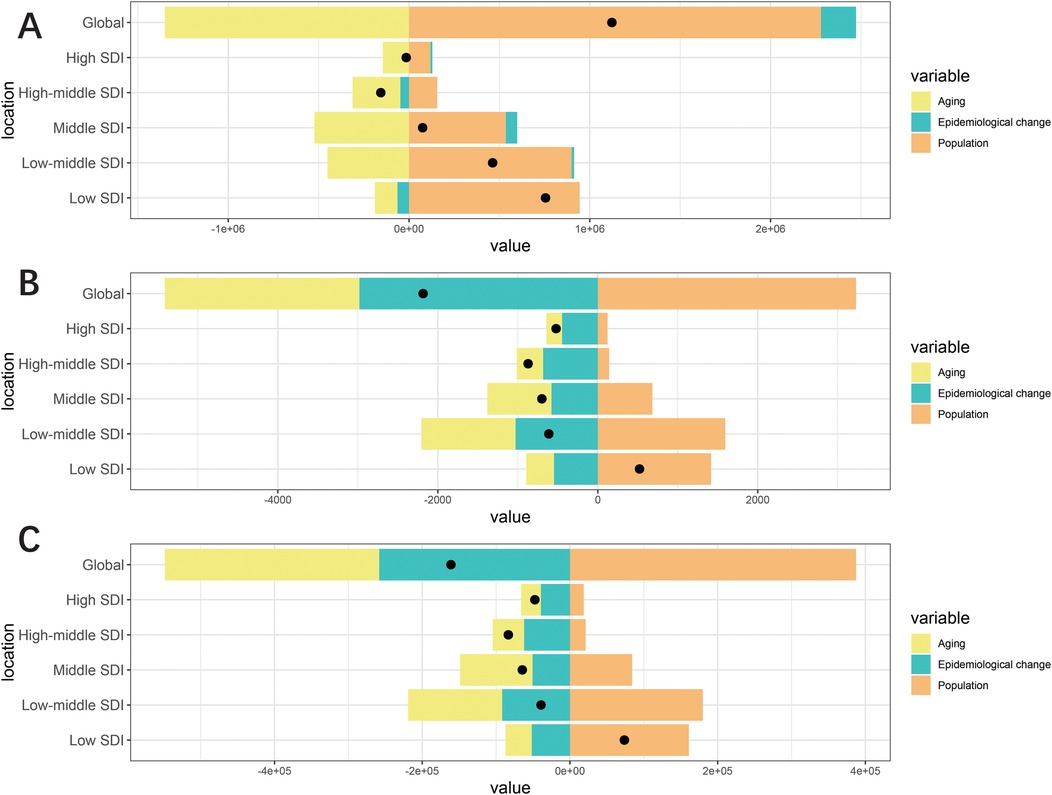
Figure 6. Change in prevalence (A), deaths (B) and DALYs (C) of urogenital congenital anomalies decomposed by three population-level determinants: aging, population and epidemiological change at the global level and various regions. The black dots indicate the total value of change attributable to all three components.
Correlation of ASR with SDI
By investigating UCAs metrics across 21 regions, a slight correlation with the SDI was observed. Mortality and DALYs ASRs showed no significant correlation with SDI, with slightly positive (R = 0.022, P = 0.572) and weak negative correlations (R = −0.029, P = 0.455), respectively, both failing to reach statistical significance (Figures 7C,D). In contrast, a strong negative correlation was observed between incidence ASR and SDI (R = −0.322, P < 0.001) (Figure 7A). This trend persisted for prevalence ASR, which also demonstrated a negative correlation with SDI (R = −0.194, P < 0.001) (Figure 7B). A broader analysis of 204 countries and territories revealed different results for mortality and DALYs (Figures 8C,D). Both were negatively correlated with SDI (Mortality: RR = −0.194, P = 0.006; DALYs: R = −0.242, P < 0.001). Similarly, incidence and prevalence ASRs also exhibited negative correlations with SDI (Incidence: R = −0.349, P < 0.001; Prevalence: R = −0.268, P < 0.001) (Figures 8A,B).
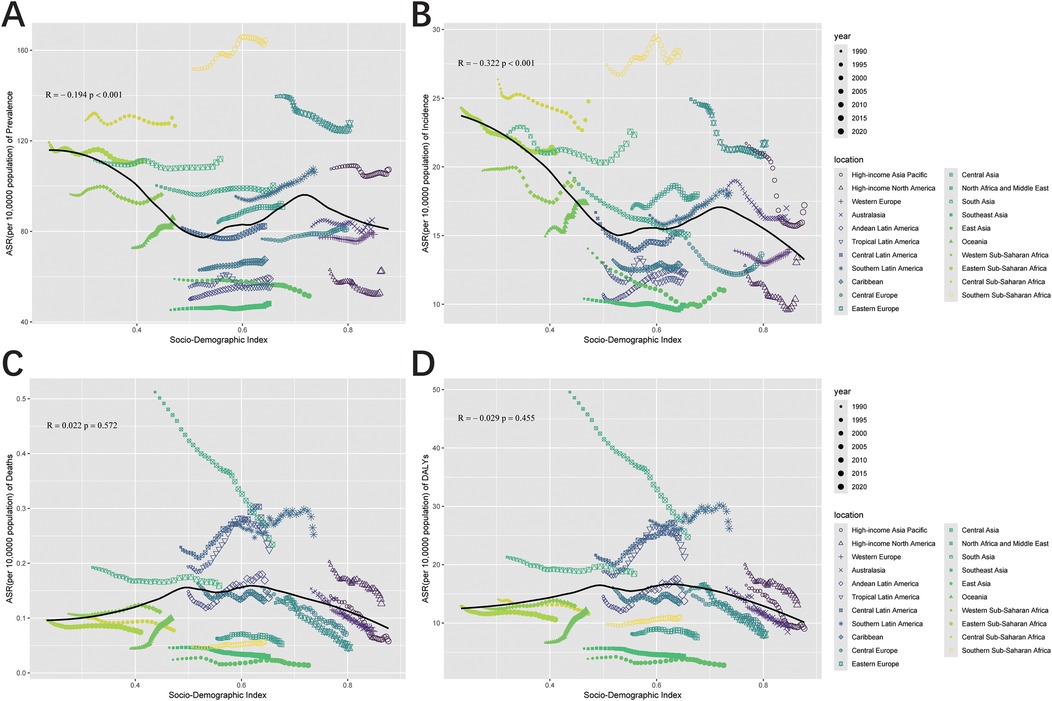
Figure 7. Pearson correlation analysis between the SDI and ASR of prevalence (A), incidence (B), deaths (C), and DALYs (D) for urogenital congenital anomalies across 21 regional levels from 1990 to 2021 (The cases of prevalence, incidence, deaths, and DALYs from 21 regions from 1990 to 2021 are represented by different shapes. The size of the shapes increased with the year of prevalence, incidence, deaths, and DALYs.).
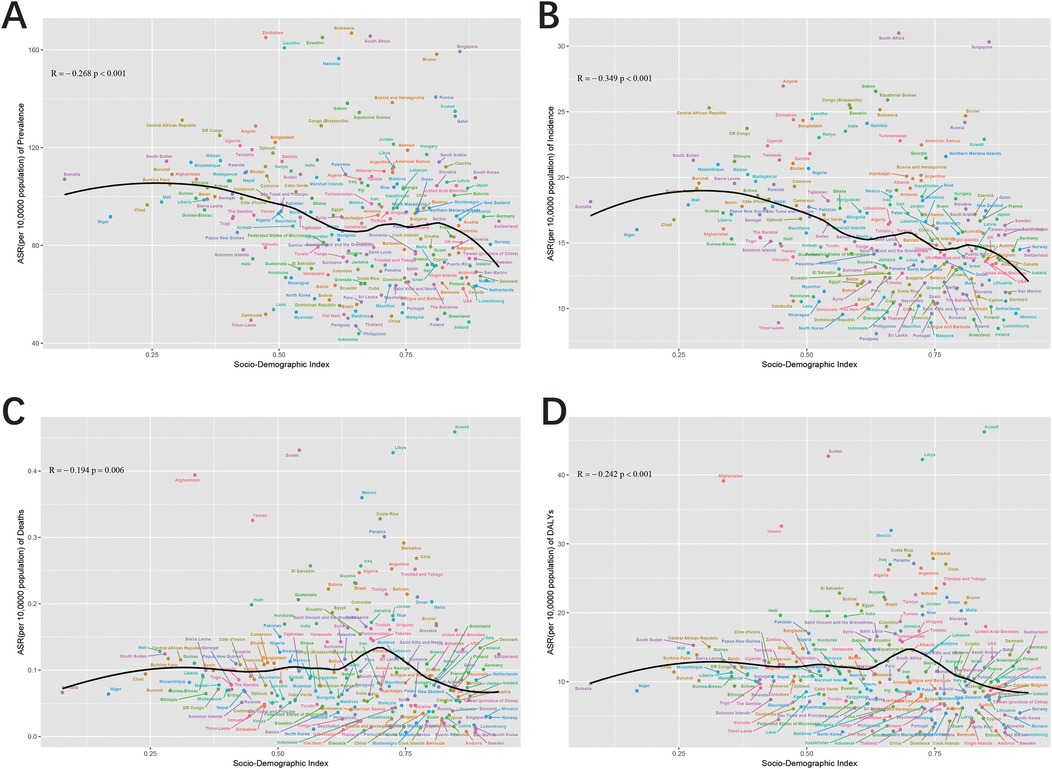
Figure 8. Pearson correlation analysis between the SDI and ASR of prevalence (A), incidence (B), deaths (C), and DALYs (D) for urogenital congenital anomalies at the country and territorial levels in 2021 (The cases of prevalence, incidence, deaths, and DALYs from 204 countries and territories in 2021 are represented by different color.
Frontier analysis
In the comprehensive frontier analysis of SDI and ASRs for congenital UCAs across 204 countries and territories from 1990 to 2021, varying trends were observed. For prevalence, ASRs generally showed a declining trend as SDI values increased from 0.0 to 1.0. Similarly, incidence, mortality, and DALYs for UCAs also decreased with rising SDI values, indicating that as societies develop, the burden of UCAs tends to lessen.
Focusing on the frontier analysis results since 2021, clear distinctions between countries and territories became evident. For prevalence, 15 countries, including Botswana, Zimbabwe, and South Africa, among others, exhibited significantly higher rates, far from the frontier (Figures 9A,B). In contrast, countries like Somalia, Niger, Chad, and Timor-Leste were closer to the frontier, suggesting optimal outcomes relative to their SDI levels. In mortality analysis, countries such as Afghanistan, Yemen, and Sudan showed substantial gaps from the frontier. Interestingly, some high-SDI countries, including Switzerland, Germany, and Denmark, demonstrated relatively high effective differences at their stage of development (Figures 9E,F). Finally, for incidence and DALYs, countries like Somalia, Niger, Chad, and Timor-Leste displayed rates closer to the expected benchmarks set by the frontier, indicating better alignment with expectations based on their SDI levels (Figures 9C,D,G,H).
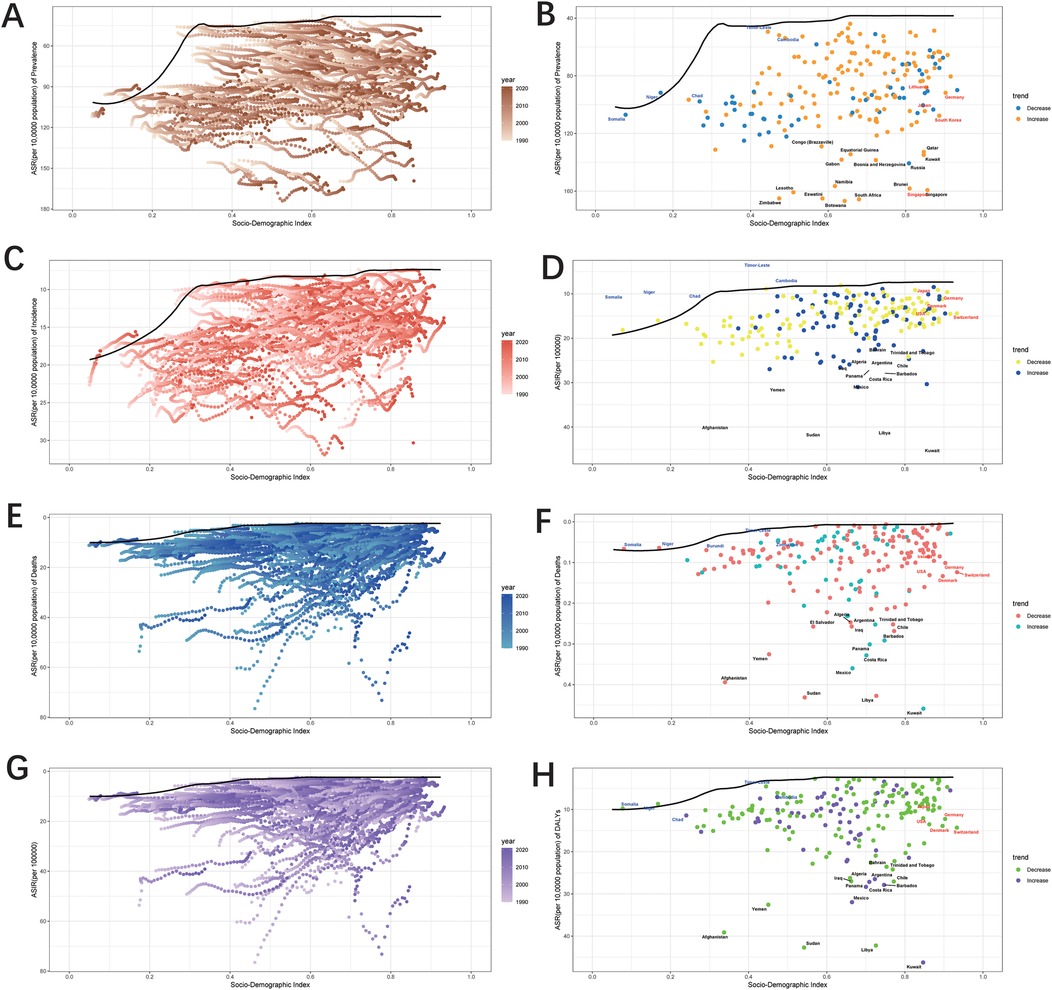
Figure 9. Frontier analysis, represented by the solid black lines, explores the relationship between Socio-Demographic Index (SDI) and Age-Standardized Rate (ASR) for prevalence (A,B), incidence (C,D), deaths (E,F), and DALYs (G,H) in the context of urogenital congenital anomalies. The color gradient in graphs A,C,E, and G illustrates the progression of years, ranging from light shades representing 1990 to the darkest shades denoting 2021. In graphs B,D,F, and H each dot signifies a specific country or territory for the year 2021, with the top 15 countries displaying the most significant deviation from the frontier labeled in black. Countries with low SDI and minimal deviation from the frontier are highlighted in blue, while those with high SDI and notable deviation for their developmental level are emphasized in red. The direction of change from 1990 to 2021 in ASR is indicated by the color of the dots: decrease dots represents a decrease, while increase dots signifies an increase.
Cross-country health inequality analysis
The results of the study revealed significant absolute and relative income inequality in the incidence, prevalence, mortality and DALYs burden of UCAs, with the burden heavily concentrated in poor regions. Comparing data from 1990 to 2021, the degree of health inequality between high-income and low-income countries has decreased over time. The concentration index for prevalence shifted from −0.22 in 1990 to −0.26 in 2021, while the slope index of inequality between low- and high-SDI regions decreased from −108.694 in 1990 to −92.879 in 2021 (Figures 10A,B). Similarly, the concentration index for incidence changed from −0.30 in 1990 to −0.34 in 2021, with the slope index of inequality reducing from −36.877 in 1990 to −22.822 in 2021 (Figures 10C,D). For mortality, the concentration index ranged from −0.24 in 1990 to −0.31 in 2021. However, the slope index of inequality for mortality did not show a significant reduction by 2021 (Figures 10E,F). Regarding DALYs, the concentration index shifted from −0.24 in 1990 to −0.31 in 2021, with the slope index of inequality decreasing from −15.984 in 1990 to −12.677 in 2021 (Figures 10G,H). These findings collectively indicate a reduction in the unequal burden of UCAs over time.
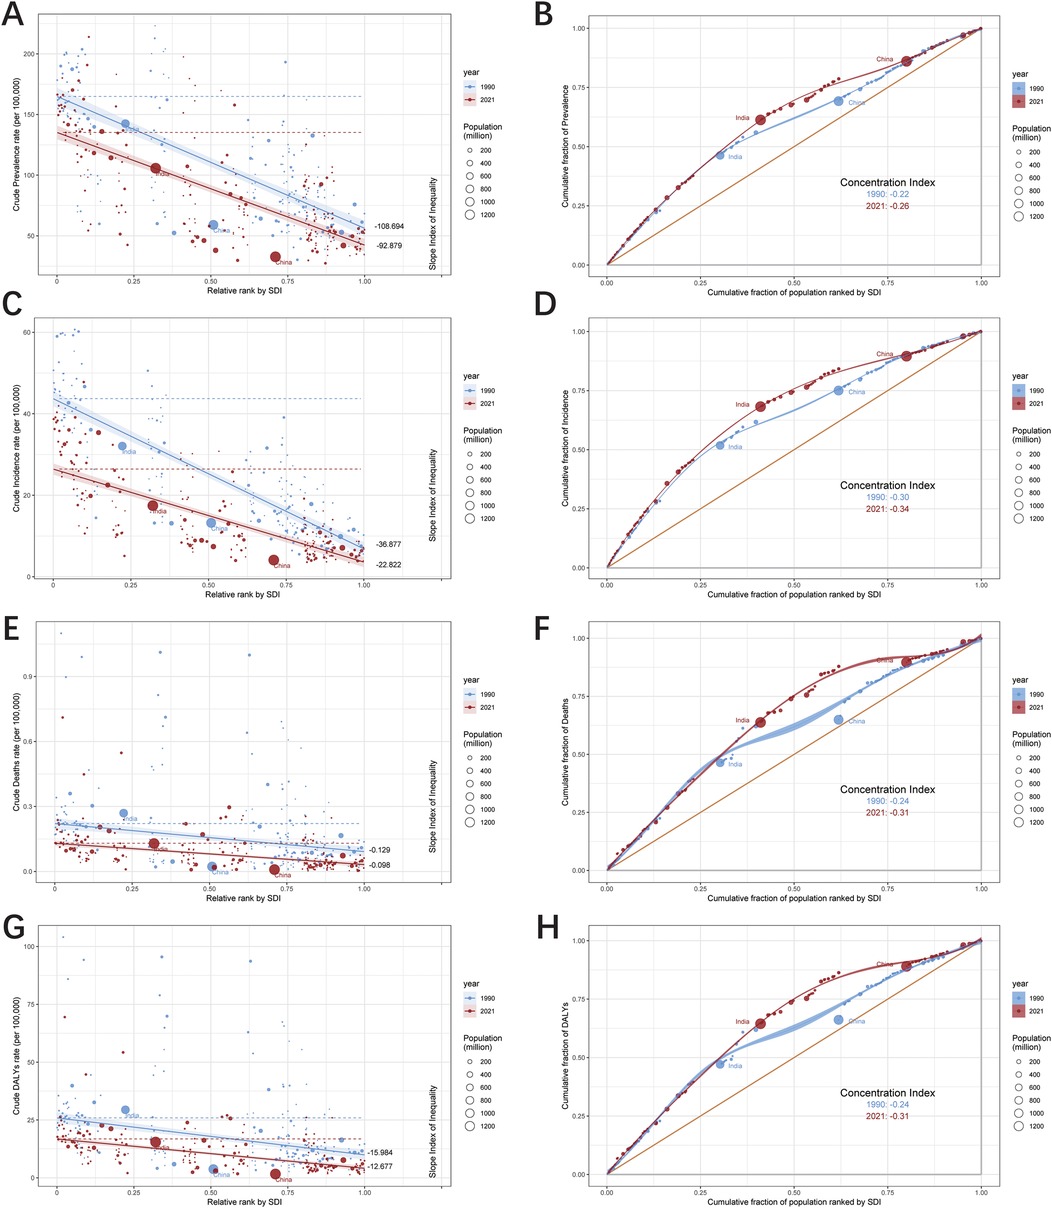
Figure 10. Health inequality regression curves and concentration curves for the prevalence (A,B), incidence (C,D), deaths (E,F) and DALYs (G,H) of urogenital congenital anomalies.
Discussion
From 1990 to 2021, the global prevalence of UCAs cases increased by 21% to 6.34 million, with ASRs rising by 3.69%. In contrast, incidence, deaths, and DALYs experienced declines in both absolute numbers and ASRs. Females exhibited higher rates of prevalence and incidence, whereas males had higher rates of mortality and DALYs. In 2021, Southern Sub-Saharan Africa recorded the highest prevalence, with significant regional disparities observed. High SDI levels were associated with better UCAs outcomes. Aging and population contributed more significantly to changes in prevalence. The frontier analysis of 204 countries and territories from 1990 to 2021 revealed a general decline in UCAs prevalence as SDI levels increased. Countries such as Botswana and Zimbabwe reported higher prevalence rates, while Somalia and Niger performed better relative to their SDI levels. Interestingly, high-SDI countries like Singapore and Kuwait showed elevated prevalence rates. Additionally, the extent of health inequality across high-income and low-income decreased over the study period.
From 1990 to 2021, the global UCAs cases increased by 21%, while the incidence decreased by 6.25%. Simultaneously, mortality decreased by 23% and DALYs fell by 15%, collectively revealing a complex epidemiological profile for UCAs. This contrast suggests that, despite a declining incidence, the total number of UCAs cases has risen. Antenatal care and interventions likely contributed to reduced incidence (16, 17), whereas advancements in minimally invasive surgeries, including laparoscopic and robot-assisted procedure may lowered mortality and DALYs, extending patient survival and thereby expanding the prevalent patient population (18, 19). These insights provide a nuanced narrative of UCAs management: despite an overall rise in cases, there are encouraging signs of progress, highlighting opportunities for targeted healthcare strategies and further research.
Between 1990 and 2021, males consistently showed higher ASRs for mortality and DALYs, while females exhibited higher rates of incidence and prevalence, potentially due to anatomical differences and differences in the spectrum of UCAs (20). The observed divergence may be partially explained by the renoprotective effects of estrogen, which has been shown to mitigate progression of renal pathologies (21). Additionally, severe malformations more prevalent in males, such as posterior urethral valves associated with early-onset renal dysfunction, could contribute to this pattern (22, 23). Both sexes experienced a decline in incidence from 1990 to 2016, possibly linked to more effective medical interventions and heightened health awareness. However, the upward trend in incidence between 2016 and 2021 warrants further investigation. Chen et al. identified significant positive correlations between UCAs burden and several air pollutants, notably sulfur dioxide (SO₂), ammonia, and nitrogen oxides, which may underlie this recent epidemiological shift. Their findings recommend minimizing maternal exposure to ammonia and SO₂ and emphasize prioritizing air pollution control in public health monitoring policies (24). While global health strategies have successfully reduced the disease burden for both genders, females experienced greater declines in mortality and DALYs, suggesting that they may have benefited more from these medical advancements. Nonetheless, the rise in prevalence underscores the influence of population growth and incidence fluctuations, emphasizing the need for continued gender-specific research to optimize prevention and treatment strategies.
Over the past three decades, UCAs trends across regions and countries have highlighted the complex interplay of sociodemographic, economic, and healthcare determinants. The high prevalence in Southern Sub-Saharan Africa, compared to the much lower prevalence in Southeast Asia, underscores regional disparities driven by factors such as genetic predisposition, healthcare accessibility, and environmental influences (25–27). The substantial decline in East Asia may reflect improvements in healthcare systems, advancements in UCAs management strategies, and the effects of aging (28). China, as a major East Asian economy, demonstrated this progress through its 2016 Healthy China 2030. The nationally implemented measures, including universal preconception screening, subsidized genetic counseling and diagnostic testing for high-risk pregnancies, and expanded newborn screening coverage with broader disease panels, collectively achieved effective reduction in child health burdens attributable to congenital birth defects (29). Conversely, the rise in Oceania is likely attributable to population growth and improved screening capabilities (30). Eastern Europe's sharp decline in mortality points to the effectiveness of its healthcare programs and the accessibility of timely treatment, whereas the surge in mortality in Oceania suggests potential gaps in healthcare services or emerging risk factors requiring further investigation.
At the national level, island nations in Oceania have seen increases in UCAs measures, potentially driven by factors such as child poverty, limited healthcare access, inadequate funding for pediatric research, and poor living conditions (31, 32). In contrast, countries like the Islamic Republic of Iran and the Kingdom of Sweden experienced significant reductions in mortality and DALYs, reflecting improvements in healthcare accessibility and sanitation (33, 34). The varying patterns observed across regions and countries underscore the importance of tailored health strategies that address the unique challenges and strengths of each region.
The relationship between SDI and UCAs outcomes showed a significant negative correlation, emphasizing the favorable impact of higher SDI on reducing incidence, prevalence, mortality, and DALYs for UCAs. This correlation likely reflects the benefits of stronger healthcare systems, reduced exposure to risk factors, and greater access to medical services in higher-SDI regions (35). The data affirm the critical role of sociodemographic progress in improving UCAs outcomes, highlighting the importance of prioritizing SDI improvements as a central goal in health policy (36).
The frontier analysis of SDI and ASRs for UCAs from 1990 to 2021 provides key insights into global UCAs trends. The overall narrative illustrates a clear trajectory: as sociodemographic indicators improve, the burden of UCAs—whether measured by prevalence, mortality, or DALYs—tends to diminish. However, a closer examination of 2021 data reveals subtle differences between countries. Notably, countries like Singapore, Botswana, and Zimbabwe, despite their differing sociodemographic contexts, experienced declining prevalence over 30 years but remain far from the optimal frontier. In contrast, countries like Somalia, Niger, and Chad—often facing significant sociopolitical challenges—appear to perform better than expected relative to their SDI levels, coming closer to the frontier benchmarks. This divergence highlights the multifaceted nature of healthcare outcomes, indicating that while SDI is a critical determinant, other factors—whether environmental, genetic, or healthcare system-related—also play key roles in shaping UCAs trends.
Our study has some limitations. While we have endeavored to provide a comprehensive analysis, data accuracy and consistency across regions may vary, with particular challenges arising from data gaps in low-resource settings, introducing potential bias or inaccuracies. Additionally, our historical scope, incorporating data from 1990, may be influenced by evolving diagnostic criteria and medical technologies over time. Furthermore, the modeling assumptions used in data synthesis and estimation carry inherent potential biases, and the lack of primary data precludes direct clinical validation of the estimates. Thus, while our findings offer valuable insights into global UCAs trends, they should be interpreted with caution, acknowledging the subtle complexities and potential biases inherent in the broader context of our research.
Conclusion
Our study underscores significant patterns associating UCAs with socio-demographic factors, providing valuable insights for shaping health policies and practices. The findings reveal that regions with higher socio-demographic indices experience fewer UCAs-related mortalities and improved outcomes, although inequities remain evident. Given the persistent global burden of UCAs, the importance of ongoing surveillance and adaptable healthcare strategies is clear. Achieving meaningful reductions in the impact of UCAs will necessitate sustained research efforts and proactive healthcare interventions.
Data availability statement
Publicly available datasets were analyzed in this study. This data can be found here: http://ghdx.healthdata.org/gbd-results-tool.
Ethics statement
Ethical approval was not required for the studies involving humans because our research is a secondary analysis of public data. The studies were conducted in accordance with the local legislation and institutional requirements. Written informed consent for participation was not required from the participants or the participants' legal guardians/next of kin in accordance with the national legislation and institutional requirements because our research is a secondary analysis of public data.
Author contributions
YY: Writing – original draft. QZ: Writing – review & editing. JL: Writing – original draft, Data curation. LW: Methodology, Writing – original draft. LG: Visualization, Writing – original draft. QS: Writing – original draft.
Funding
The author(s) declare that no financial support was received for the research and/or publication of this article.
Conflict of interest
The authors declare that the research was conducted in the absence of any commercial or financial relationships that could be construed as a potential conflict of interest.
Generative AI statement
The author(s) declare that no Generative AI was used in the creation of this manuscript.
Any alternative text (alt text) provided alongside figures in this article has been generated by Frontiers with the support of artificial intelligence and reasonable efforts have been made to ensure accuracy, including review by the authors wherever possible. If you identify any issues, please contact us.
Publisher's note
All claims expressed in this article are solely those of the authors and do not necessarily represent those of their affiliated organizations, or those of the publisher, the editors and the reviewers. Any product that may be evaluated in this article, or claim that may be made by its manufacturer, is not guaranteed or endorsed by the publisher.
Supplementary material
The Supplementary Material for this article can be found online at: https://www.frontiersin.org/articles/10.3389/fped.2025.1584280/full#supplementary-material
References
1. Acharya PT, Ponrartana S, Lai L, Vasquez E, Goodarzian F. Imaging of congenital genitourinary anomalies. Pediatr Radiol. (2022) 52:726–39. doi: 10.1007/s00247-021-05217-2
2. Loane M, Dolk H, Kelly A, Teljeur C, Greenlees R, Densem J, A EUROCAT Working Group. Paper 4: EUROCAT statistical monitoring: identification and investigation of ten year trends of congenital anomalies in Europe. Birth Defects Res A Clin Mol Teratol. (2011) 91:S31–43. doi: 10.1002/bdra.20778
3. Isert S, Müller D, Thumfart J. Factors associated with the development of chronic kidney disease in children with congenital anomalies of the kidney and urinary tract. Front Pediatr. (2020) 8:298. doi: 10.3389/fped.2020.00298
4. GBD 2019 Diseases and Injuries Collaborators. Global burden of 369 diseases and injuries in 204 countries and territories, 1990–2019: a systematic analysis for the global burden of disease study 2019. Lancet. (2020) 396:1204–22. doi: 10.1016/S0140-6736(20)30925-9
5. Fitzmaurice C, Abate D, Abbasi N, Abbastabar H, Abd-Allah F, Abdel-Rahman O, et al. Global, regional, and national cancer incidence, mortality, years of life lost, years lived with disability, and disability-adjusted life-years for 29 cancer groups, 1990 to 2016: a systematic analysis for the global burden of disease study. JAMA Oncol. (2018) 4:1553–68. doi: 10.1001/jamaoncol.2018.2706
6. Wafa HA, Wolfe C, Emmett E, Roth GA, Johnson CO, Wang Y. Burden of stroke in Europe: thirty year projections of incidence, prevalence, deaths, and disability-adjusted life years. Stroke. (2020) 51:2418–27. doi: 10.1161/STROKEAHA.120.029606
7. Li X, Cao X, Guo M, Xie M, Liu X. Trends and risk factors of mortality and disability adjusted life years for chronic respiratory diseases from 1990 to 2017: systematic analysis for the global burden of disease study 2017. Brit Med J. (2020) 368:m234. doi: 10.1136/bmj.m234
8. GBD 2021 Causes of Death Collaborators. Global burden of 288 causes of death and life expectancy decomposition in 204 countries and territories and 811 subnational locations, 1990–2021: a systematic analysis for the global burden of disease study 2021. Lancet. (2024) 403:2100–32. doi: 10.1016/S0140-6736(24)00367-2
9. Xie Y, Bowe B, Mokdad AH, Xian H, Yan Y, Li T, et al. Analysis of the global burden of disease study highlights the global, regional, and national trends of chronic kidney disease epidemiology from 1990 to 2016. Kidney Int. (2018) 94:567–81. doi: 10.1016/j.kint.2018.04.011
10. Ordunez P, Martinez R, Soliz P, Giraldo G, Mujica OJ, Nordet P. Rheumatic heart disease burden, trends, and inequalities in the americas, 1990–2017: a population-based study. Lancet Glob Health. (2019) 7:e1388–97. doi: 10.1016/S2214-109X(19)30360-2
11. Rashid R, Sohrabi C, Kerwan A, Franchi T, Mathew G, Nicola M, et al. The STROCSS 2024 guideline: strengthening the reporting of cohort, cross-sectional, and case-control studies in surgery. Int J Surg. (2024) 110:3151–65. doi: 10.1097/JS9.0000000000001268
12. GBD 2016 Disease and Injury Incidence and Prevalence Collaborators. Global, regional, and national incidence, prevalence, and years lived with disability for 328 diseases and injuries for 195 countries, 1990–2016: a systematic analysis for the global burden of disease study 2016. Lancet. (2017) 390:1211–59. doi: 10.1016/S0140-6736(17)32154-2
13. Wang F, Ma B, Ma Q, Liu X. Global, regional, and national burden of inguinal, femoral, and abdominal hernias: a systematic analysis of prevalence, incidence, deaths, and DALYs with projections to 2030. Int J Surg. (2024) 110:1951–67. doi: 10.1097/JS9.0000000000001071
14. Cao F, Liu YC, Ni QY, Chen Y, Wan CH, Liu SY, et al. Temporal trends in the prevalence of autoimmune diseases from 1990 to 2019. Autoimmun Rev. (2023) 22:103359. doi: 10.1016/j.autrev.2023.103359
15. Qu X, Liu M, Ke C, Liang J, Du Y, Yao L, et al. Burden of alcohol use disorders in China and the regions with different income levels over the world. J Glob Health. (2021) 11:08011. doi: 10.7189/jogh.11.08011
16. Talati AN, Webster CM, Vora NL. Prenatal genetic considerations of congenital anomalies of the kidney and urinary tract (CAKUT). Prenat Diagn. (2019) 39:679–92. doi: 10.1002/pd.5536
17. Mohamed TH, Slaughter JL. Congenital anomalies of the kidney and urinary tract in preterm infants-active drivers of increased disease or associated bystanders? JAMA Netw Open. (2022) 5:e2234474. doi: 10.1001/jamanetworkopen.2022.34474
18. Kim EJ, Song SH, Sheth K, Baccam T, Elizondo R, Baek M, et al. Does de novo hydronephrosis after pediatric robot-assisted laparoscopic ureteral re-implantation behave similarly to open re-implantation? J Pediatr Urol. (2019) 15:604.e1–6. doi: 10.1016/j.jpurol.2019.07.024
19. Mittal S, Eftekharzadeh S, Aghababian A, Weaver J, Fischer K, Long CJ, et al. Incidence and resolution of de novo hydronephrosis after pediatric robot-assisted laparoscopic extravesical ureteral reimplantation for primary vesicoureteral reflux. J Pediatr Urol. (2022) 18:517.e1–e5. doi: 10.1016/j.jpurol.2022.04.005
20. Shen L, Li J, Zhang H, Zhao Y. Global, regional and national burdens of reproduction-related congenital birth defects, 1990–2019. Front Public Health. (2024) 12:1328282. doi: 10.3389/fpubh.2024.1328282
21. Kummer S, von Gersdorff G, Kemper MJ, Oh J. The influence of gender and sexual hormones on incidence and outcome of chronic kidney disease. Pediatr Nephrol. (2012) 27:1213–9. doi: 10.1007/s00467-011-1963-1
22. Walawender L, Becknell B, Matsell DG. Congenital anomalies of the kidney and urinary tract: defining risk factors of disease progression and determinants of outcomes. Pediatr Nephrol. (2023) 38:3963–73. doi: 10.1007/s00467-023-05899-w
23. Caione P, Nappo SG. Posterior urethral valves: long-term outcome. Pediatr Surg Int. (2011) 27:1027–35. doi: 10.1007/s00383-011-2946-9
24. Chen K, Liu H, Wang T, Luo M, Ruan X, Sun M, et al. Exploring the association between air pollution and urogenital congenital anomalies: a global ecological analysis. Environ Pollut. (2025) 377:126471. doi: 10.1016/j.envpol.2025.126471
25. Kolvenbach CM, Shril S, Hildebrandt F. The genetics and pathogenesis of CAKUT. Nat Rev Nephrol. (2023) 19:709–20. doi: 10.1038/s41581-023-00742-9
26. Murugapoopathy V, Gupta IR. A primer on congenital anomalies of the kidneys and urinary tracts (CAKUT). Clin J Am Soc Nephrol. (2020) 15:723–31. doi: 10.2215/CJN.12581019
27. Akporiaye LE, Oguike TC, Evbuomwan I. Genito-urinary reconstruction in southern Nigeria. West Afr J Med. (2009) 28:126–9.19761178
28. Huang X, Tang J, Chen M, Xiao Y, Zhu F, Chen L, et al. Sex difference and risk factors in burden of urogenital congenital anomalies from 1990 to 2019. Sci Rep. (2023) 13:13656. doi: 10.1038/s41598-023-40939-3
29. Huang BY, Zhao Q, Peng DL, Wang MY, Zhao QW. Burden of congenital birth defects in children under five in China from 1990 to 2021 and prediction of future trend. Chin J Contemp Pediatr. (2025) 27:347–53. doi: 10.7499/j.issn.1008-8830.2408146
30. MacArthur C, Hansen M, Baynam G, Bower C, Kelty E. Trends in prenatal diagnosis of congenital anomalies in Western Australia between 1980 and 2020: a population-based study. Paediatr Perinat Epidemiol. (2023) 37:596–606. doi: 10.1111/ppe.12983
31. Moton TM, King PT, Dalziel SR, Merry S, Robertson SP, Day AS. The current and future state of child health and wellbeing in Aotearoa New Zealand: part 1. J R Soc N Z. (2022) 52:313–7. doi: 10.1080/03036758.2022.2093434
32. Oben G, Duncanson M, Adams J, Satyanand T. State of child health: acute rheumatic fever in Aotearoa New Zealand. J R Soc N Z. (2022) 53:631–40. doi: 10.1080/03036758.2022.2113102
33. Kelishadi R. Child mortality in Iran’s provinces: successes and future needs. Lancet Glob Health. (2017) 5:e476. doi: 10.1016/S2214-109X(17)30154-7
34. Nordlind A, Sundqvist AS, Anderzén-Carlsson A, Almblad AC, Ängeby K. How paediatric departments in Sweden facilitate giving children a voice on their experiences of healthcare: a cross-sectional study. Health Expect. (2022) 25:384–93. doi: 10.1111/hex.13396
35. Koch AM. Missing the care in health care. Am J Nurs. (2021) 121:48–52. doi: 10.1097/01.NAJ.0000737300.54432.87
Keywords: annual percentage change, average annual percentage change, frontier analysis, urogenital congenital anomalies, decomposition analysis, cross-country health inequality analysis
Citation: Yue Y, Zhang Q, Li J, Wang L, Guo L and Sun Q (2025) Burden of urogenital congenital anomalies: findings from the global burden of disease study 2021. Front. Pediatr. 13:1584280. doi: 10.3389/fped.2025.1584280
Received: 28 April 2025; Accepted: 15 September 2025;
Published: 25 September 2025.
Edited by:
Lisandro Ariel Piaggio, Universidad Nacional del Sur, ArgentinaReviewed by:
Lillian Hayes, Boston Children's Hospital and Harvard Medical School, United StatesAdam Dawria, King Khalid University, Saudi Arabia
Copyright: © 2025 Yue, Zhang, Li, Wang, Guo and Sun. This is an open-access article distributed under the terms of the Creative Commons Attribution License (CC BY). The use, distribution or reproduction in other forums is permitted, provided the original author(s) and the copyright owner(s) are credited and that the original publication in this journal is cited, in accordance with accepted academic practice. No use, distribution or reproduction is permitted which does not comply with these terms.
*Correspondence: Qian Zhang, c2hhbnlhbkB6enUuZWR1LmNu