 Thomas E. Bachman
 Christopher J. L. Newth
 Nimesh Patel3
 Patrick A. Ross
- 1Department Biomedical Technology, Faculty of Biomedical Engineering, Czech Technical University in Prague, Kladno, Czechia
- 2Department Anesthesiology Critical Care Medicine, Children’s Hospital Los Angeles, University of Southern California Keck School of Medicine, Los Angeles, CA, United States
- 3Department of Anesthesiology, Vanderbilt University Medical Center, Nashville TN, United States
Objective: To independently validate an empirically optimized algorithm for calculating estimated Oxygenation Index (eOI) using noninvasive parameters from pediatric intensive care populations.
Design: Retrospective observational cohort study using an integrated patient data repository spanning over 12 years (August 2012-December 2024).
Setting: Single tertiary children's hospital with general pediatric ICU (PICU) and cardiothoracic ICU (CTICU).
Key measures: Arterial blood gas measurements were paired with coincident SpO2, heart rate, pulse rate, FiO2, and mean airway pressure measurements. The primary analyses used SpO2 observations between 80%–100%. Using these values eOI was calculated. The primary outcome was the Bias and Limits of Agreement of the difference between measured OI and eOI. Discrimination performance of eOI for severity of hypoxemia was evaluated using receiver operating characteristic curves at OI thresholds of 4, 8, and 16.
Results: Analysis included 68,915 observations from 7,109 subjects (44,133 CTICU, 24,782 PICU observations). Bias was minimal in both populations: PICU 0.06 (95% CI; 0.03, 0.10) and CTICU 0.12 (95% CI; 0.09, 0.14). Limits of agreement were −5.2 to 5.4 (PICU) and −4.9 to 5.2 (CTICU). Discrimination performance was excellent, at 3 hypoxemia thresholds (AUROC; 0.91–0.98), and in the CTICU for OI ≥4 when SpO2 >97% (AUROC; 0.83).
Conclusions: The new eOI algorithm provides accurate, but not precise, estimation of OI in both general pediatric and cardiothoracic ICU populations. Noninvasive OI monitoring may be shown clinically useful.
Background
Optimizing the oxygenation of children in critical care is a fundamental task. Oxygenation is managed by careful titration of inspired oxygen. For those receiving mechanical ventilation establishing and maintaining appropriate lung recruitment requires titration of airway pressure, which is also essential. The adequacy of oxygenation is verified periodically with the measurement of oxygen tension and oxygen saturation in an arterial blood sample (PaO2, SaO2). Importantly, the saturation of oxygen is also noninvasively monitored continuously with a pulse oximeter (SpO2). While SpO2 is only an estimate of SaO2 and a reflection of the adequacy of PaO2, most titrations of the mean airway pressure and inspired oxygen are made based on trends in the SpO2.
Exposure to high and low PaO2 are associated with mortality and morbidity, as are inappropriate levels of mean airway pressure (mPaw) and inspired oxygen (FiO2). Oxygenation Index (OI) is a metric that integrated these parameters [(FiO2*100/PaO2)*mPaw]. It has become the accepted measure of severity of hypoxemia (1). When PaO2 values are not available, Oxygen Saturation Index (OSI: [(100*(FiO2/SpO2)*mPaw]), has been shown to be a suitable alternative (2). However, OSI has limitations. Primarily it is not reliable when SpO2 is >97%. Furthermore, while highly correlated to OI, OSI values are lower than OI values and thus the thresholds for severity are different. These indexes are currently used for a variety of purposes. These include predicting mortality, categorizing severity of disease, following the impact of therapeutic intervention, and setting thresholds for more invasive or aggressive therapies (1–4).
The relationship between SaO2 and PaO2 is not linear. Rather the relationship, referred to as the oxyhemoglobin dissociation curve, is sigmoid. This nonlinearity results in the insensitivity of high SaO2 levels to changes in PaO2. At any given SaO2, the corresponding PaO2 also shifts based on fluctuating physiological parameters such as pH and PaCO2. The SaO2-PaO2 relationship was quantified more than 4 decades ago by Severinghaus (5). More recently Gadrey and colleagues modified the Severinghaus equation for estimation of PaO2 using SpO2 rather than SaO2 (4). Based on a population of nearly 500 children receiving noninvasive respiratory support, they reported that the imputed PaO2 was effective in assessing the severity of hypoxemia for use in an organ failure metric.
Subsequently in 2021, Sauthier and colleagues reported on the outcome of an extensive project to determine the best approach to estimate PaO2 based on SpO2 (6). They used 4 machine learning approaches; three neural networks and an empirical bootstrap optimization of the Gadrey equation. This project was based on over 50,000 observations from a single PICU. The empirical approach not only refined the constants in the Gadrey equation but also excluded unreliable SpO2 measurements. The reliability exclusions were based on an observed difference between the pulse rate and the electrical heart rate. The performance of these 4 approaches, plus three previously described equations were then compared in an independent sample of over 12,000 observations from a different PICU. They concluded that their bootstrap equation was the most effective. Additionally, they reported that using the estimate of PaO2 to calculate estimated OI (eOI) was suitable for use with SpO2 values >97%, and also corresponded directly with OI values. They further suggested that availability of a continuous estimated OI would be a valuable addition to decision support systems and bedside management.
Critical care at Children's Hospital of Los Angeles is supported with a robust patient data management repository and has been active in developing and implementing decision support systems (7–12). This study aimed to confirm the performance of the Sauthier algorithm for calculating eOI in our general pediatric ICU and also to determine if it was effective in the cardiothoracic ICU.
Methods
Design
This is a retrospective observational cohort study of an existing integrated patient and treatment information data repository at a single tertiary level children's hospital. All data is automatically retrieved and archived. Use of masked aggregated information from this medical records database was approved for this project by the institutional review board (approved 2/21/22 by CHLA-IRB, CHLA-23-0019, Implications of Hyperoxemia and Hypoxemia in ICU Patients). The study was conducted in compliance with the ethical standards of the IRB and the Helsinki Declaration of 1975.
Population
The database accessed reflects care in the 24-bed cardiothoracic unit (CTICU) and the 30-bed general pediatric unit (PICU). At the time of the query the entire database spanned a period starting in August 2012 and ending in December 2024. Admissions with at least one arterial blood gas assessment with a corresponding SpO2, FiO2 and mPaw measurement were identified and included in the analysis. In our ICUs this implies invasive conventional mechanical ventilation.
Analysis parameters
Arterial oxygen tension (PaO2) measurements were paired with 5 other coincident parameters. These were peripheral oxygen saturation measurements (SpO2), heart rate, pulse rate, inspired oxygen (FiO2) and mean airway pressure (mPaw). The value used for each of these 5 parameters was the mean of 30-s values within ±1 min of the arterial sample point of care analysis. Observations with SpO2 < 80% were excluded, to be comparable to the development and validation set used by Sauthier et al. (6) However, after review of the results, a post hoc exploratory analysis of SpO2 observations in the CTICU with SpO2 between 70%–79% was conducted.
Endpoints
The estimated PaO2 (ePaO2) was calculated according to the Sauthier algorithm (6). This calculation requires exclusion of observations with a difference in heart and pulse rate of 3% or more. The exclusion is based on the premise that when the measured pulse rate varies from the electrical EKG signal, the peripheral pulse, and thus the derived SpO2, is unreliable. The 3% threshold was derived by them empirically. We then calculated the estimated OI (eOI) using the ePaO2.
The primary outcome measure was the difference between the OI and eOI.
Statistical analysis
The PICU and CTICU observations were treated as separate populations and all analyses were conducted in each separately.
We utilized the Bland-Altman paradigm for comparing methods for our analyses (13). Thus, the differences between the actual and estimate endpoint (OI) was characterized by two parameters. These were the Bias (mean difference) and the Limits of Agreement (95% confidence interval of the differences). The former reflecting accuracy and the latter precision. In addition, the 95% standard error of the mean of the Bias was also calculated. Finally, to evaluate these parameters across the range of oxygen saturations, the Bias and Limits of Agreement were calculated for 4 SpO2 strata (80%–87%, 88%–93%, 94%–97%, 98%–100%). For the post hoc analysis they were calculated for SpO2 between 70%–79% in the CTICU.
Receiver operator curves (ROC) were constructed to evaluate the predictive ability of eOI at three thresholds of hypoxemia. The area under the curves was calculated as the metric of effectiveness (AUROC). These thresholds were mild hypoxemia (OI, ≥4), moderate hypoxemia (OI, ≥8) and severe hypoxemia (OI, ≥16) (1). The first and last were used in Sauthier's validation (6). The moderate threshold was recently identified as prognostic (12).
Continuous descriptive data is presented as median and IQR (25th–75th percentiles), and categorical data as count and percent. Univariate Mann–Whitney test and Z-test were used to compare the differences in ICU populations. A p < 0.05 was specified as statistically significant. The 95% confidence intervals of the mean of the Oxygenation Index Bias and AUROC were used to compare the differences among ICUs, SpO2 strata, with statistical difference implied when they did not overlap. Statistical tests were conducted with XLSTAT v11.5 (Lumivero, NY USA).
Results
Over ninety thousand observations (90,596) were identified in the 12-year period ending December 2024. Of these, 21,681 (24%) were excluded because of excessive differences between the observed pulse rate and heart rate. The remaining 68,915 observations from children with SpO2 between 80%–100% were included in the primary analysis. These observations were associated with 3,801 subjects in the CTICU and 3,308 subjects in the PICU. Sixty-four percent of the observations (44,133) were from the CTICU.
An overview of the two ICU cohorts is shown in Table 1. Based on the threshold of OI <4, more than a third of the observations were not associated with significant hypoxemia, and nearly a half were between 4 and 16. Most of the parameters were statistically significantly different, however of note, those in the cardiothoracic unit were markedly younger with lower oxygen tensions, but less severe hypoxemia.
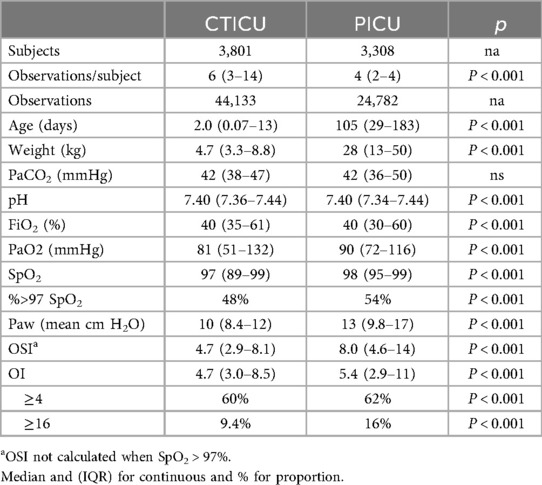
Table 1. Observations by ICU.
Figure 1 is a Bland-Altman plot of the OI-eOI difference. While the Bias is very small (0.10), the Limits of Agreement are about 5. The primary analysis by ICU, found minimal Biases, that were not statistically different. The Bias in the PICU was 0.06 (CI: 0.03, 0.10) and in the CTICU it was 0.12 (CI: 0.09, 0.14). The Limits of Agreement were similar and predictably wide, −5.2 to 5.4 in the PICU and −4.9 to 5.2 in the CTICU.
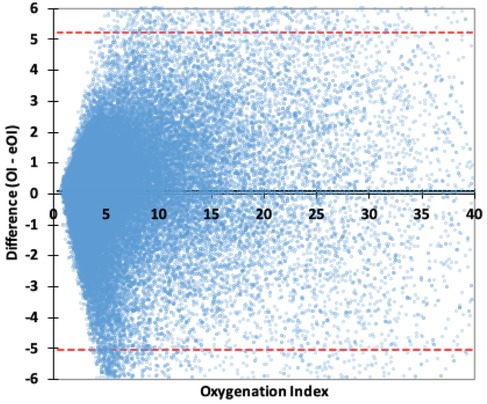
Figure 1. Bland–Altman plot OI difference. The red lines are the 95% Limits of Agreement, the wide black line the Bias.
These Bias and Limits of Agreement values for 80%–100% SpO2, as well as those for the 4 specified strata of SpO2 are detailed in Table 2. There were statistically significant differences in Bias among the strata and between the ICUs; however, the magnitudes of the Bias differences were all relatively small (<10% of the OI for that stratum). In the two strata of 93% SpO2 and below, the Bias was positive in the CTICU and negative in the PICU, while the inverse was true above 93%. Except for the 98%–100% strata, in the PICU the Bias was lower (OI was higher than the eOI). The Limits of Agreement were for most part similar between strata and ICUs. The post hoc analysis of 9,923 observations with SpO2 between 70%–79% in the CTICU found a Bias of 0.10 (CI: 0.02, 0.18), markedly smaller than the 80%–87% Bias but with slightly higher Limits of Agreement (−7.8 to 8.0).
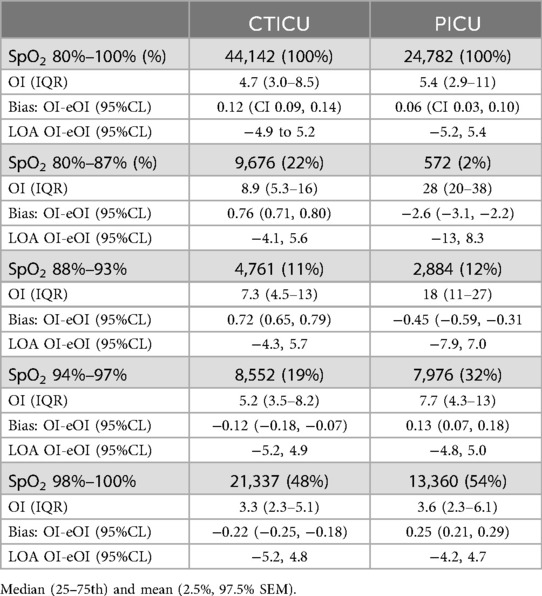
Table 2. Bias and limits of agreement OI-eOI difference by SpO2 categories.
Figure 2 provides a chart for each ICU comparing eOI and OSI to OI for SpO2 between 80%–97%. The coefficients of determination (R2) are high for eOI and OSI, in both ICUs. The coefficient of determinations in the PICU is marginally better than in the CTICU. In the CTICU the R2 for eOI (0.89) is also higher than for OSI (0.83), and comparable in the PICU. The eOI, unlike the OSI, clearly approximates the OI.
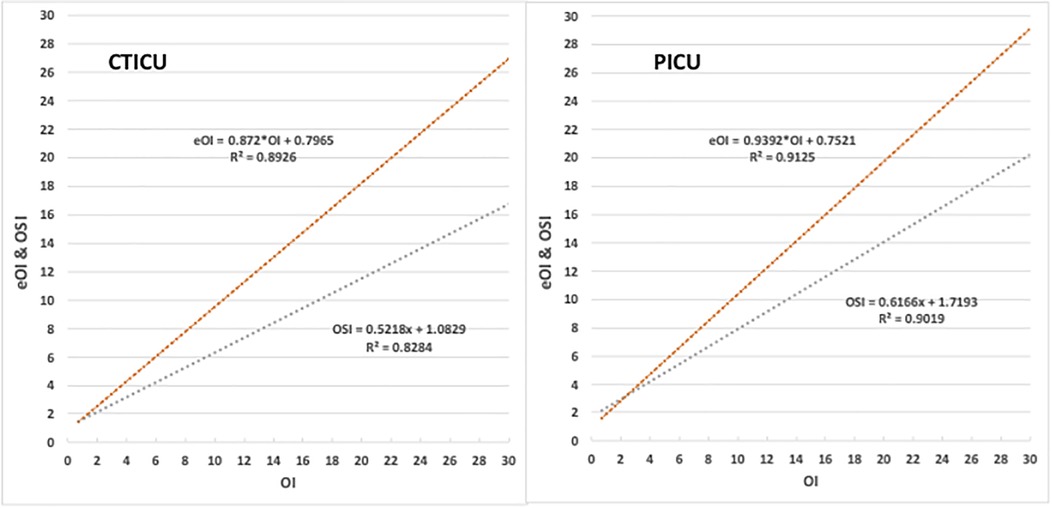
Figure 2. Comparison of eOI and OSI to OI. Panel on left is the CTICU, and the right PICU. Upper red line is eOI vs. OI, lower blue the OSI vs. OI.
The ability of eOI to discriminate at thresholds of OI ≥4, OI ≥8 and OI ≥16 for both SpO2 above and below 97% SpO2 is excellent, as reported in Table 3. In the PICU the performance for both OIs is (AUROC between 0.933 and 0.985). In the CTICU the performance is similar (AUROC between 0.909 and 0.985) in all but OI ≥4 when SpO2 is >97% (0.830).
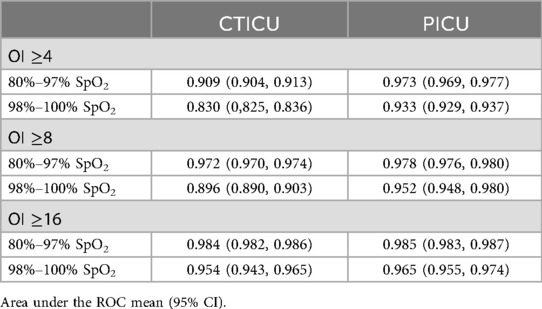
Table 3. Discrimination of hypoxemia severity using eOI (AUROC).
Discussion
We evaluated the performance of a method of estimating OI using noninvasive parameters, in nearly 70,000 observations from our critical care populations. We verified its performance in our PICU, a population similar to the one from which it was developed and also subsequently validated. We also found it was effective in our CTICU, a new population in which it had not been tested.
Our results from our PICU were consistant with those of Sauthier's, though the populations were slightly different. The verification set used by Sauthier and colleagues was much smaller than our PICU verification set. (24,782 observations in 3,308 subjects compared to 12,047 observations in 926 subjects). Their validation population included a significant portion of patients receiving noninvasive respiratory support, whereas our population consisted entirely of mechanically ventilated patients. However, the median severity of hypoxemia of the two were similar (OI: 4.3 and 5.4). They reported a Bias in eOI of 0.13 above and 0.15 below a 97% SpO2. Overall, we found the bias to be slightly less than they reported. Between 80%−100% SpO2, the Bias in our PICU was 0.06 (CI: 0.03, 0.10). Our analysis by SpO2 strata, however, identified positive and negative biases among SpO2 strata, which were comparable to their results. The ability to discriminate standard levels of hypoxemia, was generally comparable based on the area under the ROC but slightly better in our data for an OI of 4 with a SpO2 of >97% (0.93 vs. 0.88).
Our report is to our knowledge the first evaluation of the equation in cardiothoracic subjects. Of note, while we did not exclude subjects with cyanotic heart anomalies, we only evaluated SpO2 observations of 70% or higher. In the aggregate, the Bias and Limits of Agreement were comparable to our findings in the PICU. There was a larger Bias when SpO2 was less than 93%. In the CTICU eOI tended to read lower than the actual OI, while it was slightly higher above 93%. This trend or slope was the opposite in the PICU. Variations among SpO2 strata were not available in the previous validation. Nevertheless, this small difference that we identified does not seem clinically relevant.
Our findings also support the conclusion of Sauthier and colleagues; that use of eOI offers advantages over OSI. Most importantly it may be useful in subjects with SpO2 levels greater than 97%, when OSI is not available. In addition, its values are consistent with OI, and also offers a marginally better coefficient of determination below 97%. This is not surprising in that the Sauthier algorithm not only excludes unreliable SpO2 readings, but also adjusts for the nonlinearity of the PO2-SO2 relationship. Of course, eOI requires more sophisticated calculations and cannot be guesstimated at bedside. Though, eOI and OSI provide excellent discrimination of hypoxemic severity, it should be reiterated that their lack of precision limits their use for therapeutic decisions. Another recent study of the use of this equation for calculating ePF ratios in children who were receiving noninvasive respiratory support also demonstrated similar advantages over SF ratios (14).
The advantage of integrating the SpO2, meanPaw, and FiO2 measurements and following an eOI on a monitor or decision support system is seductive. The question is whether it would have clinical utility. Certainly, the Bias of eOI is more than adequate for such a purpose. As noted, the lack of precision reflected in the Limits of Agreement is a significant concern for reliability. In a continuous derived signal, it would not be any more erratic than SpO2 can be at times, and could provide a useful trend in severity of hypoxemia. Likely it would be better with unreliable SpO2 readings not included in the calculations. Changes in pH, PCO2, and body temperature all shift the oxygen dissociation curve and practical matters associated with pulse oximeters accuracy (15) are also in play. Those are reflected equally in SpO2 and eOI values. We suggest that an integrated continuous eOI or ePF signal along with SpO2 might be an improvement but only if averaging minimized physiological noise reflected in the wide Limits of Agreement. Even so, the clinical utility of such a continuous monitored parameter requires further evaluation especially as it interacts with current PEEP guidelines recommended for pediatric ARDS.
Our study has a number of strengths. First the data in our database is reliable. It is automatically collected and not subject to transcription errors likely in older smaller studies. Nevertheless, the PaO2 measurements could not be precisely aligned with the SpO2 averages. Our verification of the eOI accuracy in the PICU is both independent from the developers and also a much larger sample population. Both supporting projectability to other centers. Our verification of its effectiveness in cardiothoracic subjects also extends its utility, potentially including SpO2 levels between 70%–80%. Our study also has some limitations. Our population were all receiving mechanical ventilation, although a good proportion did not meet the criteria for mild hypoxemia. The analytical approach we used did not account for multiple observations of subjects, however given the small proportion of repeated measurements and large sample size, we consider it unlikely to have had a substantial effect on the results. Finally, we only tested the discrimination effectiveness at OIs of 4, 8 and 16. Use as a monitor of severity of hypoxemia would require verification across a much wider range of OIs.
Conclusion
We independently evaluated a new algorithm for estimating Oxygenation Index, that requires only noninvasive measurement readily available from today's patient data monitoring systems. We validated its performance in both critically ill general and cardiothoracic children. We found it suitable for assessing the severity of hypoxemia, and see potential for its use in continuous decision support systems. The latter requiring focused applied research.
Data availability statement
The raw data supporting the conclusions of this article will be made available by the authors, without undue reservation.
Ethics statement
The studies involving humans were approved by approved 2/21/22 by CHLA-IRB, CHLA-23-0019, Implications of Hyperoxemia and Hypoxemia in ICU Patients). The studies were conducted in accordance with the local legislation and institutional requirements. The human samples used in this study were acquired from a by- product of routine care or industry. Written informed consent for participation was not required from the participants or the participants' legal guardians/next of kin in accordance with the national legislation and institutional requirements.
Author contributions
TB: Conceptualization, Formal analysis, Methodology, Writing – original draft, Writing – review & editing. CN: Conceptualization, Data curation, Investigation, Methodology, Writing – review & editing. NP: Data curation, Writing – review & editing. PR: Writing – review & editing.
Funding
The author(s) declare that no financial support was received for the research and/or publication of this article.
Conflict of interest
The authors declare that the research was conducted in the absence of any commercial or financial relationships that could be construed as a potential conflict of interest.
Generative AI statement
The author(s) declare that no Generative AI was used in the creation of this manuscript.
Any alternative text (alt text) provided alongside figures in this article has been generated by Frontiers with the support of artificial intelligence and reasonable efforts have been made to ensure accuracy, including review by the authors wherever possible. If you identify any issues, please contact us.
Publisher's note
All claims expressed in this article are solely those of the authors and do not necessarily represent those of their affiliated organizations, or those of the publisher, the editors and the reviewers. Any product that may be evaluated in this article, or claim that may be made by its manufacturer, is not guaranteed or endorsed by the publisher.
Supplementary material
The Supplementary Material for this article can be found online at: https://www.frontiersin.org/articles/10.3389/fped.2025.1675130/full#supplementary-material
References
1. Khemani RG, Smith LS, Zimmerman JJ, Erickson S, Pediatric Acute Lung Injury Consensus Conference Group. Pediatric acute respiratory distress syndrome: definition, incidence, and epidemiology: proceedings from the pediatric acute lung injury consensus conference. Pediatr Crit Care Med. (2015) 16(s5):s23–40. doi: 10.1097/PCC.0000000000000432
2. Khemani RG, Rubin S, Belani S, Leung D, Erickson S, Smith LS, et al. Pulse oximetry vs. PaO2 metrics in mechanically ventilated children: berlin definition of ARDS and mortality risk. Intensive Care Med. (2015) 41:94–102. 6:S23–S40 doi: 10.1007/s00134-014-3486-2
3. Schneider N, Johnson M. Management of paediatric acute respiratory distress syndrome. BJA Educ. (2022) 22(9):364–70. doi: 10.1016/j.bjae.2022.04.004
4. Severinghaus JW. Simple, accurate equations for human blood O2 dissociation computations. J Appl Physiol Respir Environ Exerc Physiol. (1979) 46:599–602. doi: 10.1152/jappl.1979.46.3.599
5. Gadrey SM, Lau CE, Clay R, Rhodes GT, Lake DE, Moore CC, et al. Imputation of partial pressures of arterial oxygen using oximetry and its impact on sepsis diagnosis. Physiol Meas. (2019) 40:115008. doi: 10.1088/1361-6579/ab5154
6. Sauthier M, Tuli G, Jouvet PA, Brownstein JS, Randolph AG. Estimated Pao2: a continuous and noninvasive method to estimate Pao2 and oxygenation Index. Crit Care Explor. (2021) 3(10):e0546. doi: 10.1097/CCE.0000000000000546
7. Khemani RG, Celikkaya EB, Shelton CR, Kale D, Ross PA, Wetzel RC, et al. Algorithms to estimate PaCO2 and pH using noninvasive parameters for children with hypoxemic respiratory failure. Respir Care. (2014) 59(8):1248–57. doi: 10.4187/respcare.02806
8. Bhalla AK, Belani S, Leung D, Newth CJL, Khemani RG. Higher dead space is associated with increased mortality in critically ill children. Crit Care Med. (2015) 43(11):2439–45. doi: 10.1097/CCM.0000000000001199
9. Newth CJL, Sward KA, Khemani RG, Page K, Meert KL, Carcillo JA, et al. Variability in usual care mechanical ventilation for pediatric acute respiratory distress syndrome: time for a decision support protocol? Pediatr Crit Care Med. (2017) 18:e521–9. doi: 10.1097/PCC.0000000000001319
10. Dong J, Xu-Wilson M, Conroy BR, Khemani RG, Newth CJL. Continuous noninvasive blood gas estimation in critically ill pediatric patients with respiratory failure. Sci Rep. (2022) 12(1):9853. doi: 10.1038/s41598-022-13583-6
11. Khemani RG, Hotz JC, Sward KA, Newth CJL. The role of computer-based clinical decision support systems to deliver protective mechanical ventilation. Curr Opin Crit Care. (2020) 26:73–81. doi: 10.1055/s-0035-1568161
12. Khemani RG, Bhalla A, Hotz JC, Klein MJ, Kwok J, Kohler K, et al. Randomized trial of lung and diaphragm protective ventilation in children. NEJM Evid. (2025) 4(6):EVIDoa2400360. doi: 10.1056/EVIDoa2400360
13. Bland JM, Altman DG. Statistical methods for assessing agreement between two methods of clinical measurement. Lancet. (1986) 327:307–10. doi: 10.1016/S0140-6736(86)90837-8
14. Beauchamp FO, Sauthier M. A continuous and noninvasive method to estimate Pao2/Fio2 ratio. Crit Care Explor. (2024) 6(11):e1174. doi: 10.1097/CCE.0000000000001174
Keywords: hypoxemia severity, oxygen saturation, oxygenation index, pediatric critical care, validation & verification (V&V) 40
Citation: Bachman TE, Newth CJL, Patel N and Ross PA (2025) Noninvasive estimation of oxygenation index in pediatric critical care: an independent retrospective observational validation. Front. Pediatr. 13:1675130. doi: 10.3389/fped.2025.1675130
Received: 28 July 2025; Accepted: 18 September 2025;
Published: 2 October 2025.
Edited by:
Michael Hermon, Medical University of Vienna, AustriaReviewed by:
Oğuz Dursun, Akdeniz University, TürkiyeTobias Werther, Medical University of Vienna, Austria
Copyright: © 2025 Bachman, Newth, Patel and Ross. This is an open-access article distributed under the terms of the Creative Commons Attribution License (CC BY). The use, distribution or reproduction in other forums is permitted, provided the original author(s) and the copyright owner(s) are credited and that the original publication in this journal is cited, in accordance with accepted academic practice. No use, distribution or reproduction is permitted which does not comply with these terms.
*Correspondence: Thomas E. Bachman, dGJhY2htYW5AbWUuY29t