 Xiaoda Yang
 Hongshun Qiu
 Yuxiang Zhang
 Peijian Zhang
- College of Computer Science and Technology, Qingdao University, Qingdao, China
The target of the study is to predict the inhibitory effect of amide derivatives on xanthine oxidase (XO) by building several models, which are based on the theory of the quantitative structure–activity relationship (QSAR). The heuristic method (HM) was used to linearly select descriptors and build a linear model. XGBoost was used to non-linearly select descriptors, and radial basis kernel function support vector regression (RBF SVR), polynomial kernel function SVR (poly SVR), linear kernel function SVR (linear SVR), mix-kernel function SVR (MIX SVR), and random forest (RF) were adopted to establish non-linear models, in which the MIX-SVR method gives the best result. The kernel function of MIX SVR has strong abilities of learning and generalization of established models simultaneously, which is because it is a combination of the linear kernel function, the radial basis kernel function, and the polynomial kernel function. In order to test the robustness of the models, leave-one-out cross validation (LOOCV) was adopted. In a training set,
1 Introduction
Hyperuricemia is a chronic metabolic disorder caused by impaired purine metabolism (Yang et al., 2022; Zeng et al., 2022; Johnson et al., 2023). Excess serum uric acid induces the formation of monosodium uric acid crystal deposits, which eventually leads to gout. In addition, hyperuricemia is also associated with many other chronic diseases, such as cardiovascular diseases, hypertension, and kidney disease (Johnson et al., 2023).
Xanthine oxidase (XO) is a key rate-limiting enzyme in the purine metabolism pathway. It catalyzes the oxidation of hypoxanthine and xanthine to uric acid with reactive oxidants being released in the process (Cicero et al., 2021; Yang et al., 2022). Excessive oxidants may lead to an oxidative stress reaction in the cells, which can lead to cell damage, and excessive oxidants are involved in many pathological processes, such as diabetes, chronic heart failure, and atherosclerosis (Jin et al., 2022). Therefore, XO is an important therapeutic target not only for the treatment of hyperuricemia and gout but also for many diseases related to oxidative stress.
Current therapeutic approaches for gout are mainly based on lowering serum uric acid levels; these approaches include the inhibition of XO, promotion of uric acid excretion, or alkalinization of urine (Fathallah-Shaykh and Cramer, 2014; Feng et al., 2022). One effective treatment for patients with hyperuricemia is the use of XO inhibitors, which directly block the oxidation of hypoxanthine and xanthine to produce uric acid. Several XO inhibitors have been developed, such as clinically approved allopurinol and febuxostat (Kojima et al., 2016; Packer, 2020). However, side effects of these drugs have been observed during clinical applications, so it is important to find new XO inhibitors.
Amide derivatives are a newly discovered type of XO inhibitors that have significant research value. Although assessing the inhibitory effect of XO (
In this study, QSAR models were established by linear and non-linear methods based on descriptors selected by the heuristic method (HM) and XGBoost methods. Comparing the performance of models developed by linear regression, support vector regression (SVR), and random forest (RF) regression, it was observed that the model built by mix kernel SVR exhibits the best predictive ability and robustness.
2 Materials and methods
2.1 Data preparation
The compounds listed in Table 1 were taken from the following papers: Tu et al., 2021; Zhang et al., 2021; Zhang et al., 2022. All
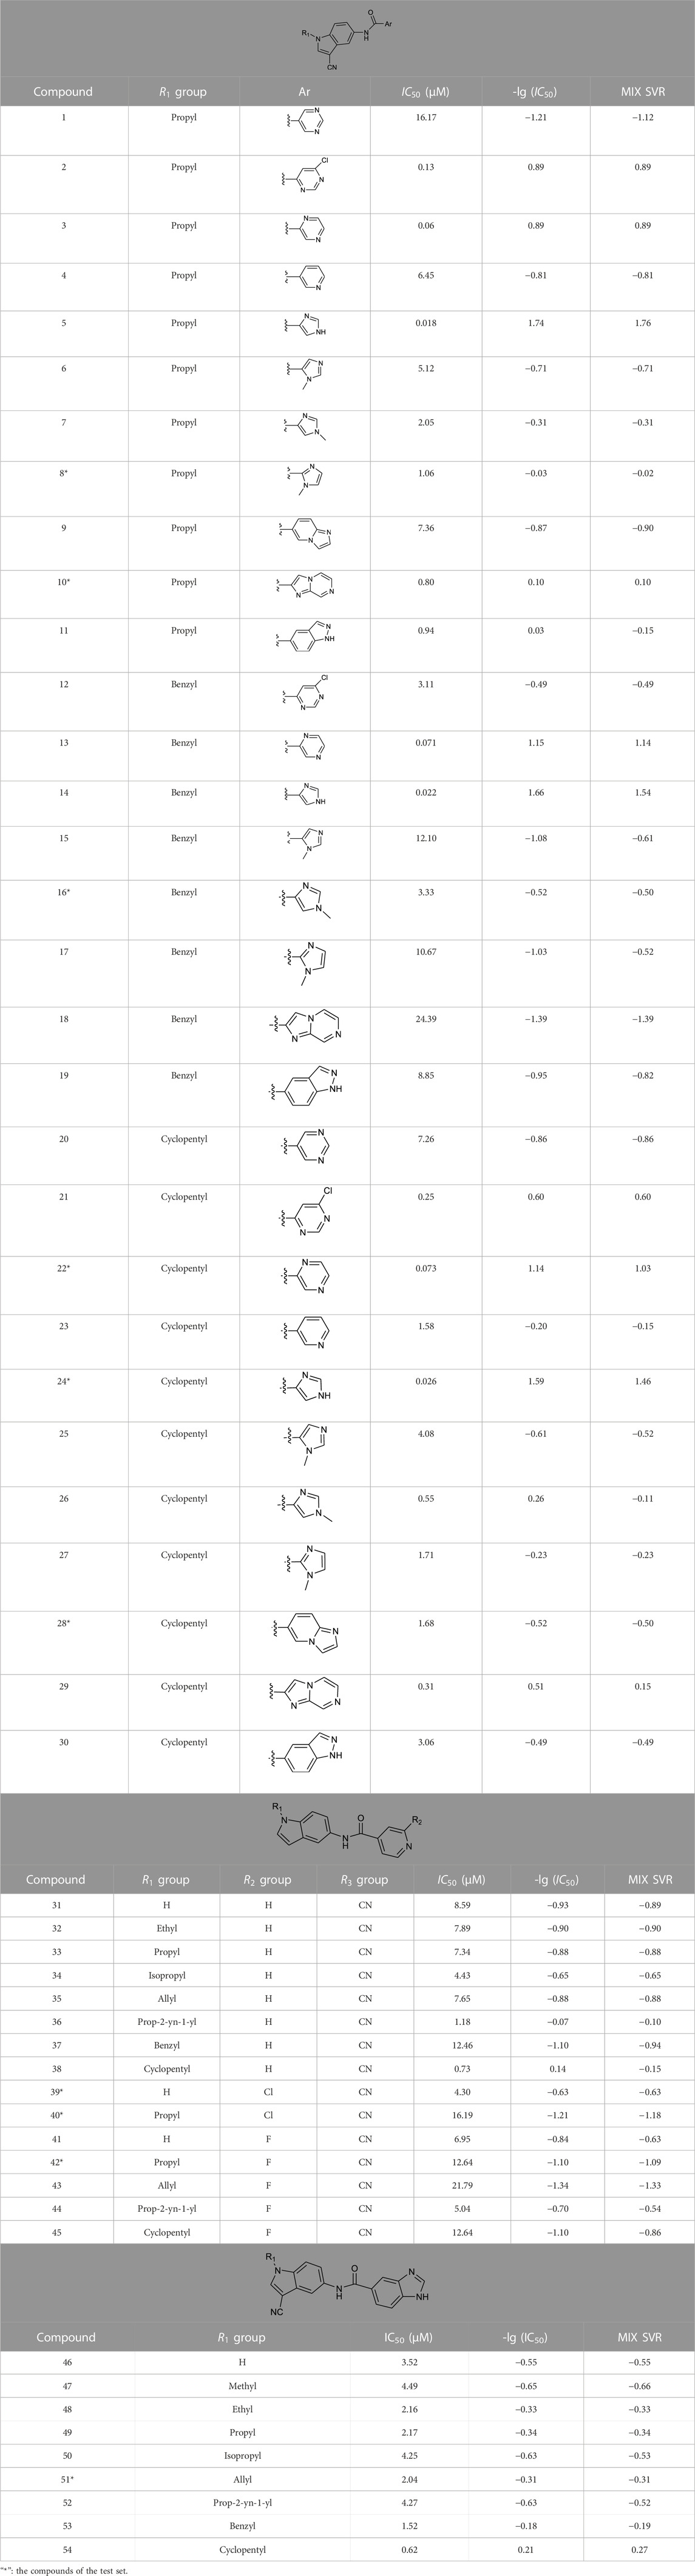
TABLE 1. In vitro XO inhibitory potency of compounds.
2.2 Descriptor calculation
The process of descriptor calculation is the basis of constructing QSAR models. First, the structures of these compounds were drawn using ChemDraw software. The result file was then imported into HyperChem and optimized using MM+ in the molecular mechanics force field. Second, the semi-empirical method was used to carry out further optimization so that the compound could have the lowest energy. According to the principle of minimum potential energy, molecular stability is enhanced by minimizing the energy state of a system, with lower energy states resulting in greater stability. After this process, the corresponding result file was sent to MOPAC software to change the format. Finally, five classes of descriptors were calculated using CODESSA software. These classes include topological, constitutional, geometrical, quantum chemical, and electrostatic descriptors (Katritzky et al., 2006).
2.3 Linear model by the heuristic method
The heuristic method, an efficient approach for descriptor selection and linear model construction, has no limitation to the size of the dataset (He et al., 2014; Si et al., 2021b). Before executing the model establishment algorithm, descriptors should be pre-selected under the guidance of the following principles: non-generic descriptors and descriptors with a constant value should be removed, and descriptors with a large correlation coefficient (greater than 0.8) should also be discarded (Si et al., 2021b).
The descriptor selection process by the HM involves calculating intercorrelations between all descriptors and identifying pairs with high regression coefficients but low correlation coefficients. Non-collinear descriptors are added to these pairs to perform higher-order regression treatments, and the final equation is selected based on the maximum Fisher criterion and the highest cross-validated correlation coefficient used in the linear model (Katritzky et al., 1995).
2.4 Non-linearly selecting descriptors by XGBoost
In order to improve the performance and robustness of the non-linear model, a non-linear method is used to select descriptors. XGBoost can be adopted to perform non-linear dimensionality reduction, which is mainly based on feature importance evaluation (Chen et al., 2020). There are two ways to calculate feature importance in XGBoost: based on the coverage or on the split gain.
The coverage method determines feature importance by calculating the sum of the number of times that each feature occurs in all tree nodes. The higher the coverage is, the more important the feature is considered to be. This method is useful when working with datasets that have many features as it provides a quick way of identifying the most relevant features.
The split gain method determines feature importance by calculating the information gain of each feature when the decision tree is split. The higher the split gain, the more important the feature is considered to be. This method is especially useful when working with datasets that have complex relationships between the features as it can capture subtler interactions than the coverage method.
The split gain method is the default method used by XGBoost if no extra settings are added because the split gain method is generally more effective at capturing the underlying relationships between the features in the dataset. The coverage method provides a quick and simple way to evaluate feature importance, but it tends to favor features with a high cardinality. However, both methods have their own strengths and weaknesses, and the choice of which method to use will depend on the specific dataset and the goals of the analysis.
2.5 Non-linear model by the random forest
Random forest is a popular bagging algorithm, which combines multiple decision trees to make accurate predictions in a regression. This algorithm creates multiple decision trees by randomly selecting subsets of features and data samples, and then averaging their outputs to obtain the final prediction. In this process, as the depth of the tree increases, the entropy of sample types under decision tree branches will also increase, which will seriously affect the efficiency of the decision tree and increase the risk of overfitting. Therefore, the random forest reduces the overfitting probability and improves the generalization ability of the model by pruning and other methods. These methods remove unnecessary nodes or branches from the decision tree.
Random forest has the advantages of fast training and good performance in a classification, and it can handle non-linear data very well. However, compared to other regression methods like SVR, the performance of random forests may be affected by outliers in the data, which can result in reduced robustness. Therefore, its performance somewhat depends on the dataset.
2.6 Non-linear model by SVR
The support vector machine (SVM) (Vapnik, 1995) is a classification algorithm proposed by Vapnik et al., in 1990. The SVM uses kernel tricks to map data into higher dimensions and find optimal hyperplanes, allowing it to handle non-linear problems with great accuracy. The SVM aims to minimize the difference between predicted and actual values and, at the same time, maximize the distance between the hyperplane and sample points. This approach was later extended to support vector regression for regression problems, which has demonstrated strong performance. Generalization performance and robustness of regression models based on the SVR approach can be enhanced (Tang et al., 2022; Helmy et al., 2023; Ying et al., 2023).
Because SVR is very sensitive to the scale of the input data, normalization must be executed before the SVR process to ensure the accuracy and robustness of the model to be established.
After performing normalization, the next step is to establish models by SVR. First, the original problem is transformed into a dyadic problem while satisfying the Karush–Kuhn–Tucker (KTT) principle, and the Lagrange multiplier method is used on the basis of the dyadic problem. Ultimately, the problem can be simplified to solve the following quadratic convex programming problems:
The initial SVR excelled in solving linear problems rather than non-linear problems, so the kernel method was then introduced to solve non-linear problems. It is an easy way that uses the kernel function to calculate the inner product in Eq. 1 after mapping it to a higher dimensional space. Common kernel functions include linear kernel functions, polynomial kernel functions, and radial basis kernel functions. We replace
Moreover, a soft-interval SVM was introduced to enhance the robustness of the SVM, which controls the tolerance of the SVM to noise by introducing relaxation variables and penalty factors.
2.7 PSO parameter optimization (Eberhart and Kennedy, 2023)
Since the RF and MIX-SVR algorithm has many parameters that are not independent, particle swarm optimization (PSO) was used for parameter optimization in RFs and MIX SVR.
PSO, an optimization algorithm based on population intelligence, was first proposed by Eberhart and Kennedy in 1995. PSO is a vector-based method, which achieves optimal search by sharing information among populations, and all iterations update the position vector and velocity vector, according to the following two equations:
where
Based on the traditional PSO algorithm, some improvements have been made. Because some parameters can only be integer values, while some parameters take values in the whole real number domain, mixed optimization is introduced, which means that the improved algorithm will automatically match, whether it is for integer optimization or real number optimization. The principle of solving the integer search problem is based on the original real number search problem, which involves rounding the real number x generated by each operation to the nearest integer to participate in the next operation.
In addition, the improvement of PSO also involved the method of linear decreasing weights, which means the pace is very large at first but decreases with each epoch. The weight varies according to Eq. 7, where
3 Results
3.1 Linear model by the HM
A total of 646 descriptors were calculated according to the descriptor calculation step described in the descriptor calculation subsection. The number of descriptors in linear models was increased from one to seven, and the corresponding
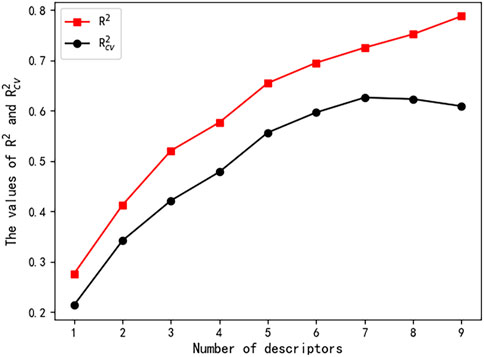
FIGURE 1. Influence of the number of descriptors on
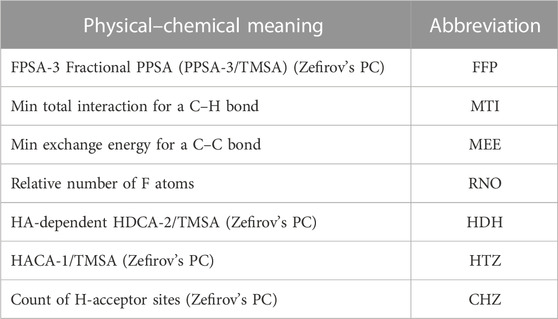
TABLE 2. Physical–chemical meaning of the chosen descriptors.
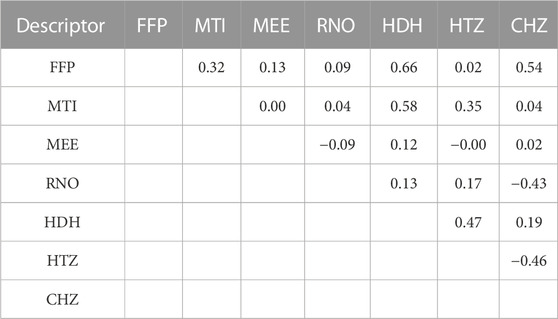
TABLE 3. Correlation matrix of descriptors by the HM.
Based on the seven descriptors selected by the HM, the linear model was built and shown in Eq. 8. As shown in Figure 2, the linear model did not achieve satisfactory results. Moreover, as shown in Figure 1, the

FIGURE 2. Plot of the experimental and calculated −lg (
The
3.2 Non-linearly selecting descriptors by XGBoost
Non-linear descriptor selection can better capture complex non-linear relationships in the data (Yamada et al., 2018). As selecting descriptors by the HM is a linear method, XGBoost is a non-linear method by contrast, so it was chosen to select a new group of descriptors before building a non-linear model.
All calculated descriptors exported from CODESSA were pre-processed, and non-generic descriptors were removed. As mentioned previously, XGBoost selects descriptors by calculating the importance of each descriptor based on the split gain method. Figure 3 shows the importance of the highest four descriptors. The cumulative importance of the four descriptors reached 85%, which can already express the complete characteristics of the dataset. Adding the fifth descriptor will not significantly increase the expressiveness, but will increase the risk of overfitting; therefore, the four descriptors shown in Table 4 were chosen for the sake of balance.
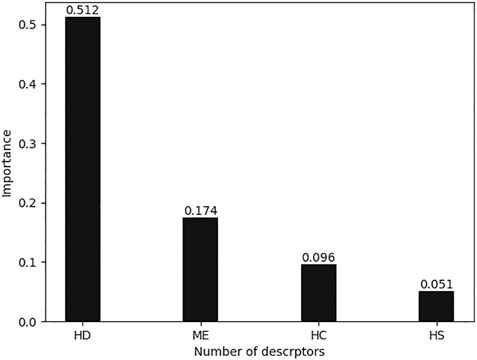
FIGURE 3. Importance of descriptors selected by XGBoost.
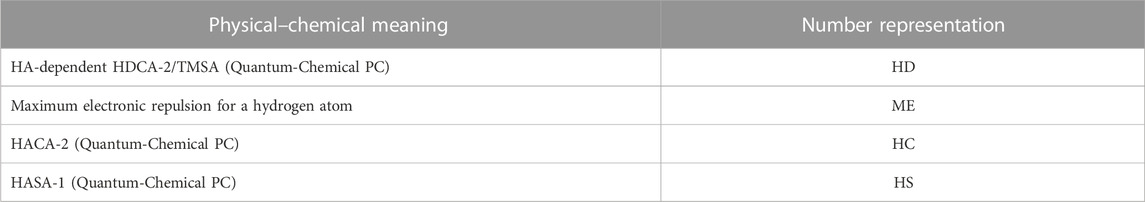
TABLE 4. Physical–chemical meaning of the chosen descriptors.
The correlation matrix is shown in Table 5, so as to initially verify the validity of the selected descriptors. As shown in Table 5, the correlation coefficient of any two descriptors is less than 0.5, which means that a non-linear method can be built using these descriptors.
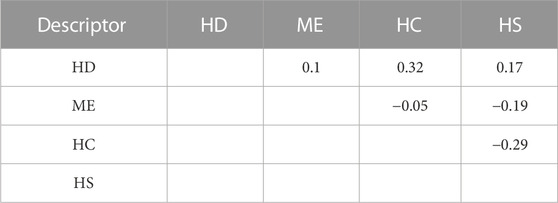
TABLE 5. Correlation matrix of descriptors by XGBoost.
3.3 Non-linear model by RFs
The RF method is a popular regression method, which performs well in many research fields (Gao et al., 2022). Four important parameters should be determined when building models using this method. Their names and functions are as follows:
(1) Number of trees (NT): Increasing the number can improve the model performance at the cost of computational complexity.
(2) Maximum depth of the tree (MD): The purpose of this parameter is to prevent overfitting by controlling the depth of the tree. Increasing the maximum depth can improve the model performance at the cost of the risk of overfitting.
(3) Minimum number of samples required to split internal nodes (MS): The purpose of this parameter is to control the minimum size of leaf nodes to avoid overfitting. Increasing this parameter may lead to underfitting.
(4) Minimum number of samples required for leaf nodes (ML): It is used in the pre-pruning of the decision tree.
The PSO method is adopted to tune the hyperparameters; one relatively good set of parameters are NT = 522, MD = 13, MS = 7, and ML = 4. The tuning process of the model based on RFs by PSO is shown in Figure 4. The
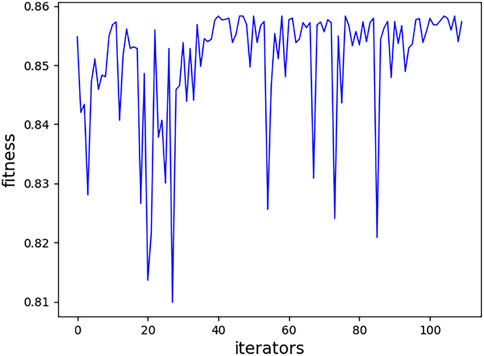
FIGURE 4. Fitness of each iteration.
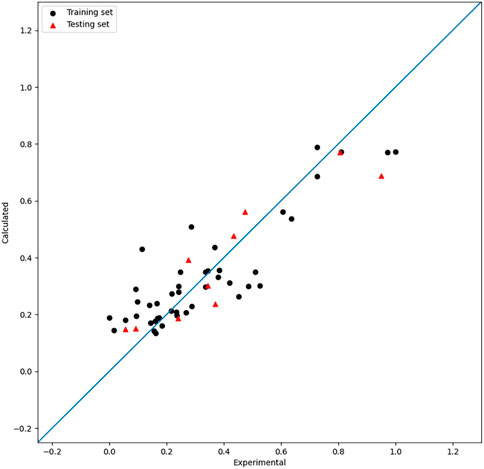
FIGURE 5. Plot of the experimental and calculated −lg (
3.4 Non-linear models by single-kernel SVR
To ensure comparability between models, the same four descriptors selected by XGBoost were used in the models built by linear-kernel SVR, polynomial kernel function (poly)-kernel SVR, and radial basis kernel function (RBF)-kernel SVR. The
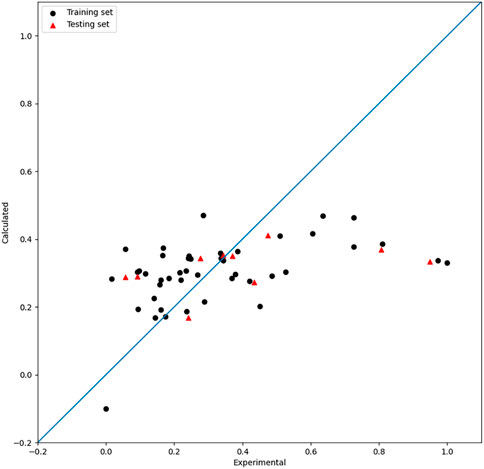
FIGURE 6. Plot of the experimental and calculated −lg (
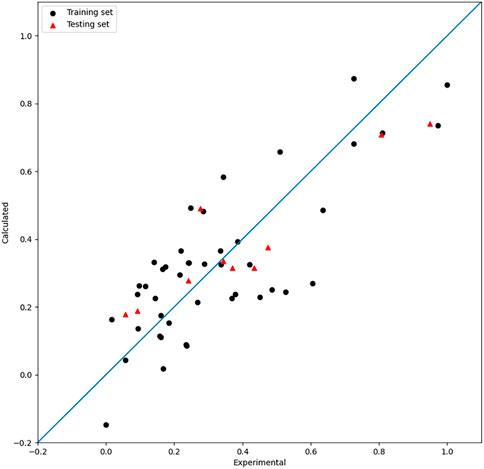
FIGURE 7. Plot of the experimental and calculated −lg (

FIGURE 8. Plot of the experimental and calculated −lg (
As shown in the results, the three models by single-kernel functions did not perform well, which is related to their characteristics. So attempts were made to get better models by combining different kernels. The radial basis kernel function is strong in fitting, which increases the possibility of overfitting to some extent. The polynomial kernel function and the linear kernel function show good generalization performances, which increases the possibility of underfitting to some extent. MIX SVR is an attempt at combining the superiority of different kernels in order to build a model with both strong generalization and fitness abilities.
3.5 Non-linear model by mix-kernel SVR
For SVR, the choice of the kernel function has an obverse impact on the regression results. As mentioned previously in the single-kernel SVR part, the RBF kernel is good at fitting, while the linear and poly kernel are good at generalization. The kernel function designed in this paper is a proportional combination of these three kernel functions, which improves both the generalization performance and robustness of the model. The mix kernel function is expressed as follows in Eq. 9 (Shawe-Taylor and Cristianini, 2004):
After adjusting the parameters using PSO, optimum
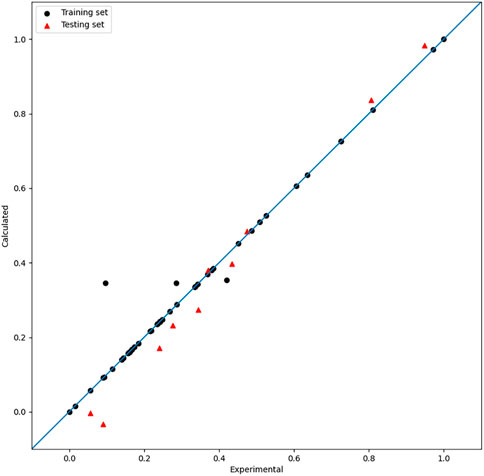
FIGURE 9. Plot of the experimental and calculated −lg (
4 Discussion
A visual comparison is shown in Table 6. As shown in the table, the
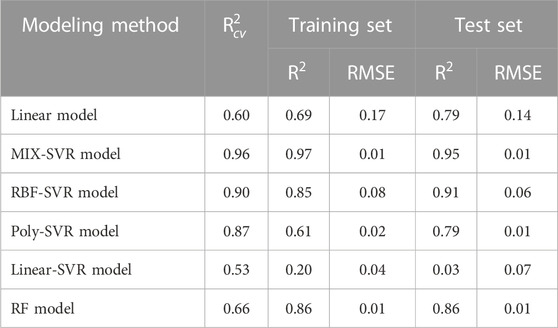
TABLE 6. Comparison of the results between different modeling methods.
The MIX-SVR method can effectively fit the data without overfitting because it takes advantage of the complementary features of polynomial and radial basis kernel functions. Overall, the mix-kernel SVR method is a promising approach for use in various applications requiring accurate and reliable regression analysis results.
The descriptor-labeled HD is the surface area of the hydrogen donor divided by the total area of the molecule. It has been determined to hold the greatest significance among the four descriptors being evaluated. This suggests that it is likely a variable that is strongly associated with the dependent variable or that it possesses a high degree of predictive power. In addition, this descriptor may also enhance model performance by collaborating with other descriptors. The second descriptor, ME, has the maximum electron–electron repulsive force between electron clouds in a hydrogen atom. The inter-electron repulsion affects the reaction rate to some extent. HS is the surface area of the hydrogen-bonded receptors in the molecule. Molecules with more hydrogen-bonded receptors can form tighter bindings to target proteins. HC is the surface charge of the hydrogen bonding donor atom. They are both quantum chemical descriptors, which can be used to predict their chemical properties.
5 Conclusion
The performance and robustness of the models constructed by mix-kernel SVR have been verified in predicting the
Data availability statement
The original contributions presented in the study are included in the article/Supplementary Material; further inquiries can be directed to the corresponding author.
Author contributions
All authors contributed to the conception and design of the study. XY and YZ completed the data preparation; XY wrote the code; all authors worked together on the tuning and training; XY wrote the first draft of the manuscript. All authors contributed to the article and approved the submitted version.
Acknowledgments
During the process of writing this article, the authors’ team received a lot of support and assistance. First, the authors would like to express their sincerest gratitude to the experimental data provider of their team, Ting Jian Zhang from China Pharmaceutical University. Second, the authors would like to express their gratitude to their fellow senior brothers who provided them with valuable advice. It is precisely their help that had enabled them to forge ahead and explore bravely when their thinking encountered obstacles. Moreover, the authors are very grateful for these software applications: ChemDraw Ultra 8.0 CambridgeSoft, HyperChem Professional, MOPAC, and CODESSA, by Katritzky and AR. Last, but most importantly, they would like to thank their mentor PZ, who is the corresponding author of this article. His professional knowledge has been invaluable in formulating research questions and methods. His insightful feedback has prompted the author to improve their thinking and elevate their team’s work to a higher level.
Conflict of interest
The authors declare that the research was conducted in the absence of any commercial or financial relationships that could be construed as a potential conflict of interest.
Publisher’s note
All claims expressed in this article are solely those of the authors and do not necessarily represent those of their affiliated organizations, or those of the publisher, the editors, and the reviewers. Any product that may be evaluated in this article, or claim that may be made by its manufacturer, is not guaranteed or endorsed by the publisher.
Supplementary material
The Supplementary Material for this article can be found online at: https://www.frontiersin.org/articles/10.3389/fphar.2023.1227536/full#supplementary-material
References
Chen, C., Si, H. J. C. C., Yang, C. S., Cheng, F. J., Chiu, Y. F., Chen, H. F., et al. (2021). Screening strategy of TMPRSS2 inhibitors by FRET-based enzymatic activity for TMPRSS2-based cancer and COVID-19 treatment. Am. J. Cancer Res. 33, 827–836. doi:10.54762/ccr2022.827-835
Chen, C., Zhang, Q., Yu, B., Yu, Z., Lawrence, P. J., Ma, Q., et al. (2020). Improving protein-protein interactions prediction accuracy using XGBoost feature selection and stacked ensemble classifier. Comput. Biol. Med. 123, 103899. doi:10.1016/j.compbiomed.2020.103899
Chen, T., and Guestrin, C. Knowledge Discovery and Data Mining, Proceedings of the 22nd acm sigkdd international conference on knowledge discovery and data mining. 785-794. San Francisco, California, USA, August2023
Chen, Y., Ma, K., Xu, P., Si, H., Duan, Y., and Zhai, H. (2022). Design and screening of new lead compounds for autism based on QSAR model and molecular docking studies. Molecules 27, 7285. doi:10.3390/molecules27217285
Cicero, A. F. G., Fogacci, F., Kuwabara, M., and Borghi, C. (2021). Therapeutic strategies for the treatment of chronic hyperuricemia: An evidence-based update. Med. Kaunas. 57, 58. doi:10.3390/medicina57010058
Eberhart, R., and Kennedy, J. “MHS'95,” in Proceedings of the Sixth International Symposium on Micro Machine and Human Science, Nagoya, Japan, October 2023, 39–43.
Fathallah-Shaykh, S. A., and Cramer, M. T. (2014). Uric acid and the kidney. Pediatr. Nephrol. 29, 999–1008. doi:10.1007/s00467-013-2549-x
Feng, S., Wu, S., Xie, F., Yang, C. S., and Shao, P. (2022). Natural compounds lower uric acid levels and hyperuricemia: Molecular mechanisms and prospective. Trends Food Sci. Technol. 123, 87–102. doi:10.1016/j.tifs.2022.03.002
Gao, Z., Xia, R. Z., and Zhang, P. J. (2022). Prediction of anti-proliferation effect of [1,2,3]Triazolo[4,5-d]pyrimidine derivatives by random forest and mix-kernel function SVM with PSO. Chem. Pharm. Bull. 70, 684–693. doi:10.1248/cpb.c22-00376
He, D., Ma, J., Shi, X., Zhao, C., Hou, M., Guo, Q., et al. (2014). Design, synthesis, and potent antiepileptic activity with latent nerve rehabilitation of novel γ-aminobutyric acid derivatives. Chem. Pharm. Bull. (Tokyo) 62, 967–978. doi:10.1248/cpb.c14-00329
Helmy, M., Truong, T. T., Jul, E., and Ferreira, P. (2023). Deep learning and computer vision techniques for microcirculation analysis: A review. Patterns (N Y) 4, 100641. doi:10.1016/j.patter.2022.100641
Jin, Y., Liu, X., Zhou, J., Wang, L., Pan, S., and Lu, H., (2022). Inhibitory effect and mechanism of ‘Taizi Yangrong Decoction’on oral mucositis after radiotherapy for nasopharyngeal carcinoma in vivo and in vitro. Cancer Cell Res. 36. doi:10.54762/ccr2022.877-885
Johnson, R. J., Sanchez Lozada, L. G., Lanaspa, M. A., Piani, F., and Borghi, C. (2023). Uric acid and chronic kidney disease: Still more to do. Kidney Int. Rep. 8, 229–239. doi:10.1016/j.ekir.2022.11.016
Katritzky, A. R., Kulshyn, O. V., Stoyanova-Slavova, I., Dobchev, D. A., Kuanar, M., Fara, D. C., et al. (2006). Antimalarial activity: A QSAR modeling using CODESSA PRO software. Bioorg Med. Chem. 14, 2333–2357. doi:10.1016/j.bmc.2005.11.015
Katritzky, A. R., Lobanov, V. S., and Karelson, M. (1995). Qspr: The correlation and quantitative prediction of chemical and physical properties from structure. Chem. Soc. Rev. 24, 279–287. doi:10.1039/CS9952400279
Kojima, S., Kojima, S., Hifumi, A., Soejima, H., and Ogawa, H. (2016). Therapeutic strategy for efficient reduction of serum uric acid levels with allopurinol versus benzbromarone in hyperuricemic patients with essential hypertension - a randomized crossover study (terao study). Int. J. Cardiol. 224, 437–439. doi:10.1016/j.ijcard.2016.09.073
Packer, M. (2020). Uric acid is a biomarker of oxidative stress in the failing heart: Lessons learned from trials with allopurinol and SGLT2 inhibitors. J. Card. Fail 26, 977–984. doi:10.1016/j.cardfail.2020.08.015
Shawe-Taylor, J., and Cristianini, N. (2004). N. Kernel Methods for pattern analysis. Cambridge, United Kingdom: Cambridge University Press.
Si, Y., Ma, K., Hu, Y., Si, H., and Zhai, H. L. (2021a). QSAR model study of 2,3,4,5-tetrahydro-1H-pyrido[4,3-b]indole of cystic-brosis-transmembrane conductance-regulator gene potentiators. Lett. Drug Des. Discov. 19. doi:10.2174/1570180818666211022142920
Si, Y., Xu, X., Hu, Y., Si, H., and Zhai, H. (2021b). Novel quantitative structure-activity relationship model to predict activities of natural products against COVID-19. Chem. Biol. Drug Des. 97, 978–983. doi:10.1111/cbdd.13822
Tang, Y., Song, Z., Zhu, Y., Yuan, H., Hou, M., Ji, J., et al. (2022). A survey on machine learning models for financial time series forecasting. Neurocomputing 512, 363–380. doi:10.1016/j.neucom.2022.09.003
Tu, S., Zhang, T. J., Zhang, Y., Zhang, X., Zhang, Z. H., and Meng, F. H. (2021). N-(3-cyano-1H-indol-5-yl)isonicotinamide and N-(3-cyano-1H-indol-5-yl)-1H-benzo[d]imidazole-5-carboxamide derivatives: Novel amide-based xanthine oxidase inhibitors. Bioorg Chem. 115, 105181. doi:10.1016/j.bioorg.2021.105181
Wang, Y., Liu, Z., Qu, A., Zhang, P., Si, H., and Zhai, H. (2020). Study of tacrine derivatives for acetylcholinesterase inhibitors based on artificial intelligence. Lat. Am. J. Pharm. 39, 1159–1170.
Yamada, M., Tang, J., Lugo-Martinez, J., Hodzic, E., Shrestha, R., Saha, A., et al. (2018). Ultra high-dimensional nonlinear feature selection for big biological data. IEEE Trans. Knowl. Data Eng. 30, 1352–1365. doi:10.1109/tkde.2018.2789451
Yang, Y. S., Wang, B., Zhou, K. M., Liu, J., Jiao, Q. C., and Qin, P. (2022). Discovery of derivatives from Spartina alterniflora-sourced moiety as xanthine oxidase inhibitors to lower uric acid. Bioorg Med. Chem. Lett. 73, 128907. doi:10.1016/j.bmcl.2022.128907
Ying, C., Wang, W., Yu, J., Li, Q., Yu, D., and Liu, J. (2023). Deep learning for renewable energy forecasting: A taxonomy, and systematic literature review. J. Clean. Prod. 384, 135414. doi:10.1016/j.jclepro.2022.135414
Zeng, Z., Jin, T., Ni, J., Huang, L., Xie, Y., He, W., et al. (2022). Assessing the causal associations of obstructive sleep apnea with serum uric acid levels and gout: A bidirectional two-sample mendelian randomization study. Semin. Arthritis Rheum. 57, 152095. doi:10.1016/j.semarthrit.2022.152095
Zhang, T. J., Tu, S., Zhang, X., Wang, Q. Y., Hu, S. S., Zhang, Y., et al. (2021). Amide-based xanthine oxidase inhibitors bearing an N-(1-alkyl-3-cyano-1H-indol-5-yl) moiety: Design, synthesis and structure-activity relationship investigation. Bioorg Chem. 117, 105417. doi:10.1016/j.bioorg.2021.105417
Zhang, T. J., Zhang, Z. H., Zhang, X., Wang, Z. R., Xu, E. Y., Tu, S., et al. (2022). Design, synthesis and biological evaluation of N-(4-alkoxy-3-(1H-tetrazol-1-yl)phenyl) heterocyclic aromatic amide derivatives as xanthine oxidase inhibitors. Bioorg Chem. 127, 105938. doi:10.1016/j.bioorg.2022.105938
Keywords: xanthine oxidase inhibitor, quantitative structure activity relationship, amide derivatives, XGBoost, support vector regression, random forest, particle swarm optimization
Citation: Yang X, Qiu H, Zhang Y and Zhang P (2023) Quantitative structure–activity relationship study of amide derivatives as xanthine oxidase inhibitors using machine learning. Front. Pharmacol. 14:1227536. doi: 10.3389/fphar.2023.1227536
Received: 23 May 2023; Accepted: 16 June 2023;
Published: 29 June 2023.
Edited by:
Ming Hao, Leidos Biomedical Research, Inc., United StatesCopyright © 2023 Yang, Qiu, Zhang and Zhang. This is an open-access article distributed under the terms of the Creative Commons Attribution License (CC BY). The use, distribution or reproduction in other forums is permitted, provided the original author(s) and the copyright owner(s) are credited and that the original publication in this journal is cited, in accordance with accepted academic practice. No use, distribution or reproduction is permitted which does not comply with these terms.
*Correspondence: Peijian Zhang, enBqQHFkdS5lZHUuY24=
†These authors have contributed equally to this work and share senior authorship