 Tong Gao
 Wen Xu
 Qie Guo
 Ping Leng
 Jialin Sun
- Department of Pharmacy, The Affiliated Hospital of Qingdao University, Qingdao, China
Background: Immunosuppressive therapy remains the primary method for preventing rejection in renal transplant recipients. While multiple population pharmacokinetic (popPK) models of mycophenolate sodium (MPS) have been developed for this population, their predictive performance across different clinical settings remains unverified. This study systematically evaluated published MPS popPK models through external validation to assess their extrapolation potential.
Methods: Published MPS popPK models for renal transplant recipients were identified through systematic searches of PubMed, Embase and Web of Science. These models were externally evaluated using a cohort of renal transplant patients receiving MPS therapy at the Affiliated Hospital of Qingdao University. Model prediction performance was evaluated using three metrics: the goodness-of-fit method based on model prediction, prediction error test method and visual predictive checks method based on model simulation.
Results: A total of 186 drug concentration data of 31 patients in our hospital were collected, and 4 literature were retrieved, among which 1 were one-compartment models and 3 were two-compartment models. In the goodness-of-fit diagnosis and prediction error test based on model prediction, the population prediction data of all models were not good, while the individual prediction data showed that the fitting result of Model 1 was relatively better. The visual prediction test results based on model simulation show that the fitting result of Model 1 was relatively good, while the distribution deviation between the observed data and the simulation data of the remaining models was large, and the fitting effect was not good.
Conclusion: The published models exhibit significant variability and unsatisfactory predictive performance, indicating that therapeutic drug monitoring (TDM) remains an essential requirement for the clinical application of MPS. To advance individualized medication for MPS based on popPK, future research must prioritize the investigation of potential covariates. This will enable identification of key factors influencing MPS model predictability and facilitate the development of a popPK model suitable for patients in our hospital.
1 Introduction
Renal transplantation, as the most ideal renal replacement therapy for patients with end-stage chronic renal failure, has gained widespread recognition in the global field of organ transplantation. However, long-term prognosis management continues to pose significant challenges (Hariharan et al., 2021; Wolfe et al., 1999; Zhao et al., 2017). The core issue affecting the long-term survival of renal transplant recipients lies in the precise regulation of immunosuppressive therapy. The triple immunosuppressive regimen (calcineurin inhibitor [CNI], mycophenolic acid [MPA], and corticosteroids) recommended by The Transplantation Society (TTS) has become the established foundation for maintenance immunosuppression in clinical renal transplantation (KDIGO clinical practice guideline for the care of kidney transplant recipients, 2009). Especially, MPA-class agents play a pivotal role in preventing acute rejection through selective inhibition of T/B lymphocyte proliferation (Allison, 2005; Bhat et al., 2023; Behrend and Braun, 2005). Nevertheless, the clinical application of MPA-class drugs faces substantial challenges: narrow therapeutic window, significant interindividual pharmacokinetic variability, and high incidence of gastrointestinal toxicity (Bergan et al., 2021; Sobiak and Resztak, 2021). Currently, mycophenolate mofetil (MMF) and mycophenolate sodium (MPS), as two principal MPA prodrugs, exhibit distinct clinical profiles due to differences in pharmaceutical formulation despite sharing the same active metabolite (de Winter et al., 2008). The rational selection between these agents has emerged as a critical issue in optimizing immunosuppressive therapy.
Both MMF and MPS are prodrugs of MPA that require in vivo conversion to the active metabolite MPA. Their immunosuppressive effects are mediated through inhibition of purine synthesis in immune cells by blocking inosine monophosphate dehydrogenase enzyme activity (Tedesco-Silva et al., 2005). While sharing this common mechanism, their pharmacological divergence originates from distinct delivery systems (Budde et al., 2007a). MMF, an ester derivative produced as cost-effective conventional tablets, undergoes rapid hydrolysis to active MPA in the stomach and proximal small intestine with 94% bioavailability, yet exhibits significant first-pass metabolism and marked plasma concentration fluctuations (Jacqz-Aigrain et al., 2000; Tang et al., 2017). In contrast, MPS exists as a sodium salt of MPA. The enteric-coated MPS (EC-MPS) with delayed-release technology targeting the ileum’s alkaline environment, circumvents gastric acid degradation and minimizes direct mucosal irritation, thereby achieving enhanced gastrointestinal tolerability and more stable pharmacokinetic profiles (Sobiak et al., 2021; Wang et al., 2022). Clinically, MMF excels in rapid onset and cost-effectiveness, whereas EC-MPS demonstrates superior tolerability and pharmacokinetic stability. This pharmacological advantage positions EC-MPS as the preferred option for sensitive populations, including patients with diabetic gastroenteropathy, elderly recipients, and pediatric transplant cohorts, particularly given the frequent gastrointestinal complications observed with MMF in renal transplantation practice (Gabardi et al., 2003).
The area under the concentration-time curve from 0 to 12 h (AUC0–12h) is conventionally used to evaluate MPA exposure, with an internationally accepted therapeutic target range of 30–60 mg h·L-1 in renal transplant recipients (Chen et al., 2019; Tett et al., 2011). While phase III clinical trials have established therapeutic equivalence between EC-MPS (720 mg twice daily) and MMF (1,000 mg twice daily) in terms of efficacy and safety, significant pharmacokinetic disparities persist. EC-MPS demonstrates higher pre-dose trough concentrations, lower peak concentrations, and prolonged time to maximum concentration compared to MMF, alongside greater absorption-phase variability evidenced (Salvadori et al., 2004; Graff et al., 2016; Budde et al., 2007b). Crucially, EC-MPS exhibits interindividual variability in MPA exposure, rendering standardized dosing regimens suboptimal as evidenced by 20% of patients exceeding the therapeutic window (>60 mg h·L-1) and 35% failing to achieve threshold exposure (<30 mg h·L-1) under empirical dose adjustment (Budde et al., 2007b; Collins et al., 2020; Kiang and Ensom, 2018). These pharmacodynamic complexities, compounded by the narrow therapeutic index of MPA-based immunosuppressants, mandate the implementation of therapeutic drug monitoring (TDM) as a cornerstone of precision dosing strategies.
The substantial pharmacokinetic variability and definitive concentration-effect correlation of EC-MPS constitute the most compelling rationale for implementing TDM to guide AUC-based dose individualization. However, conventional TDM approaches face practical limitations, particularly the clinical infeasibility of intensive sampling protocols in transplant populations (Hougardy et al., 2016). To address this, limited sampling strategies integrating population pharmacokinetic (popPK) modeling with Bayesian forecasting have been advocated as a pragmatic solution for optimizing EC-MPS dosing regimens (Wang et al., 2022; Fromage et al., 2025). As a superior alternative to classical pharmacokinetic methods, popPK analysis enables precise quantification of inter- and intra-individual variability through sparse sampling, while facilitating identification of clinically significant covariates influencing drug exposure (Duffull et al., 2011). Nevertheless, the external validity of such models may be compromised by center-specific factors including study design heterogeneity, sample size limitations, and analytical platform discrepancies (El Hassani and Marsot, 2023). Rigorous external validation using independent multicenter datasets is therefore mandated prior to clinical implementation across diverse healthcare settings, ensuring robust model generalizability and therapeutic reliability.
Despite the development of numerous popPK models over the past 20 years to characterize the pharmacokinetics of EC-MPS, the external applicability of these models across multicenter settings remains inadequately validated. Systematic evaluation of model transferability not only addresses this knowledge gap but also facilitates identification of center-specific covariates impacting predictive performance. Furthermore, strategic selection of optimal popPK models from existing literature—rather than conducting de novo modeling—may represent a resource-efficient approach for personalized dosing guidance. To address these imperatives, this study implemented a comprehensive validation framework using independent datasets to assess the predictive capacity of published popPK models for EC-MPS within triple immunosuppressive regimens in adult renal transplant recipients.
2 Methods
2.1 Review of published popPK analyses of MPA
A literature search was conducted using PubMed, Embase, and Web of Science databases from their inception to November 2024, following the Preferred Reporting Items for Systematic Reviews and Meta-analyses (PRISMA) guidelines. The search strategy included the following keywords: “mycophenolic acid” OR “mycophenolate sodium”, “population pharmacokinetics” OR “PPK” OR “equation”, and “kidney” OR “renal”. The inclusion criteria were: (1) Studies involving renal transplant recipients; (2) Administration of MPS at therapeutic dosages; (3) popPK studies utilizing a non-linear mixed-effects modeling approach; (4) Publication in English; (5) Full-text availability. The exclusion criteria were (1) Studies not involving MPS; (2) popPK studies incorporating genetic polymorphisms as covariates; (3) Insufficient data for external validation; (4) Duplicate datasets or overlapping cohorts. In cases of dataset overlap, only the most recent study or the one with the largest sample size was retained. Two independent authors screened the titles, abstracts, and full texts of identified articles for eligibility. A third author resolved discrepancies through consensus. It is worth noting that studies incorporating genetic polymorphisms as covariates were excluded because our external validation dataset, derived from routine clinical practice, lacked genetic polymorphism information. This ensured all evaluated models could be fully tested using available covariates.
2.2 Study cohort of external evaluation
A total of 31 Chinese renal transplant recipients treated with triple immunosuppressive regimen (CNI + MPA + corticosteroids) at the Affiliated Hospital of Qingdao University from March 2023 to February 2025 were enrolled in this study. For each patient, 6 serial blood samples were collected, resulting in a total of 186 samples. The protocol was approved by the Ethics Committee of the Affiliated Hospital of Qingdao University (Approval Number: QYFY WZLL 30016). All patients received twice-daily 540 mg EC-MPS doses (every 12 h). Following a consistent administration regimen for at least 3 days, 6 serial blood samples were collected per patient: 0.5 h pre-dose, 1, 2, 4, 8, and 12 h post-dose. Heparin sodium served as the catheter anticoagulant during sample collection. The blood samples were then centrifuged to separate the plasma and stored at −20 °C for analysis. MPA concentrations were quantified using a validated liquid chromatograph-mass spectrometer (LC-MS) method with a calibration range of 0.1–20 μg ml-1 and a lower quantification limit of 0.1 μg ml-1. Additional clinical data encompassing demographic profiles, biochemical parameters, hematological indices, and concomitant medications were retrospectively extracted from medical records.
2.3 External predictive ability evaluation
The external validation of the MPA popK model was conducted through goodness-of-fit analysis, prediction error testing based on model predictions, and visual predictive checks based on model simulation. Published popPK models (de Winter et al., 2008; Wang et al., 2022; Sam et al., 2009; Veličković-Radovanović et al., 2015) were reconstructed by incorporating reported structural parameters, with patient medication records and biochemical function data from our hospital serving as input datasets. External validation procedures were executed using NONMEM® (version 7.6.0, ICON Development Solutions, Ellicott City, MD, United States), while R software (version 4.4.1, http://www.r-project.org/) processed the NONMEM output for subsequent analysis. All statistical evaluations and graphical representations were generated using Xpose4 (Version 23.0.0), ensuring comprehensive assessment of model performance across multiple validation approaches.
2.3.1 Goodness of fit analysis
The goodness-of-fit method assesses the proximity and correlation between observed concentrations and predicted concentrations by creating scatter plots of dependent variable-population predicted concentrations (DV-PRED) and dependent variable-individual predicted concentrations (DV-IPRED) (Nanga et al., 2022; Wei et al., 2022). These visualizations facilitate the evaluation of model performance by quantifying the alignment between predicted and actual values, ultimately determining the degree of fit achieved by the predictive model (Tauzin et al., 2019).
2.3.2 Prediction error test
The prediction error test method evaluates model performance by estimating the prediction error (PE) (Equation 1) and the individual prediction error (IPE) (Equation 4), respectively. The median prediction error (MDPE) (Equation 2) and the median individual prediction error (MDIPE) (Equation 5) were used to evaluate the accuracy of prediction. The median absolute prediction error (MAPE) (Equation 3) and the median absolute individual prediction error (MAIPE) (Equation 6) were used to evaluate the precision of prediction (Sheiner and Beal, 1981; Zhang et al., 2023; Mizaki et al., 2023). Moreover, F20 and F30 represent the percentage of PE within the ±20% and ±30% ranges respectively, while IF20 and IF30 denote the percentage of IPE within the same respective ranges. These metrics also served as a combined measure of both accuracy and precision (Yang et al., 2022; Huang et al., 2020). For optimal model performance, criteria specify that MDPE or MDIPE should be ≤ 20%, MAPE or MAIPE ≤30%, F20 or IF20 ≥ 35%, and F30 or IF30 ≥ 50% (Zhang et al., 2023; Yang et al., 2022; Zhang et al., 2019).
where OBS was the observed concentrations, PRED was the population predicted concentrations, IPRED was the individual predicted concentration.
2.3.3 Visual predictive verification
The visual predictive check method employs model parameters to perform 1,000 simulations of the dataset, calculating the 95% confidence intervals for the fifth, 50th, and 95th percentiles of fitted concentrations across different models (Tauzin et al., 2019; Zhang et al., 2023). These intervals are compared with observed concentrations to identify systematic deviations between observed data and the simulated data (Wei et al., 2022). By comprehensively evaluating model fitting effect, deviation degree, accuracy and precision, the MPA popPK model most suitable for our hospital’s patient population was ultimately identified.
3 Results
3.1 Review of published popPK analyses of MPA
Following a systematic literature review, four popPK models investigating the co-administration of MPS and tacrolimus were identified and selected for external validation, with the search strategy detailed in Figure 1. These models (designated Model 1 (de Winter et al., 2008), Model 2 (Sam et al., 2009), Model 3 (Veličković-Radovanović et al., 2015), and Model 4 (Wang et al., 2022) were exclusively developed in kidney transplant recipients. It is worth noting that in de Winter et al. (2008), the construction and optimization process of the popPK model for MPS and MMF were addressed. Since MPS was used in our external validation patient cohort, and MMF was not involved in our study, the ultimately optimized MPS model was incorporated into our study (designated Model 1) for external evaluation. Model 1 was a multinational multicenter study, while Models 2-4 were single-center studies. Regarding structural characteristics, Model 4 employed a one-compartment models whereas Models 1-3 utilized two-compartment models. Basic information and parameter information for each model were systematically presented in Tables 1, 2.
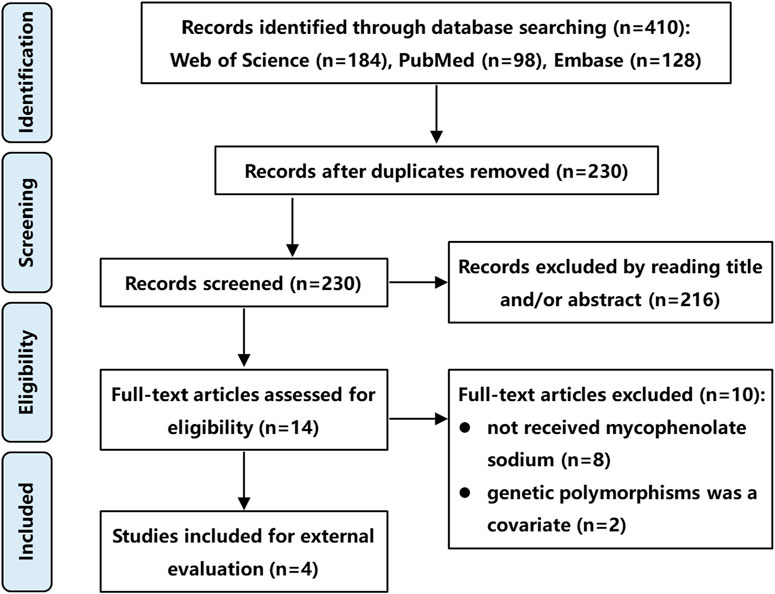
Figure 1. Flow diagram of literature selection process.
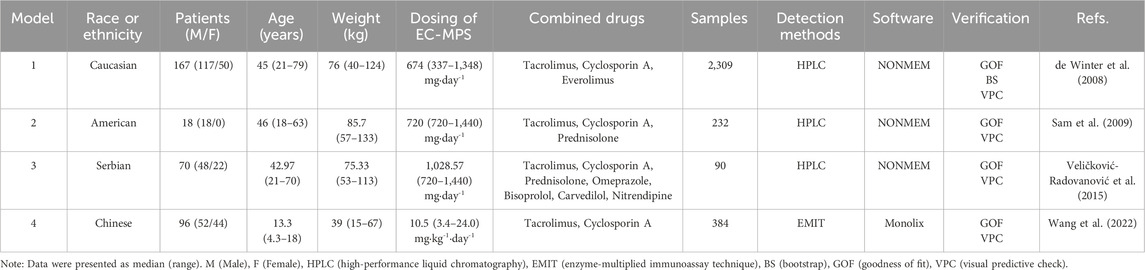
Table 1. Basic information of MPA popPK models.
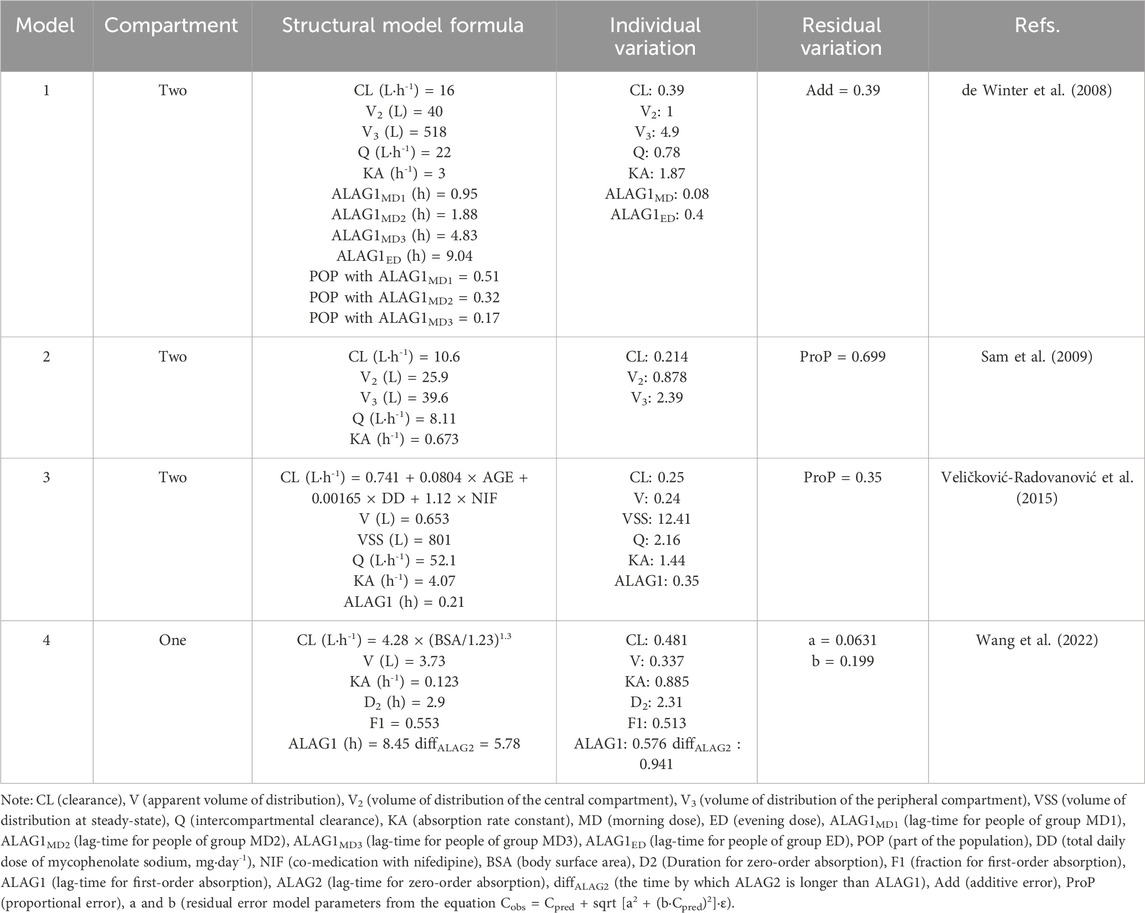
Table 2. Parameter information of MPA popPK models.
3.2 External evaluation cohort
Blood drug concentration monitoring data of 31 renal transplant patients were included in this study, including 22 male patients and 9 female patients, with an average age of 39.29 ± 10.77 years old. All 31 patients were treated with tacrolimus and hormone therapy. More basic demographic information and clinical indicators are presented in Table 3.
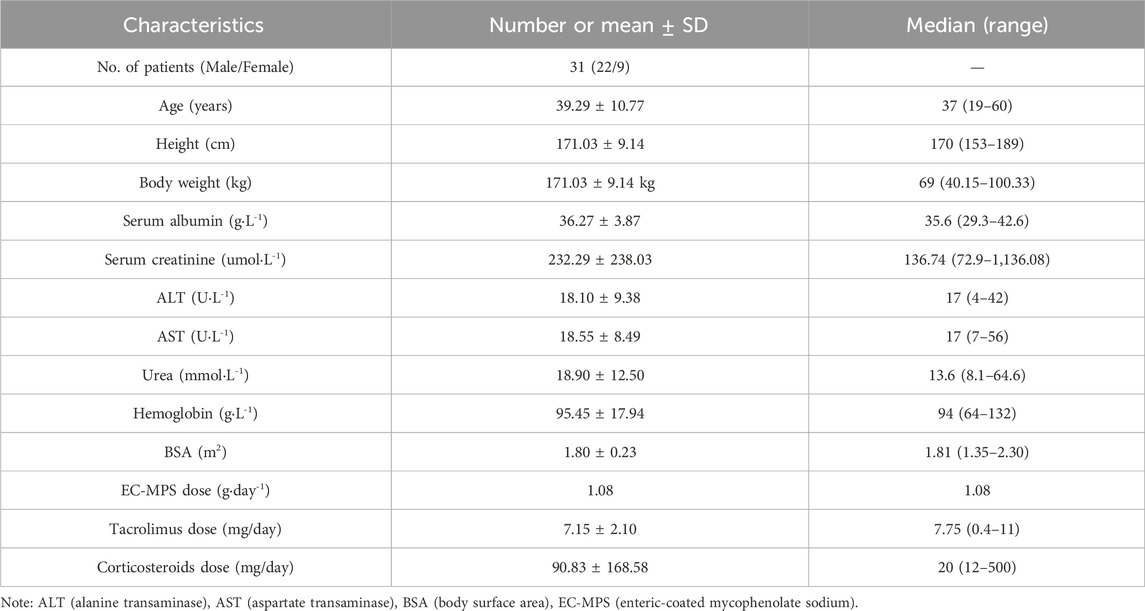
Table 3. Basic demographic information and clinical indicators of including patients.
3.3 External predictability evaluation
3.3.1 Goodness of fit diagnosis
The MPA concentration was predicted using published popPK models based on renal transplant patients’ medication data. The scatter plots of dependent variable vs. population-predicted (DV-PRED) and dependent variable vs. individual-predicted (DV-IPRED) for each model were presented in Figure 2. The scatter plot on the left depicted population prediction. Each point corresponded to an observed data point plotted against its population prediction. The scatter plot on the right depicted individual predictions. Similarly, each point represented an observed data point plotted against its individual prediction. Black dashed lines indicating the reference line (Y = X) and red dashed lines representing trend lines. Trend lines were calculated using locally estimated scatterplot smoothing (LOESS) regression and generated by the R software. Better model fit was demonstrated when predicted values closely approximate actual observations, as evidenced by higher concordance between trend lines and the reference line.
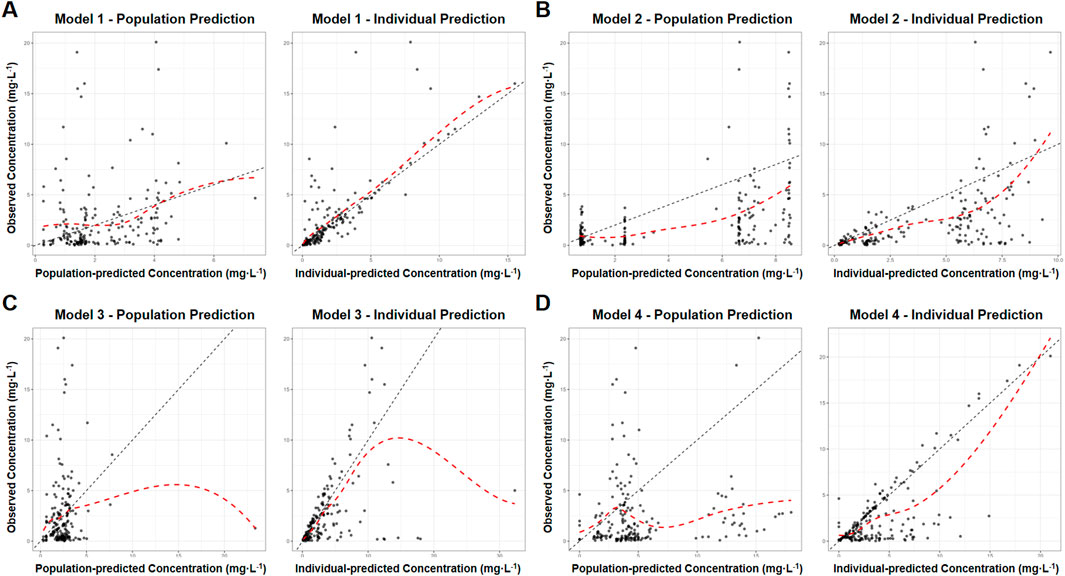
Figure 2. Goodness of fit graphs of MPA popPK models for renal transplant patients in our hospital. (A) Model 1. (B) Model 2. (C) Model 3. (D) Model 4. (Left: population prediction, DV-PRED scatter plot. Right: individual predictions, DV-IPRED scatter plot. Black dashed lines: the reference line (Y = X). Red dashed lines: trend lines).
The left DV-PRED scatter plot showed that the coincidence degree between the trend line and the reference line for the population data in Models 1-4 were relatively low. There were almost no overlapping sections between the trend line and the reference line, and the scatter distribution was not uniform enough. All R2 values were lower than 0.3, and the regression coefficients and residuals of the linear fitting were not ideal either, suggesting that the prediction performance of the model was poor.
The right DV-IPRED scatter plot indicated that the individual predicted values of Model 1 had a relatively good correlation with the actual observed values. The coincidence degree between the trend line and the reference line was relatively high and the linear regression coefficient was 1.15, and R2 value was 0.64. Scattered points were symmetrically distributed and clustered around the diagonal, reflecting reasonable aggregation trends and dispersion patterns. Nevertheless, the prediction performance of the remaining models was relatively poor. Models 2 and 4 showed partial alignment of trend line and the reference line at extreme concentrations but exhibit offsets and scattered mid-concentration data points, The prediction effects were not good with regression coefficients of 0.71/0.74, and R2 values of 0.31/0.55, respectively. Model 3 aligned only at low concentrations, deviated at higher concentrations with scattered data points, and featured a distinct outlier causing trend line displacement. The regression coefficient was 0.44, and R2 value was 0.26, all indicating inadequate predictive accuracy.
3.3.2 Prediction error test
The prediction error analysis results were presented in Figure 3 and Table 4. In the graphical representation, the solid black line denoted the zero-error reference, while dashed and dotted lines demarcated the ±20% and ±30% prediction error thresholds, respectively. In boxplots, the blue boxes represented the population prediction error and the green boxes represented the individual prediction error. Closer alignment of the median line (box solid line) with the zero-error reference indicated higher prediction accuracy, whereas narrower box widths reflected better precision of the model predictions.
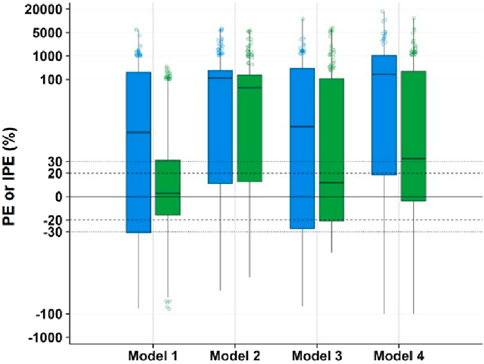
Figure 3. Box plot of prediction error of MPA popPK models for renal transplant patients in our hospital. (Blue box: population predicted. Green box: individual predicted. The solid line in box: median. Dashed lines: ±20% prediction error thresholds. Dotted lines: ±30% prediction error thresholds).
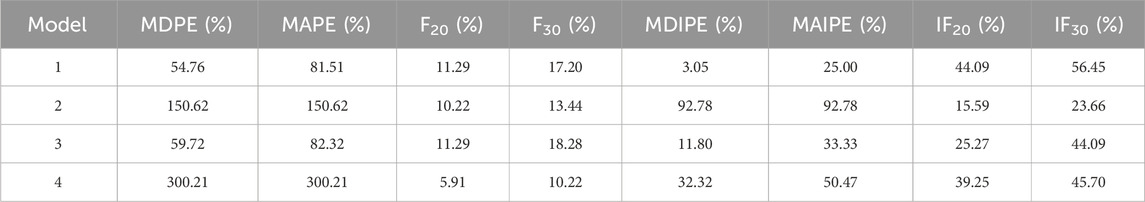
Table 4. Prediction error test of MPA popPK models for renal transplant patients in our hospital.
The population prediction error test showed that the distance between the prediction error box of each model group and the zero line was relatively far. MDPE, MAPE, F20 and F30 also did not meet the above standards, indicating that the fitting effect of these several models at the population error prediction level was poor.
In the individual prediction error box diagram, the solid line of the box in Model 1 was closest to the zero line, with the highest accuracy. Meanwhile, its box was the narrowest and had the best precision. The MDIPE of Model 1 ≤ 20%, the MAIPE ≤ 30%, the IF20 > 35%, and the IF30 > 50%, indicating that Model 1 had a good fitting effect at the individual error prediction level. Furthermore, the solid lines of the boxes in Model 3 and Model 4 were relatively close to the zero line. The MDIPE of Model 3 was within 20%, and the IF20 of Model 4 was greater than 35%, while the remaining standards failed to meet the requirements. Moreover, the distance between the group prediction error box and the zero line in Model 2 was relatively far, MDIPE, MAIPE, IF20 and IF30 did not meet the above standards either, indicating that the fitting effect of Model 2 at the individual error prediction level was poor.
3.3.3 Visual predictive verification
The model and dataset were subjected to 1,000 simulations using the Visual Predictive Check (VPC) module in NONMEM software, with results shown in Figure 4. The plot displays time after dose (h) on the x-axis versus MPA concentration (mg·L-1) on the y-axis. Data points represent actual observed concentrations, while three black lines (from top to bottom) correspond to the 95th, 50th, and fifth percentiles of observed data. Three red lines (from top to bottom) correspond to the 95th, 50th and fifth percentiles of the simulated concentrations, while the shaded areas represent their 95% confidence intervals. Enhanced model performance is demonstrated by closer alignment between observed percentiles (black lines) and their corresponding simulated confidence intervals (shaded regions), reflecting improved goodness-of-fit.
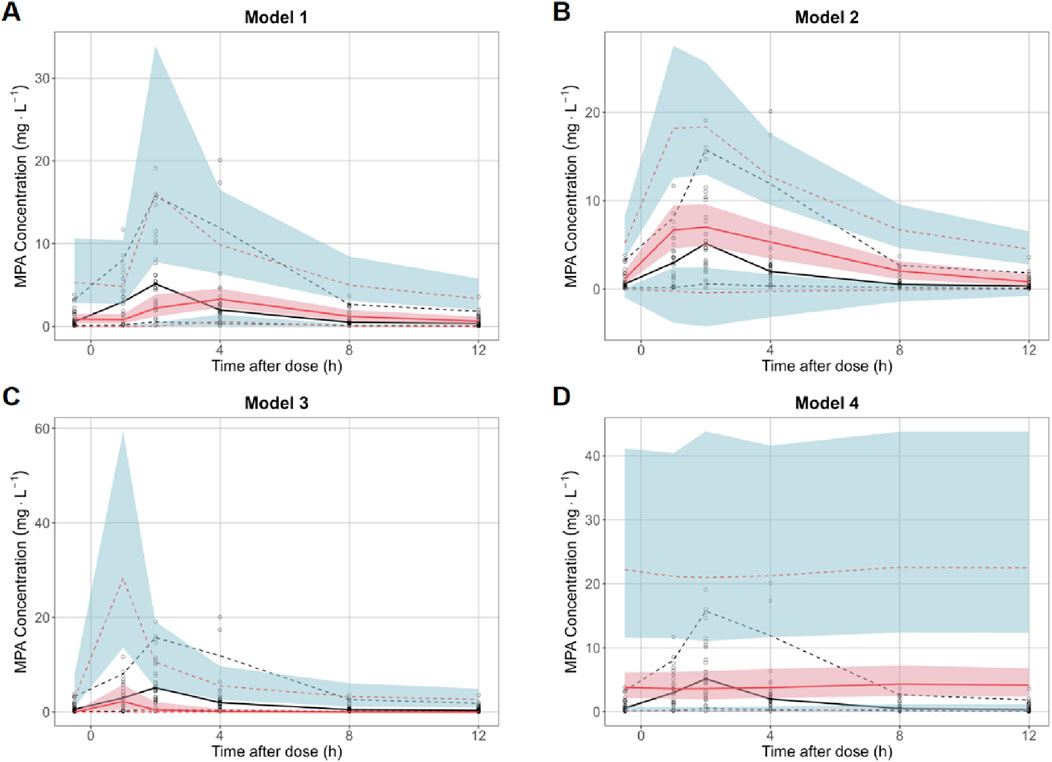
Figure 4. Visual predictive check of MPA popPK models for renal transplant patients in our hospital. (A) Model 1. (B) Model 2. (C) Model 3. (D) Model 4. (Black hollow dot: observed concentrations. Black curves at top, middle and bottom: 95th, 50th and fifth percentiles of the observed concentrations. Red curves at top, middle and bottom: 95th, 50th and fifth percentiles of the simulated concentrations. Shaded areas at top (blue), middle (red) and bottom (blue): the 95% confidence intervals for the 95th, 50th and fifth percentiles of the simulated concentration).
VPC revealed significant inter-model performance variation, with Model 1 demonstrating superior concordance between observed and simulated concentrations across the fifth, 50th, and 95th percentiles, encompassing 98.4% of observations within the 95% simulation confidence bands. In contrast, Models 2-4 exhibited suboptimal distributional alignment, characterized by reduced inclusion rates of observed percentiles within their respective prediction intervals. Notably, Model 4 manifested substantial predictive bias, displaying systematically inflated simulated concentrations with excessively wide confidence intervals that diverged markedly from the empirical data distribution. This pronounced discordance suggests fundamental limitations in Model 4’s structural specification or parameter estimation.
4 Discussion
As the two principal prodrugs of MPA, MMF and MPS demonstrate distinct clinical profiles despite sharing identical active metabolites, the difference attributable to their distinct prodrug structures and pharmaceutical formulations (Tedesco-Silva et al., 2005; Sobiak et al., 2021). To date, popPK models for MMF in renal transplant recipients have been extensively developed and externally validated (Zhang et al., 2019). In contrast, limited popPK research exists for MPS, with its external validity remaining poorly characterized. To our knowledge, this study represents the first comprehensive external validation of published MPS popPK models using an independent clinical dataset. While the validation dataset originated from a single center and had limited sample size, this investigation provides critical insights to advance research on MPS popPK characteristics.
This study evaluated the predictive performance of four published MPS popPK models using TDM data from our institutional cohort. Results demonstrated deficient predictive accuracy of existing models, with all failing to meet validation standards. Both population prediction analyses through goodness-of-fit diagnostics and prediction error testing revealed poor agreement between predicted and observed values. Individual predictions showed marginally better performance for Model 1, achieving composite precision indices (IF20 > 35% and IF30 > 50%), though the DV-IPRED scatter plots exhibited systematic bias and reduced overlap in high-concentration ranges due to data dispersion. In addition, the results of the VPC test based on model simulation show that the fitting results of Model 1 is relatively good, the distribution of the observed data and the simulation data is relatively close. Besides, for majority models, the observed concentration value data that fall within the confidence interval of the simulated data are relatively few, the deviation is large, and the prediction effect is poor.
The observed discrepancies between published model predictions and measured concentrations in our cohort may stem from clinical variables and methodological considerations, including interindividual pathophysiological heterogeneity, analytical variability in MPA quantification methodologies and the differential selection of pharmacokinetic modeling approaches.
Demographic characteristics, particularly race and age, emerge as significant covariates influencing MPA pharmacokinetic PK parameters, with sample size additionally affecting predictive accuracy. Variability in these key determinants across published models, including racial composition, age distribution, and cohort size, may introduce bias in popPK parameter estimation, ultimately compromising model predictive performance (Catić-Đorđević et al., 2021; Tornatore et al., 2022; Lestini et al., 2015). Comparative analysis reveals: Model 1 comprise 2,309 TDM samples from multi-regional Caucasian adults (mean age: 45 years), Model 2 comprise 232 TDM samples from American adults (mean age: 46 years), Model 3 comprise 90 TDM samples from Serbian adults (mean age: 42.97 years) and Model 4 comprise 384 TDM samples from Chinese pediatric patients (mean age: 13.3 years). Our external validation cohort comprised 186 Chinese adult TDM samples (mean age: 39.29 years). The enhanced predictive accuracy of Model 1 likely reflects its larger sample size providing greater statistical power. Notably, the complexity of race-specific metabolic variations may be the reason for the poor prediction of Model 2 and Model 3. And Model 4’s suboptimal performance may stem from fundamental PK differences between pediatric and adult populations.
Notably, the published models incorporated different analytical methods for detecting MPA blood concentration, including HPLC, HPLC/UV, and EMIT, while the external cohort dataset of our hospital adopts HPLC-MS. Variations in the accuracy and precision across these detection methodologies may introduce variability that could compromise the model’s predictive performance and stability in concentration estimation.
The selection of structural models, computational platforms, and significant covariates differs among published popPK analyses, potentially introducing variability in parameter estimation and influencing the predictive accuracy of the final population pharmacokinetic model. Research demonstrates that structural model specification directly affects derived pharmacokinetic parameters (Yu et al., 2017). Among the evaluated models, Models 1–3 implemented a two-compartment disposition model, whereas Model 4 utilized a single-compartment approximation. Given MPA’s biphasic elimination characteristics and tissue distribution profile, the two-compartment configuration appears physiologically more plausible, potentially explaining Model 4’s substantial prediction error and inflated variability estimates (de Winter et al., 2009). The enteric-coated formulation of MPS employs pH-dependent release kinetics targeting ileal absorption, thereby avoiding gastric degradation and minimizing mucosal irritation (Wang et al., 2022). This pharmacokinetic profile necessitates explicit incorporation of absorption lag-time (ALAG) in modeling (de Winter et al., 2008). The published models exhibit significant ALAG variations: Model 1 (∼2 h), Model 2 (not incorporated), Model 3 (0.21 h), and Model 4 (8.45 h). Model 1’s superior goodness-of-fit likely stems from its appropriate ALAG parameterization, which aligns with the drug’s known gastrointestinal transit dynamics.
Overall, this investigation utilized TDM data for MPA following MPS administration, collected through routine clinical monitoring protocols, thereby providing an objective representation of real-world pharmacological variability. The dataset encompassed trough, intermediate, and peak concentrations measured at standardized sampling intervals, enabling systematic evaluation of published models’ capacity to characterize pharmacokinetic profiles across critical temporal phases. The published models exhibit significant variability and unsatisfactory predictive performance, indicating that TDM remains an essential requirement for the clinical application of MPS. To advance individualized medication for MPS based on popPK, future research must prioritize the investigation of potential covariates. This will enable identification of key factors influencing MPS model predictability and facilitate the development of a popPK model suitable for patients in our hospital.
Data availability statement
The original contributions presented in the study are included in the article/Supplementary Material, further inquiries can be directed to the corresponding authors.
Ethics statement
The studies involving humans were approved by the Ethics Committee of the Affiliated Hospital of Qingdao University (Approval Number: QYFY WZLL 30016). The studies were conducted in accordance with the local legislation and institutional requirements.
Author contributions
TG: Methodology, Writing – original draft, Conceptualization, Funding acquisition. WX: Software, Project administration, Conceptualization, Writing – original draft. XL: Formal Analysis, Investigation, Data curation, Writing – original draft. QG: Writing – original draft, Formal Analysis, Supervision. DL: Resources, Data curation, Writing – original draft. XZ: Software, Writing – original draft, Formal Analysis. PL: Investigation, Writing – review and editing, Methodology. JS: Conceptualization, Writing – review and editing, Funding acquisition, Project administration.
Funding
The author(s) declare that financial support was received for the research and/or publication of this article. This work was supported by National Natural Science Foundation of China (No. 82404526, No. 81903872), Natural Science Foundation of Shandong Province (No. ZR2024QH183) and Traditional Chinese Medicine Science and Technology Project of Health Commission of Shandong Province (No. Z-2022076).
Conflict of interest
The authors declare that the research was conducted in the absence of any commercial or financial relationships that could be construed as a potential conflict of interest.
Generative AI statement
The author(s) declare that no Generative AI was used in the creation of this manuscript.
Any alternative text (alt text) provided alongside figures in this article has been generated by Frontiers with the support of artificial intelligence and reasonable efforts have been made to ensure accuracy, including review by the authors wherever possible. If you identify any issues, please contact us.
Publisher’s note
All claims expressed in this article are solely those of the authors and do not necessarily represent those of their affiliated organizations, or those of the publisher, the editors and the reviewers. Any product that may be evaluated in this article, or claim that may be made by its manufacturer, is not guaranteed or endorsed by the publisher.
Supplementary material
The Supplementary Material for this article can be found online at: https://www.frontiersin.org/articles/10.3389/fphar.2025.1632568/full#supplementary-material
References
Allison, A. C. (2005). Mechanisms of action of mycophenolate mofetil. Lupus 14, S2–S8. doi:10.1191/0961203305lu2109oa
Behrend, M., and Braun, F. (2005). Enteric-coated mycophenolate sodium - tolerability profile compared with mycophenolate mofetil. Drugs 65 (8), 1037–1050. doi:10.2165/00003495-200565080-00001
Bergan, S., Brunet, M., Hesselink, D. A., Johnson-Davis, K. L., Kunicki, P. K., Lemaitre, F., et al. (2021). Personalized therapy for mycophenolate: consensus report by the international association of therapeutic drug monitoring and clinical toxicology. Ther. drug Monit. 43 (2), 150–200. doi:10.1097/FTD.0000000000000871
Bhat, R., Tonutti, A., Timilsina, S., Selmi, C., and Gershwin, M. E. (2023). Perspectives on mycophenolate mofetil in the management of autoimmunity. Clin. Rev. allergy and Immunol. 65 (1), 86–100. doi:10.1007/s12016-023-08963-3
Budde, K., Tedesco-Silva, H., Pestana, J. M., Glander, P., Neumayer, H. H., Felipe, C. R., et al. (2007a). Enteric-coated mycophenolate sodium provides higher mycophenolic acid predose levels compared with mycophenolate mofetil: implications for therapeutic drug monitoring. Ther. drug Monit. 29 (3), 381–384. doi:10.1097/FTD.0b013e318068619d
Budde, K., Bauer, S., Hambach, P., Hahn, U., Röblitz, H., Mai, I., et al. (2007b). Pharmacokinetic and pharmacodynamic comparison of enteric-coated mycophenolate sodium and mycophenolate mofetil in maintenance renal transplant patients. Am. J. Transplant. official J. Am. Soc. Transplant. Am. Soc. Transpl. Surg. 7 (4), 888–898. doi:10.1111/j.1600-6143.2006.01693.x
Catić-Đorđević, A., Pavlović, I., Spasić, A., Stefanović, N., Pavlović, D., Damnjanović, I., et al. (2021). Assessment of pharmacokinetic mycophenolic acid clearance models using monte carlo numerical analysis. Xenobiotica; fate foreign Compd. Biol. Syst. 51 (4), 387–393. doi:10.1080/00498254.2020.1871532
Chen, B., Shao, K., An, H. M., Shi, H. Q., Lu, J. Q., Zhai, X. H., et al. (2019). Population pharmacokinetics and bayesian estimation of mycophenolic acid exposure in Chinese renal allograft recipients after administration of EC-MPS. J. Clin. Pharmacol. 59 (4), 578–589. doi:10.1002/jcph.1352
Collins, K. S., Cheng, Y. H., Ferreira, R. M., Gao, H., Dollins, M. D., Janosevic, D., et al. (2020). Interindividual variability in lymphocyte stimulation and transcriptomic response predicts mycophenolic acid sensitivity in healthy volunteers. Clin. Transl. Sci. 13 (6), 1137–1149. doi:10.1111/cts.12795
de Winter, B. C., van Gelder, T., Glander, P., Cattaneo, D., Tedesco-Silva, H., Neumann, I., et al. (2008). Population pharmacokinetics of mycophenolic acid: a comparison between enteric-coated mycophenolate sodium and mycophenolate mofetil in renal transplant recipients. Clin. Pharmacokinet. 47 (12), 827–838. doi:10.2165/0003088-200847120-00007
de Winter, B. C., van Gelder, T., Sombogaard, F., Shaw, L. M., van Hest, R. M., and Mathot, R. A. (2009). Pharmacokinetic role of protein binding of mycophenolic acid and its glucuronide metabolite in renal transplant recipients. J. Pharmacokinet. pharmacodynamics 36 (6), 541–564. doi:10.1007/s10928-009-9136-6
Duffull, S. B., Wright, D. F., and Winter, H. R. (2011). Interpreting population pharmacokinetic-pharmacodynamic analyses - a clinical viewpoint. Br. J. Clin. Pharmacol. 71 (6), 807–814. doi:10.1111/j.1365-2125.2010.03891.x
El Hassani, M., and Marsot, A. (2023). External evaluation of population pharmacokinetic models for precision dosing: current state and knowledge gaps. Clin. Pharmacokinet. 62 (4), 533–540. doi:10.1007/s40262-023-01233-7
Fromage, Y., Sayadi, H., Koloskoff, K., Marquet, P., Labriffe, M., Monchaud, C., et al. (2025). Killing several birds with one stone: a multi-indication population pharmacokinetic model and Bayesian estimator for enteric-coated mycophenolate sodium. Br. J. Clin. Pharmacol. 91 (5), 1396–1408. doi:10.1111/bcp.16374
Gabardi, S., Tran, J. L., and Clarkson, M. R. (2003). Enteric-coated mycophenolate sodium. Ann. Pharmacother. 37 (11), 1685–1693. doi:10.1345/aph.1D063
Graff, J., Scheuermann, E. H., Brandhorst, G., Oellerich, M., and Gossmann, J. (2016). Pharmacokinetic analysis of mycophenolate mofetil and enteric-coated mycophenolate sodium in calcineurin inhibitor-free renal transplant recipients. Ther. drug Monit. 38 (3), 388–392. doi:10.1097/FTD.0000000000000281
Hariharan, S., Israni, A. K., and Danovitch, G. (2021). Long-term survival after kidney transplantation. N. Engl. J. Med. 385 (8), 729–743. doi:10.1056/nejmra2014530
Hougardy, J. M., Maufort, L., Cotton, F., Coussement, J., Mikhalski, D., Wissing, K. M., et al. (2016). Therapeutic drug monitoring of enteric-coated mycophenolate sodium by limited sampling strategies is associated with a high rate of failure. Clin. kidney J. 9 (2), 319–323. doi:10.1093/ckj/sfw001
Huang, L., Liu, Y., Jiao, Z., Wang, J., Fang, L., and Mao, J. (2020). Population pharmacokinetic study of tacrolimus in pediatric patients with primary nephrotic syndrome: a comparison of linear and nonlinear michaelis-menten pharmacokinetic model. Eur. J. Pharm. Sci. official J. Eur. Fed. Pharm. Sci. 143, 105199. doi:10.1016/j.ejps.2019.105199
Jacqz-Aigrain, E., Khan Shaghaghi, E., Baudouin, V., Popon, M., Zhang, D., Maisin, A., et al. (2000). Pharmacokinetics and tolerance of mycophenolate mofetil in renal transplant children. Pediatr. Nephrol. Berl. Ger. 14 (2), 95–99. doi:10.1007/s004670050020
KDIGO clinical practice guideline for the care of kidney transplant recipients (2009). KDIGO clinical practice guideline for the care of kidney transplant recipients. Am. J. Transplant. official J. Am. Soc. Transplant. Am. Soc. Transpl. Surg. 9 (Suppl. 3), S1–S155. doi:10.1111/j.1600-6143.2009.02834.x
Kiang, T. K. L., and Ensom, M. H. H. (2018). Population pharmacokinetics of mycophenolic acid: an update. Clin. Pharmacokinet. 57 (5), 547–558. doi:10.1007/s40262-017-0593-6
Lestini, G., Dumont, C., and Mentré, F. (2015). Influence of the size of cohorts in adaptive design for nonlinear mixed effects models: an evaluation by simulation for a pharmacokinetic and pharmacodynamic model for a biomarker in oncology. Pharm. Res. 32 (10), 3159–3169. doi:10.1007/s11095-015-1693-3
Mizaki, T., Nobata, H., Banno, S., Yamaguchi, M., Kinashi, H., Iwagaitsu, S., et al. (2023). Population pharmacokinetics and limited sampling strategy for therapeutic drug monitoring of mycophenolate mofetil in Japanese patients with lupus nephritis. J. Pharm. health care Sci. 9 (1), 1. doi:10.1186/s40780-022-00271-w
Nanga, T. M., Woillard, J. B., Rousseau, A., Marquet, P., and Prémaud, A. (2022). Population pharmacokinetics and Bayesian estimation of mycophenolate mofetil in patients with autoimmune hepatitis. Br. J. Clin. Pharmacol. 88 (11), 4732–4741. doi:10.1111/bcp.15389
Salvadori, M., Holzer, H., de Mattos, A., Sollinger, H., Arns, W., Oppenheimer, F., et al. (2004). Enteric-coated mycophenolate sodium is therapeutically equivalent to mycophenolate mofetil in de novo renal transplant patients. Am. J. Transplant. official J. Am. Soc. Transplant. Am. Soc. Transpl. Surg. 4 (2), 231–236. doi:10.1046/j.1600-6143.2003.00337.x
Sam, W. J., Akhlaghi, F., and Rosenbaum, S. E. (2009). Population pharmacokinetics of mycophenolic acid and its 2 glucuronidated metabolites in kidney transplant recipients. J. Clin. Pharmacol. 49 (2), 185–195. doi:10.1177/0091270008329558
Sheiner, L. B., and Beal, S. L. (1981). Some suggestions for measuring predictive performance. J. Pharmacokinet. Biopharm. 9 (4), 503–512. doi:10.1007/BF01060893
Sobiak, J., and Resztak, M. (2021). A systematic review of multiple linear regression-based limited sampling strategies for mycophenolic acid area under the concentration-time curve estimation. Eur. J. drug metabolism Pharmacokinet. 46 (6), 721–742. doi:10.1007/s13318-021-00713-0
Sobiak, J., Głyda, M., and Chrzanowska, M. (2021). Pharmacokinetics of enteric-coated mycophenolate sodium metabolites in patients over 60 years old within the first year after renal transplantation. Transplant. Proc. 53 (3), 1001–1004. doi:10.1016/j.transproceed.2020.10.006
Tang, J. T., de Winter, B. C., Hesselink, D. A., Sombogaard, F., Wang, L. L., and van Gelder, T. (2017). The pharmacokinetics and pharmacodynamics of mycophenolate mofetil in younger and elderly renal transplant recipients. Br. J. Clin. Pharmacol. 83 (4), 812–822. doi:10.1111/bcp.13154
Tauzin, M., Tréluyer, J. M., Nabbout, R., Billette de Villemeur, T., Desguerre, I., Aboura, R., et al. (2019). Simulations of valproate doses based on an external evaluation of pediatric population pharmacokinetic models. J. Clin. Pharmacol. 59 (3), 406–417. doi:10.1002/jcph.1333
Tedesco-Silva, H., Bastien, M. C., Choi, L., Felipe, C., Campestrini, J., Picard, F., et al. (2005). Mycophenolic acid metabolite profile in renal transplant patients receiving enteric-coated mycophenolate sodium or mycophenolate mofetil. Transplant. Proc. 37 (2), 852–855. doi:10.1016/j.transproceed.2004.12.186
Tett, S. E., Saint-Marcoux, F., Staatz, C. E., Brunet, M., Vinks, A. A., Miura, M., et al. (2011). Mycophenolate, clinical pharmacokinetics, formulations, and methods for assessing drug exposure. Transplant. Rev. Orl. Fla. 25 (2), 47–57. doi:10.1016/j.trre.2010.06.001
Tornatore, K. M., Meaney, C. J., Attwood, K., Brazeau, D. A., Wilding, G. E., Consiglio, J. D., et al. (2022). Race and sex associations with tacrolimus pharmacokinetics in stable kidney transplant recipients. Pharmacotherapy 42 (2), 94–105. doi:10.1002/phar.2656
Veličković-Radovanović, R. M., Janković, S. M., Milovanović, J. R., Catić-Đorđević, A. K., Spasić, A. A., Stefanović, N. Z., et al. (2015). Variability of mycophenolic acid elimination in the renal transplant recipients – population pharmacokinetic approach. Ren. Fail. 37 (4), 652–658. doi:10.3109/0886022X.2015.1010442
Wang, G., Ye, Q., Huang, Y., Xu, H., and Li, Z. (2022). Population pharmacokinetics of enteric-coated mycophenolate sodium in children after renal transplantation and initial dosage recommendation based on body surface area. Comput. Math. methods Med. 2022, 1881176. doi:10.1155/2022/1881176
Wei, Y., Wu, D., Chen, Y., Dong, C., Qi, J., Wu, Y., et al. (2022). Population pharmacokinetics of mycophenolate mofetil in pediatric patients early after liver transplantation. Front. Pharmacol. 13, 1002628. doi:10.3389/fphar.2022.1002628
Wolfe, R. A., Ashby, V. B., Milford, E. L., Ojo, A. O., Ettenger, R. E., Agodoa, L. Y., et al. (1999). Comparison of mortality in all patients on dialysis, patients on dialysis awaiting transplantation, and recipients of a first cadaveric transplant. N. Engl. J. Med. 341 (23), 1725–1730. doi:10.1056/NEJM199912023412303
Yang, N., Wang, J., Xie, Y., Ding, J., Wu, C., Liu, J., et al. (2022). External evaluation of population pharmacokinetic models to inform precision dosing of meropenem in critically ill patients. Front. Pharmacol. 13, 838205. doi:10.3389/fphar.2022.838205
Yu, Z. C., Zhou, P. J., Wang, X. H., Françoise, B., Xu, D., Zhang, W. X., et al. (2017). Population pharmacokinetics and Bayesian estimation of mycophenolic acid concentrations in Chinese adult renal transplant recipients. Acta Pharmacol. Sin. 38 (11), 1566–1579. doi:10.1038/aps.2017.115
Zhang, L., Liu, M., Qin, W., Shi, D., Mao, J., and Li, Z. (2023). Modeling the protein binding non-linearity in population pharmacokinetic model of valproic acid in children with epilepsy: a systematic evaluation study. Front. Pharmacol. 14, 1228641. doi:10.3389/fphar.2023.1228641
Zhang, H. X., Sheng, C. C., Liu, L. S., Luo, B., Fu, Q., Zhao, Q., et al. (2019). Systematic external evaluation of published population pharmacokinetic models of mycophenolate mofetil in adult kidney transplant recipients co-administered with tacrolimus. Br. J. Clin. Pharmacol. 85 (4), 746–761. doi:10.1111/bcp.13850
Keywords: population pharmacokinetics, mycophenolate sodium, external evaluation, renal transplant recipients, therapeutic drug monitoring
Citation: Gao T, Xu W, Li X, Guo Q, Liu D, Zhang X, Leng P and Sun J (2025) Published population pharmacokinetic models of mycophenolate sodium: a systematic review and external evaluation in a Chinese sample of renal transplant recipients. Front. Pharmacol. 16:1632568. doi: 10.3389/fphar.2025.1632568
Received: 21 May 2025; Accepted: 04 August 2025;
Published: 18 August 2025.
Edited by:
Francine Johansson Azeredo, University of Florida, United StatesReviewed by:
Juan Francisco Morales, University of Florida, United StatesGraziela De Araújo Lock, Universidade Federal de Santa Maria Centro de Ciencias da Saude, Brazil
Copyright © 2025 Gao, Xu, Li, Guo, Liu, Zhang, Leng and Sun. This is an open-access article distributed under the terms of the Creative Commons Attribution License (CC BY). The use, distribution or reproduction in other forums is permitted, provided the original author(s) and the copyright owner(s) are credited and that the original publication in this journal is cited, in accordance with accepted academic practice. No use, distribution or reproduction is permitted which does not comply with these terms.
*Correspondence: Ping Leng, MTg2NjE4MDg5MjZAMTYzLmNvbQ==; Jialin Sun, c2psc3l5ay00MTJAMTYzLmNvbQ==