 Katerina Janisova
 Monika Uhlirova
 Sandor Forczek
 Jaromir Myslivecek
- 1Institute of Physiology, 1st Faculty of Medicine, Charles University, Prague, Czechia
- 2Isotope Laboratory, Institute of Experimental Botany, Academy of Sciences of the Czech Republic, Prague, Czechia
Introduction: M4 muscarinic receptor (mAChR) knockout changed the female activity biological rhythm parameters. In this study, we focus on the biological rhythms of mAChRs (total + M1 mAChRs), acetylcholinesterase (AChE), and butyrylcholinesterase (BuChE) in M4 mAChR knockout (M4KO) and wild-type (WT) mice in specific brain areas.
Methods: Female mice were sacrificed every 4 hours, brains were removed, mAChRs were determined by autoradiography, and punching was used for the measurement of acetylcholinesterase and butyrylcholinesterase activity. The density of mAChRs was correlated with locomotor activity.
Results: An ultradian rhythm in total mAChRs was found in the suprachiasmatic nucleus (SCN) (both M4KO and WT). M4KO had a positive correlation between the number of mAChRs and locomotor activity. This rhythm was changed to circadian in WT with a peak in the active phase and to circadian rhythm in M4KO with phase shifts to the inactive/active phase in the intergeniculate leaflet (IgL) (positive correlation in KO), subparaventricular zone (SPVZ) (negative correlation in WT), and posterior hypothalamic area (PHA) (positive correlation in WT). The thalamus (TH) reveals circadian rhythms in WT and M4KO, with a peak in the active phase (no correlation). The striatum (Str), i.e., caudate ncl-putamen (CPu) (decrease in M4KO, positive correlation in both WT and KO) and the motor cortex (MCx) (no correlation), showed circadian rhythms (peak in active phase). Caudate ncl-putamen M1 mAChRs rhythm in WT was circadian, while M4KO animals revealed an ultradian rhythm. Cholinesterases revealed ultradian and circadian rhythms in different areas.
Discussion: We conclude that muscarinic receptor-directed biological rhythm of activity is determined in the striatum (caudate ncl-putamen) as a key structure mainly by M4 mAChRs with a supportive role of M1 mAChRs.
1 Introduction
M4 muscarinic receptors (mAChRs) affect locomotor activity, and we showed (Valuskova et al., 2018b) that motor activity in M4KO female mice did not differ substantially from that of wild-type (WT) mice during the light period, but in the active (dark) phase, the M4KO mice were more active. They revealed an increase in the mesor, the night values, the night-day difference, and other biological rhythm parameters. As biological rhythm changes in the brain areas implicated in locomotor activity comprise more structures, we employed in vitro autoradiography and identified potential brain areas likely involved in biological rhythm regulation during locomotor activity (Valuskova et al., 2019) and important differences in morning vs. evening muscarinic drug (scopolamine and oxotremorine) effects, both in WT and M4 KO animals.
Furthermore [Riljak et al. (2020)], we searched for a potential mechanism of changes in the locomotor activity biological rhythm using constant darkness to distinguish light responsiveness from real circadian effects. We have shown that although core clock output is changed by M4 mAChRs deletion, the structures involved in biological rhythm regulation in WT and KO animals are likely the same (striatum (Str), thalamus (TH), and intergeniculate leaflet (IgL)). We also found that M1 mAChRs in the striatum (caudate ncl-putamen, CPu) are implicated in the regulation of the locomotor activity biological rhythm.
The description of projections and connections involved in the regulation of locomotor activity is complicated due to the many mutual interconnections. For details, please see Table 1 and the relevant reviews and original articles: Watts and Swanson (1987); Watts et al. (1987); Moga et al. (1995); Edelstein and Amir (1996); Moore (1996); Krout et al. (2002); Abrahamson and Moore (2006); Morin and Allen (2006); Morin (2013); and Vujovic et al. (2015). Other connections (thalamostriatal, striatocortical, and thalamocortical) are well-known and constitute textbook knowledge.
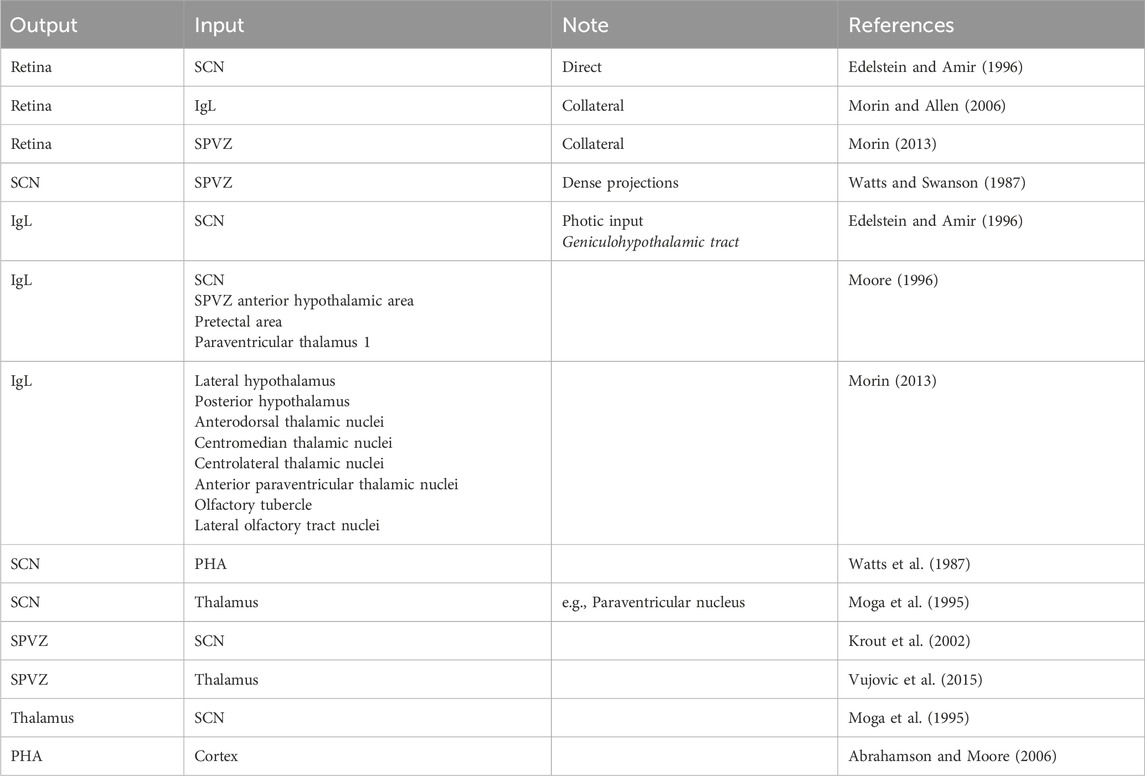
Table 1. Projections and connections between brain areas involved in the regulation of the locomotor activity. The table is limited to the main pathways. Other connections (striatum–thalamus, thalamus–cortex, and cortex–striatum) are not shown. A simplified scheme of these interconnections is included in summarizing Figure 12.
The cholinergic innervation of the suprachiasmatic nucleus (SCN) arises from the cholinergic forebrain and brain stem nuclei. The density of cholinergic fibers and terminals is modest compared to other hypothalamic nuclei (Hut and Van der Zee, 2011). As demonstrated earlier by Valuskova et al. (2018a) and Riljak et al. (2020), M4 mAChRs are abundant in the striatum (caudate ncl-putamen, 46% of all mAChRs). There was also a relatively high density of M1 mAChRs (37%). Similarly, a high percentage of M4 mAChRs (43%) is present in the thalamus. However, the total muscarinic population in the thalamus is low.
The cholinergic system manifests rhythmical activity. However, the data obtained are not identical; some differences originate from different structures or species studied (see Liu and Gillette (1996); Bina et al. (1998); Buchanan and Gillette (2005)).
Cholinergic enzymes (choline acetyltransferase and acetylcholinesterase (AChE)) measured postmortem in the human brain (Perry et al., 1977) showed the amplitude and phases of the changes differently. Circadian fluctuations of cholinergic enzyme activity were reviewed (Hut and Van der Zee, 2011). They found that in most brain areas, during the active phase, there is a peak of choline acetyltransferase activity, while AChE activity has its peak in the inactive phase.
The findings on mAChRs reveal differences among studies. The levels of mAChRs (in the cortex) measured postmortem in the human brain (Perry et al., 1977) were higher in the inactive phase. In the review by Hut and Van der Zee (2011), most animal (rodent) brain areas were reported to have mAChRs peaking in the inactive phase. In other studies or reviews on rats (Wirz-Justice et al., 1981; Kafka et al., 1983; Wirz-Justice, 1987), the peak of mAChRs (forebrain) circadian rhythm was reported to occur during the active period. Circadian rhythmicity of mAChRs was detected in the rat hippocampus and the hypothalamus (not in the cortex, striatum, or cerebellum (Por and Bondy, 1981)). Biological rhythms in mAChRs (with a peak in the active phase) were found in the rat parietal cortex and caudate-putamen (Kafka et al., 1986), and no rhythms were found in other areas. In another study (Marquez et al., 1990), the peak of mAChRs was in the non-active period of rats (at 14:00 h).
Different brain areas show distinct reactions to muscarinic agonists/antagonists. However, one should take into account that the binding of orthosteric agonists/antagonists to different mAChR subtypes is similar (Myslivecek, 2022). For details concerning this issue, see the Discussion.
In this study, we aimed to determine the key structure for the biological rhythms of locomotor activity by studying the rhythms of mAChRs (the total number of mAChRs and M1 mAChRs) and the activity of cholinesterases (AChE and butyrylcholinesterase (BuChE)) in brain areas previously identified as structures involved in the regulation of the biological rhythm during motor activity: IgL, striatum (caudate ncl-putamen), and thalamus. In addition to that, we determined the cholinergic markers in the following structures: SCN, subparaventricular zone (SPVZ), posterior hypothalamic area (PHA), and motor cortex (MCx). We also aimed to reveal the sequence of changes in these brain areas.
2 Methods
2.1 Animals
Mice lacking the M4 muscarinic receptor were generated in Wess’s laboratory (Gomeza et al., 1999) and were subsequently bred in our animal facility (Prague, Czech Republic). Their genetic background was C57Bl/6NTac (WT animals). The animals were treated in accordance with the legislature of the Czech Republic and the EU legislature (European Convention for the Protection of Vertebrate Animals Used for Experimental and Other Scientific Purposes [Council of Europe No 123, Strasbourg 1985]), and the experimental protocol was approved by the Committee for the Protection of Experimental Animals of the First Medical Faculty, Charles University, Prague, and the Ministry of Education of the Czech Republic under No MSMT-2409/2017-3 and MSMT-5939/2022-4. We studied fully backcrossed (15 generations) M4−/− and M4 +/+ mAChRs littermates. The animals were maintained under controlled environmental conditions (12/12-h light/dark cycle, 22 °C ± 1 °C, light on at 6:00). Food and water were available ad libitum. A total of 144 female mice (weighing 20–26 g, age 3–6 months) were used in the study, of which there were 72 M4 KO animals and 72 WT animals. Before all the experiments, the mice were carefully genotyped, and only homozygous mice were used. The control is carried out by genotyping the tissue taken when the animal is sacrificed at the end of the experiment. The female mice were housed separately from male mice, thus revealing the Lee–Boot effect (i.e., suppression of the estrus cycle—anestrous), which made the female group homogeneous in hormone levels. Moreover, no differences were observed in light microscopy of vaginal lavage or actograms in female mice for 15 consecutive days (control animals were not included in the experiment because of the stressful procedure associated with lavage acquisition).
2.2 Tissue preparation
The tissue of several brain areas previously shown to relate to locomotor activity biological rhythm changes (MCx, CPu, TH, SCN, SPVZ, PHA, and IgL) was used in this experiment. As the striatum consists of two distinctively different structures, we also compared the muscarinic receptor density in caudate ncl-putamen with the density in the ncl. accumbens. The mice were euthanized using cervical dislocation and decapitation, with the aim of not harming receptors using anesthesia. Brains were rapidly removed—12 brains per group every 4 hours (i.e., at 2:00, 6:00, 10:00, 14:00, 18:00, and 22:00), frozen in dry ice, and then stored at −80 °C. Individual structures (SCN, SPVZ, IGL, MCx, CPu, TH, and PHA) were verified in Nissl staining (see Supplementary Figure S1). For details, see Valuskova et al. (2018b). In brief, the parallel sections were obtained using a cryostat, and the area, clearly visible as in Nissl staining, was then marked (using border transposition) on a scanned autoradiogram (see section 2.5) and used for densitometry with PC-based analytical software.
2.3 Total muscarinic receptor number
Muscarinic receptors were detected using the non-specific antagonist 3H-QNB (3H-quinuclidinyl benzilate or 3H-1-azabicyclo [2.2.2]oct-3-yl 2-hydroxy-2,2-diphenylacetate, 50.5 Ci/mmol, PerkinElmer, Inc., United States) in a radioligand binding assay. Autoradiography was performed as described previously in detail (Farar et al., 2012); the sections were incubated for 90 min with 2 nM 3H-QNB at room temperature. As a control, we performed competitive incubation of 3H-QNB (170 pmol/L, value within range 1.0-2.0 fold estimated KD) in the CPu of M4 KO animals with selective M4 antagonist VU6013720 (synthesized by Santiago, Inc., Czech Republic; final concentration 30 nmol/L, the concentration blocking M4 mAChRs but not the other mAChRs) (Moehle et al., 2021; Qi et al., 2023). Moreover, as another control, we performed saturation binding in the motor cortex with 3H-QNB (0.0625-2 nmol/L), pre-incubated with 30 nmol/L VU6013720.
2.4 M1 mAChR number
For M1 mAChR receptor number determination, the specific protocol of autoradiography was performed (Valuskova et al., 2018a), and the sections were incubated for 60 min with 5 nM 3H-pirenzepine (non-specific antagonist, 3H-11-[(4-methylpiperazin-1-yl)acetyl]-5,11-dihydro-6H-pyrido[2,3-b][1,4]benzodiazepin-6-one, 100.0 Ci/mmol; American Radiolabeled Chemicals, Inc., United States) at room temperature (RT).
2.5 Common procedure for autoradiography
Frontal sections (16-micrometer-thick) were cut on a cryostat at −20 °C, thaw-mounted onto Superfrost® Plus glass slides (Carl Roth GmbH and Co. KG, Karlsruhe, Germany), and stored in boxes at − 80 °C until use. To assess mAChR binding (total and M1 mAChRs), the sections were allowed to thaw and dry for 30 min at 22 °C, and the density of receptors was determined as follows. Dry brain sections were pre-incubated for 30 min in 50 mM potassium phosphate buffer (pH 7.4) at RT. Incubation with specific ligands is mentioned above. Nonspecific binding was assessed on adjacent sections in the presence of 10 μM atropine sulfate. After incubation, the sections were washed twice for 5 min and twice for 2 seconds and then gently dried. Dry sections were apposed to the tritium-sensitive Fuji BAS imaging plates (GE Healthcare Europe GmbH, Freiburg, Germany) in Kodak Biomax autoradiographic cassettes (Carestream Health, Inc., Rochester, NY, United States) for 5 days. The linearity of the signal and conversion of photo-stimulated luminescence to radioactivity were assessed using tritium autoradiographic standards (American Radiolabeled Chemicals, Inc., St. Louis, MO, United States). The film autoradiograms were scanned, and densitometry was performed with the PC-based analytical software, MCID analysis software. Measurements were taken from at least three sections for each animal and brain region, and the values were then averaged. We compared the densities in the left and right hemispheres. Since there were no differences in laterality, both sides were taken together.
2.6 Acetylcholinesterase and butyrylcholinesterase activity
The tissue for enzyme activity analysis was obtained every 4 h (i.e., at 2:00, 6:00, 10:00, 14:00, 18:00, and 22:00) using a micro-punching technique similar to that used earlier (Valuskova et al., 2017). In detail, samples of the MCx, Str, and TH were isolated using a punch method, collecting as much tissue as possible. Brains were quickly removed, immediately frozen on dry ice, and kept in storage boxes at −80 °C until needed. The brains were cut into 3-mm-thick serial coronal sections with a razor blade with a handle (P-lab a. s., Prague, Czech Republic) using a cryostat chamber at a temperature of −10 °C. The tissue was isolated using specialized metal punching needles and then stored at −80 °C until further analysis.
Tissue preparation: Isolated brain tissue was homogenized using an Ultra Turrax Homogenizer (IKA-Werke GmbH & Co. KG, Staufen, Germany) by three pulses of 10 s in 300 μL of 0.32 M sucrose at 4 °C. The activity of AChE and BuChE was determined by Ellman’s colorimetric method, modified for a 96-well microtiter plate reader (Tecan Sunrise, Tecan Group Ltd, Männedorf, Switzerland), as previously described (Valuskova et al., 2017). The activity of AChE was assayed with 0.69 mM acetylthiocholine and 0.5 mM 5,5-dithiobis (2-nitrobenzoic acid) (DTNB) in 5 mM HEPES buffer, pH 7.4, containing 10 mM MgCl2. Tissue samples (10 μg) were first pre-incubated with DTNB to saturate free sulfhydryl groups and subsequently with tetra (monoisopropyl)pyrophosphortetramide (iso-OMPA) (final concentration 0.1 mM) to block AChE activity for 30 min. The activity was measured at 412 nm at different time points (0, 5, 10, 20, and 30 min). BuChE activity was assayed as described for AChE except that butyrylthiocholine was used as a substrate and BuChE activity was blocked with 1,5-bis(4-allyldimethylammoniumphenyl)pentan-3-one dibromide (BW284C51) (final concentration 5 μM). The total assay volume was 200 μL. Protein concentration was determined using a BCA assay kit (Pierce, Waltham, MA). The amount of protein was identical for all brain regions (μg prot./ml).
The amount of reaction product was calculated according to the Beer–Lambert law, as shown in Equation 1.
where A is absorbance, b is the path length in centimeters (cm), c is the concentration in moles/liter (M), and ε is the molar extinction coefficient in (M-1cm-1).
2.7 Biological rhythm calculations and statistical evaluation
For the biological rhythm calculations, the nature of the obtained data (autoradiography performed at specific time points–every 4 h) does not allow the use of Cosinor analysis. This could bias the results. Therefore, we only labeled the peaks and described the rhythm according to whether it was circadian.
The Cosinor analysis, which we performed for control, did indeed bias the resulting data (fitting multiple peaks, giving different values, or software marked the data as insufficient to conduct a valid analysis).
Furthermore, as a control, we used the advanced mathematical functions of MATLAB R2022b to obtain 24 points for chronological evaluation. MATLAB accomplished this using cubic spline interpolation (polynomial of degree 3). We chose to use this special case of spline interpolation because this interpolation polynomial is smoother, has less error than some other polynomials, and also helps avoid the Runge effect (using a higher degree polynomial does not always improve accuracy; instead, oscillations appear at the edges of the interval). Thus, our presented results only appear to be simply sampling the time point with the largest value. The interpreted results are based on verification using this interpolation method.
Individual values were calculated from the respective phases of the day (day and night). The specific biological rhythm values were calculated: day mean (Dmean), night mean (Nmean), the difference between night and day mean (N-Dmean), and mesor (midline value). These values, as they depend on each other, were compared in WT and M4KO animals using two-way ANOVA in GraphPad Prism software with Sidak’s post-hoc correction. Statistically, it is necessary to analyze the parameters as a whole to avoid bias (false statistical significance) between groups when performing a significance analysis between two groups. Since the samples were obtained post-mortem, comparisons between individual time points cannot be applied, only comparisons between groups.
To determine which structure is important for locomotor activity biological rhythm, we have correlated locomotor activity data (see the original locomotor activity graph in Figure 11) obtained earlier (Valuskova et al., 2018b) with present data on mAChR densities in specific structures. Linear regressions were also calculated.
2.8 Relative m4 mAcChR mAChR density
The changes in the relative density of M4 mAChRs were counted accodring to Equation 2 as the difference between the total mAChR density in WT animals and M4 KO animals. The difference between the total number of binding sites in WT and the total number of binding sites in KO animals determines the relative density of M4 mAChRs:
3 Results
The incubation of 3H-QNB with VU6013720 (M4 mAChRs specific antagonist) in CPu showed no reduction in the binding in M4KO animals: 755.5 ± 479.5 fmol/mg protein (M4KO) vs. 733.3 ± 272.2 fmol/mg protein (M4KO + VU6013720), while in WT animals, VU6013720 caused a reduction in binding from 2000 ± 183.7 fmol/mg protein to 748.1 ± 297.4 fmol/mg protein (by 63%). Saturation binding in the motor cortex with 3H-QNB pre-incubated with VU6013720 showed a reduction of binding in WT animals by 34.26% (1,412 ± 341.5 fmol/mg prot. vs. 928.2 ± 121.8 fmol/mg. prot., respectively), while in KO, there was no reduction in binding (802 ± 160.6 fmol/mg prot. vs. 772.8 ± 115.9 fmol/mg prot.).
3.1 Total number of mAChRs
The representative autoradiograms in WT and M4KO animals are shown in Supplementary Figure S2.
3.1.1 Suprachiasmatic nucleus
In the SCN, the biological rhythm of mAChR total number revealed ultradian variations in both WT and M4KO animals (Figure 1). The peaks in WT animals were at 2:00, 10:00, and 18:00, while in M4KO animals, there were peaks at 10:00 and 22:00. There was no correlation between locomotor activity and the total number of mAChRs in WT (Pearson r = 0.08, p = 0.88), while in KO animals, there was a strong correlation (r = 0.85, p = 0.03). Linear regression (see Figure 2) showed a slope of 0.02, not significantly different from zero (FDFn, DFd was (F1,4 = 0.0258, p = 0.8799, where DFn where DFn is the degrees of freedom numerator and DFd is the degrees of freedom denominator) in WT. In KO, the slope was 0.08, which was significantly different from zero (F1,4 = 10.06, p = 0.034).
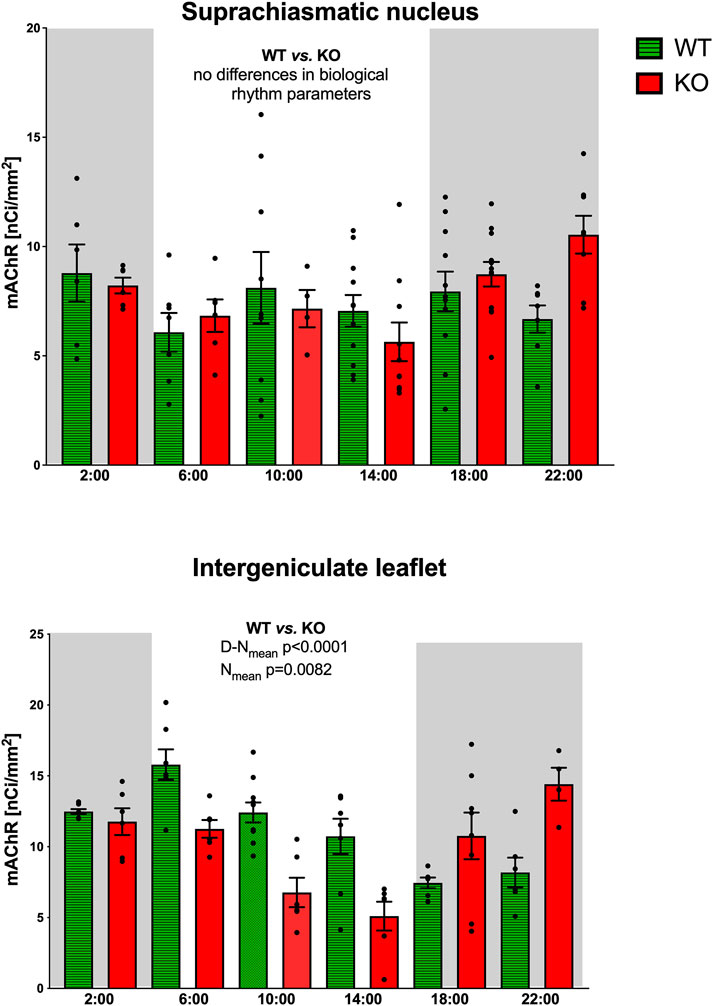
Figure 1. Top: the changes in the total number of mAChRs in the suprachiasmatic nucleus. Ordinate: relative density expressed as nCi/mm2; abscissa: time [h]. Grey rectangles represent the dark phase (lights off at 18:00 and lights on at 6:00). Data are expressed as the mean ± SEM with individual points. Two-way ANOVA: interaction between the genotype and biological rhythm parameters was not significant: F3,140 = 0.72, p = 0.54. The result of statistical analysis is given in the middle of the figure. Bottom: the changes in the total number of mAChRs in the intergeniculate leaflet. Ordinate: relative density expressed as nCi/mm2; abscissa: Abscissa: time [h]. Grey rectangles represent the dark phase (lights off at 18:00, lights on at 6:00). Data are expressed as the mean ± SEM with individual points. Two-way ANOVA: interaction between the genotype and biological rhythm parameters was significant: F3,144 = 12.10, p < 0.0001, and differences have been shown in Nmean (p = 0.008) and N–Dmean (p < 0.0001). The result of statistical analysis is given in the middle of the figure. Legend: WT, wild-type animals, KO, M4 mAChR KO animals.
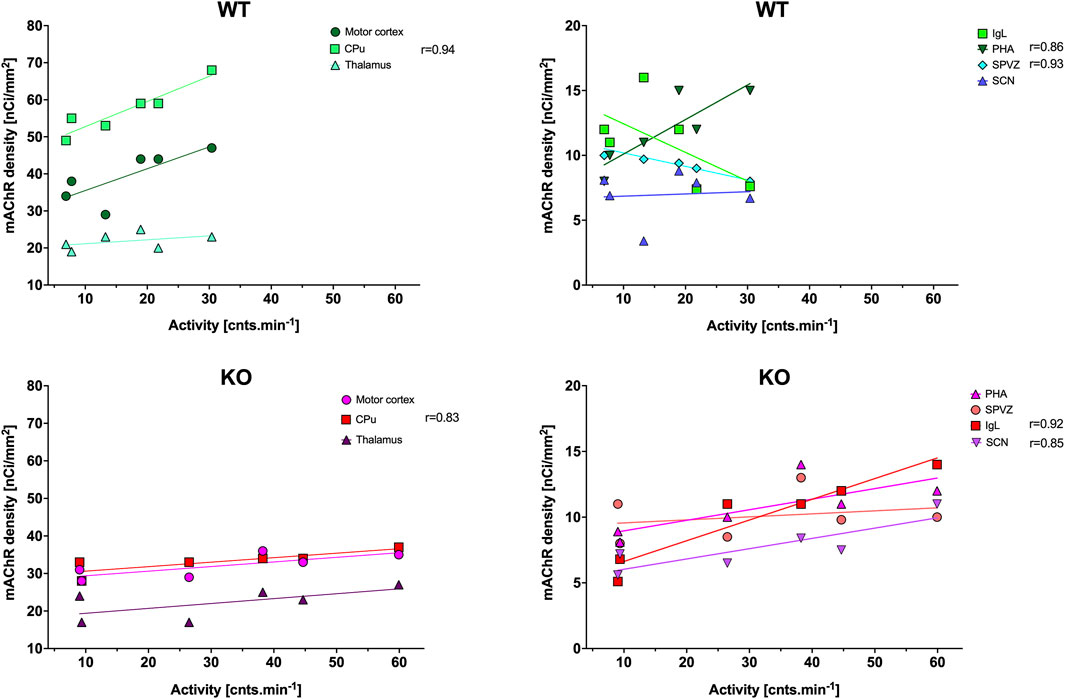
Figure 2. Correlation between the total number of mAChRs and locomotor activity (as published previously by Valuskova et al. (2018b), which is shown in Figure 11). Top: the linear regression in WT animals in the motor cortex, CPu, and thalamus (left) and in IgL, PHA, SPVZ, and SCN (right, see list of abbreviations). Bottom: the linear regression in KO animals in the motor cortex, striatum, and thalamus (left) and in IgL, PHA, SPVZ, and SCN (right). Ordinate: relative density expressed as nCi/mm2; abscissa: activity [cnts.min-1]. Please note that in KO animals, there was higher locomotor activity. Significant correlation coefficients are shown.
Statistical analysis of biological rhythm parameters (two-way ANOVA: interaction of two factors (genotype (WT vs. KO) and biological rhythm parameters (N-Dmean, Nmean, N–Dmean, and Mesor) was not significant: F3,140 = 0.72, p = 0.54. Thus, Sidak’s post-hoc test was not appropriate (see also Table 2).
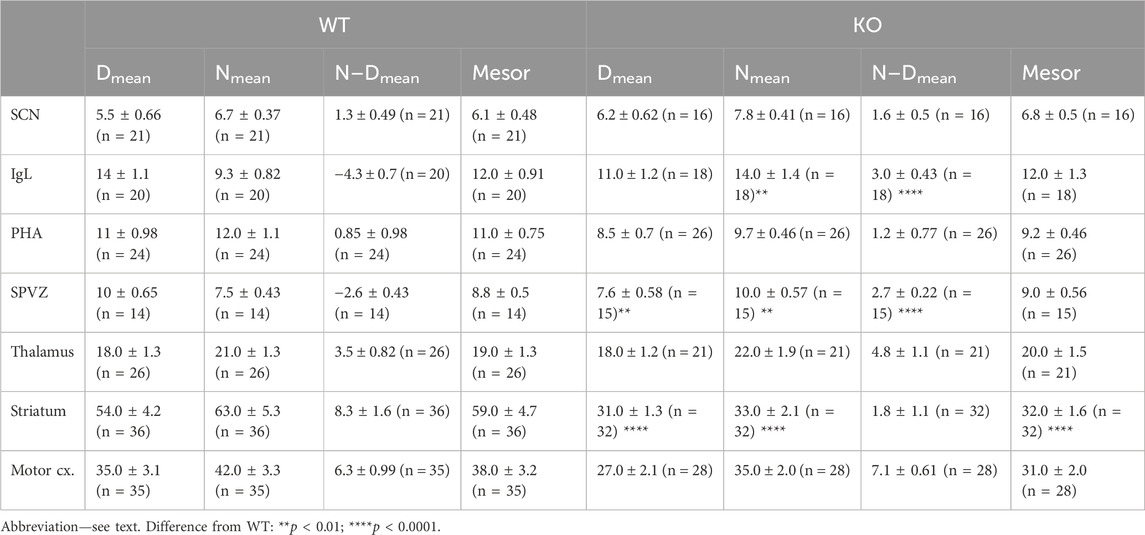
Table 2. Biological rhythm parameters of mAChR total number in specific brain areas.
3.1.2 Intergeniculate leaflet
The ultradian variations visible in the SCN were changed to a circadian rhythm in the IgL in both WT and KO animals (Figure 1). However, the M4KO animals had a peak value shifted (advanced) by 8 h. While the WT animals had a peak value at 6:00 (end of the active phase), M4KO had a peak at 22:00 (middle of the active phase). Two-way ANOVA (interaction) (F3,144 = 12.10, p < 0.0001) showed differences in Nmean (p = 0.008) and N–Dmean (p < 0.0001) (see also Table 2). There was no correlation between activity and the total number of mAChRs in WT (r = −0.62, p = 0.19), while in KO animals, there was a strong correlation (r = 0.92, p = 0.004). Linear regression (see Figure 2) showed a slope of −0.22 in WT, which was not significantly different from zero (F1,4 = 2.495, p = 0.19). In KO, the slope was 0.16, which was significantly different from zero (F1,4 = 37.86, p = 0.004).
3.1.3 Posterior hypothalamic area
As with the IgL, the PHA also revealed circadian variations in both WT and KO animals (Figure 3). The M4KO animals had a peak value shifted (advanced) by 8 h. While the WT animals had a peak value at 2:00 (middle of the active phase), M4KO had a peak at 18:00 (beginning of the active phase). Two-way ANOVA (interaction) (F3,192 = 0.8865, p = 0.45) showed no difference between WT and M4KO animals (see also Table 2). There was a correlation between locomotor activity and the total number of mAChRs in WT (r = 0.86, p = 0.028), while in KO animals, there was no correlation (r = 0.76, p = 0.08). Linear regression (see Figure 2) showed a slope of 0.27 in WT, which was significantly different from zero (F1,4 = 11.51, p = 0.028). In KO, the slope was 0.08, which was not significantly different from zero (F1,4 = 5.34, p = 0.082).
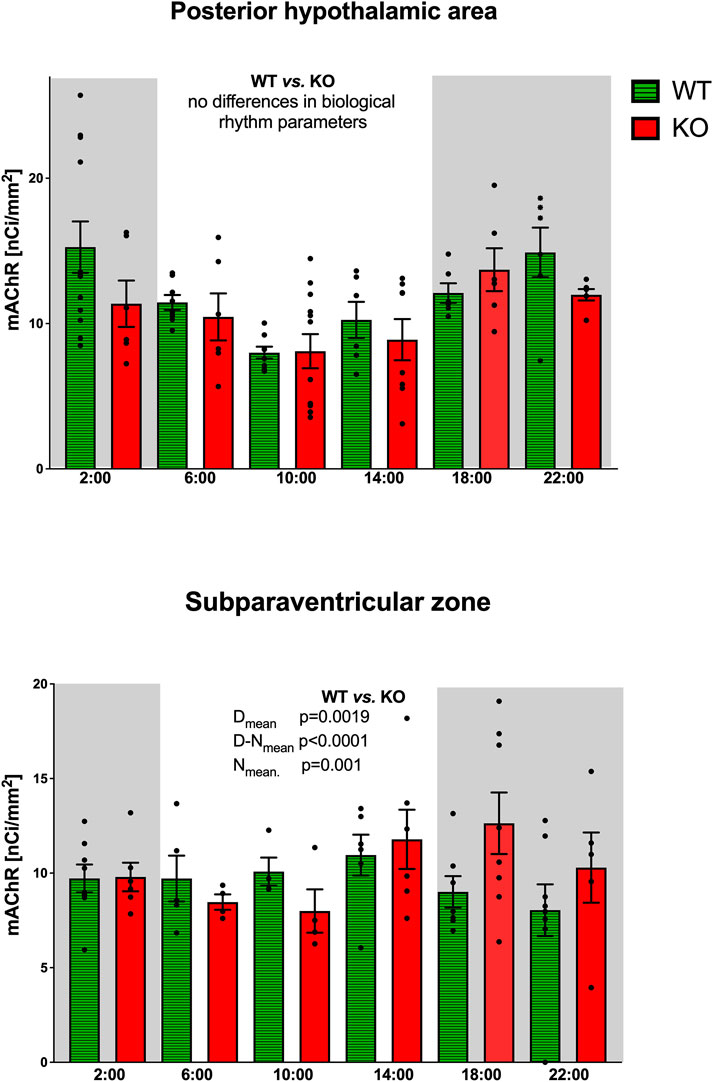
Figure 3. Top: the changes in the total number of mAChRs in the posterior hypothalamic area. Ordinate: relative density expressed as nCi/mm2; abscissa: time [h]. Grey rectangles represent the dark phase (lights off at 18:00 and lights on at 6:00). Data are expressed as the mean ± SEM with individual points. Two-way ANOVA: interaction between the genotype and biological rhythm parameters was not significant: F3,192 = 0.8865, p = 0.45. The result of statistical analysis is given in the middle of the figure. Bottom: the changes in the total number of mAChRs in the subparaventricular zone. Ordinate: relative density expressed as nCi/mm2; abscissa: time [h]. Grey rectangles represent the dark phase (lights off at 18:00 and lights on at 6:00). Data are expressed as the mean ± SEM with individual points. Two-way ANOVA: interaction between the genotype and biological rhythm parameters was significant: F3,108 = 23.26, p < 0.0001 and differences have been shown in the Nmean (p = 0.001), Dmean (p = 0.0019), and N–Dmean (p < 0.0001). The result of statistical analysis is given in the middle of the figure. Legend: WT, wild-type animals; KO, M4 mAChR KO animals.
3.1.4 Subparaventricular zone
The subparaventricular zone also revealed a circadian rhythm in the total number of mAChRs (Figure 3). The M4KO animals had a peak value shifted (delayed) by 4 h. While the WT animals had a peak value at 14:00 (in the inactive phase), M4KO had a peak at 18:00 (beginning of the active phase). Two-way ANOVA (interaction) (F3,108 = 23.26, p < 0.0001) showed differences between Dmean (p = 0.0019), Nmean (p = 0.001), and N–Dmean (p < 0.0001) (see also Table 2). There was a correlation between locomotor activity and the total number of mAChRs in WT (r = −0.93, p = 0.007), while in KO animals, there was no correlation (r = 0.26, p = 0.62). Linear regression (see Figure 2) showed a slope of −0.104 in WT, significantly different from zero (F1,4 = 27.14, p = 0.007). In KO, the slope was 0.02, which was not significantly different from zero (F1,4 = 0.28, p = 0.62).
3.1.5 Thalamus
The thalamus was also the brain structure with circadian variations in the total number of mAChRs (Figure 4). The M4KO animals had a peak value shifted (advanced) by 4 h. While the WT animals had a peak value at 2:00 (middle of the active phase), M4KO had a peak at 22:00 (in the active phase). Two-way ANOVA (interaction) (F3,180 = 0.3584, p = 0.78) did not find any differences between WT and M4KO animals (see also Table 2). There was no correlation between activity and the total number of mAChRs in WT (r = 0.43, p = 0.39). Similarly, in KO animals, there was also no correlation (r = 0.63, p = 0.18). Linear regression (see Figure 2) showed a slope of 0.11 in WT, which was not significantly different from zero (F1,4 = 0.91, p = 0.39). In KO, the slope was 0.13, which was not significantly different from zero (F1,4 = 2.57, p = 0.18).
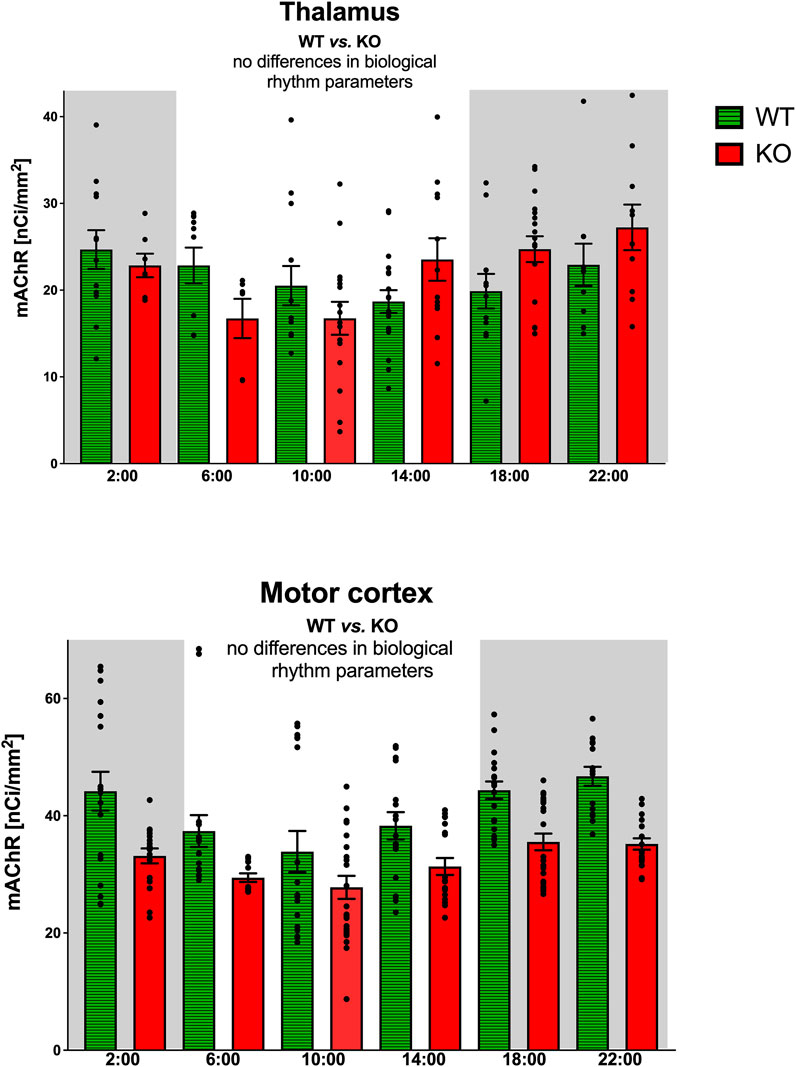
Figure 4. Top: the changes in the total number of mAChRs in the thalamus. Ordinate: relative density expressed as nCi/mm2; abscissa: time [h]. Grey rectangles represent the dark phase (lights off at 18:00 and lights on at 6:00). Two-way ANOVA: interaction between the genotype and biological rhythm parameters was not significant: F3,180 = 0.36, p = 0.78. Data are expressed as the mean ± SEM with individual points. See legend for an explanation of symbols. Bottom: the changes in the total number of mAChRs in the motor cortex. Ordinate: relative density expressed as nCi/mm2; abscissa: time [h]. Grey rectangles represent the dark phase (lights off at 18:00 and lights on at 6:00). Data are expressed as the mean ± SEM with individual points. Two-way ANOVA: interaction between the genotype and biological rhythm parameters was not significant: F3,244 = 0.85, p = 0.47. The result of statistical analysis is given in the middle of the figure. Legend: WT, wild-type animals; KO, M4 mAChR KO animals.
3.1.6 Caudate ncl-putamen
CPu revealed circadian rhythmicity in total mAChRs in both WT and M4KO animals, with a significant decrease in mAChRs in M4KO animals (Figure 5). Both rhythms had a peak in the active phase at 22:00. Two-way ANOVA (interaction) (F3,264 = 12.57, p < 0.0001) showed differences between Dmean (p < 0.0001), Nmean (p < 0.0001), and mesor (p < 0.0001) (see also Table 2). There was a strong correlation between locomotor activity and the total number of mAChRs in WT (r = 0.94, p = 0.006), and similarly, in KO animals, there was also a strong correlation (r = 0.83, p = 0.04). Linear regression (see Figure 2) showed a slope of 0.68 in WT, which was significantly different from zero (F1,4 = 29.19, p = 0.006). In KO, the slope was 0.12, which was significantly different from zero (F1,4 = 8.58, p = 0.04).
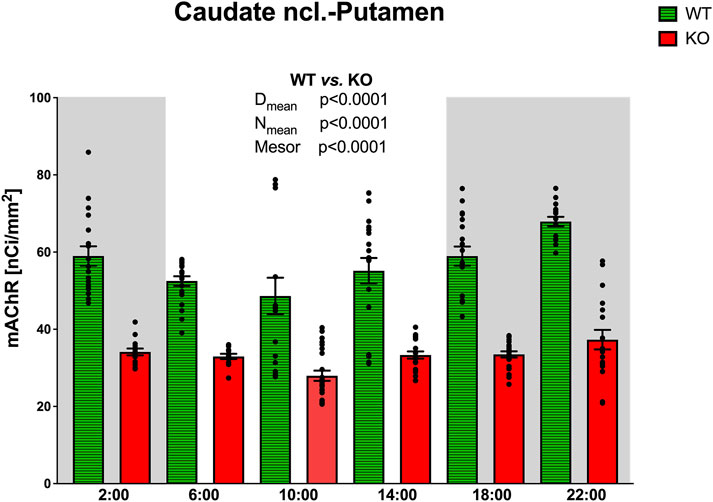
Figure 5. Changes in the total number of mAChRs in the CPu. Ordinate: relative density expressed as nCi/mm2, abscissa: time [h]. Grey rectangles represent the dark phase (lights off at 18:00 and lights on at 6:00). Data are expressed as the mean ± SEM with individual points. Two-way ANOVA: interaction between the genotype and biological rhythm parameters was significant: F3,264 = 12.57, p < 0.0001, and differences have been shown in the Nmean (p < 0.0001), Dmean (p < 0.0001), and mesor (p < 0.0001). The result of statistical analysis is given in the middle of the figure. Legend: WT, wild-type animals; KO, M4 mAChR KO animals.
3.1.7 Motor cortex
The motor cortex also revealed circadian rhythmicity with similar changes in receptor density in WT and M4KO animals (Figure 4). However, two-way ANOVA (interaction) (F3,244 = 0.8457, p = 0.47) did not find any differences between WT and M4KO animals (see also Table 2). There was no correlation between activity and the total number of mAChRs in WT (r = 0.77, p = 0.07), and similarly, in KO animals, there was also no correlation (r = 0.77, p = 0.07). Linear regression (see Figure 2) showed a slope of 0.58 in WT, which was not significantly different from zero (F1,4 = 5.7, p = 0.07). In KO, the slope was 0.12, which was not significantly different from zero (F1,4 = 5.88, p = 0.07).
3.1.8 Relative M4 mAChR density
The changes in the relative density of M4 mAChRs were counted as the difference between the total mAChR density in WT and M4 KO animals.
If the result of this subtraction is negative, then M4 mAChR deletion will lead to a compensatory increase in other mAChR subtype(s). These changes in specific brain areas are shown in Figure 6. As the receptor density in WT animals was obtained from different individuals than the values from KO animals, it is not possible to obtain individual points. Thus, the resulting value was the result of subtracting average values, and no individual points could be shown.
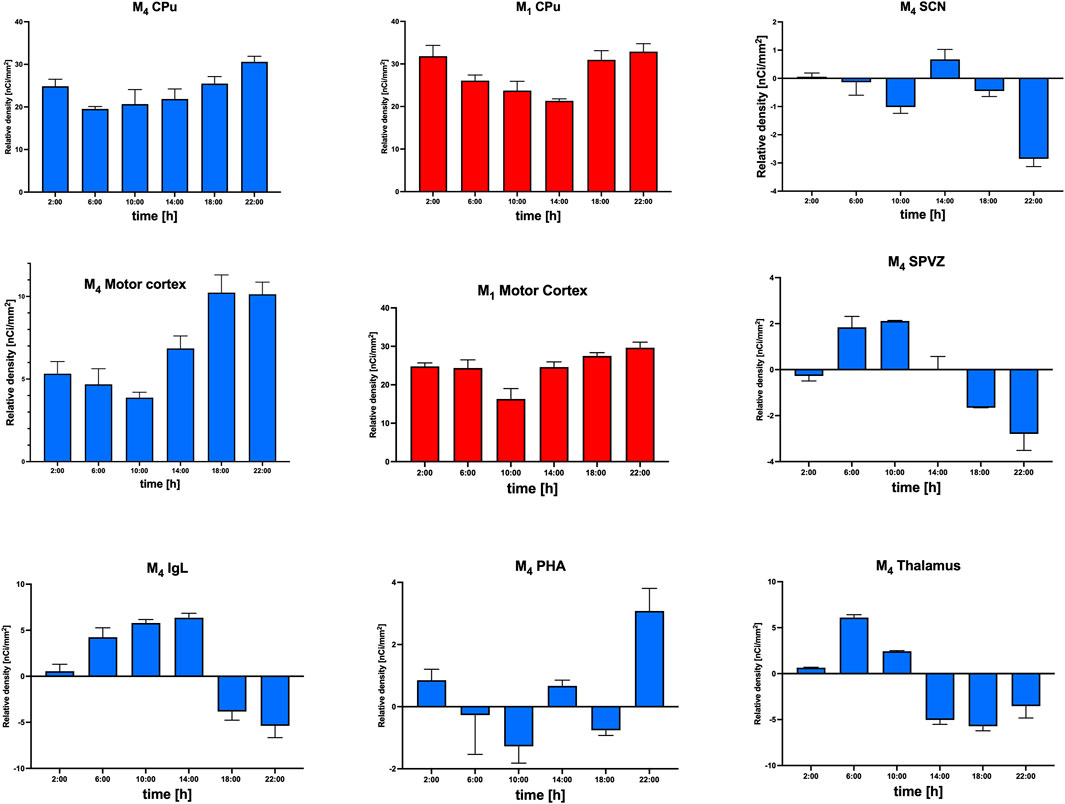
Figure 6. Relative density of M1 (red) and M4 (blue) mAChRs in the CPu and motor cortex and M4 mAChRs (blue) in SCN, SPVZ, IgL, PHA, and thalamus. Ordinate: relative density expressed as nCi/mm2; abscissa: the time [h]. See the sbrain area legend for specific data.
3.1.9 Comparison of the total number of mAChRs and M1 mAChRs in caudate ncl.-putamen and ncl. accumbens
The density of the total number of mAChRs and M1 mAChRs was also measured in the ncl. accumbens, a structure not directly involved in locomotor activity but tightly connected to CPu. The total number of mAChRs was lower than in CPu; there was no difference in biological rhythm parameters, and there was no correlation with locomotor activity (see Figure 7). The total mAChR rhythmical activity in the ncl. accumbens is ultradian (both in WT and KO animals). The subtracted number of M4 mAChRs is lower than in CPu. In detail, two-way ANOVA (interaction): F3,825 = 1.789, p = 0.15 did not find any differences between WT and M4KO animals. There was no correlation between activity and the total number of mAChRs in WT (r = 0.8, p = 0.054), and similarly, in KO animals, there was also no correlation (r = 0.61, p = 0.2). Linear regression (see Figure 7) showed a slope of 0.82 in WT, which was not significantly different from zero (F1,4 = 7.33, p = 0.054). In KO, the slope was 0.22, which was not significantly different from zero (F1,4 = 2.411, p = 0.19). The number of M1 mAChRs was comparable with those in CPu; there was no difference in biological rhythm parameters, and there was no correlation with locomotor activity (see Figure 7). The rhythmical activity of M1 mAChRs in the ncl. accumbens is ultradian/circadian. In detail, two-way ANOVA (interaction): F3,237 = 5.32, p = 0.0015 revealed a difference between WT and M4KO animals in Dmean (p = 0.0033). There was no correlation between activity and the number of M1 mAChRs in WT (r = 0.67, p = 0.14), and similarly, in KO animals, there was also no correlation (r = 0.79, p = 0.06). Linear regression (see Figure 7) showed a slope of 0.66 in WT, which was not significantly different from zero (F1,4 = 3.29, p = 0.14). In KO, the slope was 0.26, which was not significantly different from zero (F1,4 = 6.58, p = 0.06).
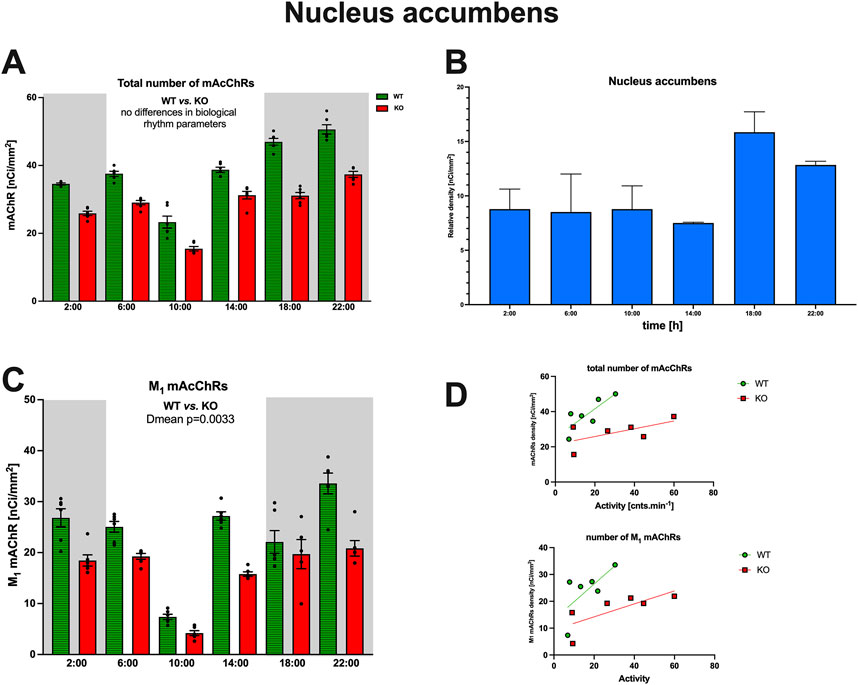
Figure 7. (A) Changes in the total number of mAChRs in the ncl. accumbens. Ordinate: relative density expressed as nCi/mm2; abscissa: time [h]. Grey rectangles represent the dark phase (lights off at 18:00 and lights on at 6:00). Data are expressed as the mean ± SEM with individual points. Two-way ANOVA: interaction between the genotype and biological rhythm parameters was not significant: F3,825 = 1.789, p = 0.15. The result of statistical analysis is given in the middle of the figure. Legend: WT, wild-type animals; KO, M4 mAChR KO animals. (C) Relative density of M4 mAChRs (blue). Ordinate: relative density expressed as nCi/mm2; abscissa: the time [h]. (B) Changes in the number of M1 mAChRs in the ncl. accumbens. Ordinate: relative density expressed as nCi/mm2; abscissa: time [h]. Grey rectangles represent the dark phase (lights off at 18:00 and lights on at 6:00). Data are expressed as the mean ± SEM with individual points. Two-way ANOVA: interaction between the genotype and biological rhythm parameters was significant: F3,84 = 13.12, p < 0.0001. The result of statistical analysis is given in the middle of the figure. Legend: WT, wild-type animals; KO, M4 mAChR KO animals. (D) The correlation between the total number of mAChRs or M1 mAChRs and locomotor activity. Top: the linear regression in WT and KO animals for the total number of mAChRs. Bottom: the linear regression in WT and KO animals for the number of M1 mAChRs. Ordinate: relative density expressed as nCi/mm2; abscissa: activity [cnts.min-1]. There was no significant correlation. Please note that in KO animals, there was higher locomotor activity. There was no correlation between activity and the total number of mAChRs in WT (r = 0.8, p = 0.054), and similarly, in KO animals, there was also no correlation (r = 0.61, p = 0.2). Linear regression (see Figure 7) showed a slope of 0.82 in WT, which was not significantly different from zero (F1,4 = 7.33, p = 0.054). In KO, the slope was 0.22, which was not significantly different from zero (F1,4 = 2.411, p = 0.19).
3.2 M1 mAChRs number
The representative autoradiograms in WT and M4KO animals are shown in Supplementary Figure S3.
3.2.1 Caudate nucleus-putamen
In CPu (Figure 8), the rhythm in WT animals was circadian (with a peak at the end of the active phase, i.e., at 6:00), while M4KO animals revealed ultradian rhythm (with peaks at 6:00 and 18:00). Two-way ANOVA (F3,84 = 13.12, p < 0.0001) showed differences between Dmean (p < 0.0001), Nmean (p < 0.0001), and mesor (p < 0.0001). There was a strong correlation between locomotor activity and the number of M1 mAChRs in WT (r = 0.92, p = 0.008), while in KO animals, there was no correlation (r = −0.12, p = 0.82). Linear regression (see Figure 9) showed a slope of 0.49 in WT, which was significantly different from zero (F1,4 = 23.44, p = 0.008). In KO, the slope was −0.02, which was not significantly different from zero (F1,4 = 0.05, p = 0.82).
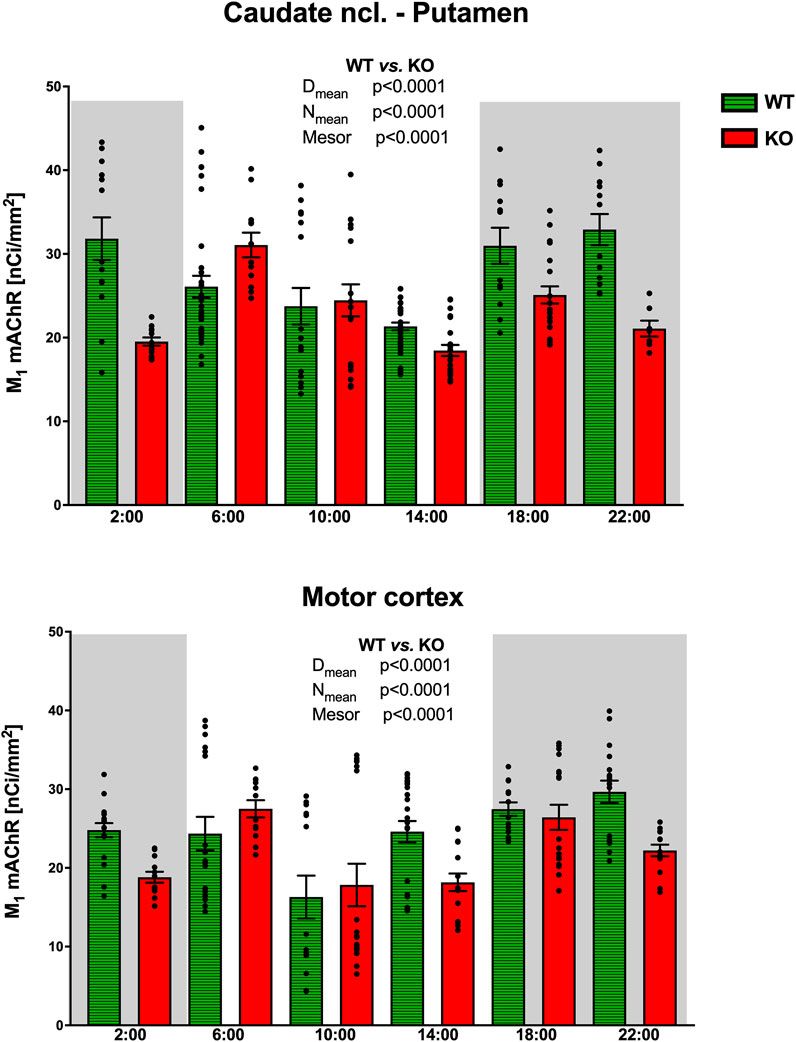
Figure 8. Changes in the number of M1 mAChRs in the striatum (top) and motor cortex (bottom). Ordinate: relative density expressed as nCi/mm2; abscissa: time [h]. Grey rectangles represent the dark phase (lights off at 18:00 and lights on at 6:00). Data are expressed as the mean ± SEM with individual points. Two-way ANOVA: interaction between the genotype and biological rhythm parameters was significant: F3,84 = 13.12, p < 0.0001 (striatum) and differences have been shown in the Nmean (p < 0.0001), Dmean (p < 0.0001), and mesor (p < 0.0001); F3,112 = 19.78, p < 0.0001 (motor cortex) and differences have been shown in the Nmean (p < 0.0001), Dmean (p < 0.0001), and mesor (p < 0.0001). The result of statistical analysis is given in the middle of the figure. Legend: WT, wild-type animals; KO, M4 mAChR KO animals.
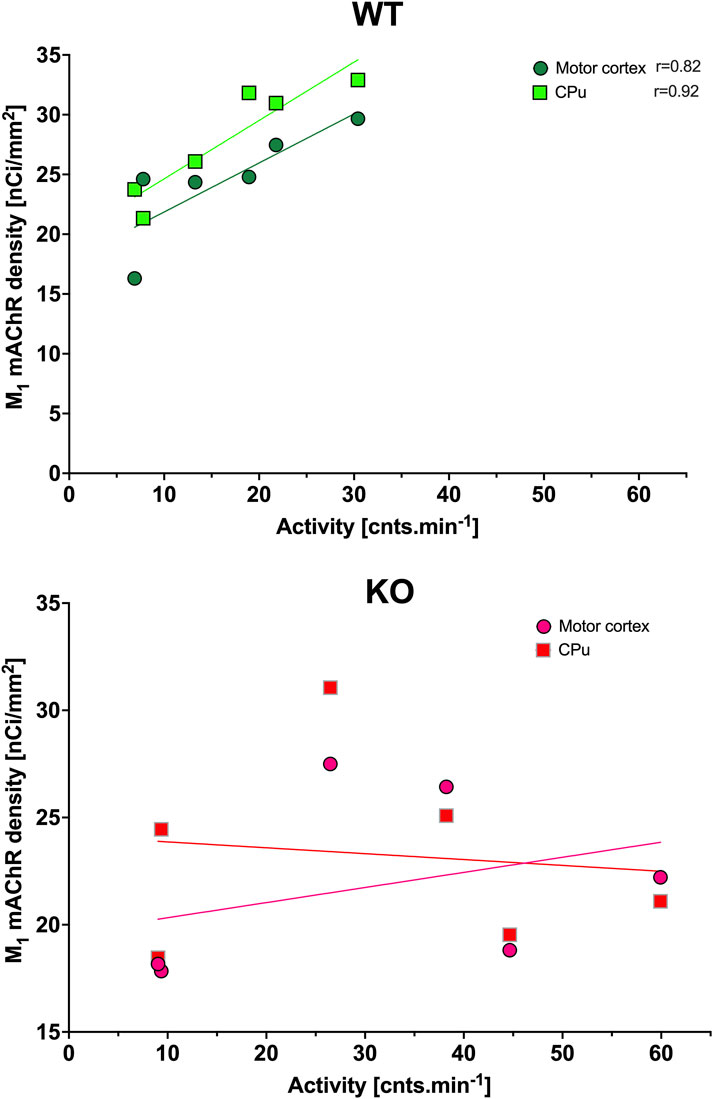
Figure 9. Correlation between the total number of M1 mAChRs and locomotor activity. Top: the linear regression in WT animals in the motor cortex and striatum. Bottom: the linear regression in KO animals in the motor cortex and striatum. Ordinate: relative density expressed as nCi/mm2; abscissa: activity [cnts.min-1]. Significant correlation coefficients are shown. Please note that in KO animals, there was higher locomotor activity.
3.2.2 Motor cortex
While WT animals had circadian rhythm in the motor cortex (Figure 8) with peaks at 22:00, M4KO animals had ultradian activity with peaks at 6:00 and 18:00 (thus the same as in the CPu). Two-way ANOVA (F3,112 = 19.78, p < 0.0001) showed differences between Dmean (p < 0.0001), Nmean (p < 0.0001), and mesor (p < 0.0001). There was a correlation between locomotor activity and the number of M1 mAChRs in WT (r = 0.82, p = 0.05), while in KO animals, there was no correlation (r = 0.33, p = 0.52). Linear regression (see Figure 9) showed a slope of 0.41 in WT, which was significantly different from zero (F1,4 = 7.92, p = 0.05). In KO, the slope was 0.07, which was not significantly different from zero (F1,4 = 0.5, p = 0.52).
3.2.3 Density of M1 mAChRs in WT animals
The changes in the relative density of M1 mAChRs in the cortex and striatum, compared with the relative density of M4 mAChRs, are shown in Figure 6. The density of M1 mAChRs in M4 KO animals is taken from Figure 8 (WT animals). To unify this figure, individual values are not shown for M1 mAChRs.
3.3 Acetylcholinesterase activity
3.3.1 Caudate nucleus-putamen
WT animals had a circadian rhythm with a peak at 6:00, and M4KO animals had ultradian activity (Figure 10) with peaks at 6:00 and 14:00. Two-way ANOVA (F3,40 = 0.13, p = 0.94) did not find any differences between WT and M4KO animals.
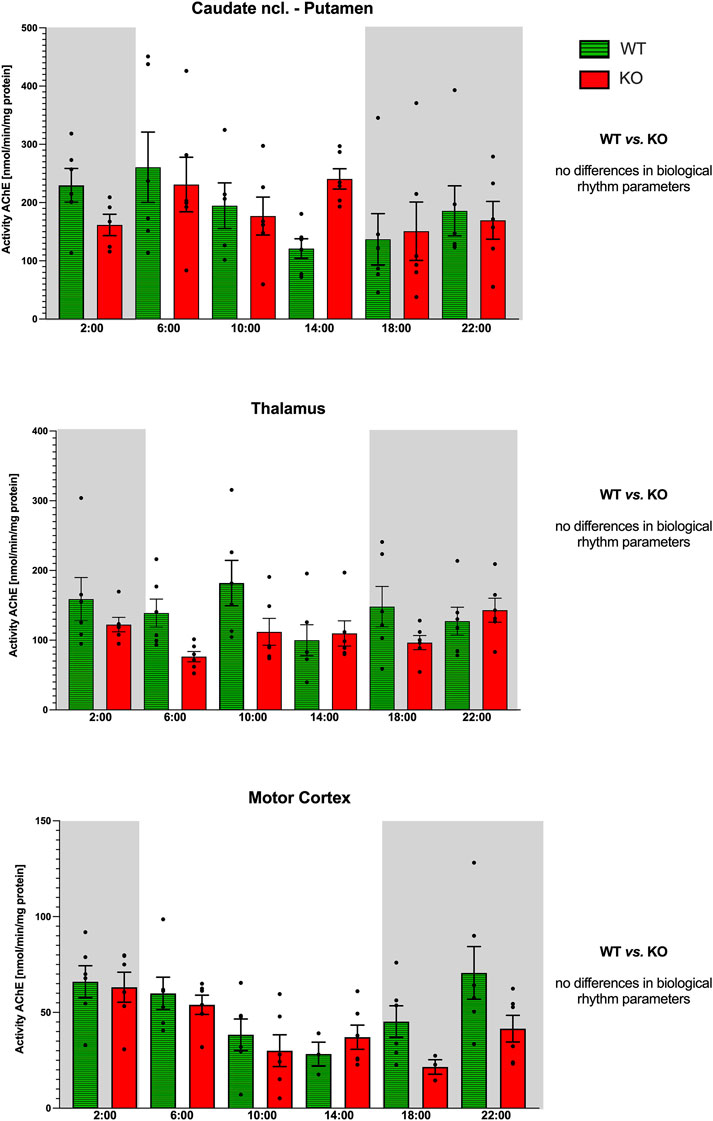
Figure 10. Activity of AChE (ordinate, expressed as nmol/min/mg protein) in the striatum (top), thalamus (middle), and motor cortex (bottom). Abscissa: time [h] and genotype. Grey rectangles represent the dark phase (lights off at 18:00 and lights on at 6:00). Data are expressed as the mean ± SEM. Two-way ANOVA: interaction between the genotype and biological rhythm parameters was not significant: F3,40 = 0.14, p = 0.94 (striatum), F3,40 = 1.21, p = 0.32 (thalamus), and F3,40 = 0.09, p = 0.96 (motor cortex). See legend for an explanation of symbols.
3.3.2 Thalamus
Both WT and M4KO animals revealed ultradian activity (Figure 10). While in WT animals the peaks appeared at 2:00, 10:00, and 18:00, in M4KO animals, there were two peaks (at 10:00 and 22:00). Two-way ANOVA (F3,40 = 1.21, p = 0.32) showed no differences between WT and M4KO animals.
3.3.3 Motor cortex
WT animals had a circadian rhythm with a peak at 22:00, and M4KO animals had ultradian activity (Figure 10) with peaks at 2:00 and 14:00. Two-way ANOVA (F3,40 = 0.09, p = 0.96) did not find any differences between WT and M4KO animals.
In all structures studied (caudate ncl-putamen, thalamus, and motor cortex), there were no correlations between AChE activity and locomotor activity in either WT or KO animals. In WT, the values were as follows: r = 0.04, p = 0.95; r = −0.11, p = 0.84; and r = 0.76, p = 0.08 in the caudate ncl-putamen, thalamus, and motor cortex, respectively. In KO animals, there were the following correlation coefficients: r = −0.59, p = 0.21; r = 0.72, p = 0.11; and r = 0.31, p = 0.54 in the caudate ncl-putamen, thalamus, and motor cortex, respectively. Similarly, linear regression showed non-significant values.
3.4 Butyrylcholinesterase activity
3.4.1 Caudate nucleus-putamen
WT animals had an ultradian rhythm with peaks at 2:00 and 10:00, and M4KO animals had a circadian rhythm with a peak at 2:00. Two-way ANOVA (F3,38 = 1.24, p = 0.32) was not significant (Figure 11).
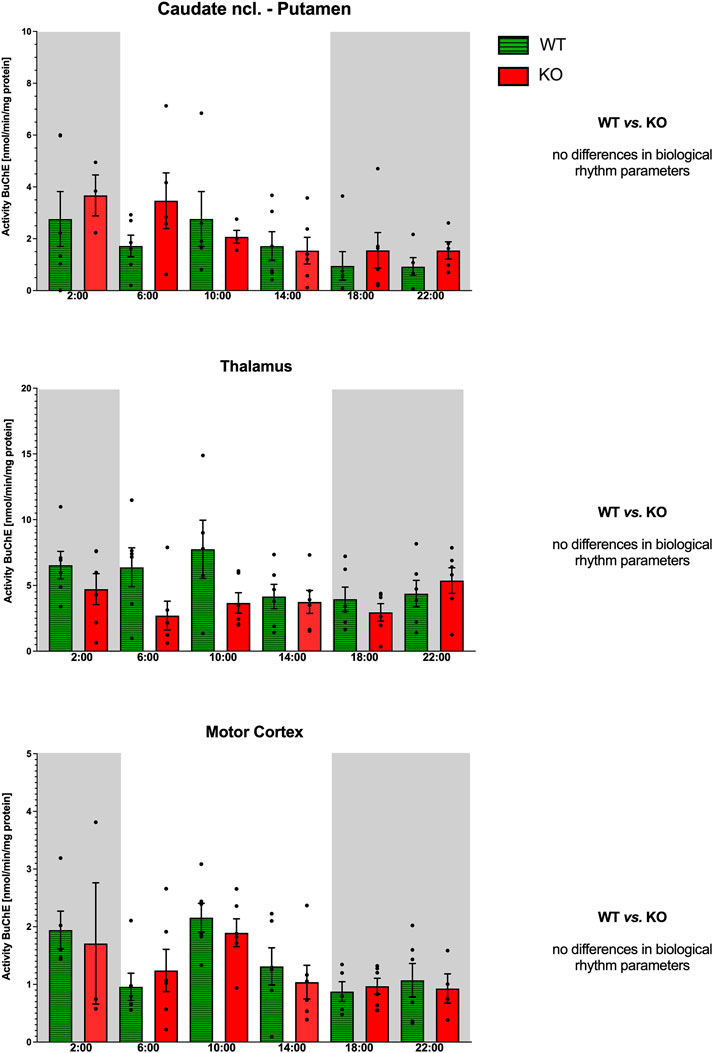
Figure 11. Activity of BuChE (ordinate, expressed as nmol/min/mg protein) in the striatum (top), thalamus (middle), and motor cortex (bottom). Abscissa: time [h] and genotype. Grey rectangles represent the dark phase (lights off at 18:00 and lights on at 6:00). Data are expressed as the mean ± SEM. Two-way ANOVA: interaction between the genotype and biological rhythm parameters was not significant: F3,38 = 1.21, p = 0.32 (striatum), F3,40 = 0.28, p = 0.84 (thalamus), and F3,40 = 0.05, p = 0.99 (motor cortex). See legend for an explanation of symbols.
3.4.2 Thalamus
Both WT and M4KO animals had ultradian rhythms (Figure 11) with peaks at 2:00 and 10:00 (WT) and 14:00 and 22:00 (M4KO). Two-way ANOVA (F3,40 = 0.28, p = 0.84) did not find any differences between WT and M4KO animals.
3.4.3 Motor cortex
Both WT and M4KO animals had ultradian rhythms (Figure 11) with peaks at 2:00 and 10:00. Two-way ANOVA (F3,40 = 0.05, p = 0.99) did not find any differences between WT and M4KO animals.
In all structures studied (caudate ncl-putamen, thalamus, and motor cortex), there were no correlations between BuChE activity and locomotor activity in either WT or KO animals. In WT, the values were as follows: r = −0.48, p = 0.19; r = −0.61, p = 0.34; and r = −0.46, p = 0.36 in the CPu, thalamus, and motor cortex, respectively. In KO animals, there were the following correlation coefficients: r = 0.08, p = 0.88; r = 0.59, p = 0.22; and r = −0.35, p = 0.50 in the CPu, thalamus, and motor cortex, respectively. Similarly, linear regression showed non-significant values.
4 Discussion
In this study, we show, to the best of our knowledge, the presence of biological rhythms of mAChRs and cholinesterases in brain areas specific to the regulation of locomotor activity in a cyclic manner. To our knowledge, the biological rhythms of mAChRs and cholinesterases have not been described in the SCN, IgL, SPVZ, PHA, and thalamus. We believe that this is also the first report on the role of different brain areas in the mAChRs-directed biological rhythm of locomotor activity. Generally, it is also necessary to mention that we described the biological rhythm using time points (tissue was collected every 4 h). This is a compromise between animal consumption and the need to obtain as many points as possible. As mentioned, Cosinor analysis is unsuitable as it could produce a bias. When we have tentatively performed MATLAB cubic spline interpolation, the results were mostly consistent with the conclusions we report in our manuscript. Therefore, we limited our conclusions to stating whether the rhythm is clearly circadian in nature or whether its frequency is higher, and then we referred to this finding as an ultradian rhythm.
We found that mAChRs peaks in control animals are mostly present in the dark (active) phases (i.e., in the SCN, PHA, thalamus, CPu, and motor cortex) or shortly after the end of the dark phase (IgL). The only structure having a peak in the light (inactive) phase was SPVZ. In addition to that, M1 mAChRs had a peak in the dark phase, both in the CPu and motor cortex. This agrees with studies and reviews on mAChRs in the striatum or forebrain (Wirz-Justice et al., 1981; Kafka et al., 1983; Wirz-Justice, 1987) in rats, although these authors also identified an additional peak in the light phase. Similarly, the circadian rhythmicity of mAChRs was detected in the hypothalamus in the study by Por and Bondy (1981) in rats, although they did not find circadian rhythmicity in the cerebral cortex, striatum, or cerebellum. Biological rhythms in mAChRs (with a peak in the subjective night, i.e., in the active period) were found in the olfactory bulb, parietal cortex, and caudate ncl-putamen (Kafka et al., 1986). This study also found no rhythms in the frontal or occipital cortex, nucleus accumbens, hippocampus, thalamus–septum, pons–medulla, or cerebellum. When we compared the total mAChR density in the CPu and ncl. accumbens, we found lower densities in the ncl. accumbens with ultradian rhythm. The densities of M1 mAChRs were comparable in the caudate ncl-putamen and ncl. accumbens, the biological rhythm was ultradian in WT and circadian in KO. No correlation was found between locomotor activity and the total/M1 mAChRs number. The biological rhythm in mAChR density was not found in the rat forebrain and brainstem (Mash et al., 1985). Completely different results were reported by Hut and Van der Zee (2011): while most brain areas showed mAChRs peak during the inactive phase (Marquez et al., 1990), they observed the peak of mAChRs in rats during the non-active period. In Syrian hamsters (Bina et al., 1998), no detectable rhythm was found in the anterior hypothalamus (including the SCN). The differences could probably be attributed to the early studies employing membrane binding, while we have used autoradiography, which is generally more suitable for central nervous system studies. Thus, to the best of our knowledge, the presence of an mAChR biological rhythm in the SCN is a novel finding. Earlier (Valuskova et al., 2018b), we characterized mAChR density in the SCN as low and found no differences between WT and KO animals. This very low density could also result in the finding of rhythm absence in this brain structure, as described earlier (Bina et al., 1998).
The biological rhythm detection of M1 mAChRs also represents new findings. However, it has been suggested that M1 mAChRs play a role in the biological rhythm of spontaneous nervous activity in the SCN (Gillette et al., 2001) in the night phase of rats. McN-A-343 caused a phase advance shift (Basu et al., 2016). In this study, the authors declare that McN-A-343 is an M1/M4 agonist, but it tends to act as a positive allosteric ligand and exhibits an order of effect: M4>M3>M2>M1>M5 (Myslivecek, 2022). At the concentration used (79 mM, i.e., 10−4.1 mol/L), it can activate all mAChRs, but it is reasonable to assume that M4 and M3 are fully activated, while other subtypes are activated by approximately 50%. Similarly, McN-A-343 caused an SCN phase shift in the subjective night that was blocked by pirenzepine, suggesting the involvement of M1 mAChRs (Liu and Gillette, 1996). However, McN-A-343 is not an M1 mAChR-selective ligand and neither is pirenzepine at the concentrations used in this study. Here, we demonstrated the circadian rhythm of M1 mAChRs in the CPu and motor cortex that was changed to ultradian in KO animals. Importantly, we have shown that in both the CPu and motor cortex, there was a strong correlation between locomotor activity and the number of M1 mAChRs in WT but not in KO animals. These results show the interplay between M1 and M4 mAChRs in the CPu and motor cortex. Deletion of M4 mAChRs disrupts the influence of M1 mAChRs on locomotor activity biological rhythm, suggesting the major role of M4 mAChRs in the locomotor activity biological rhythm. The role of M4 mAChR is, as described earlier (Valuskova et al., 2018b), inhibitory. In mAChR KO animals, it has been shown (Oki et al., 2005) that the deletion of one mAChR subtype is compensated for by changes in other subtypes. This could also be a possibility of no correlation between locomotor activity and the number of M1 mAChRs in KO animals. Taken together, we can assume the role of M4 mAChRs in muscarinic receptor-directed locomotor activity biological rhythm as major, with the role of M1 mAChRs being secondary.
The representation of relative density (Figure 6) showed parallel changes in M1 and M4 mAChRs in the motor cortex. However, in the CPu, the changes in M1 and M4 mAChR density did not occur in parallel. In other structures (SCN, SPVZ, PHA, and thalamus), the subtraction revealed negative values for M4 mAChRs, suggesting the involvement of another muscarinic subtype (compensatory increase) in the biological rhythm regulation when M4 mAChRs are deleted. As verified by VU6013720 (a truly selective M4 mAChR antagonist), binding in M4 KO animals represents the binding to other muscarinic receptors than M4 mAChRs. Thus, when deletion of M4 mAChRs (there is no binding to M4 mAChRs in M4 KO animals, as verified by VU6013720) led to a decrease in binding, there must be other subtype(s) that are compensatorily increased in M4 KO, leading to a negative result of subtraction: mAChRs densityWT − mAChRs densityKO.
The biological rhythm of AChE is in partial agreement with the study of plasma AChE activity in female rats (Alves-Amaral et al., 2010), where the peak was also evident at 8:00 p.m. (12 h/12 h regime, lights on at 6:00 a.m.) and another peak at 6:00 a.m. We have found the peak at 22:00 in the motor cortex and 6:00 in the CPu. It should be stressed that this is a comparison of plasma (Alves-Amaral et al., 2010) and central nervous system activities (our data), and thus, this partial agreement is quite interesting. The review (Hut and Van der Zee, 2011) concluded that acetylcholinesterase activity had its peak in the inactive phase. On the other hand, differences in amplitude and phase relationships among the markers have been reported between brain regions and strains. We found a peak in AChE activity in the inactive phase in the thalamus, while in the CPu and motor cortex, AChE activity peaked in the active phase. The thalamus revealed an ultradian rhythm, while the motor cortex and CPu revealed a circadian rhythm. Knocking out M4 mAChRs shifted the rhythm to ultradian. In the mouse brain stem reticular formation, there was a significant ultradian rhythm of AChE activity (Lewandowski, 1988). Our analysis did not show any correlation between AChE activity and locomotor activity. We can thus conclude that AChE is not essential for locomotor activity biological rhythms in the specific brain areas studied.
The biological rhythm detection of BuChE activity in the central nervous system is a new finding. The function of BuChE is still a matter of debate (Zhe Ying et al., 2020). BuChE has lower acetylcholine catalytic efficiency. Initial studies on butyrylcholinesterase showed that the inhibition of the enzyme led to an increase in brain acetylcholine levels. Later, BuChE has been shown to change the amount of amyloid-beta (for review, see Zhe Ying et al. (2020)). It has also been shown that BuChE plays a role in the stress reaction in the CNS (Valuskova et al., 2017).
Previously, BuChE activity was studied in rat plasma (Alves-Amaral et al., 2010), which found an ultradian rhythm with peaks at 8:00 a.m. and 8:00 p.m. Our results in the CNS also showed an ultradian rhythm of BuChE activities in the CPu and motor cortex, with peaks at 2:00 a.m. and 10:00 a.m., while in the thalamus, there was a circadian rhythm with a peak at 10:00 a.m. Knocking out M4 mAChRs changed the rhythm (see Figure 11). Our analysis did not show any correlation between BuChE activity and locomotor activity. We can thus conclude that BuChE is not essential for locomotor activity biological rhythm in specific brain areas studied.
Our results are also in agreement with the finding that SCN muscarinic receptors are involved in circadian clock regulation (Yang et al., 2010). These authors used an electrophysiological experiment with McN-A-343 (declared as an M1/M4 agonist (see also above) and blocked by the M4 antagonist: MT3 toxin). As mentioned above, carbachol caused a phase shift in locomotor activity. In addition to this, carbachol could cause a non-photic phase shift when injected into the IgL (Cain et al., 2007). LY2033298 (Gannon and Millan, 2012), a positive allosteric modulator at muscarinic M4 receptors, enhances inhibition when applied together with intraperitoneally applied oxotremorine (nonselective muscarinic agonist) on light-induced phase shifts in hamster circadian activity rhythms. However, it is necessary to stress that LY2033298 also binds with similar affinity to M2 muscarinic receptors (Myslivecek, 2022). Our results show that the deletion of M4 mAChRs leads to a strong correlation between the number of mAChRs and locomotor activity, suggesting a suppressive role of M4 mAChRs in the regulation of locomotor activity biological rhythm in the SCN.
Considering the projections between structures involved in locomotor activity biological rhythm (see also Table 1), it is possible to summarize (see Figure 12) that the SCN, under the influence of photosensitive cells in the retina, produces ultradian rhythms of the total number of mAChRs present in this brain area. This rhythm is changed to circadian in the IgL, which is influenced by the collateral fibers from the retinohypothalamic tract and receives additional input from the SCN (see Introduction for more details). Vice versa, the IgL sends significant efferents to the SCN. In both the SCN and IgL, deleting M4 mAChRs leads to a strong positive correlation between the number of mAChRs and locomotor activity, suggesting a suppressive role of M4 mAChRs in regulating locomotor activity biological rhythm.
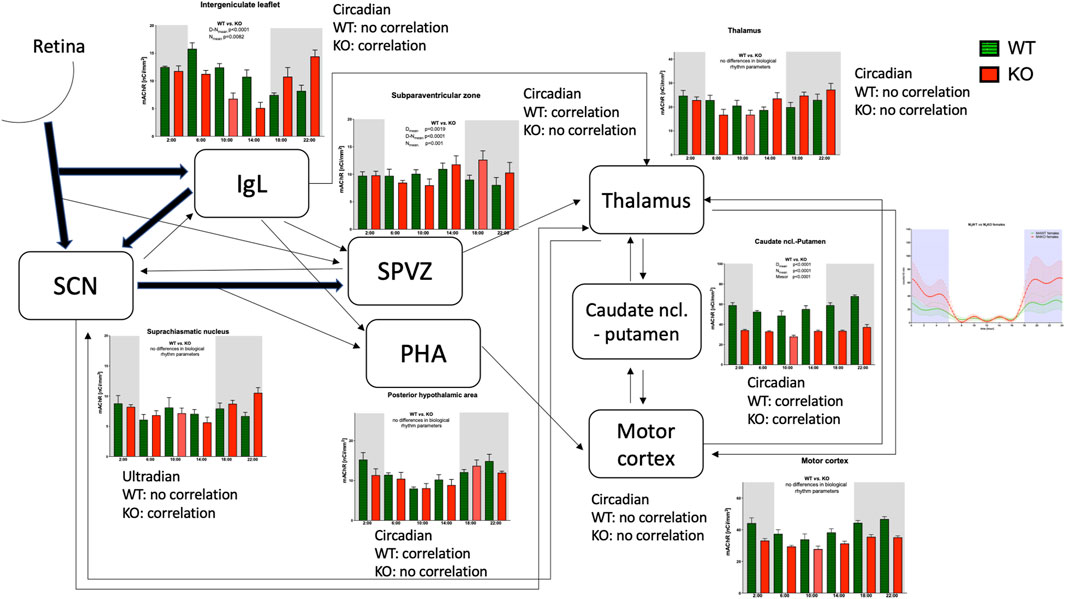
Figure 12. Schematic diagram showing the connections between brain areas with the biological rhythm of the total number of muscarinic receptors. The line thickness shows the strength of the connection. The correlation between receptor density and locomotor activity is shown by word correlation/no correlation. The locomotor output was taken from our previous work (Valuskova et al., 2018b).
In other hypothalamic structures, the SPVZ and PHA, the biological rhythm of the total number of mAChRs remains circadian. Contrary to IgL, in these structures, the biological rhythm of mAChRs revealed a strong correlation with locomotor activity in WT (it was a negative correlation in SPVZ and a positive correlation in PHA), and this correlation disappeared in KO animals. The SPVZ receives inputs from the SCN, IgL, and collateral fibers from the retinohypothalamic tract. The PHA receives collaterals from the connection between the SCN and SPVZ; the IgL and SPVZ send efferent fibers to the thalamus and the PHA to the motor cortex.
Both in the thalamus and motor cortex, the circadian rhythm in mAChRs can be found. In addition to that, the SCN reciprocally communicates with the thalamus. Other connections exist between the CPu, thalamus, and motor cortex. The CPu seems to be the key structure in motor activity biological rhythm as there is an evident decrease in the total number of mAChRs showing circadian rhythm in M4KO animals, which almost copies the biological rhythm in WT animals. Moreover, this is the only structure in which a correlation was found the correlation between the biological rhythm of total mAChRs and the activity biological rhythm in WT and KO. In WT, there was also a correlation between the biological rhythm of M1 mAChRs number and the biological rhythm of locomotor activity.
Other molecules involved in cholinergic transmission (AChE and BuChE) play minor, auxiliary, or no roles in the determination of locomotor activity biological rhythm.
Generally, the changes in the biological rhythm parameters in specific structures are lower than twofold (see Table 2). However, one should consider that the final output—locomotor activity—reveals biological rhythm parameters (Valuskova et al., 2018b) that are nearly doubled: the mesor increased from 16.06 to 30.7 (i.e., 1.91 times), the night mean increased from 25.58 to 54.26 (i.e., 2.12 times), and the night–day mean increased from 18.64 to 47.14 (i.e., 2.52 times). Thus, it is not surprising that changes in the receptor number are slightly lower than the resulting change in locomotor activity. We can thus view the changes in locomotor activity as a result of additive effects of receptor changes.
In conclusion, we revealed the sequence of changes in brain areas involved in mAChR regulation of locomotor activity.
We describe here the sequence of changes in specific brain areas leading to increased locomotor activity in M4 KO female mice during their dark phase. Initially, the ultradian rhythm of muscarinic receptors in the suprachiasmatic nucleus is changed to circadian in the intergeniculate leaflet, subparaventricular zone, and posterior hypothalamic area, revealing different phase shifts in these brain structures. Subsequently, the CPu, thalamus, and motor cortex, with a major role of the CPu, transform this rhythm to increased locomotor activity in mice. The main role in the muscarinic receptor-directed biological rhythm of activity is played by striatal M4 muscarinic receptors, with a contribution of M1 muscarinic receptors. Cholinesterases play a minor or no role in this regulation. These are new findings describing the role of muscarinic receptors in the regulation of locomotor activity.
Data availability statement
The raw data supporting the conclusions of this article will be made available by the authors, without undue reservation.
Ethics statement
The animal study was approved by the Committee for the Protection of Experimental Animals of the First Medical Faculty, Charles University, Prague, and by the Ministry of Education of the Czech Republic under no MSMT-2409/2017-3 and MSMT-5939/2022-4. The study was conducted in accordance with the local legislation and institutional requirements.
Author contributions
KJ: Investigation, Writing – original draft, Writing – review and editing, Formal analysis, Data curation. MU: Data curation, Investigation, Writing – review and editing, Formal analysis, Writing – original draft. SF: Visualization, Writing – review and editing, Writing – original draft. JM: Validation, Conceptualization, Supervision, Formal analysis, Writing – original draft, Writing – review and editing, Funding acquisition.
Funding
The authors declare that financial support was received for the research and/or publication of this article. This research was funded by the Program “Cooperatio” in Pharmaceutical Sciences from Charles University.
Acknowledgements
The authors would like to thank Eleanor Lurring, M.A., for her language corrections to our text.
Conflict of interest
The authors declare that the research was performed in the absence of any commercial or financial relationships that may be construed as a potential conflict of interest.
Generative AI statement
The authors declare that no Generative AI was used in the creation of this manuscript.
Any alternative text (alt text) provided alongside figures in this article has been generated by Frontiers with the support of artificial intelligence and reasonable efforts have been made to ensure accuracy, including review by the authors wherever possible. If you identify any issues, please contact us.
Publisher’s note
All claims expressed in this article are solely those of the authors and do not necessarily represent those of their affiliated organizations, or those of the publisher, the editors and the reviewers. Any product that may be evaluated in this article, or claim that may be made by its manufacturer, is not guaranteed or endorsed by the publisher.
Supplementary material
The Supplementary Material for this article can be found online at: https://www.frontiersin.org/articles/10.3389/fphar.2025.1691118/full#supplementary-material
Abbreviations
AchE, acetylcholinesterase; BuChE, butyrylcholinesterase; CPu, caudate ncl-putamen; Dmean, day mean; IgL, intergeniculate leaflet; M4KO, M4 knockout animals; mAChRs, muscarinic receptors; mesor, midline value of biological rhythm; N–Dmean, difference between night and day mean; Nmean, night mean; PHA, posterior hypothalamic area; SCN, suprachiasmatic nucleus; SPVZ, subparaventricular zone; WT, wild-type animals.
References
Abrahamson, E. E., and Moore, R. Y. (2006). Lesions of suprachiasmatic nucleus efferents selectively affect rest-activity rhythm. Mol. Cell. Endocrinol. 252, 46–56. doi:10.1016/j.mce.2006.03.036
Alves-Amaral, G., Pires-Oliveira, M., Andrade-Lopes, A. L., Chiavegatti, T., and Godinho, R. O. (2010). Gender-related differences in circadian rhythm of rat plasma acetyl- and butyrylcholinesterase: effects of sex hormone withdrawal. Chemico-Biological Interact. 186, 9–15. doi:10.1016/j.cbi.2010.04.002
Basu, P., Wensel, A. L., Mckibbon, R., Lefebvre, N., and Antle, M. C. (2016). Activation of M1/4 receptors phase advances the hamster circadian clock during the day. Neurosci. Lett. 621, 22–27. doi:10.1016/j.neulet.2016.04.012
Bina, K. G., Rusak, B., and Wilkinson, M. (1998). Daily variation of muscarinic receptors in visual cortex but not suprachiasmatic nucleus of Syrian hamsters. Brain Res. 797, 143–153. doi:10.1016/s0006-8993(98)00374-6
Buchanan, G. F., and Gillette, M. U. (2005). New light on an old paradox: site-dependent effects of carbachol on circadian rhythms. Exp. Neurol. 193, 489–496. doi:10.1016/j.expneurol.2005.01.008
Cain, S. W., Verwey, M., Szybowska, M., Ralph, M. R., and Yeomans, J. S. (2007). Carbachol injections into the intergeniculate leaflet induce nonphotic phase shifts. Brain Res. 1177, 59–65. doi:10.1016/j.brainres.2007.07.048
Edelstein, K., and Amir, S. (1996). Constant light induces persistent Fos expression in rat intergeniculate leaflet. Brain Res. 731, 221–225. doi:10.1016/0006-8993(96)00691-9
Farar, V., Mohr, F., Legrand, M., Lamotte D'incamps, B., Cendelin, J., Leroy, J., et al. (2012). Near-complete adaptation of the PRiMA knockout to the lack of central acetylcholinesterase. J. Neurochem. 122, 1065–1080. doi:10.1111/j.1471-4159.2012.07856.x
Gannon, R. L., and Millan, M. J. (2012). LY2033298, a positive allosteric modulator at muscarinic M₄ receptors, enhances inhibition by oxotremorine of light-induced phase shifts in hamster circadian activity rhythms. Psychopharmacology 224, 231–240. doi:10.1007/s00213-012-2743-8
Gillette, M. U., Buchanan, G. F., Artinian, L., Hamilton, S. E., Nathanson, N. M., and Liu, C. (2001). Role of the M1 receptor in regulating circadian rhythms. Life Sci. 68, 2467–2472. doi:10.1016/s0024-3205(01)01040-2
Gomeza, J., Zhang, L., Kostenis, E., Felder, C., Bymaster, F., Brodkin, J., et al. (1999). Enhancement of D1 dopamine receptor-mediated locomotor stimulation in M4 muscarinic acetylcholine receptor knockout mice. Proc. Natl. Acad. Sci. 96, 10483–10488. doi:10.1073/pnas.96.18.10483
Hut, R. A., and Van Der Zee, E. A. (2011). The cholinergic system, circadian rhythmicity, and time memory. Behav. Brain Res. 221, 466–480. doi:10.1016/j.bbr.2010.11.039
Kafka, M. S., Wirz-Justice, A., Naber, D., Moore, R. Y., and Benedito, M. A. (1983). Circadian rhythms in rat brain neurotransmitter receptors. Fed. Proc. 42, 2796–2801.
Kafka, M. S., Benedito, M. A., Blendy, J. A., and Tokola, N. S. (1986). Circadian rhythms in neurotransmitter receptors in discrete rat brain regions. Chronobiol Int. 3, 91–100. doi:10.3109/07420528609066353
Krout, K. E., Kawano, J., Mettenleiter, T. C., and Loewy, A. D. (2002). CNS inputs to the suprachiasmatic nucleus of the rat. Neuroscience 110, 73–92. doi:10.1016/s0306-4522(01)00551-6
Lewandowski, M. H. (1988). Seasonal variations in the circadian activity of AChE in the brain stem reticular formation of mice under normal and constant light regimens. Chronobiology International 5 (2), 121–125. doi:10.3109/07420528809079552
Liu, C., and Gillette, M. (1996). Cholinergic regulation of the suprachiasmatic nucleus circadian rhythm via a muscarinic mechanism at night. J. Neurosci. 16, 744–751. doi:10.1523/JNEUROSCI.16-02-00744.1996
Marquez, E., Pavia, J., Laukonnen, S., Martos, F., Gomez, A., Rius, F., et al. (1990). Circadian rhythm in muscarinic receptor subtypes in rat forebrain. Chronobiol Int. 7, 277–282. doi:10.1080/07420529009064633
Mash, D. C., Flynn, D. D., Kalinoski, L., and Potter, L. T. (1985). Circadian variations in radioligand binding to muscarine receptors in rat brain dependent upon endogenous agonist occupation. Brain Res. 331, 35–38. doi:10.1016/0006-8993(85)90712-7
Moehle, M. S., Bender, A. M., Dickerson, J. W., Foster, D. J., Qi, A., Cho, H. P., et al. (2021). Discovery of the first selective M4 muscarinic acetylcholine receptor antagonists with in vivo antiparkinsonian and antidystonic efficacy. ACS Pharmacol. and Transl. Sci. 4, 1306–1321. doi:10.1021/acsptsci.0c00162
Moga, M. M., Weis, R. P., and Moore, R. Y. (1995). Efferent projections of the paraventricular thalamic nucleus in the rat. J. Comp. Neurology 359, 221–238. doi:10.1002/cne.903590204
Moore, R. Y. (1996). “Chapter 8 entrainment pathways and the functional organization of the circadian system,” in Progress in brain research. Editors R. M. Buijs, A. Kalsbeek, H. J. Romijn, C. M. A. Pennartz, and M. Mirmiran (Elsevier), 103–119.
Morin, L. P. (2013). Neuroanatomy of the extended circadian rhythm system. Exp. Neurol. 243, 4–20. doi:10.1016/j.expneurol.2012.06.026
Morin, L. P., and Allen, C. N. (2006). The circadian visual system, 2005. Brain Res. Rev. 51, 1–60. doi:10.1016/j.brainresrev.2005.08.003
Myslivecek, J. (2022). Multitargeting nature of muscarinic orthosteric agonists and antagonists. Front. Physiol. 13, 974160. doi:10.3389/fphys.2022.974160
Oki, T., Takagi, Y., Inagaki, S., Taketo, M. M., Manabe, T., Matsui, M., et al. (2005). Quantitative analysis of binding parameters of [3H]N-methylscopolamine in central nervous system of muscarinic acetylcholine receptor knockout mice. Brain Res. Mol. Brain Res. 133, 6–11. doi:10.1016/j.molbrainres.2004.09.012
Perry, E. K., Perry, R. H., and Tomlinson, B. E. (1977). Circadian variations in cholinergic enzymes and muscarinic receptor binding in human cerebral cortex. Neurosci. Lett. 4, 185–189. doi:10.1016/0304-3940(77)90136-7
Por, S., and Bondy, S. (1981). Regional circadian variation of acetylcholine muscarinic receptors in the rat brain. J. Neuroscience Research 6, 315–318. doi:10.1002/jnr.490060306
Qi, A., Kling, H. E., Billard, N., Rodriguez, A. L., Peng, L., Dickerson, J. W., et al. (2023). Development of a selective and high affinity Radioligand, [(3)H]VU6013720, for the M(4) muscarinic receptor. Mol. Pharmacol. 104, 195–202. doi:10.1124/molpharm.122.000643
Riljak, V., Janisova, K., and Myslivecek, J. (2020). Lack of M(4) muscarinic receptors in the striatum, thalamus and intergeniculate leaflet alters the biological rhythm of locomotor activity in mice. Brain Struct. Funct. 225, 1615–1629. doi:10.1007/s00429-020-02082-x
Valuskova, P., Farar, V., Janisova, K., Ondicova, K., Mravec, B., Kvetnansky, R., et al. (2017). Brain region-specific effects of immobilization stress on cholinesterases in mice. Stress 20, 36–43. doi:10.1080/10253890.2016.1263836
Valuskova, P., Farar, V., Forczek, S., Krizova, I., and Myslivecek, J. (2018a). Autoradiography of (3)H-pirenzepine and (3)H-AFDX-384 in mouse brain regions: possible insights into M(1), M(2), and M(4) muscarinic receptors distribution. Front. Pharmacol. 9, 124. doi:10.3389/fphar.2018.00124
Valuskova, P., Forczek, S. T., Farar, V., and Myslivecek, J. (2018b). The deletion of M(4) muscarinic receptors increases motor activity in females in the dark phase. Brain Behav. 8, e01057. doi:10.1002/brb3.1057
Valuskova, P., Riljak, V., Forczek, S. T., Farar, V., and Myslivecek, J. (2019). Variability in the drug response of M4 muscarinic receptor knockout mice during day and night time. Front. Pharmacol. 10, 237. doi:10.3389/fphar.2019.00237
Vujovic, N., Gooley, J. J., Jhou, T. C., and Saper, C. B. (2015). Projections from the subparaventricular zone define four channels of output from the circadian timing system. J. Comp. Neurology 523, 2714–2737. doi:10.1002/cne.23812
Watts, A. G., and Swanson, L. W. (1987). Efferent projections of the suprachiasmatic nucleus: II. Studies using retrograde transport of fluorescent dyes and simultaneous peptide immunohistochemistry in the rat. J. Comp. Neurol. 258, 230–252. doi:10.1002/cne.902580205
Watts, A. G., Swanson, L. W., and Sanchez-Watts, G. (1987). Efferent projections of the suprachiasmatic nucleus: I. Studies using anterograde transport of Phaseolus vulgaris leucoagglutinin in the rat. J. Comp. Neurol. 258, 204–229. doi:10.1002/cne.902580204
Wirz-Justice, A. (1987). Circadian rhythms in mammalian neurotransmitter receptors. Prog. Neurobiol. 29, 219–259. doi:10.1016/0301-0082(87)90022-0
Wirz-Justice, A., Tobler, I., Kafka, M. S., Naber, D., Marangos, P. J., Borbély, A. A., et al. (1981). Sleep deprivation: effects on circadian rhythms of rat brain neurotransmitter receptors. Psychiatry Res. 5, 67–76. doi:10.1016/0165-1781(81)90062-7
Yang, J.-J., Wang, Y.-T., Cheng, P.-C., Kuo, Y.-J., and Huang, R.-C. (2010). Cholinergic modulation of neuronal excitability in the rat suprachiasmatic nucleus. J. Neurophysiol. 103, 1397–1409. doi:10.1152/jn.00877.2009
Keywords: M1 muscarinic receptors, M4 muscarinic receptors, cholinesterases, biological rhythm, intergeniculate leaflet, subparaventricular zone, suprachiasmatic nucleus
Citation: Janisova K, Uhlirova M, Forczek S and Myslivecek J (2025) Striatal M4 muscarinic receptors determine the biological rhythm of activity, with a supportive role of M1 muscarinic receptors. Front. Pharmacol. 16:1691118. doi: 10.3389/fphar.2025.1691118
Received: 22 August 2025; Accepted: 05 November 2025;
Published: 01 December 2025.
Edited by:
Ralf Weiskirchen, RWTH Aachen University, GermanyReviewed by:
Clémentine Bosch-Bouju, Institut Polytechnique de Bordeaux, FrancePaul Rafael Sabandal, The University of Texas at El Paso, United States
Copyright © 2025 Janisova, Uhlirova, Forczek and Myslivecek. This is an open-access article distributed under the terms of the Creative Commons Attribution License (CC BY). The use, distribution or reproduction in other forums is permitted, provided the original author(s) and the copyright owner(s) are credited and that the original publication in this journal is cited, in accordance with accepted academic practice. No use, distribution or reproduction is permitted which does not comply with these terms.
*Correspondence: Jaromir Myslivecek, am15c0BsZjEuY3VuaS5jeg==