 Uduak Z. George
 Ramana M. Pidaparti
- 1Department of Mathematics and Statistics, Computational Science Research Center, Viral Information Institute, San Diego State University, San Diego, CA, United States
- 2College of Engineering, University of Georgia, Athens, GA, United States
Motile cilia reside on the surface of the epithelial layer of the lungs and facilitates the clearance of mucus in the airways. Bordering the epithelial layer and surrounding cilia is the periciliary liquid (PCL) that lubricates the epithelial layer. In the present work, we propose a novel approach to study how changes in biomechanics affect the physiological functioning of cilia in healthy subjects and in patients with CF, COPD, and primary ciliary dyskinesia (PCD). In particular, we investigate the response of cilia to different local pressure gradient during gaseous exchange. We hypothesize that the airway pressure gradient that occur during inhalation and exhalation may displace mucus and PCL and exert pressure on cilia. Therefore, cilia must be able to withstand the forces created by the airway pressure gradient, otherwise the magnitude of its efficient strokes and its rate of mucociliary clearance would decrease. We develop a computational model of the airways to quantify the effect of airway pressure gradient on cilia dynamics. In the model, cilia are represented as elastic solids, PCL and mucus is represented as fluids with different viscosities. The simulation results show that in diseases such as PCD, where there exist changes in ciliary structure, the airway pressure gradient may affect the propulsive stroke of cilia and decrease the rate of mucociliary clearance. Simulation results predict that the average stress experienced by cilia varies exponentially with the number of cilia shed from CF and COPD airways.
Introduction
Mucus clearance in the airways is regulated by carpets of cilia that project out of the epithelial layer. Each cell of the epithelium contains about 200 cilia that beat in a coordinated fashion with each performing about 11.5 beating cycles per second in adults and 13 beats/s in young children [1–3], and the estimated number of cilia in an adult lung is about 3 × 10¹² cilia [4]. Bordering the epithelial layer and surrounding the cilia is the periciliary liquid (PCL) that lubricates the epithelial layer. The mucus layer is sandwiched between the PCL and the air in the core airways. The PCL and mucus layer are also referred to as the airway surface liquid (ASL) [5]. PCL facilitates mucus clearance by providing a favorable environment and lubrication for the beating cilia [6]. Mucus serves as a primary defense mechanism by trapping inhaled infectious and toxic agents.
The beat of cilia is forceful in the forward propulsive (“power”) stroke but slower in the recovery stroke [7]. Cilia extends into the mucus when taking its forward stroke but retracts from the mucus during its recovery stroke, moving closer to the epithelial wall [8]. The force generated by the beating cilia propels mucus toward the trachea and out from the lungs at about 1–2 mm/h, depending on parameters such as ciliary length and beat frequency [6, 7, 9]. The impairment of mucus clearance in diseases such as cystic fibrosis (CF), chronic obstructive pulmonary disease (COPD) and asthma is often devastating and may result in inflammation and infection in the airways [10–12]. Patients with obstructive lung disease have considerable decrease in tracheal mucus velocity compared to normal subjects [13] and mucus velocity in symptomatic patients is significantly reduced [14]. Tracheal mucus velocity in stable patients with mild asthma is significantly reduced compared to non-asthmatic subjects [15].
Understanding the conditions required for successful mucociliary clearance is key to understanding the pathology of airway diseases and developing therapeutic strategies for combating such diseases [16]. The structure of cilia is known to affect its functioning, for example, people born with certain abnormal ciliary structure may have reduced mucociliary transport efficiency [3]. Permanent changes in ciliary structure and function results in mucus retention and chronic infections [3, 17]. Changes in ciliary structure occur in diseases such as primary ciliary dyskinesia (PCD) [2, 18]. PCD (a congenital disorder) usually leads to immotile or dis-coordinated movement of cilia and impedes effective mucociliary clearance [18]. The prevalence of PCD is estimated to be around 1 in 10,000 or 20,000 individuals [3, 18].
Motile cilia are hair-like organelles found not only on the airway epithelial cells but also in various mammalian cells including sperm and pendymal cells that line brain vesicles [19, 20]. They are the earliest known cell organelles, discovered around 1647 by van Leeuwenhoek [9]. Motile cilia have a cytoskeleton that is composed of microtubules, arranged in a ring of nine doublet microtubules surrounding a central pair (9 + 2), with ciliary diameter of about 0.25 μm (Figures 1A,B) [3, 21]. The microtubule cytoskeleton of the cilium is called axoneme [21, 22]. Mammalian ciliary axonemes are formed with two major patterns: 9 + 2 and 9 + 0 (Figures 1A–C), in which the central pair is missing [21, 23, 24]. The 9 + 0 cilia (Figure 1C) also known as primary cilia are found on cells such as kidney tubules, neurons and fibroblast.
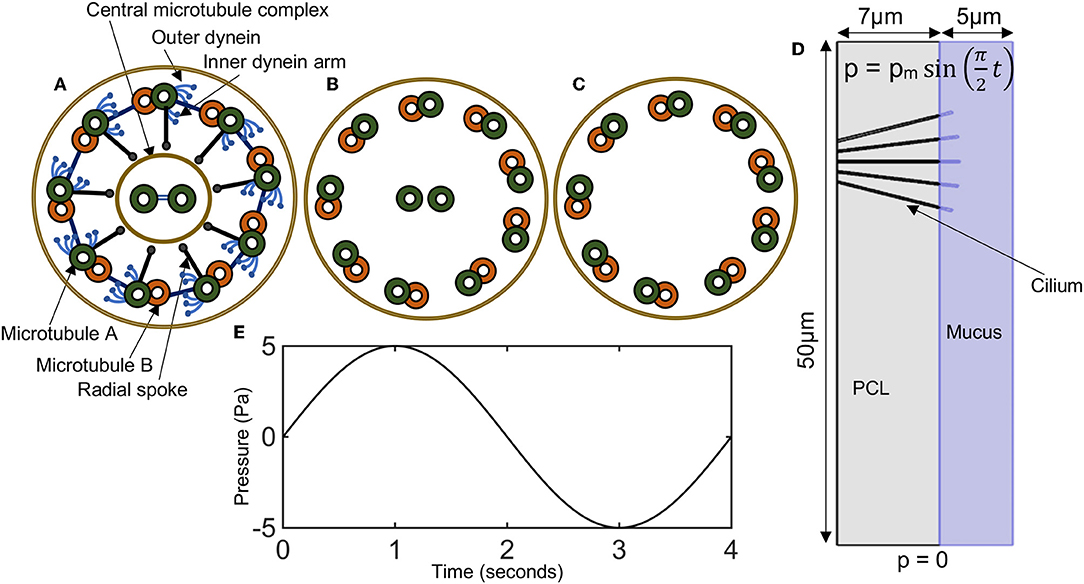
Figure 1. (A–C) Diagrammatic representation of ciliary cross sections. (A) Normal motile cilium (9+2), showing dynein arms, radial spokes, and microtubules. (B) A cross-sectional view of the positioning of microtubules in a normal cilium. (C) Primary cilium (9+0). (D) Model domain in representing a cross-section of a bronchi with five cilia. Periciliary liquid (gray), mucus (bluish-purple). Pressure conditions at the ends of the airways mimics the pressure gradient during inhalation and exhalation. (E) A plot of the time varying pressure , here pm = 5 Pa.
In 9 + 2 cilia (i.e., motile cilia), molecular motors called the outer and inner dynein arms attach to the microtubules and produce the force necessary for the doublet microtubules to slide with respect to one another and asynchronously around the axoneme, resulting in a helical beat (Figure 1A) [19, 21, 22, 25–27]. The inter-doublet links and the central pair further modifies the helical beat to produced synchronous cilia beating with an effective and recovery stroke (Figure 1A) [21].
Mechanical properties of motile cilium differ significantly from those of primary cilium because of their structural differences. Motile cilia are composed of more microtubules than primary cilia, in particular they have a central pair of microtubules that enhances their structural integrity [28]. These structural changes in motile cilia and primary cilium is reflected in the value of their Young modulus, calculated from the flexural rigidity. The flexural rigidity of cilium is a measure of the resistance offered by cilium while undergoing bending [29, 30].
PCD patients have ciliary structural appearance that fall between primary cilia and normal cilia. We speculate that airway ciliary structure that appear similar or close to those of primary cilia may have reduced structural integrity compared to normal motile cilia. Very few mathematical models have focused on understanding why mucociliary clearance fails in patients with primary ciliary dyskinesia [31]. In this paper, we investigate if changes in the biomechanical properties of cilia resulting from abnormal ciliary structure significantly affect cilia motion and functioning. Key components of the model are: the mucus layer, the PCL layer and cilia.
Modeling mucociliary clearance remains a challenging problem because of the complexity of the rheological properties of mucus. At the macroscale, mucus is a complex non-Newtonian biological fluid with variable rheological properties that are between those of a viscous liquid and an elastic solid, while at the nanoscale, mucus behaves like a low viscous fluid [32]. The rheological properties of mucus changes between different individuals and in diseases, and is dependent on shear stress and rate of shearing. When exposed to a low shear force, mucus exhibits elastic properties, it deforms and returns to its initial shape once the force is removed. However, when a high shear force is applied to mucus, it behaves like a viscous fluid and does not returns to its initial shape after the force is removed [32]. Mucus is composed of water (>90%), mucin fibers (2–5%), lipids, salts and other cellular components and products [33]. The viscoelasticity of mucus depends largely on the concentration of mucins [34].
The PCL is a viscous fluid with properties that are very dissimilar to mucus. It is usually modeled as a Newtonian fluid. In modeling the ASL, some studies focus on the PCL layer, the mucus layer or both [35–38]. Different modeling strategies have been devised by researchers working to capture the complex dynamics of mucociliary clearance. These models differ mainly in their description of the mucus behavior, some describe the mucus as a Newtonian fluid [35, 36, 39–41] while others describe it as a non-Newtonian fluid [37, 38, 42–45]. These different models have their perks but they also have limitations, great strides have been made toward modeling mucociliary clearance and it remains an active area of research.
Considering that mucus clearance occurs at low Reynolds number, Smith et al. [46] modeled the ASL as a Stokes fluid with cilia modeled as curved slender ellipsoidal bodies by distributing Stokeslet and potential source dipole singularities along their centerlines. Their model results showed that shear flow of the mucous layer drives a significant volume of periciliary liquid in the direction of mucus transport including during the recovery stroke of the cilia.
Lee et al. [36] developed a two-layer Newtonian fluid model of the mucus layer and PCL to simulate the mucociliary transport process and determine the factors that affect mucociliary transport. Their model showed that the cilia beat frequency, the number of cilia, and the depth of PCL are the critical factors affecting mucociliary transport.
Mitran [37] modeled the PCL as a Newtonian fluid and mucus as a non-Newtonian fluid. The PCL was described using the Stokes equation while mucus was described by a single-mode upper convected Maxwell equation. Their model simulated the formation of metachronal waves in rows of pulmonary cilia. Vasquez et al. [38] constructed a five-mode Giesekus non-linear viscoelastic constitutive law from micro- and macro-rheology experimental data on cell culture mucus. Their model was able to simulate the shape of air-mucus interface in human bronchial epithelial (HBE) culture.
A recent experimental study by Button et al. [6] indicates that the PCL consists of a mesh of large macromolecules including membrane-spanning mucins and mucopolysaccharides. The macromolecules are tethered to the cell surface and form a mesh that prevents mucus from penetrating the interciliary space. In line with this, Chatelin et al. [40] modeled the ASL as a non-homogeneous Newtonian fluid. However, they omitted a physical interface between the PCL and mucus layer. They represented the viscosity of the ASL as a function of its mucins' ratio that varies continuously from the viscosity of water in the PCL to a higher viscosity in the upper mucus layer [40]. Their model captures the inhomogeneity of mucin distribution. Development of new models that can correctly describes the ASL as reported by Button et al. [6] would enhance the study of mucociliary clearance.
Although a viscoelastic model is necessary to capture the complexity of mucus rheology, a study by Lubkin et al. [43] showed that Newtonian fluid models are able to capture some of the fundamental flow characteristic of mucus. In particular, they noted that the mucus velocity obtained from a Newtonian fluid model is only slightly larger than the mucus velocity from a non-Newtonian fluid model [36, 43].
As an initial model, we will consider the mucus and PCL layers as Newtonian fluids with constant viscosity and different viscosity values in each layer. In this study, we are primarily interested in investigating if the flow of ASL caused by changes in airway pressure gradient, produces sufficient force to bend cilia. The magnitude of bending would depend on the height/volume of mucus and the flow velocity of mucus, thus a Newtonian fluid model should be sufficient for the present study. In the future, we will improve on the model to capture the viscoelastic effects of mucus.
Most of the existing models have focused on describing mucociliary clearance by prescribing a function to capture the motion of cilia [36, 38, 46]. Emphasis is usually placed on factors inherent in the mucus and/or cilia including the effect of mucus viscosity, height of cilia, height of mucus and PCL layer, cilia beat frequency and the airway pressure gradient and other biomechanical parameters is usually not considered [40]. We believe that the pressure gradient that drive inhalation and exhalation, including particulate transport in the airway may affect the flow of ASL and should therefore be quantified to determine its effect on cilia dynamics and mucociliary clearance.
During gaseous exchange, the airway cilia and ASL are exposed to varied degree of forces, as a result of local pressure gradient. The pressure gradient varies along the airways. The highest values of local pressure gradient occurring at airway branching points [47]. Based on the study by Hill et al. [29] that showed that external forces imposed on cilia can affect it functioning, we propose that the forces generated from the local pressure gradient may affect cilia dynamics with greater effect occurring at airway branch points. These forces may in turn cause a reduction in cilia beat amplitude and decrease the rate of mucociliary clearance.
Our reasoning is further strengthened by the work from Farkas and Szöke [48]. Farkas and Szöke [48] studied air and mucus flow in a model of bronchial airway bifurcation, tracking inhaled particles with 1 and 10 μm aerodynamic diameters to determine deposition and clearance patterns. Their study revealed the existence of a slow clearance zone around the peak of the airway bifurcation that delayed the clearance of particles depositing or entering there [48]. We hypothesize that higher pressure forces acting on cilia may be a major contributing factor to the existence of a slow clearance zone at airway bifurcation points.
In the present work, we propose a novel approach to study how changes in biomechanical factors affect the physiological functioning of cilia in healthy subjects and in patients with CF, COPD, and primary ciliary dyskinesia. In particular, we investigate the response of cilia to different local pressure gradient during gaseous exchange. The simulation results show that the airway pressure gradient during inhalation and exhalation affect the effective stroke of cilia with greater effect occurring in PCD diseases where ciliary structure affect the biomechanical properties, compromising the structural integrity of cilia. Furthermore, results predict that the average stress experienced by cilia vary exponentially with the number of cilia shed from the airways during inflammation and infection in CF, COPD, and asthmatic patients.
We develop a computational model of the airways consisting of the mucus layer, PCL layer and cilia to investigate if changes in ciliary structure causes a significant increase in the bending of cilia during inhalation and exhalation. The mathematical techniques used in designing the airway model is presented in the next section.
Materials and Methods
The model investigates the resilience of cilia to bending during exposure to normal cyclic pressure gradient in the airways. Our study proposes the existence of two different flow mechanisms for the airway surface liquid (ASL), namely:
i. Active transport of ASL by the metachronous beating of cilia and
ii. Passive transport of ASL by changes in airway pressure gradient during inhalation and exhalation.
We neglect the active transport of ASL by cilia because our focus is to investigate if the passive transport of ASL can significantly bend cilia and affect its functioning. This allows the use of a unidirectional coupling between the ASL and cilia where the force from the flow of the ASL deforms cilia in the airways.
Model Geometry
The lung airway is a fractal that replicates over 23 branching generations [49, 50]. Its fractal nature allows cilia to be studied in longitudinal sections of the airway. The assumption is that the dynamics of cilia in the bronchus would be regulated by similar mechanisms across the entire airways. The value for mucus height, PCL height, cilium radius, and cilium length are chosen within range of experimental observations (see Table 1 and Figure 1D).
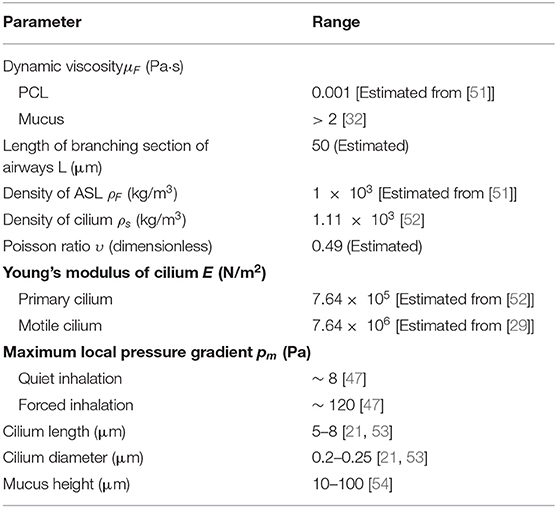
Table 1. Parameter values.
In the model, cilia are represented as elastic solids. The PCL and mucus layer are modeled as fluids with different viscosities. We choose the geometry of the airway to correspond to a longitudinal section of a right main bronchus of length 50 μm, and corresponds to the branching region of the right main bronchus (Figure 1D). In the model, we assume that physiologically healthy mucus occupies the region above the PCL.
We assume that the ASL is incompressible, the flow (of ASL and air in the right main bronchus) has low Reynolds number and therefore is considered to be laminar.
Navier-Stokes Equation for Airway Surface Liquid
Let Ω = ΩA ∪ Ωc denote the lung airways in with ΩA the region resided by the airway surface liquid and Ωc the cilia. Let v = v(x, t) denote the velocity of the airway surface liquid (ASL), p = p(x, t) the pressure at the ASL, ρF and μF the density and dynamic viscosity of the ASL, respectively. The airway mucus and PCL are assumed to be incompressible viscous fluids. The motion of the mucus and PCL is governed by the incompressible Navier-Stokes equation defined in a bounded domain . The equation of motion is:
where σ = − pI + 2μFD(v) is the fluid Cauchy stress tensor and is the symmetrized gradient of v. I is the identity tensor in . Values of ρF and μF for ASL and mucus are given in Table 1.
Elastic Model for Cilia
We denote by u = u(x, t), x ϵ Ωc, t ϵ (0, T), the displacement of the cilium from its initial position. We assume that cilium is a homogeneous isotropic material and the displacement gradient for cilia is small (i.e., ∇u ≪ 1) and the equilibrium equation is [55]:
where S is the linearized Saint Venant-Kirchhoff model that describes the mechanical property of cilia.
Here, μ and λ are the Lamé constants, describing the compression and distortion of the cilia. The constants μ and λ can be expressed as [56]:
, where E is the modulus of elasticity (Young modulus) of a cilium, υ the contraction ratio (Poisson ratio) of cilium and ρs is the density of cilium. Value of ρs and υ are given in Table 1.
Coupling Condition for the Elastic Model and Navier-Stokes Equation
We apply a linear coupling at the ASL-cilia interface by imposing continuity of stresses at the interface. That is at the interface the normal stress experienced by cilia is equal to the normal fluid stress.
The coupling condition at the ASL-cilia interface is expressed as follows: σ · n = -S· n, where n denotes the outward pointing unit normal at the ASL-cilia interface,
Initial and Boundary Conditions
The simulation time is t ϵ [0, 4] seconds, representing one breathing cycle. At time t = 0, the airway pressure gradient is zero, thus the velocity of the ASL is zero and the displacement of cilia u = 0.
A pressure boundary condition for fluid transport is imposed at the lower and upper boundary of the airways (see Figure 1D). A no-slip boundary for the fluid is imposed on the left and right boundary of the model (see Figure 1D). There is zero displacement of cilia at its base, where it attaches to the airway. To mimic this condition, we prescribe that u = 0 at the cilia base.
Modeling the Airway Pressure Gradient
In an average human, the normal steady-state breathing is about 13–17 breaths per minute [57, 58]. During a breathing cycle, the tracheal serves as an input (during the inhalation phase) and an output (during exhalation phase).
To describe a breathing cycle, we specify a constant pressure (p = 0) at the lower boundary of the airway (see Figure 1D) and a varying pressure that oscillates around p = 0) at the upper boundary of the airway. The varying pressure at the upper boundary of the airway is specified as p = pm sin(ωt), where pm is the maximum local pressure drop in a given airway and ω = π/2. These boundary conditions model the pressure gradient in the airways with one breathing cycle occurring in 4 s.
The maximum local pressure drop in the airways is higher before forced inhalation (~ 120 Pa) compared to before quiet inhalation (~ 8 Pa) [47]. The local pressure gradient is higher compared to the linear pressure gradient because of local bifurcations of the airways at different generations.
In the model, pm denotes the total pressure gradient, we choose values of pm in the range 5–20 Pa. We avoided using higher values for pm in order to avoid numerical instabilities.
Numerical Simulations of the Airway Model
The numerical approximation of the model equations is obtained from the finite element method. The finite element mesh consists of 8,019 and 1,156 triangular and quadrilateral elements, respectively, and an average element quality of 0.8.
Simulation of the model was carried out on the geometry shown in Figure 1D. Furthermore, we repeat the simulations with 4 cilia, 3 cilia, 2 cilia, 1 cilium to investigate how the average von Mises stress changes when patient loss some of the cilia in their airways. In chronic airway diseases, patients may loss cilia in their airways as a result of persistence inflammation and infection. We use the model to test if the loss of cilia during infection in the airways may affect the functioning of the remaining cilia. We increased the size of mucus and studied its effect on the average stress experienced by cilia.
Results
Simulation results for pressure distribution along the airways at time t = 1 s (top row) and t = 3 s (bottom row) for different values of pm is shown in Figure 2. This corresponds to the pressure distribution when the absolute value of the pmis maximum. Arrows depict the direction of fluid transport and the length of the arrows are proportional to the value of the fluid velocity at its corresponding spatial position. The initial and deformed position of cilia are superimposed on the figure to visualize the effect of the magnitude of pm on cilia displacement.
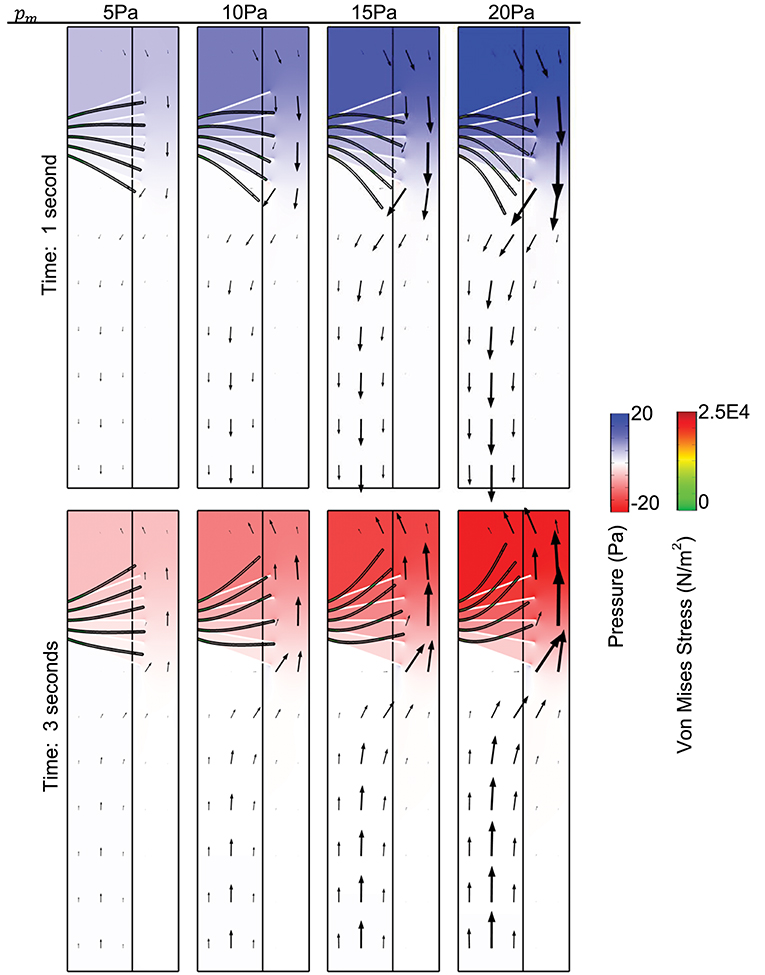
Figure 2. Surface plot of the pressure distribution. The spatial deformation of cilia is shown for different values of pm, for comparison, the position of cilia at time t = 0 s is shown using the white tubular structures. Time is 1 s (Top), time is 3 s (Bottom). Arrows show the direction of fluid transport. Young's modulus of cilia is 7.64 × 10⁵ N/m2.
Plot of von Mises stress distribution for cilia (i.e., for different values of Young modulus) at time t = 1 s is shown in Figure 3. On the top row, pm = 5 Pa and on the bottom row, pm = 20 Pa. Plot of the peak von Mises stress against the number of missing cilia is shown in Figure 4A. Variations in the peak von Mises stress takes the shape of an exponential function (see the trend formed by the dots in Figure 4B). Each dot in Figure 4B denotes the peak von Mises stress for the corresponding number of missing cilia. Based on the observed trend in the data, we compute the rate of change in peak von Mises stress by fitting a curve to the data using the following equation:
where Y denotes the peak von Mises stress, n is the number of missing cilia, and α, β, δ are constants. Curve fitting is done in MATLAB to estimate the constants α, β, δ. We obtained that α = 92.60, β = 0.92, δ = 1, 019, with 95% confidence bounds.
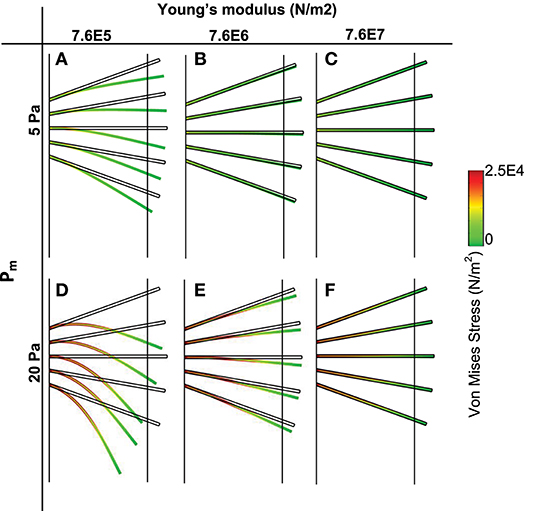
Figure 3. Von Mises stress distribution and spatial deformation of cilia for different values of elastic modulus (t = 1 s). Top row (pm = 5 Pa), bottom row (pm = 20 Pa). (A,D) Young modulus is 7.6E5. (B,E) Young Modulus is 7.6E6. (C,F) Young modulus is 7.6E7.
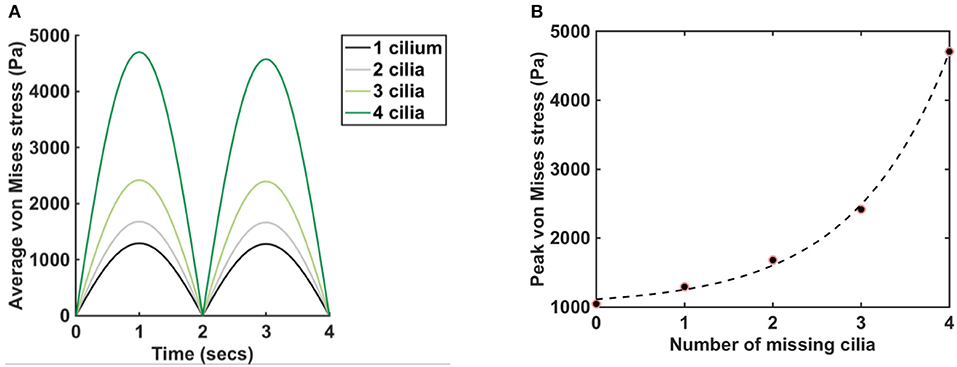
Figure 4. Plot of average and peak von Mises stress, pm = 5 Pa, E = 7.64 × 10⁶ N/m2. (A) Graphs show the average von Mises stress for different numbers of missing cilia, t = (0,4) s. Legend depicts the number of cilia removed/missing from the airway. The black line represents the average von Mises stress when the cilium closest to the lower airway is removed from the airway in Figure 1D. The gray line represents the average von Mises stress when the two cilia closest to the lower airway is removed from the airway in Figure 1D. Same applies to the cases where three and four cilia are removed. (B) The dots show the peak von Mises stress for different numbers of missing cilia, t = (0,4). The dash line fits the function Ŷ(n) = αeβn + δ to the data points, where α = 92.60, β = 0.92, δ = 1, 019, with 95% confidence bounds.
We used a R-square test to measures how successful the fit is in explaining the variation of the peak von Mises stress. R-square is defined as the square of the correlation between the peak von Mises stress and the predicted values from the function Ŷ(n) and is computed as follows:
where SSE is the sum of squares due to error and measures the total deviation of the peak von Mises stress from the fit to the peak von Mises stress:
and SST is the sum of squares about the mean of the peak values of von Mises stress:
where Yn is the peak von Mises stress, Yn is the mean of the peak von Mises stress, Ŷn = Ŷ(n), is the function fitted to the peak von Mises stress, N is the number of data points, and 0 ≤ R-square ≤ 1.
If R-square has a value closer to 1, then this implies that a greater proportion of variance in the data is accounted for by the model. However, if R-square has a value closer to 0, then the model is unable to account for the variance in the data. The computed value for R-square is 0.9982, this implies that the fit explains 99.8% of the total variation in the simulated peak von Mises stress above the mean.
Discussion
In this study, we developed a computational model to investigate if changes in ciliary structure causes a significant increase in the displacement of cilia (via pressure forces) during breathing cycles.
We hypothesized that:
(1) Local pressure gradient in the airways would cause the airway surface liquid to flow down the airways (during inhalation), and up the airways during exhalation and that this flow may bend the motile cilia in the airways.
(2) Motile cilia in the airways work against the downward flow of airway surface liquid (during inhalation) and propel mucus out of the airways.
(3) Mutation in motile cilia that affect its structure changes the elastic modulus of cilia.
(4) A decrease in elastic modulus of cilia causes an increase in the bending of cilia and may affect its sensory and signaling functions.
(5) In particular, the bending of cilia during inhalation and exhalation would decrease the amplitude of the propulsive strokes of cilia and decrease the rate of mucociliary clearance.
The process of inhalation and exhalation is modeled by specifying a time varying pressure at the top boundary of the upper airways and a constant pressure at the lower airways. The varying pressure, is a sinusoidal waveform p = pm sin(ωt), where pm is the maximum total pressure drop in the airways. The sinusoidal waveform allows us to mimic the changes in pressure drop in the airways. The beauty of this is that the sinusoidal waveform can be used to mimic the pressure gradient in different generations of the airways by changing only the value of pm.
The total pressure drop in the airways is the sum of the linear pressure drop and local pressure drop. We computed the linear pressure gradient for the air flow in the right main bronchus and found that its values are negligible compared to its local pressure gradient. Thus, we approximated the value of the total pressure gradient in the airways by assuming a correspondence with its local pressure gradient. The maximum local pressure drop in the airways is higher before forced inhalation (about 120 Pa) compared to before quiet inhalation (about 8 Pa) [47]. We chose pm in the range 5–20 Pa to correspond to physiological conditions and investigated how the magnitude of the cyclic pressure gradient affect cilia dynamics.
Changes in Ciliary Structure Affect Mucociliary Clearance
When the pressure gradient is about 0 Pa, cilia position corresponds to its initial position at time t = 0 s. We compute the displacement of cilia at times where the magnitude of pressure gradient is highest because the corresponding flow of mucus/displacement of cilia induced by the pressure gradient would be maximum at those times. The highest magnitude of pressure gradient in the airway occurs at time t = 1 (p = pm, during inhalation) and time t = 3 s (p = −pm, during exhalation) (see Figure 1E). In Figure 2, we observe that the model is able to mimic the pressure gradient during inhalation (top row, t = 1 s) and exhalation (bottom row, t = 3 s). In particular, during inhalation, the pressure is higher at the upper airways and during exhalation, the pressure is higher in the lower airways.
We found that the velocity of the airway surface liquid increased with increasing values of pm. The normal stress from the fluid (i.e., ASL) was applied to cilia and we observed a significant displacement of cilia from its initial position especially at higher values of pm (Figure 2, here Young modulus of cilia is 7.64 × 10⁵ N/m2). Cilia with Young modulus of 7.64 × 10⁵ N/m2 corresponds to the ciliary structure with PCD. The magnitude of the propulsive stroke of cilia would in this case decrease significantly because most of its effort would be applied in overcoming the effect of its displacement by the ASL during inhalation. There is a possibility for these cilia to have desynchronization in beating as they try to beat against the effect of the viscous stress. This implies that changes in the ciliary structure that impacts its elastic properties may affect mucociliary clearance via desynchronization of cilia beatings. The cyclic pressure gradient may promote periodic changes in the distribution of mucus and PCL in the airway if cilia beating is dysfunctional.
We plotted the displacement of normal motile cilia (Young modulus E = 7.64 × 10⁶ N/m2) exposed to similar fluid stresses as those simulated for PCD (Figure 3). We found that the displacement of cilia was negligible at pm = 5 Pa (at pm = 5 Pa, the magnitude of the pressure gradient corresponds to typical values at airway branching points during quite inhalation). Increasing the value of pm, increased the amplitude of displacement of cilia but not comparable in magnitude to those with PCD (E = 7.64 × 10⁵ N/m2). Increasing the magnitude of Young modulus of cilia by an order of 10 to obtain 7.64 × 10⁷ N/m2, we observed that cilia were able to withstand the effect of the fluid stress and were not displaced. This implies that when cilia are about 10 orders of magnitude stiffer than normal, they experience negligible displacement by the ASL.
It is believed that motile cilia may have sensory and signaling functions like primary cilia [3, 21, 59]. More research is needed to understand if the displacement of cilia by the ASL affects its sensory and signaling functions. Especially when the magnitude of displacement is large.
Since cilia is modeled as an elastic material, we observed that as the pressure gradient approached zero, the displaced cilia returned to their initial position.
Shedding of Airway Ciliated Epithelium May Affect Mucociliary Clearance
Shedding of airway ciliated epithelium occurs frequently in asthmatic patients, due to airway inflammation [17, 60]. This shedding of airway ciliated cells would compromise the structural resilience of the carpets of cilia in withstanding the enormous biomechanical stress in the airways. Studies carried out in chicken tracheas showed that epithelial damage of at least 50% of the bronchial cilia produced a significant decrease in mucociliary clearance [17, 61]. Loss of ciliated cells also occur in patients with cystic fibrosis and COPD.
We investigated the effect of shading of the airway ciliated epithelium by decreasing the number of cilia in the airway model. In particular, we computed the average von Mises stress experienced by cilia as a function of time when 4 cilia are present in the model (i.e., 1 cilium is missing from the initial model), 3 cilia are present in the model (i.e., 2 cilia are missing), 2 cilia are present in the model (i.e., 3 cilia are missing) and 1 cilium is present in the model (i.e., 4 cilia are missing).
We found that the average von Mises stress increased by approximately 5-folds when 4 cilia was missing compared to when 1 cilium was missing (Figure 4A), here pm = 5 Pa, E = 7.64 × 10⁶ N/m2. It highlights that the average von Mises stress on the airway cilia varies with the number of cilia in the airways. In order to quantify the rate at which von Mises stress is changing with the number of cilia in the airways, we plotted the peak von Mises stress against the number of missing cilia and we found an exponential change in the values of the peak von Mises stress (Figure 4B). The implication of this is that the average stress acting on cilia during physiological functioning increases exponentially with the shading of the airway ciliated cells, a key finding of this study. We fitted the function, Ŷ(n) to the peak von Mises stress (Figure 4B): Ŷ(n) = αeβn + δ, where n the number of missing cilia, and α, β, δ are constants. We found that α = 92.60, β = 0.92, δ = 1, 019, with 95% confidence bounds.
We apply the Rule of 70 to determine how many missing cilia would cause a doubling of the von Mises stress. That is:
where β = 92% denotes the growth rate. The number of cilia to double the amount of von Mises stress is therefore 70/92 ≈ 0.76, and corresponds to losing about 15% of cilia in the model.
Though our model is not designed to predict the effect of doubling the von Mises stress on cilia, we believe that doubling von Mises stress on cilia would negatively affect mucociliary clearance because cilia would have to overcome this stress in order to facilitate mucus clearance.
Effect of Varying the Pressure Gradient Curve
We changed the period of the curve for the pressure boundary condition p = pm sin(ωt) in the upper airways (Figure 1D), to investigate if changes in the duration of a breathing cycle affect the average stress experienced by cilia.
We ran simulations for ω = π/2 and . We found that a change in the duration of a breathing cycle produces a shift in the curve for the vertical displacement of the tip of cilia without any significant change in the amplitude of the vertical displacement. Similar trend was observed for average von Mises stress at the tip of cilia.
Effect of Varying Mucus Height
Impairment in mucociliary clearance such as those experienced by asthmatic, COPD and CF patients causes mucus retention in the airways. Mucus retention causes an increase in the airway mucus height. In order to determine if an increase in airway mucus height has an adverse effect on cilia, we ran a set of simulations with the height of PCL unchanged but varied the mucus height. We computed the average vertical displacement of the tip of cilia when mucus height was 5 and 10 μm for E = 7.64 × 10⁵ N/m2 and 7.64 × 10⁶ N/m2 [Figure 5A, pm = 5 Pa and t = (0,4)].
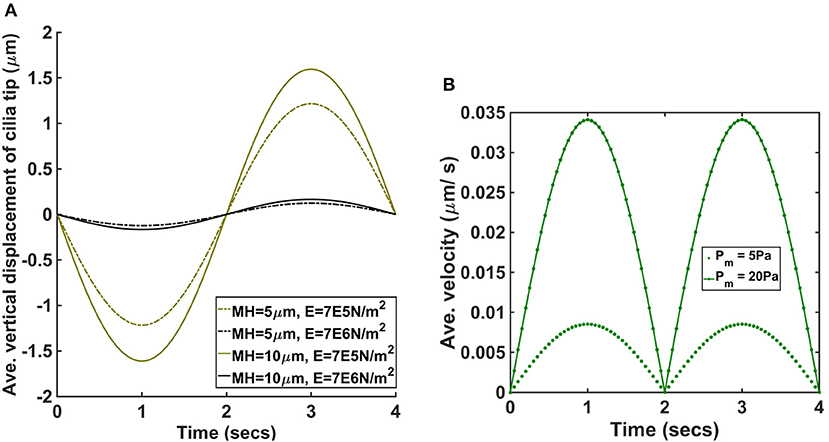
Figure 5. (A) Average vertical displacement of cilia tip for different values of mucus height and Young modulus (pm = 5 Pa). MH denotes the mucus height and E the Young modulus of cilia. (B) Average velocity of ASL for pm = 5 Pa and pm = 20 Pa.
We found that increasing the mucus height increased average displacement of cilia and was significantly larger for the cases where E = 7.64 × 10⁵ N/m2.
Average Velocity of ASL During Passive Transport
Our model assumes that changes in airway pressure gradient during inhalation and exhalation leads to the passive transport of ASL. The direction of the passive flow of ASL depends on the pressure gradient in the airways. During inhalation, ASL flows from the upper airways to the lower airways and reverses its flow direction during exhalation, flowing from the lower airways to the upper airways. We plotted the average velocity (μm/s) of ASL during a breathing cycle to determine its magnitude for different values of pm (Figure 5B). When pm = 5 Pa, the magnitude of the peak average velocity was about 0.009 μm/s and when pm = 20 Pa, the magnitude of the peak average velocity was about 0.034 μm/s. Therefore, the passive flow of ASL would enhance the speed of mucociliary clearance during exhalation but would decrease the speed of mucociliary clearance during inhalation. We computed the displacement of cilia for different values of pm and we found no significant changes in the beat frequency of cilia (provided the duration of breathing was kept constant). In order words, the model predicts that the beat frequency of cilia is not affected by the amplitude/magnitude of the pressure gradient.
Given that the pressure gradient during forced inhalation (about 120 Pa) is significantly higher than the simulated values, the simulation results predicts that the passive transport of ASL could increase greatly during forced inhalation.
Comparison of Simulation Results With Experimental Studies
The findings from this study is consistent with the experimental study by Hill et al. [29] which revealed that cilia may respond to applied forces by reducing its beat amplitude with no significant change in beat frequency. Hill et al. [29] measured the force response of individual cilia from the human airway using spot-labeled 2.8 mm diameter magnetic microbeads and a custom-designed magnetic tweezers apparatus. In order to compute the effect of external forces on cilia motion, forces were applied to the bead in either toward (Figure 6A) or against the propulsive stroke (Figure 6B) and the cilia beat patterns were obtained by tracking the magnetic beads attached to the cilia tip [Figure 6 is reproduced from Hill et al. [29]]. In their study, the average beat amplitude of cilia was reported as 5.5 ± 0.3 μm when no forces were applied. However, when a force of 142 piconewton was applied to the beads attached to cilia tips, the beat amplitude decreased significantly but the beat frequency remains fairly constant (Figures 6A,B) even after the applied force caused the beat amplitude to decrease by 85% [29].
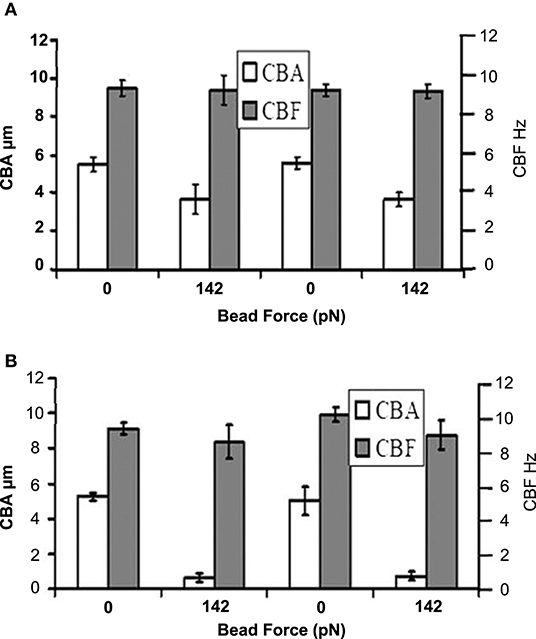
Figure 6. Cilia beat amplitude (CBA) and cilia beat frequency (CBF) in the presence of applied bead force. (A) Forward propulsive stroke occurs in the direction of the force applied to the bead. (B) Recovery stroke occurs in the direction of force applied to the bead. Reprinted from Hill et al. [29] with permission from Elsevier.
Our simulation results show that if the elastic modulus is 10 orders of magnitude less than normal cilia, then the amplitude of the vertical displacement of cilia by the ASL is >1 μm (i.e., more than 20% of the magnitude of the reported values of about 5.5 μm for normal coordinated active cilia motion during the forward propulsive stroke) and increases with the height of mucus (Figures 2, 5A). Therefore, the resultant amplitude of the propulsive stroke of cilia will be the sum of the positive contributions from its internal active force for propulsion and the negative contributions via its bending by the ASL during inhalation. The implication of this result is that the resultant amplitude of cilia will decrease greatly due to changes in elastic modulus in certain cases of PCD. A decrease in cilia beat amplitude would affect mucociliary clearance because experimental studies have shown that changes in cilia beat amplitude can affect airway mucus transport [4].
An examination of PCD subjects with mutations in genes that encode for radial spoke components of cilia revealed some abnormalities in ciliary axonemes of the central pair [62]. In these patients, the ciliary beat frequency was comparable to normal but the cilia exhibited abnormal circular beat pattern that was caused by changes in the amplitude and velocity of the strokes of cilia [4, 62, 63]. We believe that the abnormalities in ciliary axonemes of the central pair would decrease the stiffness of cilia because these cilia are missing some of their radial spokes [4, 64]. These cilia would be prone to significant bending from the flow of the ASL caused by the changes in airway pressure gradient during respiration. The resultant amplitude of cilia propulsive stroke will therefore be the sum of the positive contributions from its internal active force for propulsion and the negative contributions via its bending by the ASL during inhalation. Based on our simulation results, we propose that the decreased stiffness of these cilia is a major contributing factor to the changes in the amplitude of the strokes of cilia, and leads to abnormal circular beat pattern.
Conclusion and Future Work
Much research has been done to understand the metachronous beating and the propulsion of mucus by cilia. Very few studies consider how mechanical forces acting in the airways impact cilia beating. Hill et al. [29] used a physical model to study the effect of counter forces on ciliary dynamics, his study showed that the amplitude of cilia beating is affected by counter forces. The airway pressure gradient acts as a counter force during inhalation since it may cause the ASL to flow down the airways, cilia must overcome the counter stress from the fluid in order to propel mucus out of the airways.
The frequency of cilia beating in normal healthy subjects (11.5–13 Hz) [2, 3] is higher that the frequency of alternation in airway pressure gradient occurring during inhalation and exhalation, where the frequency of alternation in airway pressure gradient corresponds to the respiration rate (0.2–0.3 Hz in normal adult subjects). During exhalation, airway pressure gradient would enhance the clearance of mucus during the forward strokes of cilia by increasing the force propelling mucus from the airways. Some devices have been developed to take advantage of the exhalation phase and the shear-thinning and thixotropic properties of mucus to enhance the propulsion of mucus from the airways of CF and COPD subjects. Example, the device Simeox® imposes a succession of very short negative pressure pulses of increasing intensity during exhalation, reducing the mucus viscosity and enhancing its simultaneous propulsion from the peripheral pulmonary zone to the central airways, and then coughed or spit out by the patient [65–67].
To the best of our knowledge, no mathematical model has been developed to investigate the impact of airway pressure gradient on ciliary beating and mucociliary clearance. This study develops a one-way coupled fluid structure interaction model to quantify the displacement of cilia by the forces exerted on the ASL as result of the airway pressure gradient that drives air in and out of the lungs during respiration. We show that if a layer of fluid is exposed to a pressure gradient then the flow dynamics of the fluid will be affected by the pressure gradient and this should be accounted for when modeling mucociliary clearance.
In summary, simulation results of the model confirm that the resultant amplitude of cilia motion is affected by the magnitude of airway pressure gradient. Airway pressure gradient displaces the ASL and causes the displacement of cilia. The effect is greater at locations in the airway with higher magnitude of pressure gradient. Displacement of cilia by ASL is larger in PCD airways where ciliary structure causes a decrease in the stiffness of cilia. This result implies that changes in the ciliary structure that impacts its elastic properties may affect mucociliary clearance. In particular, the cyclic pressure gradient may promote periodic changes in the distribution of mucus and PCL in the airway if cilia beating is dysfunctional. An examination of PCD subjects with mutations in genes that encode for radial spoke components of cilia revealed some abnormalities in ciliary axonemes of the central pair [62]. In these patients, cilia had abnormal circular beat pattern that was caused by changes in the amplitude and velocity of the strokes of cilia [4, 62, 63]. Based on our simulation results, we propose that the decreased stiffness of these cilia is a major contributing factor to the changes in the amplitude of the strokes of cilia, and leads to abnormal circular beat pattern.
We found that airway pressure gradient affects the beating amplitude of cilia but does not affect its beating frequency. This findings are consistent with the experimental study by Hill et al. [29] which revealed that cilia respond to applied forces by reducing its beat amplitude with no significant change in beat frequency. Simulation result showed that increasing the mucus height increased the magnitude of bending of cilia by ASL (Figure 5A) with significant increase in cases with reduced elastic moduli. We note that the bending of cilia by ASL acts as a counter force against the forward propulsive stroke of cilia during inhalation. Therefore, an increase in mucus height would result in a decrease in the amplitude of the forward propulsive stroke of cilia.
Simulation results predict that the high local pressure gradient at airway bifurcation points increases the counter forces acting on cilia and may be a major contributing factor to the existence of a slow clearance zone at bifurcation points. This finding correlates to the study of the airways by Farkas and Szöke [48] which revealed the existence of a slow clearance zone around the peak of the airway bifurcation that delayed the clearance of particles depositing or entering there.
Chronic airway inflammation is a common decimal in CF, COPD, and asthmatic subjects [68] and may damage and compromise the mechanical integrity of the epithelial layer that harbors cilia. Damage of the epithelial layer may cause cilia to detach from the airways. The simulation result also predicts that losing cilia in the airways increases the average stress on the remaining cilia. This result is consistent with other studies that show that decreasing the number of cilia has an adverse effect on mucociliary clearance [36]. Based on the model results, we speculate that if about 15% of cilia is removed from the airway cilia, the average mechanical stress experienced by the remaining cilia would double. It is known that cilia may increase its propulsive stroke and resist counter forces that seek to impede its beating. However, the propulsive force increases to a finite value, and exceedingly high counter forces may cause cilia to be overwhelmed thereby decreasing the amplitude of cilia beating and mucociliary clearance.
More research is need to understand how the length of time between cilia loss and its repopulation affect mucociliary clearance in CF, COPD, and asthmatic airways. The model suggests the importance of determining the percentage of cilia loss that is sufficient to significantly impact mucociliary clearance.
The model predicts that an application of therapeutic interaction that stimulate rapid rejuvenation of airway cilia may significantly improve the treatment of CF, COPD, and asthmatic subjects.
Some limitations of the model is discussed below. Modeling mucociliary clearance remains a challenging problem because of the complexity of the rheological properties of mucus. At the microscale, mucus behaves as a Newtonian fluid but at the macroscale, it behaves like a non-Newtonian viscoelastic fluid. The viscoelastic properties of mucus are governed by the viscous and the elastic moduli and they affect the rate of mucociliary clearance. Mathematical modeling of mucociliary clearance is difficulty because of the variation of the viscous and elastic moduli of mucus with the concentration of mucin macromolecules, distribution of mucin macromolecules and in diseases such as CF [69]. Based on the fact that the viscous and elastic moduli of mucus is sensitive to amplitudes and frequency of applied stress [69], we hypothesis that the cyclic pressure gradient that promote respiration may cause the viscous and elastic moduli of mucus to vary during respiration.
A future work would involve representing the mucus layer as a non-Newtonian viscoelastic fluid with appropriate constitutive models. A model that couples the breathing patterns in the airway to mucociliary clearance is difficult to implement and is still an open problem. A future work would involve extending the model to include the active transport of mucus by cilia. This would be important for computing the magnitude of the propulsive stroke of cilia in different disease conditions. It would also help in the identification of airway locations that may be prone to failure in mucociliary clearance.
The force generated by the beating cilia propels mucus toward the trachea and out from the lungs at about 1–2 mm/h (i.e., 0.28–0.56 μm/s), depending on parameters such as ciliary length and beat frequency [6, 7, 9]. A comprehensive model would help us quantify how the velocity of mucociliary clearance vary with increasing pressure gradient in the airways.
Data Availability Statement
All datasets generated for this study are included in the article/supplementary material.
Author Contributions
UG and RP conceived the study and wrote the manuscript. UG designed the model, carried out the implementation, and analyzed the data.
Conflict of Interest
The authors declare that the research was conducted in the absence of any commercial or financial relationships that could be construed as a potential conflict of interest.
References
1. Kurbatova P, Bessonov N, Volpert V, Tiddens H A., Cornu C, Nony P, et al. Model of mucociliary clearance in cystic fibrosis lungs. J Theor Biol. (2015) 372:81–8. doi: 10.1016/j.jtbi.2015.02.023
2. Lobo J, Zariwala MA, Noone PG. Primary ciliary dyskinesia. Semin Respir Crit Care Med. (2015) 36:169–79. doi: 10.1055/s-0035-1546748
3. Ferkol T, Leigh MW. Primary ciliary dyskinesia. In: Wilmott R, Bush A, Deterding R, Ratjen F, Sly P, Zar H, Li A, editors. Kendig's Disorders of the Respiratory Tract in Children, 9th ed. Oxford: Elsevier (2019). p. 1034–43.e1034.
4. Bustamante-Marin XM, Ostrowski LE. Cilia and mucociliary clearance. Cold Spring Harbor Perspect Biol. (2017) 9:a028241. doi: 10.1101/cshperspect.a028241
5. Matsui H, Randell SH, Peretti SW, Davis CW, Boucher RC. Coordinated clearance of periciliary liquid and mucus from airway surfaces. J Clin Invest. (1998) 102:1125–31. doi: 10.1172/JCI2687
6. Button B, Cai LH, Ehre C, Kesimer M, Hill DB, Sheehan JK, et al. A periciliary brush promotes the lung health by separating the mucus layer from airway epithelia. Science. (2012) 337:937–41. doi: 10.1126/science.1223012
7. Rusznak C, Devalia J, Lozewicz S, Davies R. The assessment of nasal mucociliary clearance and the effect of drugs. Respir Med. (1994) 88:89–101. doi: 10.1016/0954-6111(94)90020-5
8. Blake J. A model for the micro-structure in ciliated organisms. J Fluid Mech. (1972) 55:1–23. doi: 10.1017/S0022112072001612
9. Satir P, Heuser T, Sale WS. A structural basis for how motile cilia beat. Bioscience. (2014) 64:1073–83. doi: 10.1093/biosci/biu180
10. Matsui H, Wagner VE, Hill DB, Schwab UE, Rogers TD, Button B, et al. A physical linkage between cystic fibrosis airway surface dehydration and pseudomonas aeruginosa biofilms. Proc Natl Acad Sci USA. (2006) 103:18131–6. doi: 10.1073/pnas.0606428103
11. Mall M, Grubb BR, Harkema JR, O'Neal WK, Boucher RC. Increased airway epithelial na+ absorption produces cystic fibrosis-like lung disease in mice. Nat Med. (2004) 10:487–93. doi: 10.1038/nm1028
12. Franová S, Kazimierová I, Pappová L, Molitorisová M, Jošková M, Šutovská M. The effect of erdosteine on airway defence mechanisms and inflammatory cytokines in the settings of allergic inflammation. Pulm Pharmacol Ther. (2019) 54:60–7. doi: 10.1016/j.pupt.2018.11.006
13. Cruz R S., Landa J, Hirsch J, Sackner MA. Tracheal mucous velocity in normal man and patients with obstructive lung disease; effects of terbutaline. Am Rev Respir Dis. (1974) 109:458–63.
14. Foster W M., Langenback E G., Bohning D, Bergofsky EH. Quantitation of mucus clearance in peripheral lung and comparison with tracheal and broncial mucus transport velocities in man [abstract]. Am Rev Respir Dis. (1978) 117 (Suppl. 1):337.
15. Bateman J, Pavia D, Sheahan N, Agnew J, Clarke S. Impaired tracheobronchial clearance in patients with mild stable asthma. Thorax. (1983) 38:463–7. doi: 10.1136/thx.38.6.463
16. Carpenter J, Lynch SE, Cribb JA, Kylstra S, Hill D B, Superfine R. Buffer drains and mucus is transported upward in a tilted mucus clearance assay. Am J Physiol Lung Cell Mol Physiol. (2018) 315:L910–8. doi: 10.1152/ajplung.00274.2018
17. Del Donno M, Bittesnich D, Chetta A, Olivieri D, Lopez-Vidriero MT. The effect of inflammation on mucociliary clearance in asthma: an overview. Chest. (2000) 118:1142–9. doi: 10.1378/chest.118.4.1142
18. Rubbo B, Lucas JS. Clinical care for primary ciliary dyskinesia: current challenges and future directions. Eur Respir Rev. (2017) 26:170023. doi: 10.1183/16000617.0023-2017
19. Nakazawa Y, Ariyoshi T, Noga A, Kamiya R, Hirono M. Space-dependent formation of central pair microtubules and their interactions with radial spokes. PLoS ONE. (2014) 9:e110513. doi: 10.1371/journal.pone.0110513
21. Satir P, Christensen ST. Overview of structure and function of mammalian cilia. Annu Rev Physiol. (2007) 69:377–400. doi: 10.1146/annurev.physiol.69.040705.141236
22. Ishikawa T. Axoneme structure from motile cilia. Cold Spring Harb Perspect Biol. (2017) 9:a028076. doi: 10.1101/cshperspect.a028076
24. Satir P. Tour of organelles through the electron microscope: a reprinting of keith r. Porter's classic harvey lecture with a new introduction. Anat Rec A Discov Mol Cell Evol Biol. (2005) 287:1184–5. doi: 10.1002/ar.a.20222
25. Mizuno N, Taschner M, Engel BD, Lorentzen E. Structural studies of ciliary components. J Mol Biol. (2012) 422:163–80. doi: 10.1016/j.jmb.2012.05.040
26. Kamiya R. Functional diversity of axonemal dyneins as studied in chlamydomonas mutants. Int Rev Cytol. (2002) 219:115–55. doi: 10.1016/S0074-7696(02)19012-7
27. Smith EF, Yang P. The radial spokes and central apparatus: mechano-chemical transducers that regulate flagellar motility. Cell Motil Cytoskeleton. (2004) 57:8–17. doi: 10.1002/cm.10155
28. Veland IR, Awan A, Pedersen LB, Yoder BK, Christensen ST. Primary cilia and signaling pathways in mammalian development, health and disease. Nephron Physiol. (2009) 111:39–53. doi: 10.1159/000208212
29. Hill DB, Swaminathan V, Estes A, Cribb J, O'Brien ET, Davis CW, et al. Force generation and dynamics of individual cilia under external loading. Biophys J. (2010) 98:57–66. doi: 10.1016/j.bpj.2009.09.048
30. Schwartz EA, Leonard ML, Bizios R, Bowser SS. Analysis and modeling of the primary cilium bending response to fluid shear. Am J Physiol Renal Physiol. (1997) 272:F132–8. doi: 10.1152/ajprenal.1997.272.1.F132
31. Jayathilake P, Le D, Tan Z, Lee HP, Khoo BC. A numerical study of muco-ciliary transport under the condition of diseased cilia. Comput Methods Biomechan Biomed Eng. (2015) 18:944–51. doi: 10.1080/10255842.2013.864285
32. Lai SK, Wang Y-Y, Wirtz D, Hanes J. Micro-and macrorheology of mucus. Adv Drug Deliv Rev. (2009) 61:86–100. doi: 10.1016/j.addr.2008.09.012
33. Creeth J. Constituents of mucus and their separation. Br Med Bull. (1978) 34:17–24. doi: 10.1093/oxfordjournals.bmb.a071454
34. Majima Y, Harada T, Shimizu T, Takeuchi K, Sakakura Y, Yasuoka S, et al. Effect of biochemical components on rheologic properties of nasal mucus in chronic sinusitis. Am J Respir Crit Care Med. (1999) 160:421–6. doi: 10.1164/ajrccm.160.2.9805117
35. Jayathilake P, Tan Z, Le D, Lee H, Khoo B. Three-dimensional numerical simulations of human pulmonary cilia in the periciliary liquid layer by the immersed boundary method. Computers Fluids. (2012) 67:130–7. doi: 10.1016/j.compfluid.2012.07.016
36. Lee W, Jayathilake P, Tan Z, Le D, Lee H, Khoo B. Muco-ciliary transport: effect of mucus viscosity, cilia beat frequency and cilia density. Comput Fluids. (2011) 49:214–21. doi: 10.1016/j.compfluid.2011.05.016
37. Mitran S. M. Metachronal wave formation in a model of pulmonary cilia. Comput Struct. (2007) 85:763–74. doi: 10.1016/j.compstruc.2007.01.015
38. Vasquez PA, Jin Y, Palmer E, Hill D, Forest MG. Modeling and simulation of mucus flow in human bronchial epithelial cell cultures—Part I: idealized axisymmetric swirling flow. PLoS Computat Biol. (2016) 12:e1004872. doi: 10.1371/journal.pcbi.1004872
39. Simons J, Fauci L, Cortez R. A fully three-dimensional model of the interaction of driven elastic filaments in a stokes flow with applications to sperm motility. J Biomechan. (2015) 48:1639–51. doi: 10.1016/j.jbiomech.2015.01.050
40. Chatelin R, Poncet PA parametric study of mucociliary transport by numerical simulations of 3d non-homogeneous mucus. J Biomech. (2016) 49:1772–80. doi: 10.1016/j.jbiomech.2016.04.009
41. Li Z, Favier J, D'Ortona U, Poncet S. An immersed boundary-lattice boltzmann method for single-and multi-component fluid flows. J Comput Phys. (2016) 304:424–40. doi: 10.1016/j.jcp.2015.10.026
42. Sedaghat M, Shahmardan M, Norouzi M, Jayathilake P, Nazari M. Numerical simulation of muco-ciliary clearance: immersed boundary-lattice boltzmann method. Comput Fluids. (2016) 131:91–101. doi: 10.1016/j.compfluid.2016.03.015
43. Lubkin D, Gaffney E, Blake J. A viscoelastic traction layer model of muco-ciliary transport. Bull Math Biol. (2007) 69:289. doi: 10.1007/s11538-005-9036-x
44. Montenegro-Johnson TD, Smith DJ, Loghin D. Physics of rheologically enhanced propulsion: different strokes in generalized stokes. Phys Fluids. (2013) 25:081903. doi: 10.1063/1.4818640
45. Craster R, Matar O. Surfactant transport on mucus films. J Fluid Mech. (2000) 425:235–58. doi: 10.1017/S0022112000002317
46. Smith D, Gaffney E, Blake J. Discrete cilia modelling with singularity distributions: application to the embryonic node and the airway surface liquid. Bull Math Biol. (2007) 69:1477–510. doi: 10.1007/s11538-006-9172-y
47. Chovancova M, Elcner J. The pressure gradient in the human respiratory tract. EPJ Web Conf. (2014) 67:02047. doi: 10.1051/epjconf/20146702047
48. Farkas Á, Szöke I. Simulation of bronchial mucociliary clearance of insoluble particles by computational fluid and particle dynamics methods. Inhal Toxicol. (2013) 25:593–605. doi: 10.3109/08958378.2013.815666
49. Weibel ER, Cournand AF, Richards DW. Morphometry of the Human Lung, Vol. 1. Berlin Heidelberg: Springer (1963). doi: 10.1016/B978-1-4832-0076-7.50006-5
50. Unbekandt M, del Moral PM, Sala FG, Bellusci S, Warburton D, Fleury V. Tracheal occlusion increases the rate of epithelial branching of embryonic mouse lung via the fgf10-fgfr2b-sprouty2 pathway. Mech Dev. (2008) 125:314–24. doi: 10.1016/j.mod.2007.10.013
51. Resnick A. Mechanical properties of a primary cilium as measured by resonant oscillation. Biophys J. (2015) 109:18–25. doi: 10.1016/j.bpj.2015.05.031
52. Resnick A, Hopfer U. Force-response considerations in ciliary mechanosensation. Biophys J. (2007) 93:1380–90. doi: 10.1529/biophysj.107.105007
53. Rydholm S, Zwartz G, Kowalewski JM, Kamali-Zare P, Frisk T, Brismar H. Mechanical properties of primary cilia regulate the response to fluid flow. Am J Physiol Renal Physiol. (2010) 298:F1096–102. doi: 10.1152/ajprenal.00657.2009
54. Chatelin R, Anne-Archard D, Murris-Espin M, Sanchez D, Thiriet M, Didier A, et al. Modeling cystic fibrosis and mucociliary clearance. In: Becker SM, editor. Modeling of Microscale Transport in Biological Processes. Cambridge, MA: Academic Press (2017). p. 113–54. doi: 10.1016/B978-0-12-804595-4.00005-5
55. Bodnár T, Galdi GP, Necasová S. Fluid-structure Interaction and Biomedical Applications. Oxford: Springer (2014). doi: 10.1007/978-3-0348-0822-4
56. Johnson C. Numerical Solution of Partial Differential Equations by the Finite Element Method. Cambridge: Cambridge University Press (1987).
58. Zordan VB, Celly B, Chiu B, DiLorenzo PC. Breathe easy: model and control of human respiration for computer animation. Graph Models. (2006) 68:113–32. doi: 10.1016/j.gmod.2005.03.005
59. Praetorius H, Spring KR. Removal of the mdck cell primary cilium abolishes flow sensing. J Membrane Biol. (2003) 191:69–76. doi: 10.1007/s00232-002-1042-4
60. Djukanovic R, Roche W, Wilson J, Beasley C, Twentyman O, Howarth P, et al. Mucosal inflammation in asthma. Am Rev Respir Dis. (1990) 142:434–57. doi: 10.1164/ajrccm/142.2.434
61. Battista SP, Denine EP, Kensler CJ. Restoration of tracheal mucosa and ciliary particle transport activity after mechanical denudation in the chicken. Toxicol Appl Pharmacol. (1972) 22:59–69. doi: 10.1016/0041-008X(72)90225-6
62. Knowles MR, Ostrowski LE, Leigh MW, Sears PR, Davis SD, Wolf WE, et al. Mutations in rsph1 cause primary ciliary dyskinesia with a unique clinical and ciliary phenotype. Am J Respir Crit Care Med. (2014) 189:707–17. doi: 10.1164/rccm.201311-2047OC
63. Castleman VH, Romio L, Chodhari R, Hirst RA, de Castro SC, Parker KA, et al. Mutations in radial spoke head protein genes rsph9 and rsph4a cause primary ciliary dyskinesia with central-microtubular-pair abnormalities. Am J Hum Genet. (2009) 84:197–209. doi: 10.1016/j.ajhg.2009.01.011
64. Lin J, Yin W, Smith MC, Song K, Leigh MW, Zariwala MA, et al. Cryo-electron tomography reveals ciliary defects underlying human rsph1 primary ciliary dyskinesia. Nat Commun. (2014) 5:5727. doi: 10.1038/ncomms6727
65. Lafforgue O, Bouguerra N, Poncet S, Seyssiecq I, Favier J, Elkoun S. Thermo-physical properties of synthetic mucus for the study of airway clearance. J Biomed Mater Res Part A. (2017) 105:3025–33. doi: 10.1002/jbm.a.36161
66. Benkoussas H, Seyssiecq I, Poncet S. Etude expérimentale de l'influence de la dépression mécanique sur le transport et le comportement rhéologique du mucus bronchique synthétique dans une trachée artificielle. In: 2e Conférence Internationale de Mécanique (ICM'15) (Constantine) (2015).
67. Lafforgue O, Seyssiecq I, Poncet S, Favier J. Rheological properties of synthetic mucus for airway clearance. J Biomed Mater Res Part A. (2018) 106:386–96. doi: 10.1002/jbm.a.36251
68. Aghasafari P, George U, Pidaparti R. A review of inflammatory mechanism in airway diseases. Inflamm Res. (2019) 68:59–74. doi: 10.1007/s00011-018-1191-2
Keywords: airway pressure gradient, cilia, peri-cilia liquid, mucociliary clearance, fluid structure interaction, chronic obstructive pulmonary disease, cystic fibrosis, primary ciliary dyskinesia
Citation: George UZ and Pidaparti RM (2019) Airway Pressure Gradient May Decrease the Beating Amplitude of Cilia. Front. Phys. 7:157. doi: 10.3389/fphy.2019.00157
Received: 01 June 2019; Accepted: 30 September 2019;
Published: 29 October 2019.
Edited by:
Julien Favier, UMR7340 Laboratoire de Mécanique, Modélisation et Procédés Propres (M2P2), FranceReviewed by:
Mohammad Hadi Sedaghat, Shiraz University, IranAurora Hernandez-Machado, University of Barcelona, Spain
Copyright © 2019 George and Pidaparti. This is an open-access article distributed under the terms of the Creative Commons Attribution License (CC BY). The use, distribution or reproduction in other forums is permitted, provided the original author(s) and the copyright owner(s) are credited and that the original publication in this journal is cited, in accordance with accepted academic practice. No use, distribution or reproduction is permitted which does not comply with these terms.
*Correspondence: Uduak Z. George, ugeorge@sdsu.edu