
ORIGINAL RESEARCH article

Front. Phys., 18 November 2022
Sec. Soft Matter Physics
This article is part of the Research Topic Probing Out-of-Equilibrium Soft Matter View all 10 articles

Motor-driven advection competes with crowding to drive spatiotemporally heterogeneous transport in cytoskeleton composites

  • 1W. M. Keck Science Department, Scripps College, Claremont, CA, United States
  • 2W. M. Keck Science Department, Pitzer College, Claremont, CA, United States
  • 3Physics and Biophysics Department, University of San Diego, San Diego, CA, United States

The cytoskeleton–a composite network of biopolymers, molecular motors, and associated binding proteins–is a paradigmatic example of active matter. Particle transport through the cytoskeleton can range from anomalous and heterogeneous subdiffusion to superdiffusion and advection. Yet, recapitulating and understanding these properties–ubiquitous to the cytoskeleton and other out-of-equilibrium soft matter systems–remains challenging. Here, we combine light sheet microscopy with differential dynamic microscopy and single-particle tracking to elucidate anomalous and advective transport in actomyosin-microtubule composites. We show that particles exhibit multi-mode transport that transitions from pronounced subdiffusion to superdiffusion at tunable crossover timescales. Surprisingly, while higher actomyosin content increases the range of timescales over which transport is superdiffusive, it also markedly increases the degree of subdiffusion at short timescales and generally slows transport. Corresponding displacement distributions display unique combinations of non-Gaussianity, asymmetry, and non-zero modes, indicative of directed advection coupled with caged diffusion and hopping. At larger spatiotemporal scales, particles in active composites exhibit superdiffusive dynamics with scaling exponents that are robust to changing actomyosin fractions, in contrast to normal, yet faster, diffusion in networks without actomyosin. Our specific results shed important new light on the interplay between non-equilibrium processes, crowding and heterogeneity in active cytoskeletal systems. More generally, our approach is broadly applicable to active matter systems to elucidate transport and dynamics across scales.

1 Introduction

The cytoplasm is a crowded, heterogeneous, out-of-equilibrium material through which macromolecules and vesicles traverse to perform critical cellular processes such as mitosis, endocytosis, migration, and regeneration [14]. Macromolecules and particles diffusing through the cytoplasm and other similar materials have been shown to exhibit widely varying and poorly understood anomalous transport properties that deviate significantly from normal Brownian diffusion. In particular, the mean-squared displacement, MSD, often does not scale linearly with lag time Δt, but is instead better described by MSDΔtα where α<1 or α>1 for subdiffusion or superdiffusion, respectively. The distributions of displacements (i.e., van Hove distributions) also often deviate from Gaussianity and can display exponential tails at large displacements [58]. The cytoskeleton–an active composite of filamentous proteins including actin, microtubules, and intermediate filaments, along with their associated motor proteins–plays a key role in these observed anomalous transport properties [911]. Such anomalous transport phenomena are not just observed in cytoskeleton, but are ubiquitous in numerous other active and crowded soft matter systems, making their characterization and understanding of broad interest.

In steady-state, the thermal transport of particles through in vitro cytoskeletal systems exhibit varying degrees of subdiffusion and non-Gaussianity depending on the types and concentrations of filaments and crosslinking proteins [5, 6, 12, 13]. For example, single-particle tracking (SPT) of particles in composites of entangled actin filaments and microtubules, has revealed increasing degrees of subdiffusion (α decreasing from ∼0.95 to ∼0.58) as the molar ratio of semiflexible actin filaments to rigid microtubules increased [6]. The corresponding SPT van Hove distributions were reported to be non-Gaussian, displaying larger than expected probabilities for very small and large displacements, indicative of particles being caged in the filament mesh and hopping between cages.

Differential dynamic microscopy (DDM), which uses Fourier-space analysis to measure the timescales over which particle density fluctuations decay, has also been used to measure transport and quantify anomalous characteristics over larger spatiotemporal scales compared to SPT [5, 14, 15]. DDM analysis of a time-series of images provides a characteristic decay time τ as a function of the wave vector q which typically follows power-law scaling τ(q)qβ [15, 16], with β relating to the anomalous scaling exponent α via β=2/α. Specifically, β=2,>2,<2 and 1 correspond to diffusive, subdiffusive, superdiffusive, and ballistic motion (Figure 1F). DDM analysis of actin-microtubule composites corroborated the SPT results described above, with subdiffusive β values tracking with α values [5, 6]. However, we note that while the relation β=2/α can be used to directly compare dynamics measured via SPT and DDM, α derived from this relation may not match that determined from SPT, in particular for systems that display multiple dynamic regimes at different spatiotemporal scales.

FIGURE 1
www.frontiersin.org

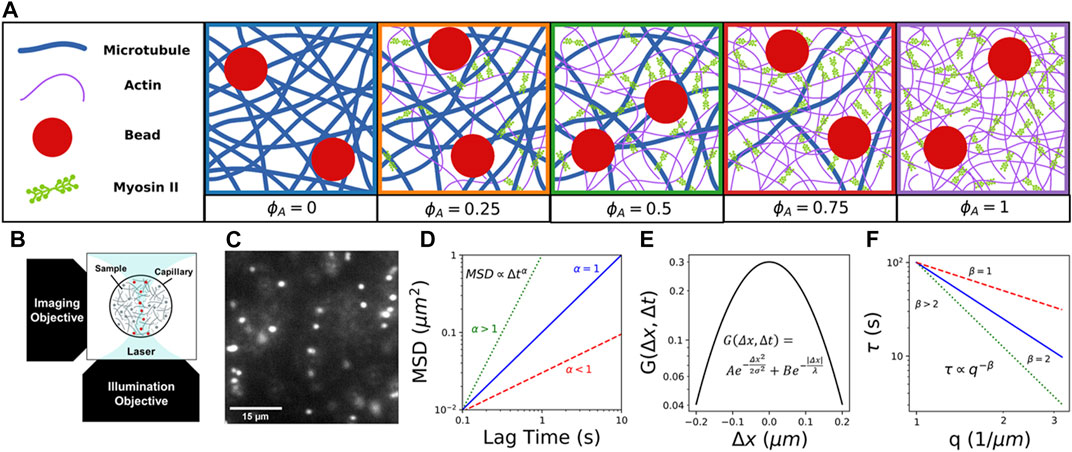
FIGURE 1. Combining light sheet microscopy with real-space single-particle tracking (SPT) and reciprocal-space differential dynamic microscopy (DDM) to characterize particle transport in active cytoskeletal composites. (A) We create composites of co-entangled microtubules (blue) and actin filaments (purple) driven out-of-equilibrium by myosin II minifilaments (green). We track the motion of embedded 1 μm beads (red) in composites with varying molar fractions of actomyosin, which we denote by the fraction of actin comprising the combined molar concentration of actin and tubulin (5.8 μM): ϕA=0.0.25,0.5,0.75,1. In all cases, the molar ratio of myosin to actin is fixed at 0.08. (B) Schematic of the light-sheet microscope we use for data collection, which provides the necessary optical sectioning to capture dynamics in dense three-dimensional samples. (C) Example frame from time-series of 1 μm beads embedded in a cytoskeleton composite, used to characterize particle transport in active crowded systems. (D) Cartoon of expected mean-squared displacements (MSD) of embedded particles versus lag time Δt, which we compute via single-particle tracking (SPT) and fit to a power law MSDtα to determine the extent to which particles exhibit normal Brownian diffusion (α=1, blue), subdiffusion (α<1, red), or superdiffusion (α>1, green). (E) Cartoon van Hove distribution G of x- and y-direction particle displacements Δd=ΔxΔy for a given lag time Δt computed from SPT trajectories. The distribution shown is described by a sum of a Gaussian and exponential function G(Δd,Δt)=AeΔd2/2σ2+Be|Δd|/λ, as is often seen in crowded and confined systems and those that display heterogeneous transport. (F) Cartoon of expected characteristic decorrelation times τ(q) as a function of wave number q, which we compute by fitting the image structure function computed from DDM analysis. We determine the scaling exponent β from the power-law τ(q)qβ to determine if transport is diffusive (β=2, blue), subdiffusive (β>2, green), or ballistic (β=1, red).

Similar SPT and DDM experiments demonstrated that crosslinking of actin and/or microtubules introduced bi-phasic transport with the subdiffusive scaling exponents dropping from α 0.5–0.7 to α 0.25–0.4 (depending on crosslinker type) after Δt 3 s, due to strong caging and reduced thermal fluctuations of filaments. At the same time, van Hove distributions were well fit to a sum of a Gaussian and exponential, and the non-Gaussianity parameter increased, indicating enhanced heterogeneity [5, 6, 8, 12, 17].

Numerous studies have also investigated transport in non-equilibrium cytoskeleton networks, in which activity is introduced via motor proteins, such as actin-associated myosin II and microtubule-associated kinesin [2, 10, 1821]. These studies have shown evidence of vesicle movement strongly tracking with actin movement, microtubule-dependent flow, and the simultaneous presence of subdiffusive and ballistic transport dynamics. While the majority of these active matter studies have been on systems of either actin or microtubules, recent studies have used DDM and optical tweezers microrheology to characterize the dynamics of actin-microtubule composites pushed out-of-equilibrium by myosin II minifilaments straining actin filaments [14, 22, 23]. These studies showed that active actin-microtubule composites exhibited ballistic-like (α2) contractile motion, rather than randomly-oriented diffusion or subdiffusion, with speeds that increased with increasing fraction of actin in the composites, due to increased composite flexibility [14, 23]. Myosin-driven contractile motion and restructuring was also reported to increase viscoelastic moduli and relaxation timescales and induce clustering and increased heterogeneity of the initially uniform mesh [22].

However, particle transport through active actin-microtubule composites–likely dictated by the complex combination of active processes, crowding, and interactions between mechanically distinct filaments—has remained largely unexplored. The majority of studies that have examined the combined effect of activity and crowding have been in vivo [1, 2429], where a large number of conflating variables that are difficult to tune make teasing out the effect of each contribution and mechanism highly non-trivial.

Here, we take advantage of the tunability of in vitro reconstituted cytoskeleton composites to systematically investigate the coupled effects of non-equilibrium activity, crowding, and heterogeneity on particle transport. We combine fluorescence light sheet microscopy (fLSM) with single-particle tracking (SPT) and differential dynamic microscopy (DDM) to examine the anomalous transport of micron-sized particles within active composites of myosin II minifilaments, actin filaments, and microtubules with varying molar fractions of actin and tubulin (Figure 1A). We leverage the optical sectioning and low excitation power of fLSM (Figure 1B) to capture particle trajectories with a temporal resolution of 0.1s for durations up to 400 s (Figure 1C). Using both SPT and DDM provides transport characterization over a broad spatiotemporal range that spans ∼10–1 -102 s and ∼10–1 - 10 μm. From measured SPT trajectories, we compute ensemble-averaged MSDs and associated anomalous scaling exponents α (Figure 1D), as well as corresponding distributions of particle displacements, i.e., van Hove distributions (Figure 1E), for varying lag times Δt. To expand the spatiotemporal range of our measurements and provide an independent measure of transport characteristics, we use DDM to analyze particle density fluctuations in Fourier space, and evaluate the power-law dependence of decorrelation times τ on wave vector q, i.e., τ(q)qβ (Figure 1F).

2 Materials and methods

2.1 Protein preparation

We reconstitute rabbit skeletal actin (Cytoskeleton, Inc. AKL99) to 2 mg/ml in 5 mM Tris–HCl (pH 8.0), 0.2 mM CaCl2, 0.2 mM ATP, 5% (w/v) sucrose, and 1% (w/v) dextran; porcine brain tubulin (Cytoskeleton T240) to 5 mg/ml in 80 mM PIPES (pH 6.9), 2 mM MgCl2, 0.5 mM EGTA, and 1 mM GTP; and rabbit skeletal myosin II (Cytoskeleton MY02) to 10 mg/ml in 25 mM PIPES (pH 7.0), 1.25 M KCl, 2.5% sucrose, 0.5% dextran, and 1 mM DTT. We flash freeze all proteins in single-use aliquots and store at -80˚C. We reconstitute the UV-sensitive myosin II inhibitor, (-)-blebbistatin (Sigma B0560) in anhydrous DMSO and store at -20˚C for up to 6 months. Immediately prior to experiments, we remove enzymatically dead myosin II from aliquots using centrifugation clarification, as previously described [14, 22].

2.2 Composite network assembly

We prepare actin-microtubule composites by mixing actin monomers, tubulin dimers and a trace amount of 1 µm diameter carboxylated microspheres (Polysciences) in PEM-100 (100 mM PIPES, 2 mM MgCl2, and 2 mM EGTA), 0.1% Tween-20, 1 mM ATP, and 1 mM GTP, and incubating at 37°C for 30 min to allow for polymerization of actin filaments and microtubules. We coat microspheres (beads) with AlexaFluor594 BSA (Invitrogen) to visualize the particles and prevent nonspecific interactions with the composite [30, 31]. We fix the combined molar concentration of actin and tubulin to c=cA+cT= 5.8 µM and the ratio of myosin to actin to R=0.08, and vary the molar fraction of actin in the composite (cA/c=ϕA) from ϕA= 0 to 1 in 0.25 increments (Figure 1A). To stabilize actin filaments and microtubules, we add an equimolar ratio of phalloidin to actin and a saturating concentration of Taxol (5 µM) [32, 33]. We add an oxygen scavenging system (45 μg/ml glucose, 0.005% β-mercaptoethanol, 43 μg/ml glucose oxidase, 7 μg/ml catalase) to inhibit photobleaching, and add 50 µM blebbistatin to control actomyosin activity.

2.3 Sample preparation and imaging

We pipet prepared composites into capillary tubing with an inner diameter of x=800 μm and length of y=10 mm, then seal with epoxy. Microspheres are imaged using a custom-built fLSM with a 10× 0.25 NA Nikon Plan N excitation objective, a 20× 1.0 NA Olympus XLUMPlanFLN detection objective, and an Andor Zyla 4.2 CMOS camera [5]. A 561 nm laser is formed into a sheet to image the microspheres, while a collimated 405 nm laser is used to deactivate the blebbistatin, thereby activating actomyosin activity. Each acquisition location is at least 1 mm away from the previous one to ensure that there is no myosin activity when the image acquisition begins. For SPT, we collect 15 time-series consisting of 2000 frames, each with a 1000×300 pixel (194×58 µm2) field of view (FOV), at 10 frames per second (fps). For DDM, we collect 3 time-series of 4000 frames, each with a 768×266 pixel (149×52 µm2) FOV, at 10 fps. The x and y axes of each FOV are aligned with the cross-section and length of the capillary sample chamber, respectively.

2.4 Single-particle tracking

We use the Python package Trackpy [34] to track particle trajectories and measure the x- and y- displacements (x,y) of the beads as a function of lag times t = 0.1 s–50 s. From the particle displacements, we use a custom-written Python script to calculate the time-averaged mean-squared displacement of the ensemble, MSD(t)=12([Δx(t)]2+[Δy(t)]2), from which we compute anomalous scaling exponents, α, via MSDΔtα for each Δt range in which we observe a single power-law. We compute MSDs for lag times Δt180 s, but limit our power-law fitting to Δt40 s for ϕA=0 and Δt100 s for ϕA=0.75 and 1, as noise from low statistics dominates the data at larger lag times for these composites.

Additionally, we compute van Hove probability distributions of particle displacements, G(Δd,Δt) (Figure 1E), where Δd=ΔxΔy, for 10 different lag times that span t=0.1 s to 15 s. Following previous works [57], we fit each distribution for a given lag time to a sum of a Gaussian and exponential function: G(Δd)=AeΔd2/2σ2+Be|Δd|/λ, where A is the amplitude of the Gaussian term, σ2 is the variance, B is the amplitude of the exponential term, and λ is the exponential decay constant.

2.5 Differential dynamic microscopy

We obtain the image structure function D(q,Δt), where q is the magnitude of the wave vector, following our previously described methods [12, 35]. We fit each image structure function, or DDM matrix, to the following function:

D(q,t)=A(q)[1exp[(t/τ(q))γ(q)]]+B(q)

where τ(q) is the density fluctuation decay time, γ is the stretching exponent, A is the amplitude, and B is the background [5, 6]. In practice, we fit each D(q,t) out to t= 100 s, beyond which noise due to low statistics dominates the signal. From the fits, we determine the q-dependent decay time τ(q), which is a measure of the timescale over which particle density fluctuations decorrelate over a given lengthscale l=2π/q. By fitting τ(q) to a power-law (i.e., τ(q)qβ) we determine the dominant mode of transport, with β= 2, >2, and <2, indicating normal Brownian diffusion, subdiffusion and superdiffusion, respectively. We fit τ(q) for q = 14μm1, with the (i) upper and (ii) lower bounds set by the (i) optical resolution of our setup and (ii) finite image size and t range over which we fit D(q,t), respectively. These effects lead to (i) unphysical upticks in τ(q) curves for q>4μm1 and (ii) q-independent plateaus for q<1 μm1 (Supplementary Figure S1).

We also examine the stretching exponent γ(q) that we extract from fitting D(q,t) as another transport metric, with γ(q)<1 indicative of confined and heterogeneous dynamics [5, 3638] and γ(q)>1 indicative of active ballistic-like motion [14, 3941]. Finally, we evaluate the q-dependence of γ(q) to ensure that the expected insensitivity to q, necessary for unequivocal determination and interpretation of the scaling exponent β, holds for all cases (Supplementary Figure S2).

3 Results and discussion

To elucidate the combined effects of non-equilibrium activity and steric hindrance on particle transport in crowded active matter, we leverage the tunability of reconstituted cytoskeleton composites [42] and the power of coupling real-space (SPT) and reciprocal space (DDM) transport analysis, to robustly characterize particle transport as a function of active substrate content. Specifically, we tune the composition of actomyosin-microtubule composites to display a wide range of transport characteristics by varying the molar fraction of actomyosin, which we denote by the molar actin fraction ϕA, keeping the myosin molarity fixed at 8% of ϕA (Figure 1A, Methods).

In Figure 2A, we plot the ensemble-averaged MSD as a function of lag time Δt for particles diffusing in composites of varying ϕA. While ϕA=0 (no actomyosin) exhibits subdiffusive transport across the entire Δt range, with α0.67, all ϕA> 0 composites display multi-phasic transport which is subdiffusive (α1<1) at short Δt and superdiffusive (α2>1) at long Δt. To more clearly show the transition from subdiffusion to superdiffusion, we plot MSD/Δt versus Δt (Figure 2B), which is a horizontal line for normal Brownian diffusion with the Δt-independent magnitude proportional to the diffusion coefficient. Positive and negative slopes correspond to superdiffusion and subdiffusion, respectively, with MSD/ΔtΔt1 indicating ballistic motion. Corresponding MSD/Δt magnitudes are proportional to Δt-dependent transport coefficients. While all ϕA>0 composites exhibit similar general trends with Δt, the lag time at which the dynamics transition from subdiffusive to superdiffusive, along with the degree to which α1 and α2 deviate from 1, depend non-trivially on ϕA. Moreover, as clearly seen in Figure 2C, while α values for active composites (ϕA>0) transition to superdiffusive at longer lag times, the magnitudes of the transport coefficients remain nearly an order of magnitude smaller than that of the inactive network (ϕA= 0) at any given Δt.

FIGURE 2
www.frontiersin.org

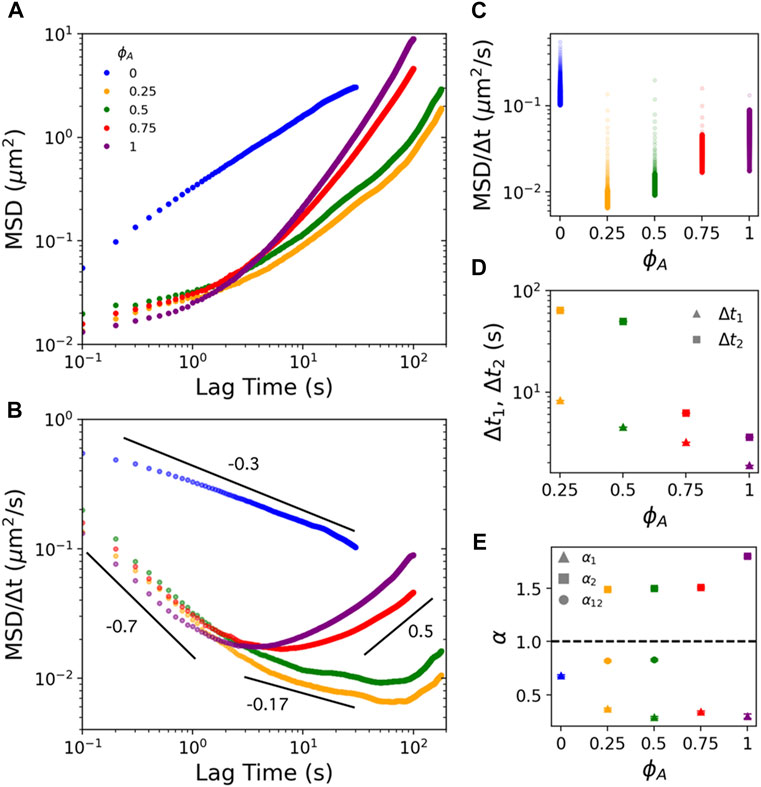
FIGURE 2. Actomyosin activity in actin-microtubule composites endows multi-phasic particle transport marked by pronounced subdiffusion at short lag times and superdiffusion at long lag times. (A) Mean-squared displacements (MSD) plotted versus lag time Δt for myosin-driven actin-microtubule composites with molar actin fractions of ϕA=0 (blue), 0.25 (gold), 0.50 (green), 0.75 (red), and 1 (purple). Fits of the data to MSDΔtα over different Δt ranges (shown in (B)) determine the anomalous scaling exponents αi that describe the dynamics (see Figure 1). (B) Mean-squared displacements scaled by lag time (MSD/Δt) plotted versus lag time Δt delineate regions of subdiffusion (negative slopes) and superdiffusion (positive slopes). Color coding is according to the legend in (A). Black lines indicate fits to MSDΔtα over the short (Δt<Δt1), long (Δt>Δt2) and intermediate (Δt1<t<Δt2) time regimes where each curve is well-fit by a single power law. (C) Data shown in B plotted versus actin fraction ϕA, with all MSD/Δt values for each ϕA plotted along the same vertical, with the gradient indicating increasing Δt from light to dark. The magnitude of each data point is proportional to a transport rate, with higher values indicating faster motion. (D) Lag time at which each composite transitions out of initial subdiffusive transport (Δt1) and transitions into superdiffusivity (Δt2). (E) Anomalous scaling exponents αi derived from fits shown in (B) for Δt<Δt1 (i=1), Δt>Δt2 (i=2), and (Δt1<t<Δt2)(i=1,2). Dashed line at α=1 represents scaling indicative of normal Brownian diffusion. Values above and below the line indicate superdiffusion and subdiffusion, respectively. Note that only ϕA=0.25 and 0.5 composites exhibit an intermediate α1,2 regime. For both (C) and (D) error bars indicate standard error of the mean. Color-coding in all subfigures matches the legend in (A).

To evaluate the ϕA-dependence of the multi-phasic behavior, we first compute the lag times at which composites transition out of initial subdiffusive scaling, denoted as Δt1, and transition into superdiffusive scaling, denoted as Δt2. We note that the MSDs for ϕA= 0.75 and 1 both exhibit a continuous transition from initial subdiffusion (quantified by α1) to a final superdiffusive regime (quantified by α2), seen as a smooth concave-up curve between the two power-law regimes. Conversely, MSDs for ϕA= 0.25 and 0.5 exhibit an extended power-law regime in this transition with weakly subdiffusive scaling exponent α12. To quantify Δt1, we compute the largest lag time for which linear regression of logMSD versus logΔt over the range Δt[0.1s,Δt1] yields R2 > 0.99. We define Δt2 as the lag time at which MSD/Δt exhibits a local minimum (i.e. where α crosses over from <1 to >1) (Figure 2C). We find that both timescales decrease with increasing ϕA as does the separation between the timescales (Δt2Δt1), suggesting that the rate of particle motion mediated by directed motor-driven network dynamics increases with increasing ϕA. In other words, the time it takes for the active dynamics to be ‘felt’ by the particles, driving them out of their confined subdiffusive motion, decreases with increasing ϕA.

To understand this phenomenon, we consider that active ballistic transport would only be detectable at timescales in which the network motion can move a bead more than the minimum resolvable displacement: Δta(100nm)/(networkspeed). Using reported speed values of v2.285 nm/s for similar myosin-driven composites [23], we compute Δta(100nm)/v150s, aligning with our Δt1 and Δt2 values, and thus corroborating that the deviation from sub-diffusion and transition to superdiffusion is due to myosin-driven ballistic motion. Moreover, the previously reported speeds generally decreased with decreasing ϕA, such that Δta should increase as ϕA decreases, just as we see in Figure 2B.

To determine the extent to which motor-driven transport and confinement contribute to the particle dynamics, we next evaluate the anomalous scaling exponents in the short, intermediate, and long Δt regimes by performing power-law fits to the MSDs in each regime (Figures 2B,E). Surprisingly, the scaling exponents in the Δt<Δt1 regime for all active composites (ϕA>0) are markedly smaller (more subdiffusive) than the inactive composite (ϕA=0), with ϕA-dependent values of α10.290.37 compared to α10.68 for the ϕA=0 network. To understand the decrease in α1 with increasing ϕA for the active composites, as well as the unexpected ∼2-fold reduction in α1 for active composites, we turn to previous studies [5, 6], that reported that, in the absence of any crosslinking, steady-state actin-microtubule composites exhibit subdiffusion with scaling exponents that decrease from α0.82 to α0.56 as ϕA increases from 0 to 1. This monotonic ∼30% decrease with increasing ϕA, similar to the ∼25% decrease we observe with increasing ϕA, was suggested to arise from increased composite mobility that entrains the bead motion as rigid microtubules are replaced with semiflexible actin filaments [6, 12]. This mobility is paired with a decreasing mesh size as ϕA increases, which, in turn, increases composite viscoelasticity and particle confinement, both of which contribute to decreasing α [6].

To understand the lower α1 values we measure, compared to those previously reported for steady-state composites, we look to previous studies on ϕA=0.5 actin-microtubule composites with varying types of static crosslinking. In these studies, subdiffusion is much more extreme (α0.33) when actin filaments are crosslinked to each other compared to no crosslinking (α0.64) [5]. Taken together, our results suggest that the ∼2-fold reduction in α1 between ϕA=0 and ϕA>0 composites likely arises from myosin motors acting as static crosslinkers on timescales shorter than the timescale over which they can actively translate the composite. As described above, myosin acting as a static crosslinker for Δt<Δt1 is consistent with previously reported speeds for myosin-driven composites [5, 6], as well as reported actomyosin turnover rates [24]. The weak decrease in α1 with increasing ϕA likely arises from the decreasing mesh size and increasing mobility of the network as ϕA increases [43], as described above.

Examining the long-time regime, Δt>Δt2, our results show that the scaling exponent α2 is largely insensitive to ϕA for all composites (i.e., 0<ϕA<1) with an average value of α21.5, only modestly lower than α21.8 measured for ϕA=1. However, the lag time at which superdiffusive α2 scaling emerges is an order of magnitude larger for ϕA= 0.25 and 0.5 composites compared to ϕA>0.5. Moreover, ϕA= 0.25 and 0.5 composites display nearly identical intermediate subdiffusive scaling regimes, absent for ϕA> 0.5, with an average scaling exponent of α120.83±0.2. Taken together, these results suggest that the timescale over which motor-driven dynamics dominates particle transport scales with the fraction of active substrate [23], while the superdiffusive signature of the active transport is controlled by the motor:substrate ratio (which we hold fixed across composites).

To shed further light on the mechanisms underlying the anomalous transport shown in Figure 2, we compute van Hove distributions G(Δd,Δt), where Δd=ΔxΔy, for two decades of lag times (Δt=0.115s) (Figure 3A). From the distributions, we first compute anomalous scaling exponents α, to corroborate our MSD analysis, by recalling that the full width at half maximum, FWHM, for a Gaussian distribution scales with the standard deviation σ as FWHM=22ln2σ. Because σ2d2 by definition, and MSD(Δt)(d(Δt))2tαi, we determine αi by computing the FWHM for each distribution and fitting the Δt-dependent values to the power-law FWHM(Δt)(Δt)αi/2 (Figure 3B) [7, 44]. As shown in Figures 3B,C, FWHM(Δt) for ϕA=0 fits well to a single power-law, with α0.7, nearly indistinguishable from that computed from the MSD, across the entire Δt range. Conversely, informed by the multi-phasic MSD scaling we observe for active composites (Figure 2C), we fit FWHM(Δt) for each active composite to separate power-law functions over short (0.15s<Δt<1s) and long (1s<Δt<15s) lag times, relative to the average Δt1 we determine from MSD fits. Further, similar to the ϕA-dependence of α1 and α2 values determined from MSDs, the scaling exponents determined from FWHM, increase with increasing ϕA, with α1 (for Δt<1s) increasing from ∼0.62 to ∼0.85, similar to values reported for steady-state actin-microtubule composites [6], and α2 (for Δt>1s) spanning from subdiffusive to superdiffusive. Higher α1 values compared to those determined from MSDs are likely due to the lower Δt resolution in FWHM fitting and the single Δt value used to divide the two regimes. Likewise, the lower α2 values for ϕA= 0.25 and 0.5 compared to those measured from MSDs are a result of treating all Δt>Δt1 data as obeying a single power-law rather than separate α12 and α2 scaling.

FIGURE 3
www.frontiersin.org

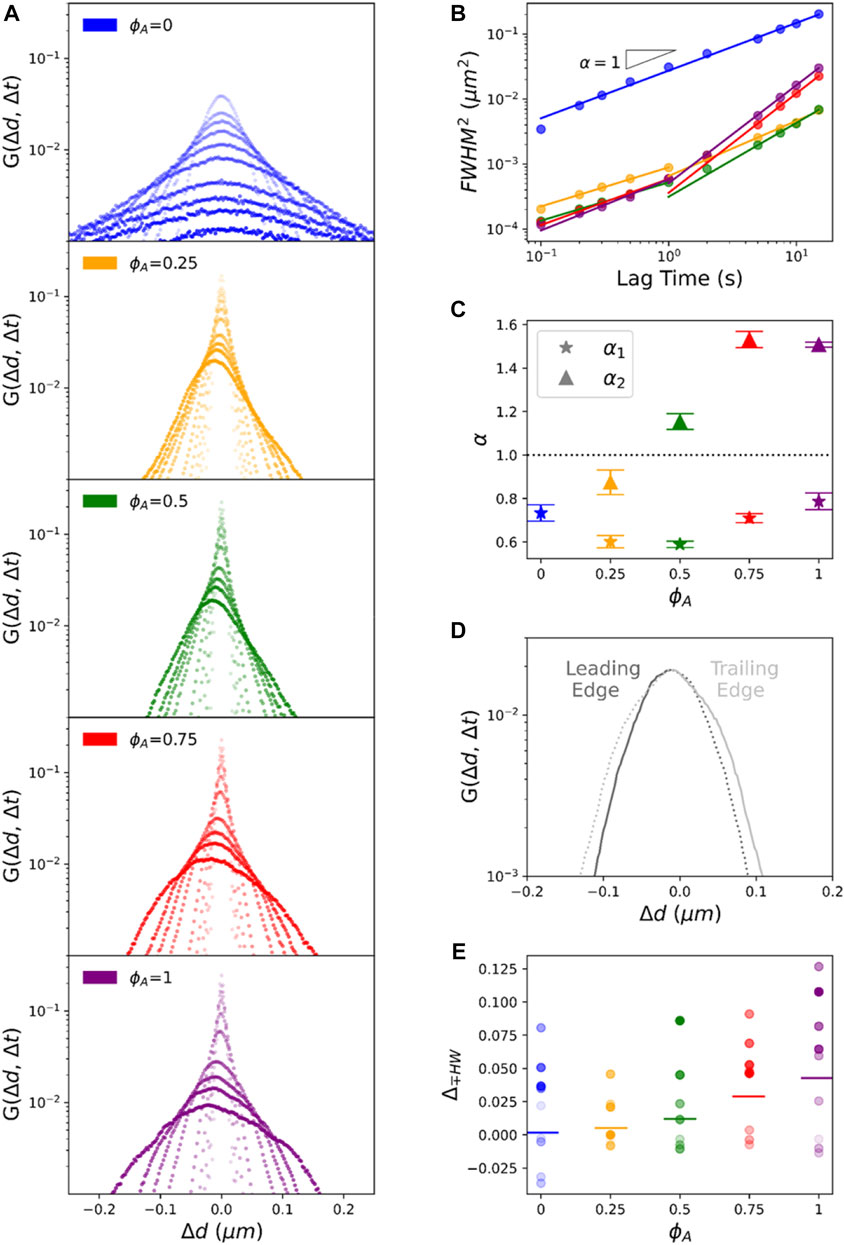
FIGURE 3. Asymmetric non-Gaussian van Hove distributions reveal a combination of heterogeneous subdiffusion and advective transport of particles in active composites. (A) van Hove distributions G(Δd,Δt) of particle displacements Δd=ΔxΔy, measured via SPT, for lag times Δt=0.1,0.2,0.3,0.5,1,2,3,5,10,15s denoted by the color gradient going from light to dark for increasing Δt. Each panel corresponds to a different composite demarked by their ϕA value with color-coding as in Figure 2. (B) The square of the full width at half-maximum (FWHM)2 versus lag time Δt for each composite shown in (A). Solid lines are fits to (FWHM)2Δtαi. For ϕA>0 composites we fit short (Δt ≤ 1 s) and long (Δt ≥ 1 s) lag time regimes separately. (C) The scaling exponents α as functions of ϕA determined from the fits shown in B, where α1 (stars) and α2 (triangles) correspond to scalings for the short and long Δt regimes, respectively. The dashed horizontal line denotes scaling for normal Brownian diffusion. (D) A sample G(Δd,Δt) distribution (ϕA=0.75 at Δt=10s) showing the asymmetry about the mode value Δdpeak. We divide each distribution into a leading edge (dark grey, displacements of the same sign as Δdpeak and greater in magnitude) and the trailing edge (light grey, the remaining part of the distribution). To clearly demonstrate the asymmetry, we mirror each edge about Δdpeak using dashed lines. (E) The fractional difference of the half-width at half maximum HWHM of the trailing (-) edge from the leading (+) edge, (ΔHW=HWHMHWHM+)/HWHM+), for each ϕA and Δt. Color coding and gradient indicate ϕA and Δt, respectively, as in (A). Horizontal bars through each distribution denote the mean.

While our analysis described above assumes Gaussian distributions, Figure 3A shows that nearly all distributions have distinct non-Gaussian features similar to those reported for steady-state actin-microtubule composites [5, 7]. In particular, G(Δd,Δt) distributions for the inactive network (ϕA=0) exhibit pronounced exponential tails at large displacements. This non-Gaussianity, seen in other crowded and confined soft matter systems [7], is a signature of heterogeneous transport and can also indicate caging and hopping between cages.

The distributions for active composites are even more complex, with asymmetries and peaks at Δd0 (Figure 3A), not readily predictable from our MSD analysis. The first interesting feature we investigate is the non-zero mode value Δdpeak that increases in magnitude with increasing Δt, indicating directed ballistic-like motion, thereby corroborating our superdiffusive scaling exponents. Perhaps less intuitive is the robust asymmetry between the ‘leading (+) edge’ and ‘trailing (-) edge’ of each distribution, which we define by splitting each distribution about its peak, Δdpeak. Specifically, the leading edge is the part of the distribution that has displacements of the same sign as Δxpeak and greater in magnitude, while the remaining part is the trailing edge (Figure 3D). We observe that for most distributions the leading edge appears more Gaussian-like while the trailing edge exhibits pronounced large-displacement ‘tails’. To broadly quantify this asymmetry, we evaluate the half-width at half-maximum (HWHM) for the leading (+) and trailing (-) edges of each distribution and compute the percentage increase in HWHM for the trailing versus leading edge: ΔHW=(HWHMHWHM+)/HWHM+ (Figure 3E). We find that ΔHW is positive for all active composites and increases with increasing ϕA, demonstrating that the asymmetry is a direct result of active composite dynamics which contribute more to the transport as the actomyosin content increases.

We also note that the asymmetry shown in Figure 3A is always in the negative direction (to the left). To determine the directionality of this asymmetry we evaluate the distributions of Δx and Δy values separately (Supplementary Figure S3), which show that the asymmetry for G(Δy,Δt) is more pronounced and negative compared to the smaller positive anisotropy seen in G(Δx,Δt). This bias is likely due to the geometry of the sample chamber that has a y-direction length that is >10× the x-direction width of the chamber.

To determine if this directionality is a reproducible microscale bias or is an ensemble result of averaging over trials with positive and negative anisotropies, we evaluate the van Hove distributions for each trial of the ϕA=1 case (that exhibits the most pronounced asymmetry) (Supplementary Figure S4). We observe that nearly all G(Δx,Δt) and G(Δy,Δt) distributions skew to +x and y, respectively, with G(Δy,Δt) asymmetries being more pronounced, such that G(Δd,Δt) skews in the negative direction. This systematic effect corroborates our understanding that the directional bias is due to the sample chamber geometry that provides more freedom in the y-direction for the composite to restructure and flow.

To more quantitatively characterize the rich transport phenomena revealed in Figure 3, we first fit each G(Δd,Δt) to a sum of a Gaussian and an exponential (see Methods), as done for steady-state cytoskeleton composites [57]. Figure 4A compares the distributions and their fits for all composite formulations at Δt=0.3s (top panel) and 10s (bottom panel), and Figure 4B displays zoom-ins of the corresponding leading and trailing edges. As shown, while this sum describes the inactive network distributions reasonably well, it overestimates leading edge displacements and underestimates trailing edge displacements of the active networks (Figure 4B). This asymmetry suggests that the leading edges are more Gaussian-like and the trailing edges are more exponential-like. To account for this asymmetry, we fit each half of each distribution separately to a one-sided sum of a Gaussian and exponential and evaluate the relative contributions from the Gaussian and exponential terms. As detailed in the Methods, we denote the amplitude of the Gaussian term and exponential term as A and B, respectively, such that their relative contributions are a=A/(A+B) and b=B/(A+B).

FIGURE 4
www.frontiersin.org

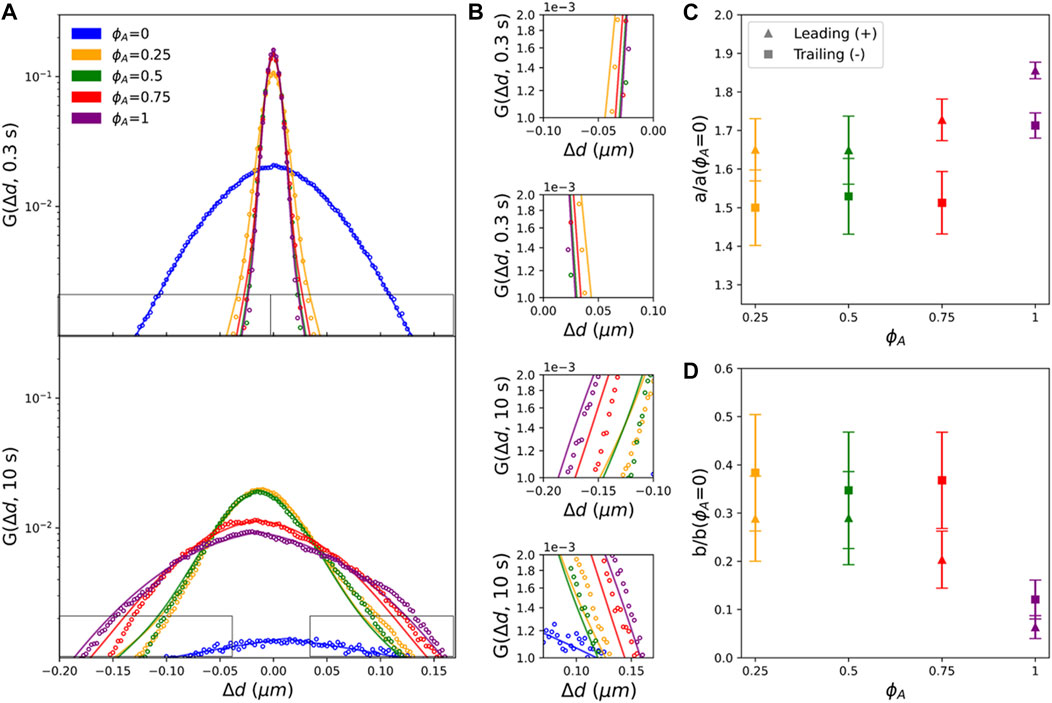
FIGURE 4. Actomyosin activity reduces heterogeneous non-Gaussian diffusivity and endows Gaussian-like advective transport. (A) Comparing van Hove distributions of composites with different ϕA (see legend) at lag times of Δt=0.3s (top) and Δt=10s (bottom). Color-coded solid lines are fits of each distribution to the sum of a Gaussian and an exponential: G(Δd)=AeΔd22σ2+Be|Δd|λ. Black rectangles indicate regions of the distributions that are shown zoomed-in in (B). (C) Fractional amplitude of the Gaussian term in each fit, a=A/(A+B), normalized by the corresponding value for ϕA=0. Fits are performed separately for the leading (+, triangles) and trailing (-, squares) edges of each distribution. Data shown are the averages and standard deviations across all lag times for each ϕA. (D) Fractional amplitude of the exponential term in each fit, b=A/(A+B), normalized by the corresponding value for ϕA=0. Fits are performed separately for the leading (+, triangles) and trailing (-, squares) edges of each distribution. Data shown are the averages and standard deviations across all lag times for each ϕA.

As shown in Figures 4C,D, in which a and b are normalized by the corresponding ϕA= 0 value and plotted for each ϕA, active composites are more Gaussian-like (a/a(ϕA=0)>1) and less exponential (b/b(ϕA=0)<1) than the inactive system for both leading and trailing edges. This result suggests that the active processes that induce contraction and flow of the composites likewise reduce transport heterogeneity and intermittent hopping, possibly by promoting mixing and advection. Consistent with this interpretation is the observation that the Gaussian contribution a increases with increasing ϕA and is consistently larger for the leading edge, which consists of displacements oriented with the direction of the myosin-driven composite motion (Figure 4C).

Conversely, the increased contribution from the exponential term for the trailing edge, implies that displacements comprising these exponential tails are dominated by heterogeneous transport modes such as hopping between heterogeneously distributed cages [6, 7]. To better understand this effect, we recall that particle displacements comprising the trailing edge are lagging behind the bulk translational motion of the composite. As the composite moves and restructures, a fraction of the particles remain caged in the moving composite and thus move along with it, corresponding to displacements comprising the leading edge, whereas a fraction of the particles are squeezed out or hop out of composite cages and into new ‘trailing’ cages. It is also likely that as the composite contracts and forms more heterogeneous structures and larger open voids that characteristic ‘hopping’ displacements, as well as displacements withing cages, may increase and become more heterogeneous, thereby enhancing exponential tails.

To expand the range of length and time scales over which we probe the non-equilibrium transport, and provide an independent measure of the dynamics, we complement our real-space SPT analysis with Fourier-space DDM analysis, as described in the Methods and previously [5, 6, 14]. Briefly, we compute the radially-averaged image structure function D(q,Δt) of the Fourier transform of image differences as a function of wave vector q and lag time Δt. From fits of D(q,Δt) to a function with a stretched exponential term (see Methods, Figure 5A), we determine the q-dependent characteristic decay time τ(q) and stretching exponent γ(q) for each composite (Figure 5), which characterize the dynamics. τ(q) typically exhibits power-law scaling τ(q)qβ where β is related to the anomalous scaling exponent α via β=2/α, such that β>2,β=2, β<2andβ=1 correspond to, respectively, subdiffusive, normal diffusive, superdiffusive, and ballistic motion. Stretching exponents γ(q) are typically independent of q (see Supplementary Figure S2), with q-averaged values of γ= 1 for normal Brownian motion, γ<1 for crowded and confined systems [15, 40] and γ>1 for active transport [15, 45].

FIGURE 5
www.frontiersin.org

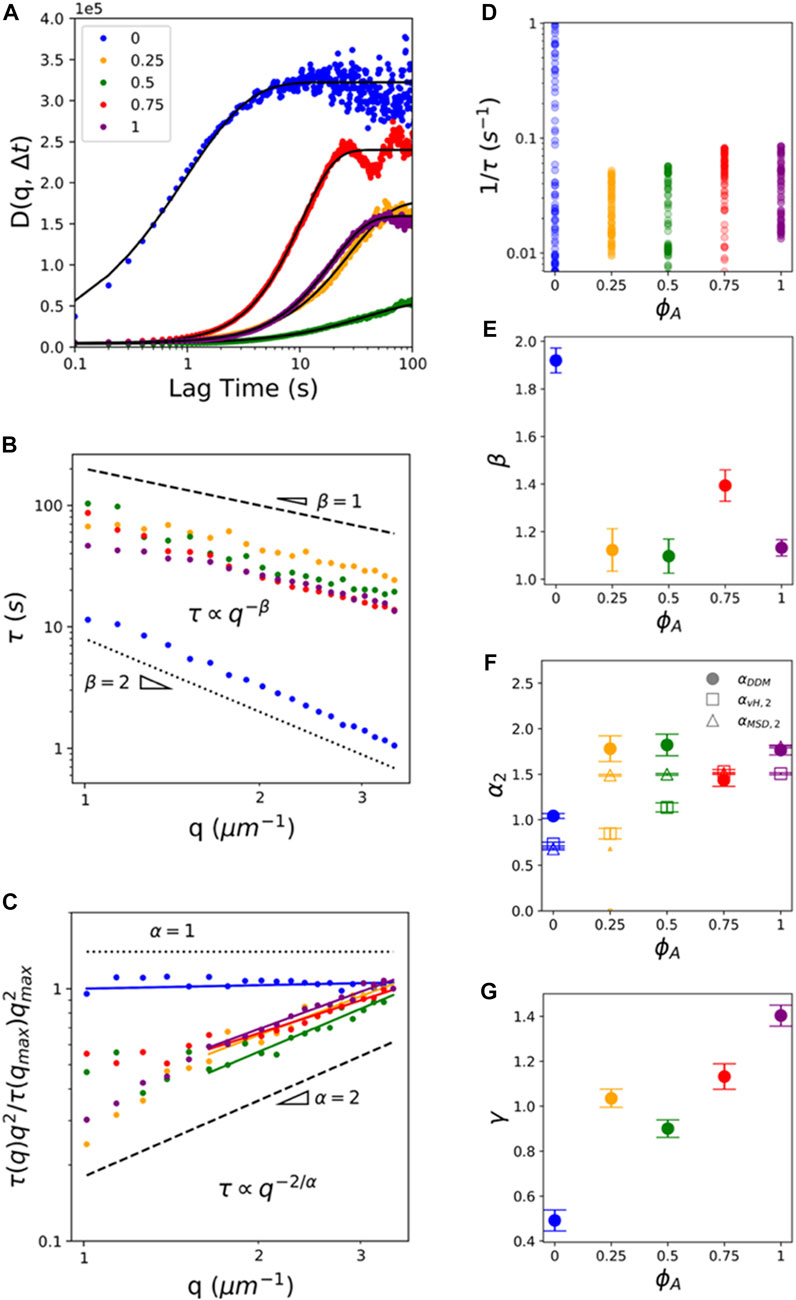
FIGURE 5. DDM analysis reveals ballistic-like transport of particles entrained in active composites at mesoscopic spatiotemporal scales. (A) Sample image structure functions D(q,Δt) for composites with actin fractions ϕA indicated in the legend. All curves shown are evaluated at q=3.92μm1, and solid black lines are fits to the data to determine corresponding q-dependent decay times τ(q) and stretching exponents γ, as described in Methods. (B) Decay times τ(q) for each composite shown in (A). Dashed and dotted black lines show scaling τ(q)qβ for ballistic (β=1) and diffusive (β=2) transport. (C) τ(q)×q2, normalized by τ(qmax)×(qmax)2, for the data shown in (B). Horizontal dotted line and unity-sloped dashed line correspond to scaling indicative of normal diffusion (α=2/β=1) and ballistic motion (α=2/β=2). Color-coded solid lines correspond to power-law fits, with the corresponding exponents β and α shown in (E) and (F). For ϕA>0 composites, the fitting range is truncated to q>1.5μm1 where a single power-law is observed. (D) Scatter plot of 1/τ(q), a measure of the transport rate, for all measured q values for each ϕA. Color coding and gradient indicate ϕA and q, respectively, with light to dark shades of each color indicating increasing q values. (E) DDM scaling exponents β determined from fits shown in (C). (F) Anomalous scaling exponents α2 determined from τ(q) fits (filled circles, αDDM=2/β), as well as the large-Δt regime fits of the MSDs (open triangles, αMSD,2) and van Hove distributions (open triangles, αvH,2) measured via SPT (see Figures 2, 3). Error bars indicate 95% confidence intervals of fits. (G) Stretching exponent γ(q), averaged over all q values, for each composite ϕA, with error bars indicating standard error.

As shown in Figure 5B, τ(q) curves for all active composites follow scaling indicative of superdiffusive or ballistic transport while the ϕA=0 system more closely follows diffusive scaling. Further, τ(q) for ϕA=0 is an order of magnitude lower than for all active composites, indicating that particle transport is faster for the inactive composite, in line with our results shown in Figure 2C, despite the displacements exhibiting diffusive rather than ballistic-like motion. This effect can be more clearly seen in Figure 5D, which displays the q-dependent distribution of τ(q)1 values, a measure of dynamic decorrelation rates, for each ϕA. As shown, τ1 values for ϕA=0 are an order of magnitude larger than those for ϕA>0 composites. Figure 5D also shows that decorrelation rates in active composites increase modestly with increasing ϕA suggesting that transport is dictated primarily by active restructuring and flow, rather than crowding and confinement, which increases as actomyosin content increases. The lack of subdiffusive scaling or crossovers from sub-to super-diffusive dynamics for active composites (as our SPT analysis shows) can be understood as arising from the larger length and time scales DDM probes. Namely, DDM spans lengthscales of l=2π/q1.66.28μm and timescales of τ20100s (Figure 5A) compared to the ∼ 0.11.5μm and 0.1100s length and timescales accessible to SPT. As we describe in Methods, the lower bound on measurable lengthscales (upper bound on q) for DDM is set by the optical resolution limit of our setup, which is circumvented in SPT by using sub-pixel localization algorithms. At the same time, SPT is bounded at larger spatiotemporal scales by the duration of individual bead trajectories. The different scales that DDM and SPT are able to accurately probe is exactly the reason we use them both to fully characterize the dynamics of our system.

To better visualize differences in τ(q) scaling between composites we plot τ(q)×q2 normalized by τ(qmax)×(qmax) (Figure 5C). Diffusive transport manifests as a horizontal line, as we see for ϕA=0, while ballistic-like motion follows a power-law scaling of 1, which roughly describes the ϕA>0 curves. To quantify the DDM scaling exponent β that describes the dynamics, we fit each τ(q) curve to a power-law (i.e., τ(q)qβ) (Figures 5C,E). For the active composites, we restrict our fitting range to q>1.5μm1, in which a single power-law is observed. For smaller q values (larger length and time scales), we note that ϕA=0.25 and 1 composites exhibit roughly ballistic motion whereas ϕA=0.5 and 0.75 exhibit roughly diffusive dynamics (Figure 5C) [15, 16]. However, we restrict further quantification and interpretation of this small-q regime as it comprises relatively few data points and low statistics. Over the range that we fit our data, we find that β2.02 for the inactive composite, indicative of diffusive dynamics, whereas active composites exhibit near-ballistic values of β1.031.26, which are largely independent of ϕA, similar to our α2 values measured via SPT (Figure 2E). To directly compare β values to the anomalous scaling exponents α that we determine from SPT (Figure 2E, Figure 3E), we plot αDDM=2/β (Figures 5C,F) with the α2 values we determined from the MSDs and van Hove distributions in the large Δt regime (>Δt2), which we denote as αMSD,2 and αvH,2. Scaling exponents determined from all three methods are broadly similar, with active composites displaying larger α values than the ϕA=0 system. We attribute small differences between αDDM,αvH,2, and αMSD,2, which are most apparent for ϕA= 0.25 and 0.5, to the different timescales probed by each method. Namely, all systems tend to subdiffusion at short lag times and free diffusion or ballistic motion at large lag times. As such, we expect αvH,2 which spans the shortest lag times (Δt=115s) to be the lowest while αDDM which spans the largest timescales to be the largest, which is indeed what we measure. Likewise, we expect ϕA=0 to exhibit subdiffusion over short timescales (measured via SPT) and tend towards free diffusion at larger timescales (measured via DDM), as shown in Figure 5F.

Finally, to shed light on the competing contributions from motor-driven dynamics versus confinement and crowding to transport at larger spatiotemporal scales, we evaluate the dependence of the stretching exponent γ on ϕA. Figure 5G shows that transport in the inactive network is described by γ0.79±0.02, over the q range we examine (Supplementary Figure S2), indicating that confinement dominates over active dynamics (i.e., γ<1), whereas all ϕA>0 composites exhibit γ>1, indicative of transport governed largely by active dynamics. Moreover, γ generally increases as the actomyosin fraction increases, corroborating the dominant role that active composite dynamics plays in the rich transport phenomena we reveal [15].

We note that while other active systems display a return to Gaussian dynamics at long timescales (e.g., 46), we find no evidence of this return due to the relatively slow active network dynamics compared to other active systems. However, our inactive system (ϕA=0) exhibits Gaussian dynamics at the larger timescales probed by DDM, indicating that the long-time ballistic dynamics we measure in the active composites (ϕA>0) are indeed due to motor activity and not from drift, flow or other experimental artifacts or bias.

4 Conclusion

Here, we couple real-space SPT and Fourier-space DDM to characterize particle transport across three decades in time (∼10–1–102 s) and two decades in space (∼10–1—10 μm) in biomimetic composites that exhibit both pronounced crowding and confinement as well as active motor-driven restructuring and flow. Using our robust approach, we discover and dissect novel transport properties that arise from the complex interplay between increasing activity and confinement as the actomyosin fraction increases. Myosin motors induce ballistic-like contraction, restructuring and flow of the composites, leading entrained particles to exhibit similar superdiffusive, advective and Gaussian-like transport. Conversely, steric entanglements, connectivity and slow thermal relaxation of cytoskeletal filaments mediate heterogeneous, subdiffusive transport of confined particles.

Figure 6 summarizes and compares the key metrics we present in Figures 25 that characterize these complex transport properties. Importantly, as highlighted in Figure 6, while there is clear difference between the inactive and active networks for nearly all of the transport metrics we present, we emphasize that there are very few clear monotonic dependences on ϕA for the active composites. This complexity is a direct result of the competition between motor-driven active dynamics, crowding and connectivity—all of which increase with increasing actomyosin content. These intriguing transport characteristics have direct implications in key cellular processes in which actomyosin and microtubules synergistically interact, such as cell migration, wound healing, cytokinesis, polarization and mechano-sensing [23]. Moreover, our robust measurement and analysis toolbox and tunable active matter platform, along with the complex transport phenomena we present, are broadly applicable to a wide range of active matter and biomimetic systems of current intense investigation.

FIGURE 6
www.frontiersin.org

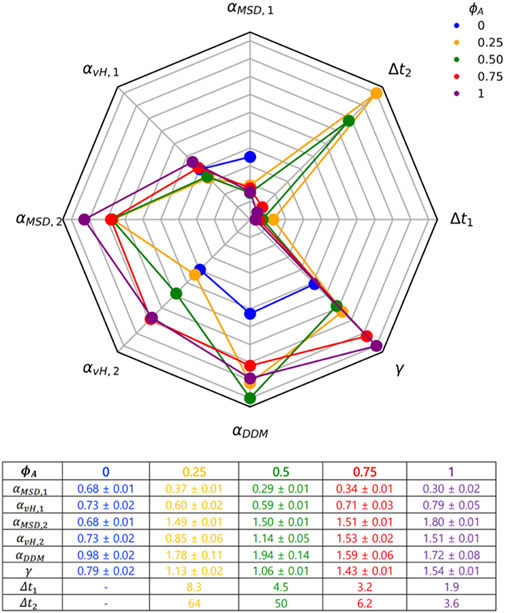
FIGURE 6. A robust suite of metrics reveals complex scale-dependent transport resulting from competition between motor-driven active dynamics, crowding and network connectivity. The 8-variable spider plot shows how the key metrics we use to characterize transport depend on ϕA (color-code shown in legend). A greater distance from the center signifies a larger magnitude. α values determined from DDM (αDDM), SPT MSDs(αMSD,1,αMSD,2,αvH,1,αvH,2 and SPT van Hove distributions (αvH,1,αvH,2) are scaled identically for direct comparison, as are the two timescales determined from MSD s (Δt1,Δt2). The stretching exponent γ is scaled independently. The table provides the values with error for each metric plotted.

Data availability statement

The datasets generated and analyzed for this manuscript are available from the corresponding author on reasonable request.

Author contributions

JS analyzed and interpreted the data and wrote the paper; JG collected and helped analyze the data; SK and BL helped analyze data and prepare figures; RM conceived and guided the project, developed analysis code, helped analyze and interpret the data, and helped write the paper; RR-A conceived and guided the project, interpreted the data, and wrote the paper.

Funding

This work was supported by National Institutes of Health R15 Awards (R15GM123420, 2R15GM123420-02) to RMR-A and RJM, William M. Keck Foundation Research Grant to RMR-A, and NSF RUI Award (DMR-2203791) to JYS.

Acknowledgments

We thank AX, NB, and JK for help with data analysis and visualization. We thank GL for help with composite design. We thank DA for insightful discussions.

Conflict of interest

The authors declare that the research was conducted in the absence of any commercial or financial relationships that could be construed as a potential conflict of interest.

Publisher’s note

All claims expressed in this article are solely those of the authors and do not necessarily represent those of their affiliated organizations, or those of the publisher, the editors and the reviewers. Any product that may be evaluated in this article, or claim that may be made by its manufacturer, is not guaranteed or endorsed by the publisher.

Supplementary material

The Supplementary Material for this article can be found online at: https://www.frontiersin.org/articles/10.3389/fphy.2022.1055441/full#supplementary-material

References

1. Mogre SS, Brown AI, Koslover EF. Getting around the cell: Physical transport in the intracellular world. Phys Biol (2020) 17:061003. doi:10.1088/1478-3975/aba5e5

PubMed Abstract | CrossRef Full Text | Google Scholar

2. Brangwynne CP, Koenderink GH, MacKintosh FC, Weitz DA. Intracellular transport by active diffusion. Trends Cel Biol (2009) 19:423–7. doi:10.1016/j.tcb.2009.04.004

PubMed Abstract | CrossRef Full Text | Google Scholar

3. Burute M, Kapitein LC. Cellular logistics: Unraveling the interplay between microtubule organization and intracellular transport. Annu Rev Cel Dev Biol (2019) 35:29–54. doi:10.1146/annurev-cellbio-100818-125149

PubMed Abstract | CrossRef Full Text | Google Scholar

4. Gardel ML, Schneider IC, Aratyn-Schaus Y, Waterman CM. Mechanical Integration of actin and Adhesion dynamics in cell migration. Annu Rev Cel Dev Biol (2010) 26:315–33. doi:10.1146/annurev.cellbio.011209.122036

PubMed Abstract | CrossRef Full Text | Google Scholar

5. Anderson SJ, Garamella J, Adalbert S, McGorty RJ, Robertson-Anderson RM. Subtle changes in crosslinking drive diverse anomalous transport characteristics in actin–microtubule networks. Soft Matter (2021) 17:4375–85. doi:10.1039/d1sm00093d

PubMed Abstract | CrossRef Full Text | Google Scholar

6. Anderson SJ, Matsuda C, Garamella J, Peddireddy KR, Robertson-Anderson RM, McGorty R. Filament Rigidity Vies with mesh size in determining anomalous diffusion in cytoskeleton. Biomacromolecules (2019) 20:4380–8. doi:10.1021/acs.biomac.9b01057

PubMed Abstract | CrossRef Full Text | Google Scholar

7. Wang B, Kuo J, Bae SC, Granick S. When Brownian diffusion is not Gaussian. Nat Mater (2012) 11:481–5. doi:10.1038/nmat3308

PubMed Abstract | CrossRef Full Text | Google Scholar

8. Sokolov IM. Models of anomalous diffusion in crowded environments. Soft Matter (2012) 8:9043. doi:10.1039/c2sm25701g

CrossRef Full Text | Google Scholar

9. Burla F, Mulla Y, Vos BE, Aufderhorst-Roberts A, Koenderink GH. From mechanical resilience to active material properties in biopolymer networks. Nat Rev Phys (2019) 1:249–63. doi:10.1038/s42254-019-0036-4

CrossRef Full Text | Google Scholar

10. Koenderink GH, Dogic Z, Nakamura F, Bendix PM, MacKintosh FC, Hartwig JH, et al. An active biopolymer network controlled by molecular motors. Proc Natl Acad Sci U S A (2009) 106:15192–7. doi:10.1073/pnas.0903974106

PubMed Abstract | CrossRef Full Text | Google Scholar

11. Alberts B. Molecular Biology of the Cell. New York: Garland Science (2017).

Google Scholar

12. Regan K, Wulstein D, Rasmussen H, McGorty R, Robertson-Anderson RM. Bridging the spatiotemporal scales of macromolecular transport in crowded biomimetic systems. Soft Matter (2019) 15:1200–9. doi:10.1039/c8sm02023j

PubMed Abstract | CrossRef Full Text | Google Scholar

13. Wulstein DM, Regan KE, Garamella J, McGorty RJ, Robertson-Anderson RM. Topology-dependent anomalous dynamics of ring and linear DNA are sensitive to cytoskeleton crosslinking. Sci Adv (2019) 5:eaay5912. doi:10.1126/sciadv.aay5912

PubMed Abstract | CrossRef Full Text | Google Scholar

14. Lee G, Leech G, Rust MJ, Das M, McGorty RJ, Ross JL, et al. Myosin-driven actin-microtubule networks exhibit self-organized contractile dynamics. Sci Adv (2021) 7:eabe4334. doi:10.1126/sciadv.abe4334

PubMed Abstract | CrossRef Full Text | Google Scholar

15. Cerbino R, Cicuta P. Perspective: Differential dynamic microscopy extracts multi-scale activity in complex fluids and biological systems. J Chem Phys (2017) 147:110901. doi:10.1063/1.5001027

PubMed Abstract | CrossRef Full Text | Google Scholar

16. Cerbino R, Trappe V. Differential Dynamic Microscopy: Probing wave vector dependent dynamics with a microscope. Phys Rev Lett (2008) 100:188102. doi:10.1103/physrevlett.100.188102

PubMed Abstract | CrossRef Full Text | Google Scholar

17. Burov S, Jeon J-H, Metzler R, Barkai E. Single particle tracking in systems showing anomalous diffusion: The role of weak ergodicity breaking. Phys Chem Chem Phys (2011) 13:1800–12. doi:10.1039/c0cp01879a

PubMed Abstract | CrossRef Full Text | Google Scholar

18. Scholz M, Weirich KL, Gardel ML, Dinner AR. Tuning molecular motor transport through cytoskeletal filament network organization. Soft Matter (2020) 16:2135–40. doi:10.1039/c9sm01904a

PubMed Abstract | CrossRef Full Text | Google Scholar

19. Needleman D, Dogic Z. Active matter at the interface between materials science and cell biology. Nat Rev Mater (2017) 2:17048–14. doi:10.1038/natrevmats.2017.48

CrossRef Full Text | Google Scholar

20. Foster PJ, Fürthauer S, Shelley MJ, Needleman DJ. Active contraction of microtubule networks. eLife (2015) 4:e10837. doi:10.7554/elife.10837

PubMed Abstract | CrossRef Full Text | Google Scholar

21. Vale RD. The molecular motor toolbox for intracellular transport. Cell (2003) 112:467–80. doi:10.1016/s0092-8674(03)00111-9

PubMed Abstract | CrossRef Full Text | Google Scholar

22. Sheung JY, Achiriloaie DH, Currie C, Peddireddy K, Xie A, Simon-Parker J, et al. Motor-driven restructuring of cytoskeleton composites leads to tunable time-varying Elasticity. ACS Macro Lett (2021) 10:1151–8. doi:10.1021/acsmacrolett.1c00500

PubMed Abstract | CrossRef Full Text | Google Scholar

23. Lee G, Leech G, Lwin P, Michel J, Currie C, Rust MJ, et al. Active cytoskeletal composites display emergent tunable contractility and restructuring. Soft Matter (2021) 17:10765–76. doi:10.1039/d1sm01083b

PubMed Abstract | CrossRef Full Text | Google Scholar

24. Drechsler M, Giavazzi F, Cerbino R, Palacios IM. Active diffusion and advection in Drosophila oocytes result from the interplay of actin and microtubules. Nat Commun (2017) 8:1520. doi:10.1038/s41467-017-01414-6

PubMed Abstract | CrossRef Full Text | Google Scholar

25. Rezaul K, Gupta D, Semenova I, Ikeda K, Kraikivski P, Yu J, et al. Engineered Tug-of-War between kinesin and Dynein controls direction of microtubule Based transport in vivo. Traffic (2016) 17:475–86. doi:10.1111/tra.12385

PubMed Abstract | CrossRef Full Text | Google Scholar

26. Brangwynne CP, Koenderink GH, MacKintosh FC, Weitz DA. Cytoplasmic diffusion: Molecular motors mix it up. J Cel Biol (2008) 183:583–7. doi:10.1083/jcb.200806149

PubMed Abstract | CrossRef Full Text | Google Scholar

27. Ganguly S, Williams LS, Palacios IM, Goldstein RE. Cytoplasmic streaming in Drosophila oocytes varies with kinesin activity and correlates with the microtubule cytoskeleton architecture. Proc Natl Acad Sci U S A (2012) 109:15109–14. doi:10.1073/pnas.1203575109

PubMed Abstract | CrossRef Full Text | Google Scholar

28. Goldstein RE, van de Meent J-W. A physical perspective on cytoplasmic streaming. Interf Focus (2015) 5:20150030. doi:10.1098/rsfs.2015.0030

PubMed Abstract | CrossRef Full Text | Google Scholar

29. Kural C, Serpinskaya AS, Chou YH, Goldman RD, Gelfand VI, Selvin PR. Tracking melanosomes inside a cell to study molecular motors and their interaction. Proc Natl Acad Sci U S A (2007) 104:5378–82. doi:10.1073/pnas.0700145104

PubMed Abstract | CrossRef Full Text | Google Scholar

30. Valentine MT, Perlman Z, Gardel M, Shin J, Matsudaira P, Mitchison T, et al. Colloid Surface Chemistry critically Affects multiple particle tracking measurements of biomaterials. Biophys J (2004) 86:4004–14. doi:10.1529/biophysj.103.037812

PubMed Abstract | CrossRef Full Text | Google Scholar

31. Weigand WJ, Messmore A, Tu J, Morales-Sanz A, Blair DL, Deheyn DD, et al. Active microrheology determines scale-dependent material properties of Chaetopterus mucus. PLOS ONE (2017) 12:e0176732. doi:10.1371/journal.pone.0176732

PubMed Abstract | CrossRef Full Text | Google Scholar

32. Jordan MA, Wilson L. Microtubules as a target for anticancer drugs. Nat Rev Cancer (2004) 4:253–65. doi:10.1038/nrc1317

PubMed Abstract | CrossRef Full Text | Google Scholar

33. Jordan MA, Toso RJ, Thrower D, Wilson L. Mechanism of mitotic block and inhibition of cell proliferation by taxol at low concentrations. Proc Natl Acad Sci U S A (1993) 90:9552–6. doi:10.1073/pnas.90.20.9552

PubMed Abstract | CrossRef Full Text | Google Scholar

34. Allan DB, Caswell T, Keim NC, van der Wel CM, Verweij RW. soft-matter/trackpy: Trackpy v0.5.0 (2021). doi:10.5281/zenodo.4682814

CrossRef Full Text | Google Scholar

35. Wulstein DM, Regan KE, Robertson-Anderson RM, McGorty R. Light-sheet microscopy with digital Fourier analysis measures transport properties over large field-of-view. Opt Express (2016) 24:20881–94. doi:10.1364/oe.24.020881

PubMed Abstract | CrossRef Full Text | Google Scholar

36. Jacob JDC, He K, Retterer ST, Krishnamoorti R, Conrad JC. Diffusive dynamics of nanoparticles in ultra-confined media. Soft Matter (2015) 11:7515–24. doi:10.1039/c5sm01437a

PubMed Abstract | CrossRef Full Text | Google Scholar

37. He K, Babaye Khorasani F, Retterer ST, Thomas DK, Conrad JC, Krishnamoorti R. Diffusive dynamics of nanoparticles in Arrays of Nanoposts. ACS Nano (2013) 7:5122–30. doi:10.1021/nn4007303

PubMed Abstract | CrossRef Full Text | Google Scholar

38. Burla F, Sentjabrskaja T, Pletikapic G, van Beugena J, Koenderink GH. Particle diffusion in extracellular hydrogels. Soft Matter (2020) 16:1366–76. doi:10.1039/c9sm01837a

PubMed Abstract | CrossRef Full Text | Google Scholar

39. Cipelletti L, Manley S, Ball RC, Weitz DA. Universal aging features in the restructuring of fractal colloidal gels. Phys Rev Lett (2000) 84:2275–8. doi:10.1103/physrevlett.84.2275

PubMed Abstract | CrossRef Full Text | Google Scholar

40. Giavazzi F, Trappe V, Cerbino R. Multiple dynamic regimes in a coarsening foam. J Phys : Condens Matter (2021) 33:024002. doi:10.1088/1361-648x/abb684

PubMed Abstract | CrossRef Full Text | Google Scholar

41. Alvarado J, Cipelletti L, Koenderink GH. Uncovering the dynamic precursors to motor-driven contraction of active gels. Soft Matter (2019) 15:8552–65. doi:10.1039/c9sm01172b

PubMed Abstract | CrossRef Full Text | Google Scholar

42. Ricketts N, Gurmessa B, Robertson-Anderson M, Microscale R. Mechanics of Plug-and-Play in vitro cytoskeleton networks. In: Antonio Bastidas Pacheco G, Ali Kamboh A, editors. Parasitology and microbiology research. IntechOpen (2020). doi:10.5772/intechopen.84401

CrossRef Full Text | Google Scholar

43. Ricketts SN, Francis ML, Farhadi L, Rust MJ, Das M, Ross JL, et al. Varying crosslinking motifs drive the mesoscale mechanics of actin-microtubule composites. Sci Rep (2019) 9:12831. doi:10.1038/s41598-019-49236-4

PubMed Abstract | CrossRef Full Text | Google Scholar

44. Gal N, Lechtman-Goldstein D, Weihs D. Particle tracking in living cells: A review of the mean square displacement method and beyond. Rheol Acta (2013) 52:425–43. doi:10.1007/s00397-013-0694-6

CrossRef Full Text | Google Scholar

45. Cho JH, Cerbino R, Bischofberger I. Emergence of Multiscale dynamics in colloidal gels. Phys Rev Lett (2020) 124:088005. doi:10.1103/physrevlett.124.088005

PubMed Abstract | CrossRef Full Text | Google Scholar

46. Morin A, Lopes Cardozo D, Chikkadi V, Bartolo D. Diffusion, subdiffusion, and localization of active colloids in random post lattices. Phys Rev E (2017) 96:042611. doi:10.1103/physreve.96.042611

PubMed Abstract | CrossRef Full Text | Google Scholar

Keywords: fluorescence microscopy, myosin, single-particle tracking, differential dynamic microscopy, cytoskeleton, actin, microtubule

Citation: Sheung JY, Garamella J, Kahl SK, Lee BY, McGorty RJ and Robertson-Anderson RM (2022) Motor-driven advection competes with crowding to drive spatiotemporally heterogeneous transport in cytoskeleton composites. Front. Phys. 10:1055441. doi: 10.3389/fphy.2022.1055441

Received: 27 September 2022; Accepted: 31 October 2022;
Published: 18 November 2022.

Edited by:

Roberto Cerbino, University of Vienna, Austria

Reviewed by:

Fabio Giavazzi, University of Milan, Italy
Paolo Malgaretti, Helmholtz Institute Erlangen-Nürnberg, Germany

Copyright © 2022 Sheung, Garamella, Kahl, Lee, McGorty and Robertson-Anderson. This is an open-access article distributed under the terms of the Creative Commons Attribution License (CC BY). The use, distribution or reproduction in other forums is permitted, provided the original author(s) and the copyright owner(s) are credited and that the original publication in this journal is cited, in accordance with accepted academic practice. No use, distribution or reproduction is permitted which does not comply with these terms.

*Correspondence: Janet Y. Sheung, jsheung@scrippscollege.edu

Disclaimer: All claims expressed in this article are solely those of the authors and do not necessarily represent those of their affiliated organizations, or those of the publisher, the editors and the reviewers. Any product that may be evaluated in this article or claim that may be made by its manufacturer is not guaranteed or endorsed by the publisher.