 Chenghui Tang
 Jianan Chai*
- School of Urban and Regional Science, Shanghai University of Finance and Economics, Shanghai, China
As the important performance of intercity interaction, urban networks have a significant impact on the urban system and economic development of city-regions. However, previous studies have mainly analyzed the structure of a single urban network from a static perspective and lack in-depth analysis of the driving mechanism of network evolution. Based on the headquarters-branch data of companies and patent transaction data, this study uses spatial analysis, social network analysis, and negative binomial regression analysis to explore the structure evolution and proximity mechanism of the urban networks in China. The empirical results were as follows. First, different types of urban networks are characterized by stratification and geographical unevenness, and the evolution of urban networks shows priority linkage and path dependence. Second, the Yangtze River Delta, the Pearl River Delta, and the Beijing–Tianjin–Hebei urban agglomerations shape high-value agglomeration centers but show a differentiated development trend. Third, geographical proximity has a stronger effect on the urban innovation network evolution, but institutional and cultural proximity has a stronger effect on the urban economic network evolution. The comparative study of urban networks not only helps to clarify the structure and characteristics of an urban system but also contributes to a comprehensive understanding of the diversity and complexity of intercity interactions.
1 Introduction
Since the 1970s, with the rapid development of globalization, intercity exchanges and interactions have deepened and produced extensive connections [1,2], thus facilitating the formation of networked spatial structures [3]. Against this background, urban networks at different spatial scales are emerging [4,5] and becoming new models of spatial organization [6]. Urban networks not only reshape global-local relations [7,8] but also enable the gradual replacement of space of places by space of flows [3]. Since the relational turn in social sciences, urban networks have become the focus of attention across multiple disciplines such as economics and geography [9,10], and a number of new concepts have emerged such as the world city [11], the global city [12], and the world city network [13]. Before the 1990s, the study of the world city network was at an early stage of development, and scholars primarily analyzed the functions of world cities and their hierarchies based on attribute data (e.g., the number of corporate headquarters) [11]. However, although this phase of research developed the world city network theory based on the traditional central place theory [14], it neglected the socially and culturally intercity connections and failed to explain the formal mechanisms of urban networks [15]. Since the 1990s, with a series of relational theories such as actor network theory and space of flows theory [16,17], the study of the world city network has acquired a more solid theoretical foundation. At the same time, scholars have gradually used relational data to analyze the structure of world city network [18].
Due to the multiplicity of network, the comparative study of different types of urban networks not only helps to recognize the diversity and complexity of intercity relationships [19]but also provide a more comprehensive understanding of city function positioning and division [20], thus providing reference for the city and regional development policy [21]. In this study, an economic network and an innovation network are selected for a comparative study based on three main considerations in the following aspects. First, economic and innovation networks characterize different dimensions of intercity connections [22]. The economic network characterizes intercity economic connections and industrial division [23], while the innovation network reflects intercity knowledge flows and technological cooperation [24]. Second, the role and division of urban functions are differences in different types of networks, thus providing new perspectives (multiple networks) to conceptualize cities. Cities assume economic functions in the economic network [23], while they serve as spatial carriers of innovative activities in the innovation network [25]. Finally, economic and innovation networks are strongly influenced by market mechanisms, but the way of constructing them is different, which makes the comparative study of them significant [26]. The economic network is based on the location layout of micro enterprise headquarters and branches and then translates the office network into the city network [27]. The innovation network extracts linkage data directly from voluntary patent transactions in the marketplace [28]. In addition, the comparative study could help to reflect on the impact of urban networks constructed on representing real intercity connections [29].
The key contributions of this study are summarized as follows. First, previous studies have mainly explored single urban economic or innovation network, which could only reflect one aspect of intercity linkages. By acquiring real relational data between cities using big data technology, this study constructs economic network and innovation network and analyzes their network structures in comparison, providing empirical evidence for the debate related to the multidimensionality of urban networks and the complexity of intercity interactions. Second, previous studies analyzed network characteristics through the static perspective, but this study explores the evolution process and patterns of economic and innovation networks through the dynamic perspective, providing more information than static urban network studies. In particular, this study finds that there are priority linkages and path-dependent characteristics of urban network evolution in China, which not only reveals the characteristics and laws of urban network evolution but also deepens the understanding of urban system and urban geography research from the perspective of network science. Finally, based on proximity theory, this study explores the heterogeneous influence of geographic, institutional, and cultural proximity factors on the evolution of urban networks, which not only provides a new perspective and analytical framework for understanding the driving mechanisms of urban network evolution but also provides a bridge to related studies on urban networks and evolutionary economic geography.
2 Literature review
2.1 Multiplex urban network
With the development of transportation infrastructure, a variety of physical and nonphysical flows occur in the spaces and form complex intercity connections through physical connection and virtual connection, which, in turn, form multiple urban networks. Camagni and Salone [30] argue that urban networks consist of two key dimensions: infrastructure network and economic network. Malecki [31] also defines two types of network: the “hard network” and the “soft network.” Based on the space of flows, Castells argues that urban networks consist of three levels, including infrastructure networks, economic networks, and social networks [32]. Due to insufficient data, scholars often need to convert individual or organizational relationships among cities into intercity connections [33] to construct urban networks [34]. As complex systems, urban networks are composed of subsystems of economic, political, and social connections among cities [35].
The multiplex of urban networks has been broadly recognized by scholars, but there are some weaknesses as follows. First, studies mainly focus on the structure and characteristics at the global scale, while few studies have examined the urban network systems in developing countries, which is neglecting the influence of small cities on network formation [20,36]. Second, urban network research mainly focused on the exploration of a single network structure, while comparative studies on the similarities and differences of multiplex networks are lacking [23]. For example, the Globalization and World Cities Research Network (GaWC) has conducted a large number of empirical studies of world city networks through the interlocking network model (INM) [15]. Some scholars have also analyzed the urban network structure evolution from the perspective of external connections between enterprises [27]. In addition, some scholars have also used patent cooperation data to analyze the complexity evolution of intercity R&D cooperation networks and its impact on urban innovation performance [37]. Finally, although some scholars have compared the variability of different types of intercity transportation networks, such as highways, high speed railways, and airlines [29], they mainly analyze the spatial pattern of intercity connections based on the static perspective, with less attention being given to structure evolution and formation mechanisms of urban networks from the dynamic perspective. Therefore, the comparative study of the economic network and innovation network from the dynamic perspective is conducive to the understanding of the multiple urban networks and urban system formation mechanisms, thus providing scientific suggestions for the evolution and implementation of urban and regional spatial planning.
2.2 Multidimensional proximity theory
Although scholars have studied the structure of urban networks at different scales, there remains a lack of exploration of their formation mechanisms [38]. With the development of evolutionary economic geography, the proximity theory has become an important analytical framework for urban networks, and it has been widely used to analyze organizational cooperation and innovation performance. Powell [39] argues that when actors experience a greater proximity, more communication takes place. Scholars have also used the proximity theory to analyze the impact of geographical distance on the evolution of innovation network [40], thus providing a new theoretical framework for analyzing the complexity of urban networks and evolution mechanisms. With increasing research on multidimensional proximity and innovation, scholars have been able to define the forms of proximity. Boschma [41] has presented geographic, organizational, and social proximity and its spillover mechanisms. The proximity of different dimensions becomes an important resource for urban development and drives new knowledge generation and the evolution of relational patterns [42].
Geographical proximity refers to the spatial distance between cities as measured by distance or travel time [43]. Weterings [44] argues that geographical proximity facilitates face-to-face communication and collaboration among organizations. Institutional proximity refers to the extent to which two organizations share an institutional framework and enjoy interdependence [34]. Social proximity is derived from social embeddedness theory, which refers to the degree of social closeness and trust. Breschi and Lissoni [45] argue that social proximity helps to promote intersubjective cooperation and knowledge interaction. Cultural proximity refers to the shared languages and cultures that enable economic agents to have similar norms of behavior and standards of judgment and produce the generation of intimacy and the formation of a harmonious range in mutual communication. Therefore, based on the comparative analysis of the structure of economic and innovation networks, this study constructs an analytical framework from four dimensions of proximity to analyze the mechanism of urban network evolution (see Figure 1).
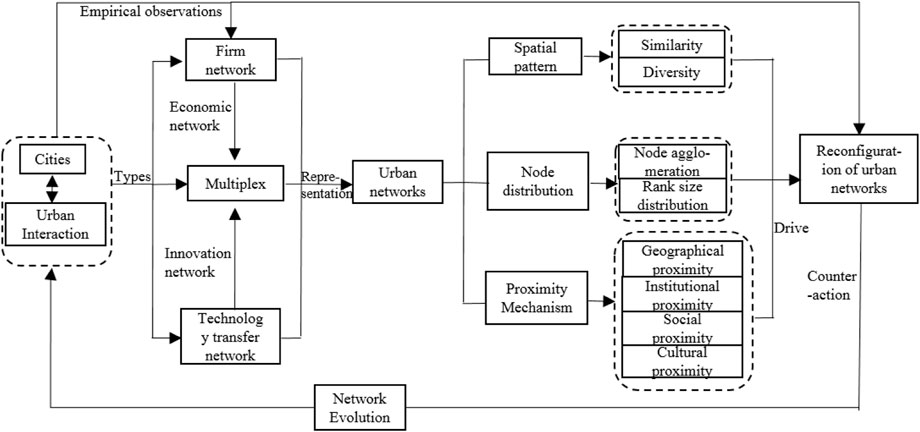
FIGURE 1. Constructive and analytical framework of urban networks.
3 Data and Methodology
3.1 Research method
3.1.1 Construction of economic network
Based on the Ownership Linkage Model (OLM) proposed by Alderson et al [46], the intercity connectivity matrix was constructed by the headquarters-branch data of listed companies. That is, if a company headquartered in city i has n branches in city j, city i is considered to have n linkages with city j. GIS software was used to form the linkage matrix for 2006, 2011, and 2016 with the origin and destination connections to characterize the urban economic network.
3.1.2 Construction of innovation network
Patent transfer is a voluntary market transaction behavior between the demand and the supply side, which reflects the technology flow between cities and serves as an important method for building an innovation network. First, we obtain the detailed data of patent transfer from 2006 to 2016 included on the website of patent information service platforms. Second, the spatial information of patent cities is identified by geocoding, and the data is examined. Finally, the intercity patent transfer volume and its interconnection strength are calculated and connected with the origin and destination connections by GIS software to form the innovation network.
3.1.3 Social network analysis
As the integrated software for network analysis, UCINET software provides important functions for analyzing the properties and structures of overall networks, local networks, and individual networks, which have gained wide applications in relational data [47]. UCINET is used to topologies urban networks and measure the node degree centrality. The degree centrality characterizes the control and intermediary ability of nodes.
In Eq. 1,
3.1.4 Zipf law analysis
To analyze the node distribution characteristic of urban network systems, the connectivity is used to characterize the city scale, and the Zipf law is used to measure the city scale and its rank-law relationship.
In the formula,
3.1.5 Negative binomial regression analysis
Due to the number of zeros and the over dispersion characteristic of the variables in the data, it is difficult to obtain valid unbiased estimates using the OLS. Therefore, this study constructs a negative binomial regression (NBR) model to explore the factors influencing the evolution of different types of urban networks. Based on the previous analysis, this study selects four dimensions to analyze the proximity mechanism of the evolution of urban networks.
(1) City connectivity (
In Eq. 4,
(2) Geographical proximity: Based on the latitude and longitude of cities, the geographical distance between cities is calculated by the Shape Length function of ArcGIS software. Given the large actual geographical distances between some cities, they were regressed by taking the logarithm. This indicator is a negative indicator: the smaller the value of geographical distance, the closer the distance between cities, and the better the geographical proximity, where
(3) Institutional proximity: The provincial administrative boundaries have become the dividing line between different territorial systems and have a clear impact on intercity connections. In particular, urban development is strongly influenced by institutions, and cities in the same provinces often have natural advantages in coordination and division of labor in China [34]. Therefore, provincial administrative boundaries were defined by setting dummy variables to characterize intercity institutional proximity.
(4) Social proximity: The value of social proximity reflects the closeness of social relationships and has a profound impact on the evolution of urban networks. Drawing on Scherngell and Hu [48], the Jaccard Index was constructed to measure social proximity. It means the proportion of the elements of the intersection of two sets A and B in the union of A and B. In Eq. 5,
(5) Cultural proximity: Diverse language systems have been formed and have become a cultural representation of regional heterogeneity in China. Particularly in mutual interaction, actors who share the same dialect communicate more easily and form a strong identity. This study selects language affinity as an indicator of cultural proximity and sets dummy variables (0 or 1) based on the 2010 Atlas of Chinese Languages to characterize.
Based on the panel data from 2006 to 2016, this study explores the differential effects of the multidimensional proximity on the evolution of different types of urban networks using a negative binomial regression model. The specific names and measures of the variables are shown in Table 1(see Table 1).
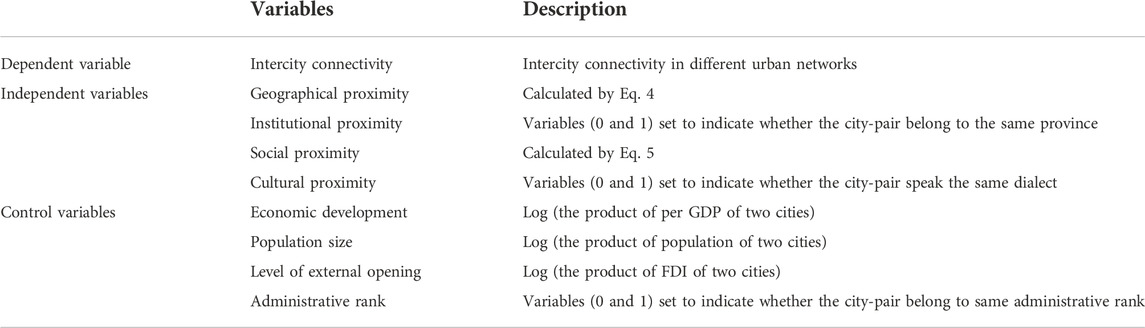
TABLE 1. Main variables and measurement methods.
In Eq. 7, the dependent variable
3.2 Data description
The headquarters-branch data of listed companies is sourced from the China Research Data Service (CNRDS) subdatabase, which includes detailed information on the names, industries, and addresses of listed companies and their owned or controlled branches. Meanwhile, the geocoding function of Python software was used to convert the address information of the headquarters and its subsidiaries to the corresponding cities, and 104,077 pieces of data on economic connections between cities from 2006 to 2016 were obtained. As the leading enterprises in various industries, the sample of listed companies is the most active economic body and covers as many as 18 major industries of the economy, which reflects economic connection among cities. Patent transaction data is obtained from the “Patent Information Service Platform” in the database of SIPO (State Intellectual Property Office of China), and the geocoding function of Python software is used to match the spatial information of each patent. We also use cross-checking and manual verification methods to ensure the accuracy of the data and to extract all 122,971 patent transfer data pieces, which reflect the direction and intensity of the flow of innovation factors. The dialect data were obtained from the 2010 Atlas of Chinese Languages [49]. Data on other attributes were obtained by consulting the China Urban Statistical Yearbook, and some missing values were found in the statistical bulletins published by city for supplementation.
4 Results
4.1 Spatial patterns of urban networks
The different types of urban networks are characterized by a hierarchy and geographical imbalance (see Figure 2). Moreover, the evolution of urban networks shows priority linkage and path dependence and forms closer connections in more economically developed areas.
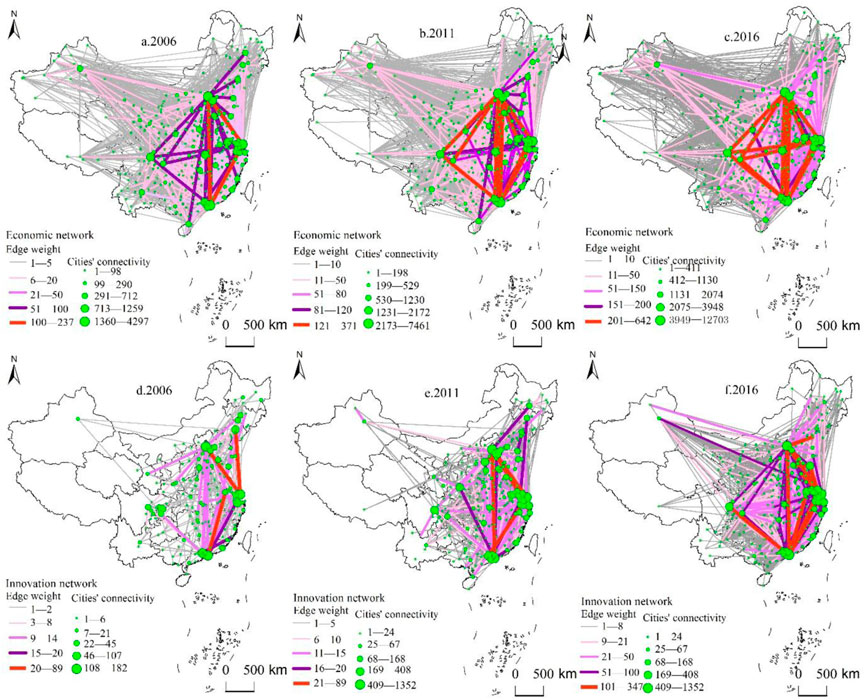
FIGURE 2. Evolution of urban economic network and innovation network in China.
4.1.1 Similarity of urban networks
(1) The intensity of intercity connection is increasing and has stratification characteristic. The expansion of intercity economic and innovation network has shown rapid growth and an expanding geographical scope, driving the gradual formation and strengthening of national-scale urban networks. With the improvement of transportation infrastructure, intercity economic and innovation connections have been enhanced, which promote the free flow of factors of production such as capital and technology and contribute to the rapid rise of economy in China. In addition, both the economic network and innovation network show a clear stratification, with the number and strength of intercity connections at different levels diverging significantly and fewer connections among high-ranking cities and more connections among low-ranking cities. This reflects that despite the multiplicity of urban networks, there are pattern similarities in different types of networks.
(2) The spatial distribution of intercity connections is uneven, showing a decrease from the east region to the west region. The eastern region not only has more high-grade intercity connections but also has a denser of network. However, most cities have small connections, and their linkage intensity is lower in the western region. The highly uneven spatial distribution of intercity connections is related to the regional economic development gap. The Chinese government has adopted a progressive open-door policy, and the eastern region has been the first to achieve rapid economic development by its superior location and policy support, while the economic development of the western region is still slower. This leads to denser intercity connections in the east and sparser ones in the west region. Meanwhile, it also reflects that the evolution of urban networks is influenced by the level of urban economic development and population size.
(3) Intercity connections are characterized by spatial agglomeration and preferential connectivity, and the network evolution shows path dependence. Among the different types of urban networks, core cities such as Beijing, Shanghai, and Guangzhou not only form more high-ranking connections with each other but also have higher-ranking connections with neighboring cities. In particular, the connections between core cities constitute the backbone of the urban network and have become the priority links for other cities in the evolution of network, which indicates that the evolution of urban networks has spatial agglomeration and preferential linkage. In addition, despite the increasing number of intercity connections, high-level connections are still locked between core cities, also reflecting the path-dependency of the urban network evolution.
4.1.2 Differences in urban networks
(1) The economic network forms a diamond-shaped spatial structure, and the innovation network forms a triangular spatial structure. In 2006, the intercity economic network initially formed a diamond-shaped spatial structure, which was strengthened and fixed in 2016 (see Figure 3). Although the innovation network has rapidly developed in the last decade, the western core cities have not formed the first-ranking innovation connections due to the long geographical distance from other eastern core cities. This limited the flow of the innovation factors, making the spatial structure of innovation network a triangle. This suggests that different types of urban networks have differential spatial structures and geographic scopes, and attention should be paid to the multiplicity of urban networks and their representational implication in order to avoid biased perceptions of intercity connections.
(2) The economic network is denser and covers a wider geographical area, while the innovation network is less dense and covers a smaller geographical area. Although most of the enterprise’s headquarters are located in few big cities, the branches have adopted a wide range of locations in many cities to develop markets, which promote the denser economic connections between cities. In addition, the enterprise branches are less dependent on the city size and development level, and some small cities also attract enterprise branches layout by their resource advantages, making the intercity economic connections coverage wider and the network density higher. However, due to the high concentration of education institutions in few cities such as Beijing, the distribution of innovation resources is highly uneven, which result that the innovation connections are sparser and unevenly distributed. Due to the stronger unevenness of the urban innovation network, it is important to pay more attention to the fairness of spatial allocation of innovation resources and establish cross-regional technology trading platforms when formulating regional development policies.
(3) Innovation network are dominated by short-range proximity diffusion, and economic networks are dominated by hierarchical diffusion. In the innovation network, the ratio of intercity linkages exceeds 30% for cities within 500 km and 60% for cities within 1000 km, indicating that geographical proximity strongly influences the flow of innovation factors and makes innovation connections dominated by proximity diffusion. In the economic network, the ratio of intercity links of 500 km is less than 30%, but the number of economic connections of the same rank is higher, indicating that intercity economic connections are less influenced by geographical proximity but influenced by the level of urban economic development and dominated by rank diffusion. These reflect that there are differences in the way of different intercity connections, thus deepening the knowledge of the multiplicity of urban networks and their evolution mechanisms.

FIGURE 3. Distribution characteristics of the economic network and innovation network distance between cities.
4.2 Node distribution characteristics
The weighted degree of nodes in the intercity economic network and innovation network are measured by the social network analysis. Meanwhile, the unevenness of urban nodes in space and location order is explored using the Zipf law analysis.
4.3.1 Spatial agglomeration of urban nodes
At the beginning of the 21st century, the development level of the economic network and innovation network among cities was generally low; the number of cities had a small central degree of agglomeration and showed spatial polarization (see Figure 4). Due to the gradually opening-door policy, only a few central cities in the eastern region, such as Beijing, Shanghai, and Guangzhou, attracted more foreign investment and enterprises’ layouts, thus becoming the highest agglomeration of the urban network and exerting a radiation effect on neighboring cities in 2006. However, the cities in the middle and western regions have a relatively low node linkage capacity and rank due to their low levels of openness to the outside and economic development. In addition, the central government decentralized authority to city governments and made them the primary agents of the economic development. The city governments restrict foreign investment and technology transactions in order to achieve rapid economic growth in their districts for job promotion, resulting in weak economic and innovation linkages among cities and exacerbating the spatial polarization of urban networks.
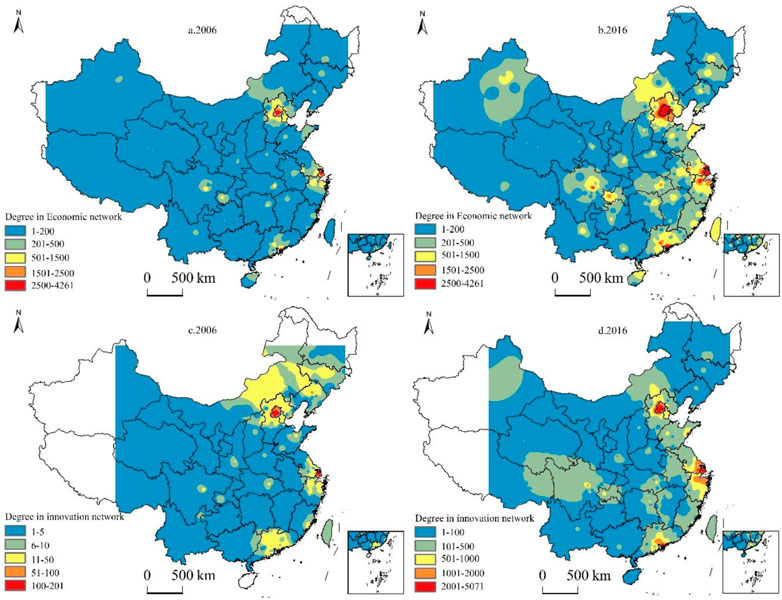
FIGURE 4. Interpolation of cities’ degree in the economic network and innovation network.
The degree of city in networks has been improved, and high-value agglomerations with a wide radiation range have been formed in Beijing–Tianjin–Hebei, the Yangtze River Delta, and the Pearl River Delta urban agglomerations in 2016. After adoption of the opening-up policy in the eastern region, the Chinese government has promoted this policy in the middle regions and western regions, improving the investment environment and economic development level of cities, attracting more enterprise branch locations and technology transactions, and thus promoting economic connections and innovation connections among cities. In addition, since 2011, the Chinese government has formulated several urban agglomerations development plans to promote the evolution of urban networks and regionalization. In this background, the economic network of the Yangtze River Delta urban agglomeration has formed a number of high-value agglomerations and make the urban agglomeration a polycentric development trend. However, the number of high-value agglomerations in the innovation network is less and their radius is smaller, indicating that the innovation network of urban agglomerations is less polycentric. On the one hand, innovation resources are highly concentrated in big cities and are locally embedded. Patent transactions occur more within big cities, while cross-city patent transactions are less, resulting in low intercity innovation connections. On the other hand, there are more institutional barriers to patent transactions, and innovation linkages are insufficient. In particular, the degree of cities in the northeast region shows a decreasing trend in the innovation network, reflecting the weakening and lower concentration capacity of innovation factors in these cities, which exacerbated the regional economic recession. Intercity connections have an important impact on the rise and fall of regional economies through the network capital, not only promoting the rapid economic rise and regionalization but also shaping the spatial pattern of uneven development.
4.3.2 Rank-size distribution of city nodes
The node distribution patterns of urban networks in terms of space and rank are explored using the Zipf law analysis. The cities of the economic and innovation networks in 2006 and 2016 were ranked according to the range of connectivity, and the main findings are as follows (see Figure 5).
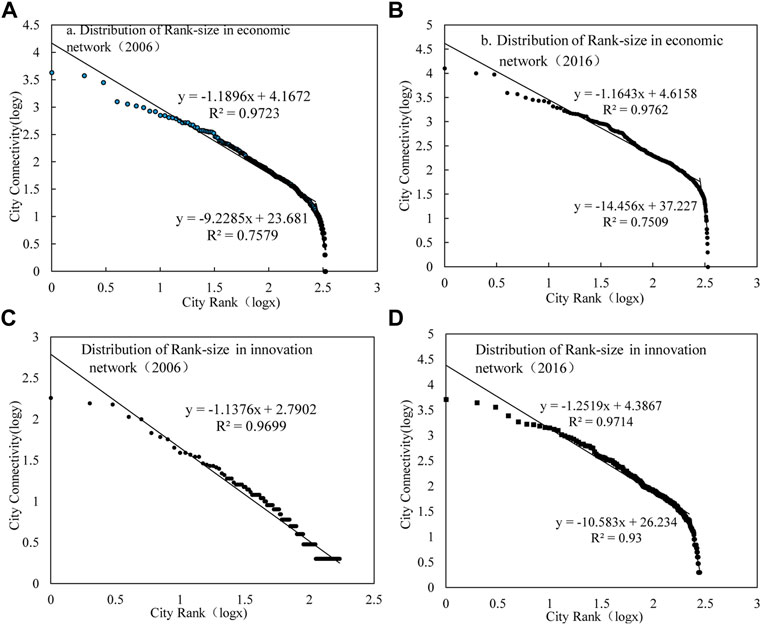
FIGURE 5. Rank-size distribution of city connectivity in the economic network and innovation network.
First, the scale distribution of city connectivity shows a power-law distribution, indicating that the scale distribution of the urban network system tends to be concentrated. With the decreasing connectivity rank order, the number of city nodes is increasing, reflecting the unevenness of the connectivity scale hierarchy in the Chinese cities. Second, the connectivity of big cities is generally higher than that of small cities, reflecting the important influence of city scale on the ability of cities in the network to concentrate resources. In particular, central cities, such as Beijing, Shanghai, and Guangzhou, have become the sources of influence on the spatial development of economic and innovation networks and dominate the formation and evolution of urban networks. Finally, the changes in connectivity rankings reflect the changes of the urban network system and affect the regional economic development. With the shift of industries from the eastern region to the central and western regions, the connectivity of these cities has increased and contributed to the economic development. However, due to the poor economic development and reduced innovation resource-gathering capacity in the Northeast, the connectivity ranking in the innovation network is rapidly declining.
To characterize the distribution of urban nodes, their connectivity and rank-size are taken as logarithms and linearly fitted. First, the linear fit of the economic network and innovation network is greater than 0.75, and even the fit of the straight line on the left side is greater than 0.95, reflecting that the distribution of urban centrality is consistent with the law of rank-size. Second, in the differently fitted straight lines, the absolute value of the coefficients of the independent variables is the Zipf index and is generally greater than 1, indicating that the city connectivity distribution of city network is more concentrated. In the biracial structure, the Zipf indices on both sides of the turning point of connectivity differ significantly, with the Zipf index on the left side close to 1, while the Zipf index on the right side exceeds 9, reflecting the stronger unevenness of the city connectivity distribution of the nodes on the right side (primarily cities in the western region). Due to the late opening-up policy in the western region and the low level of globalization, it is difficult to attract the layout of enterprise branches, which leads to the city connectivity at the end of the urban network system. In addition, the lack of research institutions also makes the intercity innovation linkages weak, which exacerbates the uneven scale distribution of city connectivity in the western region.
5 Proximity mechanism of urban networks
In the previous analysis, it was found that intercity connections are not only influenced by geographical proximity but also have high correlation with attribute factors such as the level of economic development and population size. However, in the multidimensional proximity theory, other dimensional proximity factors also influence intercity linkages [24]. Therefore, in order to explore the driving mechanism of urban network evolution, this study constructs econometric models to quantitatively measure city attributes and intercity proximity (see Table 2). To verify the reasonableness of the model, the baseline regression model was tested for multiple covariance, heteroskedasticity, and serial autocorrelation. The results show that the maximum values of both are less than 10, indicating that there is no multicollinearity. The p-values of the BG test are below 0.005, indicating that the models are also not autocorrelated. Meanwhile, the robustness and accuracy of the model are improved by gradually adding core explanatory variables and control variables, and Model 3 and Model 6 with all variables are added as the final explanatory results.
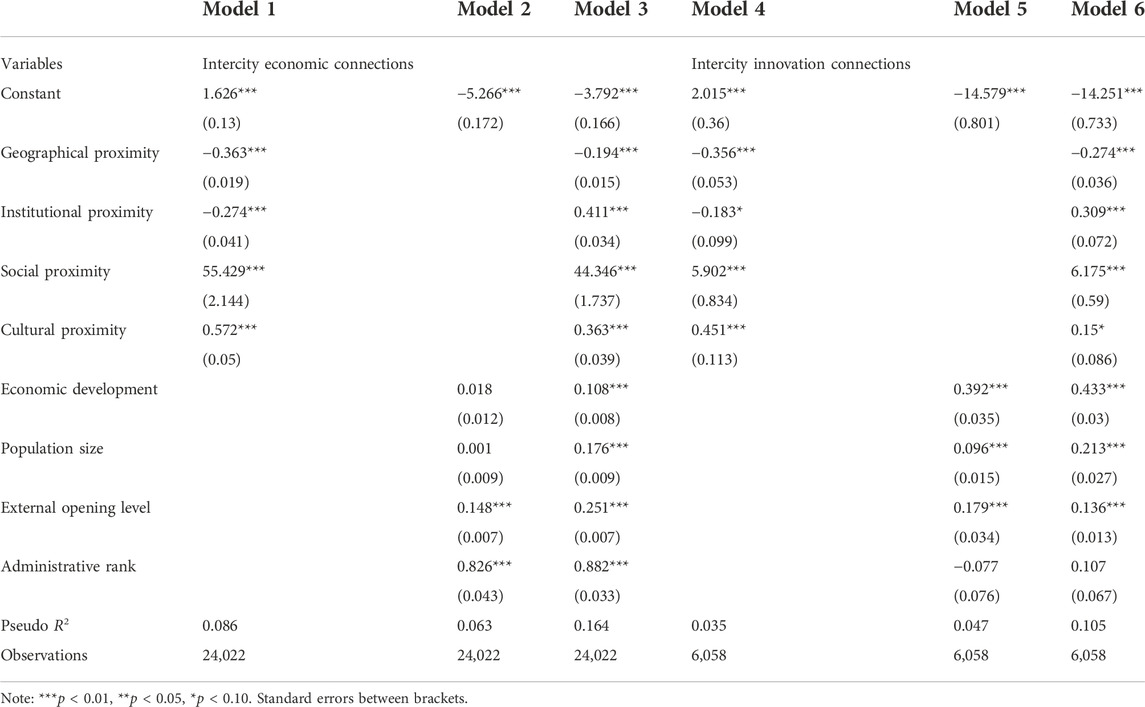
TABLE 2. Regression results of urban network influencer factors.
In the economic network, the core explanatory variables of geographical, institutional, social, and cultural proximity all have significant effects on the strength of intercity connections, but there are differences in the way that they are affected. The coefficient of geographical proximity is significantly negative, indicating that the smaller the geographical distance between cities, the closer the intensity of economic connections. Since economic activities are influenced by transportation costs, the layout of enterprises’ branches among geographically close cities is conducive to reducing transportation costs and improving production efficiency, reflecting that the expansion of intercity connections is still constrained by the geographical distance. The coefficients of social proximity and cultural proximity are also significantly positive, indicating that higher social intimacy and cultural similarity reduce the social cost of communication among business personnel and reduce information asymmetry, which is conducive to the expansion of intercity business operation networks and the extension of product value chains, thus enhancing intercity connections. Furthermore, institutional, social, and cultural proximity affect intercity economic connections more strongly than the innovation network. This is primarily because the similar institutional environment is conducive to reducing institutional transaction costs and sharing rules for urban economic activities, allowing for firms to set up branches that are more quickly embedded in the local political environment and more convenient for the development of cross-regional collaborative activities [50].
In the innovation network, core variables such as geographical, institutional, social, and cultural proximity also have a significant impact on the intercity technology transfer. However, the geographical proximity has a stronger impact on the evolution of urban innovation network than economic networks. This is primarily because the smaller the geographical distance, the more favorable it is to reduce the transaction cost of intercity technology transfer and increase the probability of intersubject interaction. In Model 6, it is found that institutional proximity, social proximity, and cultural proximity also have significant positive effects on intercity connections, reflecting that similar institutional environments and social cultures effectively reduce the risk and uncertainty of intercity patent transactions, facilitate the interaction among innovation agents, and promote the free flow of innovation factors.
In terms of control variables, the level of urban economic development, population size, and openness to the outside world positively contribute to intercity connections and reflect the evolution of urban networks with priority linkage characteristics. In Model 3 and Model 6, the coefficients of city economic development level and population size are significantly positive, reflecting that cities with more developed economies and larger populations tend to have more economic and innovation connections. They dominate the flow of factors between cities and make the strength of intercity connections show characteristics of priority links. At the same time, the coefficient of the degree of openness to the outside world is also significantly positive, reflecting that both economic and innovation intercity connections are strongly influenced by economic globalization and show significant geographical unevenness. The results are similar to the previous spatial pattern analysis. However, without considering the effect of multidimensional proximity, the level of economic development and population size of cities do not significantly contribute to intercity economic connections (Model 2). Although the administrative rank has a significant positive contribution to intercity economic connections, it does not have a significant positive effect on innovation connections, reflecting that intercity innovation connections are primarily determined by supply and demand factors among trading agents under market factors, which are not constrained by significant city administrative rank (Model 6).
6 Conclusion
Based on the headquarters-branch data of listed companies and patent transaction data, this study reveals the characteristics and structures of different types of urban networks in China using the methods of spatial analysis, Zipf law analysis, and regression analysis. Furthermore, this study explores the evolution of urban networks from the perspective of multidimensional proximity theory. The following conclusions are drawn from the analyses of multiplex networks.
(1) In terms of spatial pattern, there are not only similarities but also differences in urban economic and innovation networks. With regard to similarities, the intensity of intercity connections has been increasing across different types of networks and is characterized by persistent stratification and geographical unevenness. The urban networks also exhibit spatial agglomeration and priority connections, with close economic and innovation connections prevalent among economically developed core cities. With regard to variability, the urban economic network exhibits a typical diamond-shaped spatial structure and possesses a higher network density and wider coverage. However, the urban innovation network forms a triangular spatial structure and has a lower network density.
(2) In terms of node distribution, the urban economic and innovation networks formed agglomeration centers in several core areas and exhibited spatial polarization in 2006. As the reform process continues, economic and innovation networks are forming high-value agglomeration centers in all three regions (east, west, and central). At the same time, the node agglomeration also reflects the development trend of different urban agglomerations. In terms of rank-size, the connectivity of city nodes in different types of network shows a power-law distribution. In particular, core cities such as Beijing, Shanghai, and Guangzhou regularly rank at the top of the urban network system, thus dominating the flow of key resources among cities.
(3) In terms of evolutionary mechanisms, geographical, institutional, social, and cultural proximity all contribute significantly to the evolution of urban economic and innovation networks. However, intercity economic linkages are more strongly influenced by institutional, social, and cultural proximity due to the spatial layout of enterprise branches need to embed in the local socio-political environment. Moreover, intercity innovation connections are more strongly influenced by geographical proximity as intercity knowledge spillovers are mainly affected by the geographical distance. In addition, variables such as the level of urban economic development and population size positively contribute to intercity connections and reflect a certain priority linkage characteristic of network evolution.
Compared to the previous studies, this study uses big data technology to obtain special headquarters-branch data of listed companies and patent transaction data among cities, as well as conducting a discussion on the complexity of different types of urban network. Moreover, based on theories of multidimensional proximity, this study enhances the understanding of multiplex urban networks and their development patterns of emerging developing countries. Meanwhile, based on the theory of multidimensional proximity, this study explores the influence of geographical, institutional, social, and cultural proximity on the evolution of different types of urban network and finds that these different dimensions of proximity significantly contribute to the formation of economic and innovation networks, but there are differences in the intensity of the impact, thus providing empirical evidence to understand the evolutionary mechanism of urban networks. This study analyzes the effects of heterogeneity of different types of city network in terms of their economic development levels, population size, and other important factors. An explanation for the reasons behind the uneven spatial distribution of intercity connections will further promote the progress of research on the theory and practice of multiplicity of the world city network. However, due to the difficulty of data acquisition, the urban economic network constructed in this study mostly utilizes data on the headquarters and branches of listed companies to characterize economic connections, ignoring the connections among small enterprises and their impact on urban networks. In future research, more advanced technologies could be used to obtain more objective and comprehensive data on economic connections and analyze the changing structure of urban networks at different scales.
Data availability statement
The original contributions presented in the study are included in the article/supplementary materials; further inquiries can be directed to the corresponding author.
Author contributions
CT: conceptualization, methodology, and writing–original. JC: Revision and proofreading of paper.
Funding
This study was funded by the National Natural Science Foundation of China (No. 71974120) and the Social Science Planning Project of Shanghai (No: 2018BJL005).
Acknowledgments
The authors thank the editors and reviewers for their helpful comments and suggestions.
Conflict of interest
The author declares that the research was conducted in the absence of any commercial or financial relationships that could be construed as a potential conflict of interest.
Publisher’s note
All claims expressed in this article are solely those of the authors and do not necessarily represent those of their affiliated organizations, or those of the publisher, the editors, and the reviewers. Any product that may be evaluated in this article, or claim that may be made by its manufacturer, is not guaranteed or endorsed by the publisher.
References
1. Liu X, Derudder B. Analyzing urban networks through the lens of corporate networks: A critical review. Cities (2013) 31(04):430–7. doi:10.1016/j.cities.2012.07.009
2. Almog A, Bird R, Garlaschelli D. Enhanced gravity model of trade: Reconciling macroeconomic and network models. Front Phys (2019) 7:55. doi:10.3389/fphy.2019.00055
3. Jin X, Hu G, Ding H, Ye S, Lin J. Evolution of spatial structure patterns of city networks in the Yangtze River Economic Belt from the perspective of corporate pledge linkage. Growth and Change (2020) 51(02):833–51. doi:10.1111/grow.12371
4. Derudder B, Taylor PJ, Ni P, Vos AD, Yang X, Hanssens H, et al. Pathways of change: Shifting connectivities in the world city network, 2000-08. Urban Stud (2010) 47(09):1861–77. doi:10.1177/0042098010372682
5. Neal Z. Airnet: A programme for generating intercity networks. Urban Stud (2013) 51(01):136–52. doi:10.1177/0042098013484537
6. Beaverstock JV, Smith RG, Taylor PJ. World-city network: A new metageography? Ann Assoc Am Geogr (2000) 90(01):123–34. doi:10.1111/0004-5608.00188
7. Scott AJ. A world in emergence: Cities and regions in the 21st century. Cheltenham: Edward Elgar (2012).
8. Zhang X, Kloosterman RC. Connecting the 'workshop of the world': Intra- and extra-service networks of the Pearl River Delta city-region. Reg Stud (2016) 50(06):1069–81. doi:10.1080/00343404.2014.962492
9. Tranos E, Kourtit K, Nijkamp P. Digital urban network connectivity: Global and Chinese internet patterns. Pap Reg Sci (2014) 93(02):409–28. doi:10.1111/pirs.12097
10. Yang X, Derudder B, Taylor PJ, Ni P, Shen W. Asymmetric global network connectivities in the world city network. Cities (2017) 60(02):84–90. doi:10.1016/j.cities.2016.08.009
11. John F. The world city hypothesis. Dev Change (1986) 17(01):69–83. doi:10.1111/j.1467-7660.1986.tb00231.x
13. Taylor PJ, Catalano G, Walker DRF. Measurement of the world city network. Urban Stud (2002) 12(39):2367–76. doi:10.1080/00420980220080011
14. Zhao J, Zhang X, Song J. The changing geography of domestic financial city network in China, 1995–2015. Growth and Change (2018) 49:490–511. doi:10.1111/grow.12244
15. Taylor PJ. The challenge of world city network pattern changes on the world city network analysis. Chapters (2016) 1(1):181–93. doi:10.4337/9781782548034.00020
16. Smith RG. World city topologies. Prog Hum Geogr (2003) 5(27):561–82. doi:10.1191/0309132503ph447oa
17. Guan M, Wu S, Liu C. Comparing China’s urban aviation and innovation networks. Growth and Change (2021) 53:470–86. doi:10.1111/grow.12593
18. Ye S, Qian Z. The economic network resilience of the guanzhong plain city cluster, China: A network analysis from the evolutionary perspective. Growth and Change (2021) 52:2391–411. doi:10.1111/grow.12530
19. Fang C, Yu X, Zhang X, Fang J, Liu H. Big data analysis on the spatial networks of urban agglomeration. Cities (2020) 102(07):102735. doi:10.1016/j.cities.2020.102735
20. Lao X, Zhang X, Shen T, Skitmore M. Comparing China's city transportation and economic networks. Cities (2016) 53(04):43–50. doi:10.1016/j.cities.2016.01.006
21. Pan F, Fang C, Li X. The progress and prospect of research on Chinese city network. Scientia Geographica Sinica (2019) 39(07):1093–101. doi:10.13249/j.cnki.sgs.2019.07.007
22. Burger MJ, Bert VDK, Wall RS. Polycentricity and the multiplexity of urban networks. Eur Plann Stud (2014) 22(04):816–40. doi:10.1080/09654313.2013.771619
23. Hu X, Wang C, Wu J, Stanley HE. Understanding interurban networks from a multiplexity perspective. Cities (2020) 99(04):102625. doi:10.1016/j.cities.2020.102625
24. Ma H, Li Y, Huang X. Proximity and the evolving knowledge polycentricity of megalopolitan science: Evidence from China’s Guangdong-Hong Kong-Macao Greater Bay Area, 1990–2016. Urban Stud (2020) 58(12):2405–23. doi:10.1177/0042098020942665
25. Derudder B, Cao Z, Liu X, Shen W, Dai L, Zhang W, et al. Changing connectivities of Chinese cities in the world city network, 2010–2016. Chin Geogr Sci (2018) 28(02):183–201. doi:10.1007/s11769-018-0938-6
26. Breul M. Cities in 'multiple globalizations': Insights from the upstream oil and gas world city network. Reg Stud Reg Sci (2019) 6(01):25–31. doi:10.1080/21681376.2018.1564628
27. Pan J, Lai J. Spatial pattern of population mobility among cities in China: Case study of the National Day plus Mid-Autumn Festival based on Tencent migration data. Cities (2019) 94(05):55–69. doi:10.1016/j.cities.2019.05.022
28. Li D, Wei YD, Wang T. Spatial and temporal evolution of urban innovation network in China. Habitat Int (2015) 49(10):484–96. doi:10.1016/j.habitatint.2015.05.031
29. Yang H, Dobruszkes F, Wang J, Dijst M, Witte P. Comparing China's urban systems in high-speed railway and airline networks. J Transport Geogr (2018) 68(04):233–44. doi:10.1016/j.jtrangeo.2018.03.015
30. Camagni R, Salone C. Network urban structures in northern Italy: Elements for a theoretical framework. Urban Stud (1993) 30(06):1053–64. doi:10.1080/00420989320080941
31. Malecki EJ. Hard and soft networks for urban competitiveness. Urban Stud (2002) 39(05):929–45. doi:10.1080/00420980220128381
33. Jung W, Wang F, Stanley HE. Gravity model in the Korean highway. Europhys Lett (2008) 81(04):48005. doi:10.1209/0295-5075/81/48005
34. Zhang W, Derudder B, Wang J, Witlox F, Weesep JV. An analysis of the determinants of the multiplex urban networks in the Yangtze River Delta. Tijds voor Econ en Soc Geog (2019) 111(02):117–33. doi:10.1111/tesg.12361
35. Wang J, Delin DU, Jin F. Comparison of spatial structure and linkage systems and geographic constraints: A perspective of multiple traffic flows. Acta Geographica Sinica (2019) 74(12):2482–94. doi:10.11821/dlxb201912005
36. Li J-A, Xie W-J, Zhou W-X. Structure and evolution of the international pesticide trade networks. Front Phys (2021) 9:681788. doi:10.3389/fphy.2021.681788
37. Xie Q, Su J. The spatial-temporal complexity and dynamics of research collaboration: Evidence from 297 cities in China (1985–2016). Technol Forecast Soc Change (2021) 162(01):120390. doi:10.1016/j.techfore.2020.120390
38. Li Y, Phelps NA. Megalopolitan glocalization: The evolving relational economic geography of intercity knowledge linkages within and beyond China’s Yangtze River Delta region, 2004-2014. Urban Geogr (2019) 9(40):1310–34. doi:10.1080/02723638.2019.1585140
39. Powell WWDK, White D, Koput K, Owen-Smith J. Network dynamics and field evolution: The growth of interorganizational collaboration in the life sciences. Am J Sociol (2005) 110(04):1132–205. doi:10.1086/421508
40. Glückler J. Economic geography and the evolution of networks. J Econ Geogr (2007) 7(05):619–34. doi:10.1093/jeg/lbm023
41. Boschma R. Proximity and innovation: A critical assessment. Reg Stud (2005) 39(01):61–74. doi:10.1080/0034340052000320887
42. Ma T, Yin H, Hong T. Urban network externalities, agglomeration economies and urban economic growth. Cities (2020) 107(08):102882. doi:10.1016/j.cities.2020.102882
43. Jiao J, Wang J, Zhang F, Jin F, Liu W. Roles of accessibility, connectivity and spatial interdependence in realizing the economic impact of high-speed rail: Evidence from China. Transport Policy (2020) 91(01):1–15. doi:10.1016/j.tranpol.2020.03.001
44. Weterings ABR. Do firms benefit from spatial proximity? : Testing the relation between spatial proximity and the performance of small software firms in The Netherlands, Utrecht: Utrecht University (2005). 41 06 p. 868–9.
45. Breschi S, Lissoni F. Mobility of skilled workers and co-invention networks: An anatomy of localized knowledge flows. J Econ Geogr (2009) 4(09):439–68. doi:10.1093/jeg/lbp008
46. Alderson AS, Beckfield J, Sprague-Jones J. Intercity relations and globalisation: The evolution of the global urban hierarchy, 1981-2007. Urban Stud (2010) 47(09):1899–923. doi:10.1177/0042098010372679
47. Wen S, Tan Y, Li M, Deng Y, Huang C. Analysis of global remittance based on complex networks. Front Phys (2020) 8:85. doi:10.3389/fphy.2020.00085
48. Scherngell T, Hu Y. Collaborative knowledge production in China: Regional evidence from a gravity model approach. Reg Stud (2011) 45(06):755–72. doi:10.1080/00343401003713373
Keywords: economic connection, innovation connection, urban network, multiple proximity, city attribute
Citation: Tang C and Chai J (2022) Spatial-temporal evolution and proximity mechanism of urban networks in China from the multiplicity perspective. Front. Phys. 10:879218. doi: 10.3389/fphy.2022.879218
Received: 19 February 2022; Accepted: 13 October 2022;
Published: 24 November 2022.
Edited by:
Matjaž Perc, University of Maribor, SloveniaReviewed by:
Satyam Mukherjee, Shiv Nadar University, IndiaZhi-Qiang Jiang, East China University of Science and Technology, China
Copyright © 2022 Tang and Chai. This is an open-access article distributed under the terms of the Creative Commons Attribution License (CC BY). The use, distribution or reproduction in other forums is permitted, provided the original author(s) and the copyright owner(s) are credited and that the original publication in this journal is cited, in accordance with accepted academic practice. No use, distribution or reproduction is permitted which does not comply with these terms.
*Correspondence: Jianan Chai, chaijiananedu@163.com