 Sergio Toro-Maureira
 Juan Reutter2*
- 1School of Government and Public Administration, Universidad Mayor, Santiago, Chile
- 2Department of Computer Science, Pontificia Universidad Catolica de Chile, Santiago, Chile
- 3Instituto Milenio Fundamentos de los Datos, Santiago, Chile
- 4Department of Political Science, Sociology, and Public Administration, Universidad Catolica de Temuco, Temuco, Chile
This paper addresses two central dimensions of legislative behavior: ideological position and voting cohesion. Although both approaches have been widely used to analyze legislative behavior, no unified model currently integrates these dimensions. To fill this gap, the paper proposes a methodology called B-Call, which combines both dimensions by treating votes as random variables. The model is empirically validated using roll-call data from the legislatures of the United States, Brazil, and Chile. The analysis seeks to capture the complexities of voting behavior, resulting in a two-dimensional indicator. This study addresses key gaps in existing legislative voting models, particularly in contexts with limited party control.
1 Introduction
Legislative behavior measurement models have been widely used in political science since the second half of the 20th century. This development highlights at least two predominant lines of research. The first analyzes ideological positioning based on roll-call voting, using tools that locate parliamentarians along a left–right continuum within Euclidean space (Poole and Rosenthal, 1985). The second focuses on voting cohesion, that is, legislative behavior in relation to party dynamics (Snyder and Groseclose, 2000), especially the capacity of political groups to maintain control over decision-making (Rice, 1925).
Both tools have been efficient in characterizing legislative systems around the world, particularly those that are more stable and under stronger party control. However, these techniques often face significant challenges in fragmented and highly volatile party systems. For example, in political contexts such as Brazil or Chile, the measurement of individual ideology and legislative behavior becomes problematic because many legislators neither act consistently with their parties nor follow a stable ideological pattern. The Chilean case is especially illustrative. In its most recent legislature, approximately 16% of deputies resigned from their parties while still in office. Beyond the immediate political implications, these resignations complicated measurement efforts, as their ambivalent conduct artificially placed them at the center of the ideological spectrum, when their behavior reflected ambiguity and a lack of partisan control. This article addresses this complexity by proposing a two-dimensional tool that manages to integrate each legislator’s ideological positioning with their level of cohesion concerning their peers. This model has been named B-Call.
B-Call, that is an abbreviation of Bidimensional Analysis of Roll Call, assumes that votes are random variables in the interval , where represents rejection of a vote, abstention and approval. Consider a legislator , and let be the vote of legislator in the voting , and is the average of all votes for the voting . Then the average of the values over all the voting , is normally distributed, associating a different curve to each legislator. Consequently, we argue both theoretically and empirically that the average of the Gaussian curve of each legislator is related to their ideological position, while the standard deviation is a good estimator of a legislator’s level of cohesion. This means that a low standard deviation represents a legislator who votes according to their ideological position (cohesive behavior), whereas a high standard deviation indicates that the legislator’s votes are less cohesive with their ideological position (volatile behavior).
To test the B-Call model, nominal voting data from the congresses of the United States, Brazil, and Chile are used. These cases were chosen for their academic tradition in measuring legislative behavior and positioning, as well as their similarities and differences in political cycles. Indeed, the three countries have experienced both periods of stability and fragmentation. On the other hand, they exhibit different legislative dynamics. The U.S. Congress, for example, is characterized by two dominant political parties. Brazil, on the other hand, shows a high level of fragmentation in its two legislative chambers. Meanwhile, Chile is transitioning from a system dominated by two coalitions to one that is strongly fragmented. These similarities and differences allow testing the efficacy of B-Call in different contexts.
The article is divided into four parts. The first is a theoretical approach to legislative behavior measurement models, discussing their application in ideological dimensions and voting cohesion. The second part formalizes the measurement model to integrate analysis in both dimensions. The third part involves testing the B-Call model against others traditionally used to analyze legislative behavior. The fourth part is empirical and aims to highlight the advantages of B-Call in terms of adaptability in different political contexts. Finally, a discussion on the scope of this methodology and its future uses is developed.
2 Literature review
Political science has produced multiple methodological approaches to the measurement of legislative behavior. The approach related to ideological positioning is the most prominent. Based in the spatial voting models, these measurements argue that the ideological position of legislators can be inferred through the study of the belief system summarized in an ideological range (Poole and Rosenthal, 1985; Londregan, 2000; Jackman, 2001; Clinton et al., 2004; Quinn, 2004).
There are two widely recognized models that rely on a utility function, assigning choice probabilities to each vote according to the alternatives available in each roll-call vote. These models, known as “NOMINATE” and “IDEAL,” aim to assess a legislator’s decision-making within a set of alternatives that maximize their utility. Both models assume that the legislator assigns a utility to voting for one option over another. In particular, the utility associated with each alternative is determined in part by the spatial distance between the vote and the position most preferred by a legislator; the closer the alternative is to the preferred position, the higher the utility assigned by the legislator. The random utility shocks in both models can be distributed as an extreme value, representing unobserved factors that could affect the choice.
In the case of NOMINATE proposed by Poole and Rosenthal (1985), multidimensional analysis techniques are used to position legislators and votes within a Euclidean political space. The NOMINATE model is based on an agnostic approach to estimate the ideal points of legislators from their voting patterns, treating each vote as a latent expression of their preferences in one or more dimensions. W-NOMINATE introduces improvements by considering the relative importance of different votes, allowing for their differential weighting in the analysis. Similarly, DW-NOMINATE is an evolution of the original W-NOMINATE, designed to track voting patterns over time, incorporating a dynamic component (Poole and Rosenthal, 1997). In the case of W-NOMINATE, the utility function has a Gaussian form intended to capture the probability that a legislator will vote for a particular bill.
On the other hand, the IDEAL indicator is an approximation to the NOMINATE utility function with the implementation of Bayesian methods, which, unlike methods with latent positions, proposes to observe how preferences have been distributed in votes to estimate the relationship between the ideal ideological position for a voting pattern. Studies by Quinn (2004) and the works together with Clinton et al. (2004) represent Bayesian approaches in the analysis of voting behaviors that have been very useful for positioning the preferences of congress members.
This line of research has significantly contributed to improving the understanding of decision-making dynamics in Congress. However, it still faces challenges due to its limited capacity to capture the interaction between individual decisions and the complexities of partisan dynamics. Bateman and Lapinski (2016) point out that the agnosticism of these models generates estimates that do not adequately capture the development of policies and contexts. Similarly, Krehbiel and Peskowitz (2015) demonstrate that the type of legislative organization is a factor that introduces biases into the estimation of these indicators (Zucco and Lauderdale, 2011) find something similar in Brazil, suggesting the need for additional information to distinguish the influence of executive behavior and the setup of roll-call votes in specific policy contexts within changing coalitions. Caughey and Schickler (2016) also highlight the limitations of these indicators in analyzing conflicts and ideological change over time, proposing the use of specific subsets of votes according to the historical context and the purpose of the analysis.
Thus, given the difficulties of measurement in changing and fragmented contexts, new techniques are required for the study of political dynamics. While traditional spatial voting analysis provides valuable insights into the ideological dimensions of political systems, it also has limitations in capturing the multiplicity of ideological and strategic nuances within Congress. This is precisely what we aim to address with the B-Call model, which integrates ideological positioning and voting cohesion into two dimensions. The construction of this model is presented below.
3 B-Call: a two-dimensional model
B-Call treats votes as variables that take values , where indicates the rejection of a vote, abstention, y approval. We use to represent the vote of legislator in vote , where and , with being a set of legislators y a set of votes. Likewise, we use to represent the average of the votes of each legislator in vote .
Our model is based on studying, for each legislator , the sequence of values , which represents how much legislator deviates from the general framework of a particular vote . However, for this value to also be an estimator of the legislator’s ideology, a bit more work is needed. Initially, legislators are divided into two groups, theoretically labeled as left and right. Then, a vote is considered right when : the average of the votes from the left-wing group is less than the average from the right-wing group (i.e., the left group tended to reject that vote more than the right group). Conversely, the vote is left when . For each vote, a function is defined as as if (the vote is right-wing) or if (the vote is left-wing). The function is used as a transformation to determine if the legislator leaned more to the left or right than the average: if is negative, it means one of the following two statements is true: either and , meaning that legislator rejects a vote where the left tended to reject more than the right, or and , meaning that legislator approves a vote in which the left tended to approve more than the right. Intuitively, in both cases, the legislator voted more towards the left than average. Likewise, a positive value indicates that the legislator tended to approve a vote in which the right tended to approve as much or more than the left, or that legislator tended to reject a vote where the right rejected as much or more than the left. In other words, the legislator voted more towards the right than average.
Our model, then, assumes that the votes of legislator are random events (according to some unknown distribution), and moreover, that the values for the same legislator are independent and distributed according to the same random distribution. Thus, the central limit theorem ensures that the distribution of these magnitudes converges to a normal distribution, upon which we can estimate its mean and variance. More specifically, and adding a standardization factor, the dimensions of the model consist of estimating the mean and standard deviation of the indicator for legislator and vote , which results from the standardization of the vote with the average of the vote and the standard deviation :
Based on these assumptions, the sequence of values provides a good estimate for the mean and variance of the underlying Gaussian distribution for each legislator. These two measures correspond to the two dimensions of B-Call, and can be used to estimate the ideological position of legislators, as well as the cohesion of their votes.
3.1 First dimension: ideological position
The first dimension of the model corresponds to the average of the values for each legislator . As mentioned, this average is an estimator of the mean of the normal distribution associated with this legislator. This dimension is associated with legislator ’s ideological position in the political center. A negative or positive sign of places legislator on the left or the right, respectively, and the magnitude of indicates how far this legislator is from the political center.
One important component of our model is that it relies on a prior classification of legislators as left- or right-leaning, dividing them into two groups to compute values and . This division can be carried out using previous knowledge, or with any other unsupervised strategy such as clustering. Legislators will have a positive or negative ideological score depending on which group they belong, but our experiments show that the complete ideological positioning is not altered with this choice. For example, if some legislators are wrongly classified as left leaning, the first dimension will (wrongly) locate them at the left of the center axis (instead of at the right), but the relative ideological ordering of these legislators, compared to the rest, will maintain its consistency (see Appendix 3).
3.2 Second dimension: cohesion
Given that the values converge to a normal distribution, it is relevant to consider the standard deviation. For example, consider Figure 1. This figure shows the probability density function of two different Gaussian curves, estimated from the actual votes of two deputies elected by the same party in the Chilean congress. On the -axis, we locate the ideological position of each vote, estimated as the average of the , values, and on the -axis, the probability density function that a new value corresponds to that ideological position. The green line represents the distribution of deputy , with low standard deviation, which means that the votes of deputy are generally aligned with what the rest of the legislators of a similar ideological position vote. In contrast, the red line shows who, although ideologically seems to be close to , has a much greater standard deviation. Therefore, deputy tends to vote in a much more fluctuating manner in the political spectrum, despite being ideologically similar to deputy , that is, .
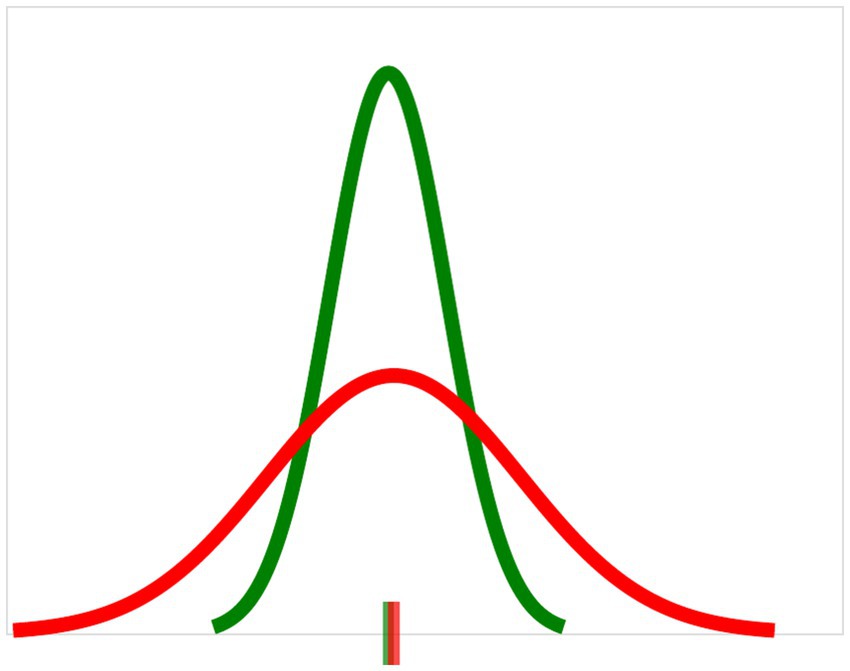
Figure 1. Probability distribution of votes from two legislators. In green and red, the probability density function estimated from the votes of two Chilean legislators is graphed. While there are similarities in their ideological positions, defined here as the mean of the legislators’ voting distribution, the distribution of the green legislator is much more stable, whereas the red legislator has more variable votes. This notion is captured by measuring the standard deviation of the distributions.
The previous case exemplifies the need to identify, across the political spectrum, which legislators have lower levels of cohesion. In this regard, it is proposed that the second dimension associated with legislator be the standard deviation of the values, as indicated by the following equation.
3.3 The union of both dimensions: an example of B-Call
To understand the relationship between the two dimensions, Figure 2 presents the interaction between the dimensions of ideological positioning and cohesion. This interaction reflects complex and nuanced dynamics of legislative behavior. By analyzing the first dimension, the ideological spectrum of the legislators is identified through the average of their votes, giving us a first look at their general political inclinations. In turn, the second dimension allows observing the cohesion of the legislators through the variability of their votes.
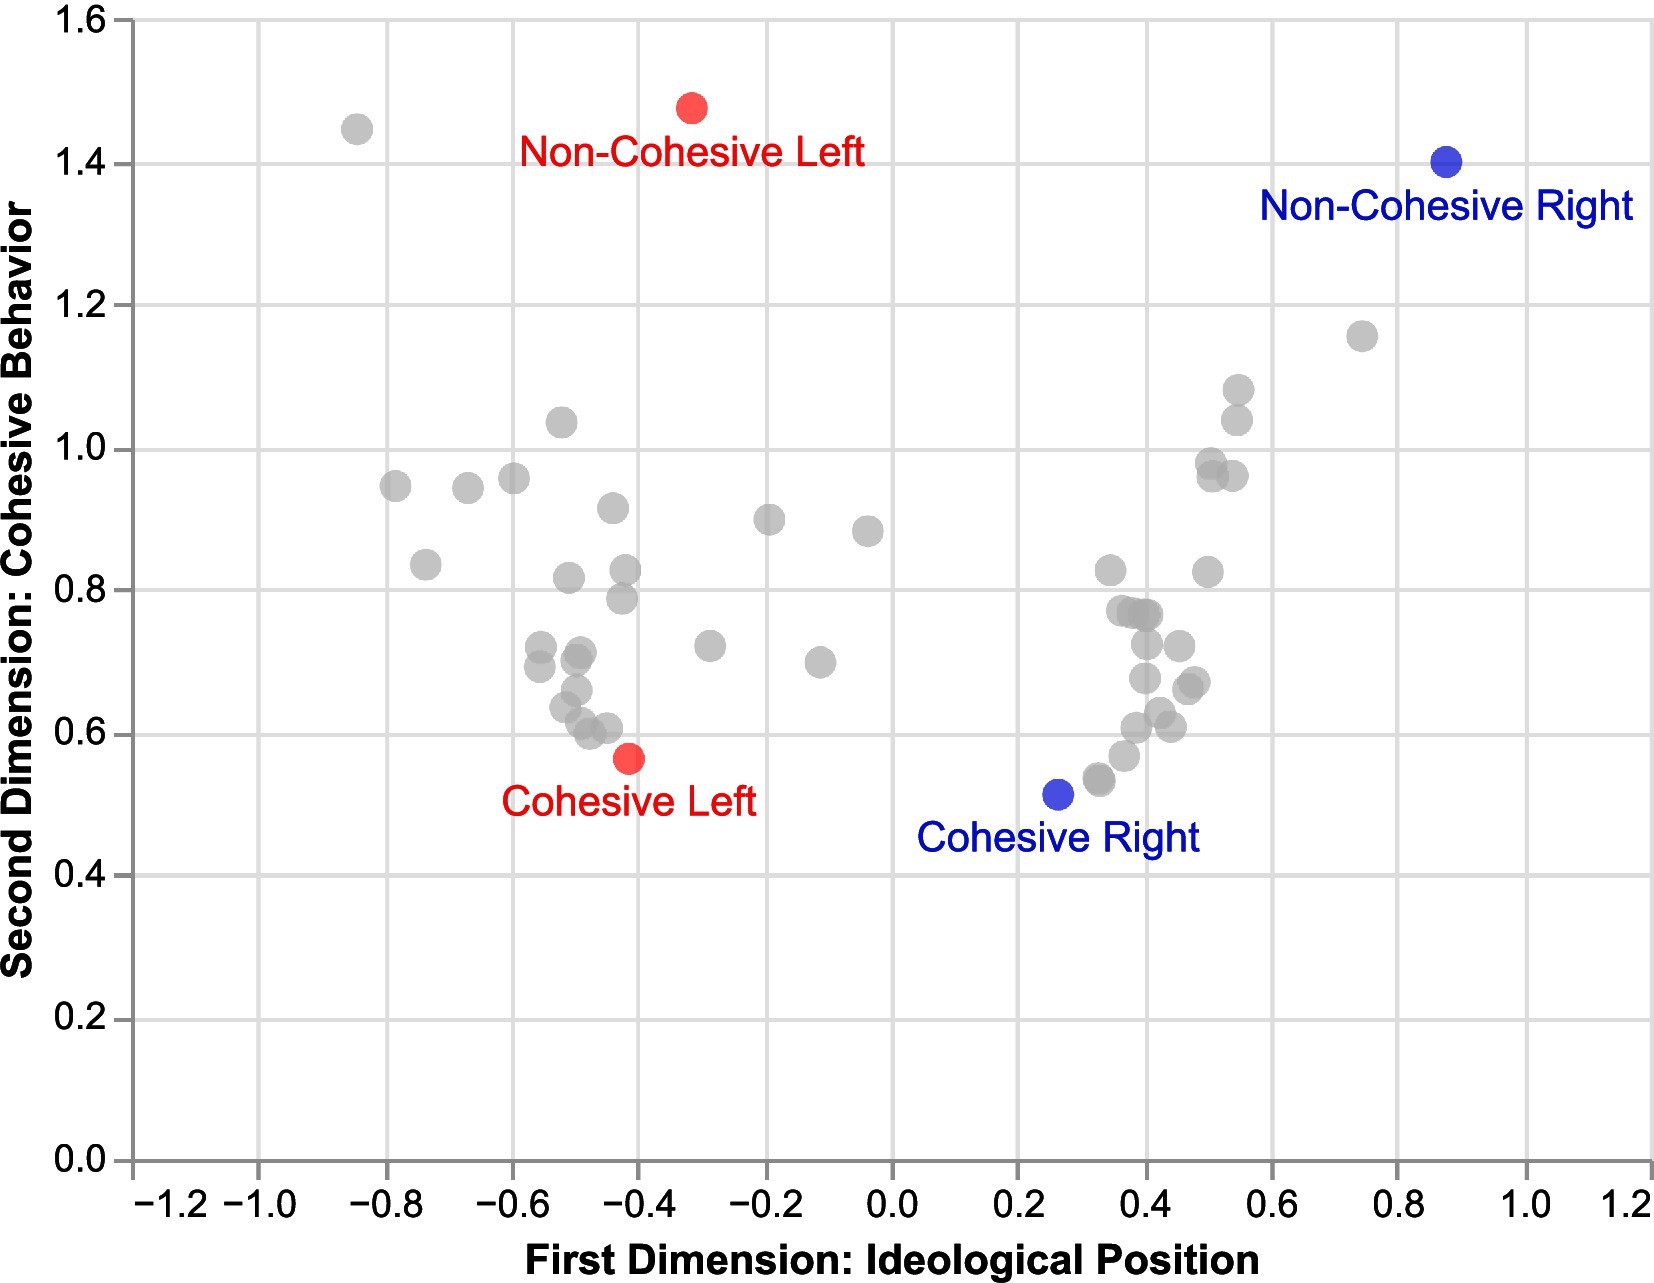
Figure 2. B-Call enables identification of different dynamics through the analysis of its two dimensions: ideological position y cohesion.
B-Call allows for the identification and quantification of different underlying behaviors in voting patterns. For instance, legislators with low standard deviation, depicted in our figure as red and blue dots labeled “Cohesive-Left” and “Cohesive-Right,” demonstrate high cohesion in their voting patterns. This indicates that, despite their diverging political positions, both exhibit a significant level of predictability and uniformity in how they vote relative to their respective ideological stances.
In contrast, those legislators positioned at the top of the figure, showing high standard deviation, pose challenges to the traditional notion of ideological stance. These cases highlight the presence of legislators whose votes are ideologically marked but highly variable, suggesting an independence that could transcend known ideological divisions. This variability can be interpreted in various ways, including responses to specific pressures, increasing personalism, and fragmentation.
Looking at Figure 2, one may worry that both B-call dimensions are not truly independent, since more extreme ideological positions tend to display higher volatility. In theory, the mean and variance of distributions need not be correlated, so there is nothing intrinsic in B-Call that would lead to such results. What we see in Figure 2, especially on the right, reflects the political reality that extreme legislators tend to offer more unpredictable voting behavior, rather than a mechanical dependence between both dimensions. But there are also examples of more centrist legislators with unpredictable behavior (see left), and this highlights why both dimensions are important for the analysis.
By integrating both dimensions, B-Call not only facilitates the identification of voting patterns but also provides a better understanding of legislative behavior in each congress. Quantifying voting variability, anchored to the ideological positioning, this variability, or lack thereof, offers a better understanding of the underlying political strategies at different levels, but mainly at the legislator level without the need for aggregation levels like parties or blocs.
4 Comparison with other models
This section will compare the two theoretically defined dimensions for B-Call with other widely used models for analyzing legislative behavior. For the ideological dimension (first dimension), we will examine the correlations of B-Call with W-NOMINATE and Item Response Theory (IRT). For this comparison, we used voting information from the legislative chambers of three countries (United States, Brazil, and Chile) between 2003 and 2022.
4.1 Correlation of B-Call with W-NOMINATE
For each legislative chamber, the dimensions of our model and of W-NOMINATE were calculated. For this, we decided to analyze the data on an annual basis, which, in some cases in the Brazilian Senate, resulted in the inability of W-NOMINATE to calculate legislators’ scores due to the low number of votes. For this model, legislators were divided into left and right according to the first dimension estimated by W-NOMINATE. This decision was made because the goal is to compare B-Call with W-NOMINATE estimations.
Firstly, the Pearson correlation and its standard errors between the first dimension of the model and the first dimension of W-NOMINATE were calculated. Overall, the results indicate a very strong positive correlation, suggesting they are significantly aligned in the scores associated with ideological position. On average, the highest correlations are found for the Chilean Chamber of Deputies and the U.S. House of Representatives. Brazil, comparatively, shows the worst average correlations.
Furthermore, the Spearman correlation between the first dimension of B-Call and the first dimension of W-NOMINATE was also calculated. The Spearman correlation corresponds to the Pearson correlation applied to the order in which each value appears, rather than the value itself. This allows us to analyze in more depth how both models compare when ideologically ranking legislators, regardless of the magnitude of each value. Several cases with low Pearson correlations are observed. All Spearman coefficients are very strong positives and exceed , indicating that both B-Call and W-NOMINATE produce a very similar ideological ordering.
The results of both correlations are found in the Tables 1, 2.
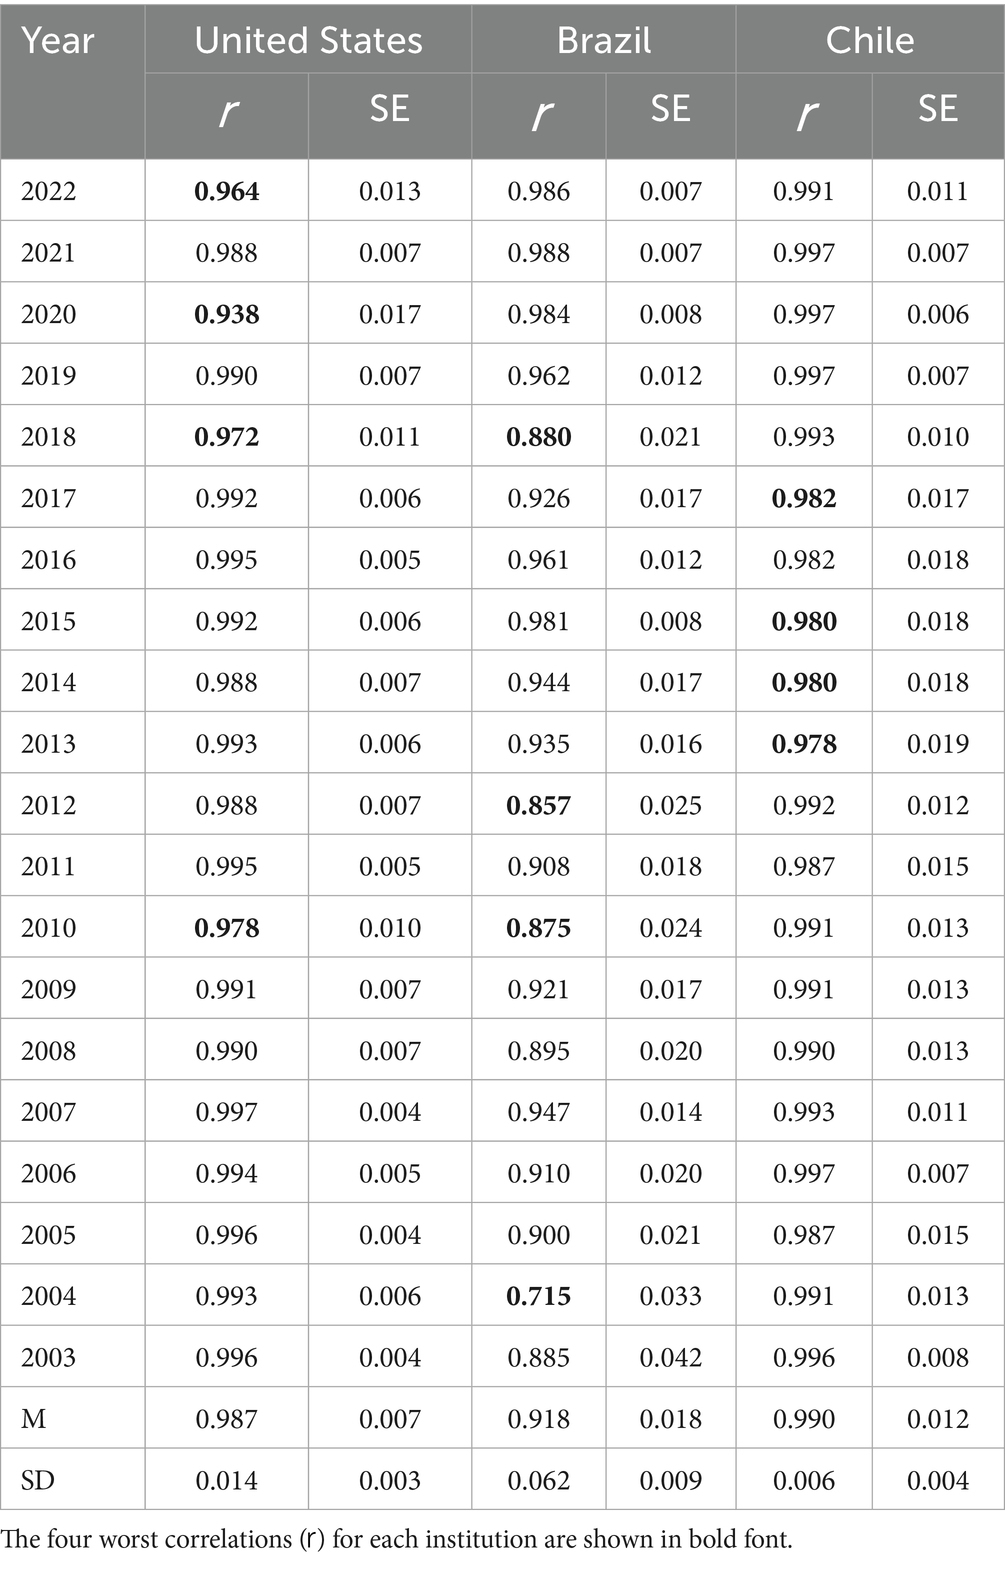
Table 1. Pearson correlation () and standard deviation (SE) between the first dimension of our model and W-NOMINATE.
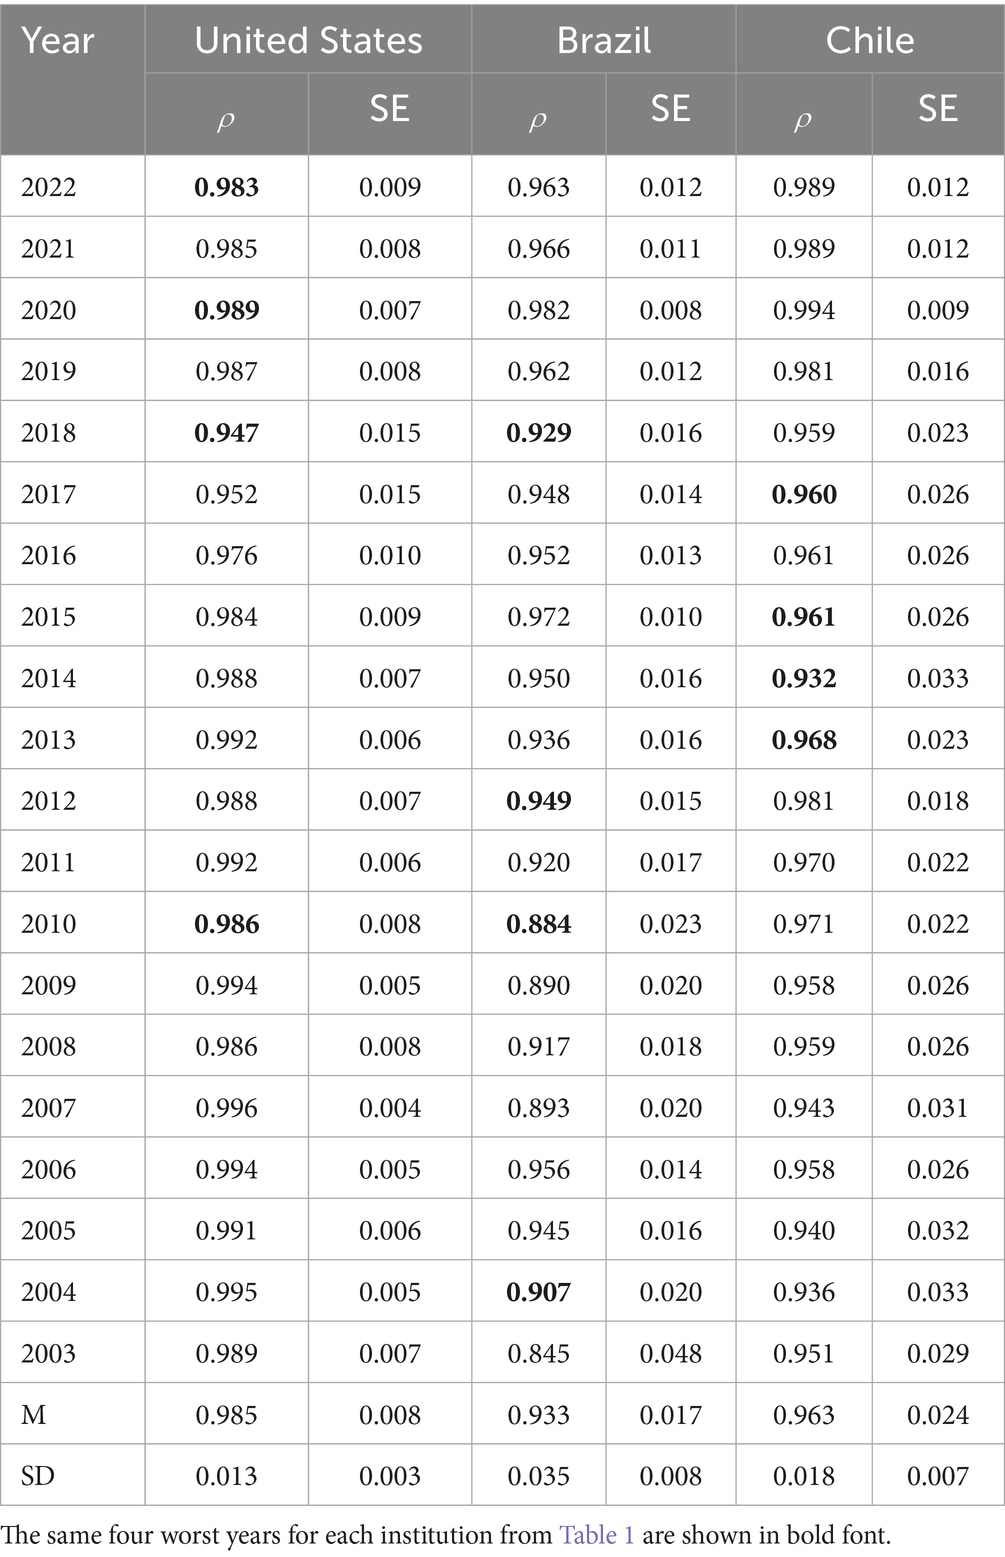
Table 2. Spearman correlation () and its standard deviation (SE) between the first dimension of our model and W-NOMINATE.
4.2 Correlation of B-Call with IDEAL
Another prominent framework for roll-call scaling is the Item Response Theory (IRT), and particularly the two-parameter (2PL) logistic models. This section compares B-Call with IDEAL, one such 2PL IRT model. Like B-Call, IDEAL estimates ideological positions for legislators, but it does so in a Bayesian setting, fitting the ideological position of legislators together with curves for each roll-call that model the probability that a given legislator votes in favor of the call. B-call takes a much simpler and transparent route, where the ideological position is not fitted vote-by-vote, but rather obtained as the average of each (standardized) vote. This results in parameters that are easier to compute, easier to interpret, and from which we can also extract the variance as a second dimension. Further, we show B-Call yields consistently high correlations with IDEAL, just as we did for NOMINATE. Table 3 reports Pearson correlation coefficients for the U.S., Brazilian, and Chilean chambers, all above 0.80. Using Spearman correlations (Table 4) produces similar results, with the lowest coefficient being 0.85. These findings indicate that the latent first dimension estimated by B-Call closely aligns with that obtained from IDEAL across all cases considered.

Table 3. Pearson correlation () and standard deviation (SE) between the first dimension of our model and IDEAL.
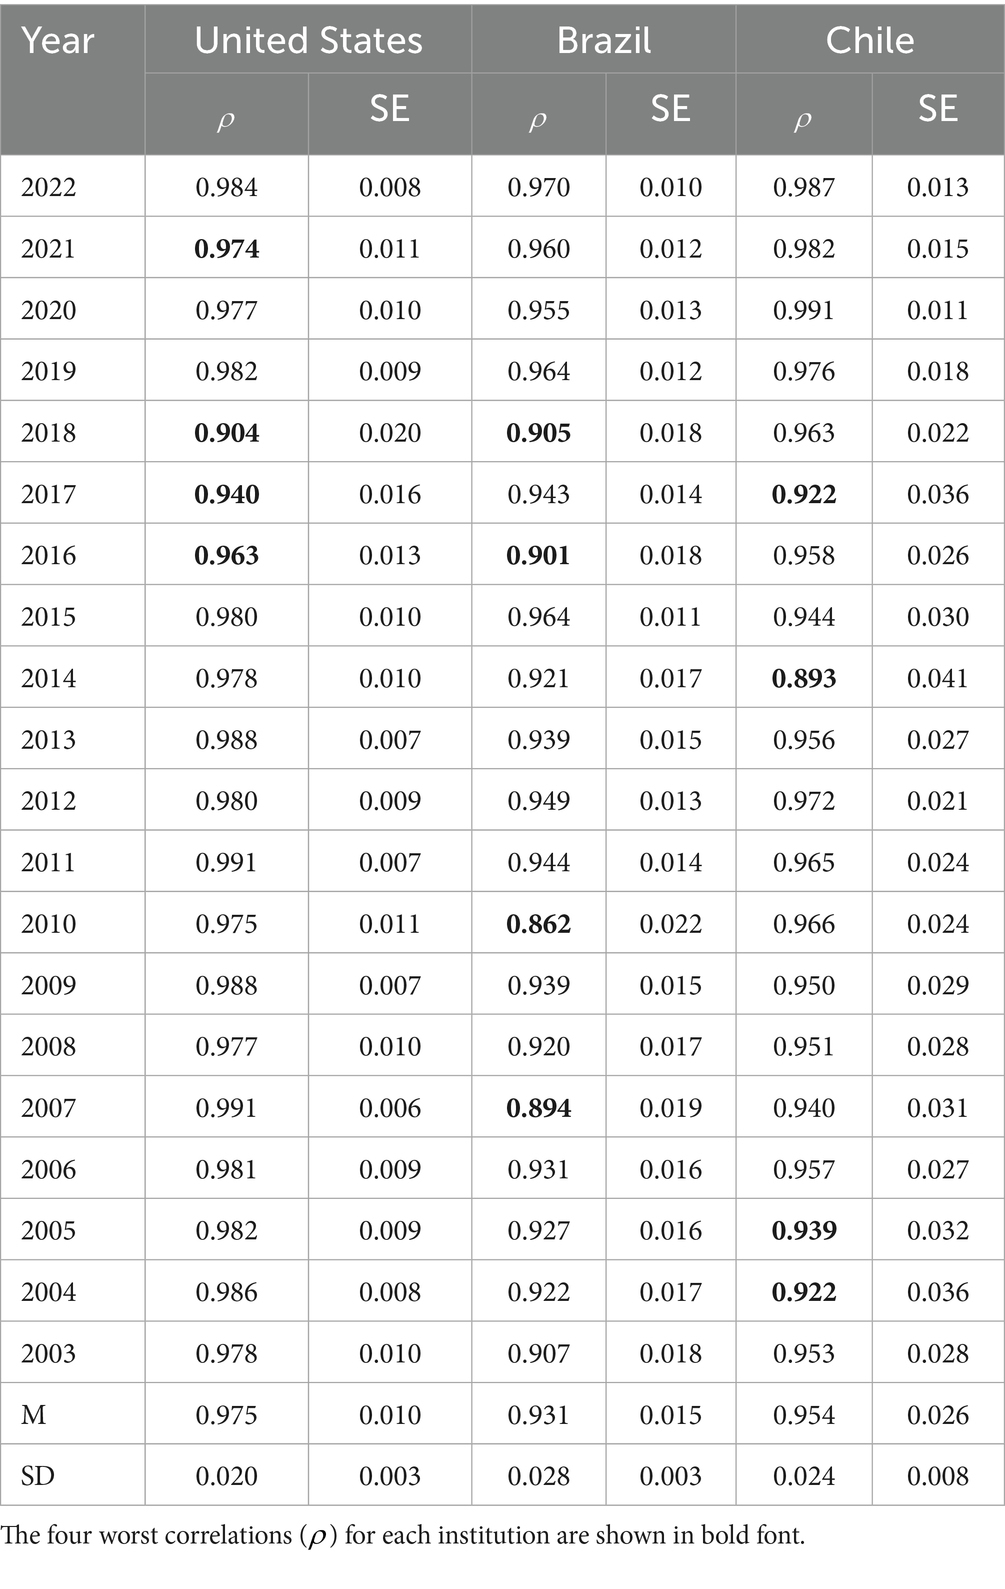
Table 4. Spearman correlation () and its standard deviation (SE) between the first dimension of our model and IDEAL.
5 Empirical evaluation of B-Call and advantages over other models
5.1 B-Call’s contribution to calibrating the ideological positioning of legislators with low cohesion
One of the strengths of B-Call is its ability to analyze the two main dimensions of legislative behavior and apply these analyses in both stable and fragmented decision-making environments. This advantage is significant. As noted by Krehbiel and Peskowitz, traditional indicators often encounter problems when parliamentary behaviors are less cohesive, inconsistent, or volatile. Thus, while a high correlation has been demonstrated between the first dimension of the indicator and the traditional W-NOMINATE, attention should also be directed to cases where this correlation is not direct, especially where legislators exhibit very low cohesion in their voting decisions.
Using data from the previously mentioned countries, Figure 3 illustrates three cases where there is no correlation between our model and the W-NOMINATE indicator due to the low cohesion of their behavior. In this figure, the ten legislators with the lowest cohesion are highlighted in black. It’s noteworthy that several legislators with the greatest discrepancies between the first dimension of B-Call and W-NOMINATE are those with lower group cohesion in voting. In simple terms, B-Call can help resolve the confusion of W-NOMINATE results for those congress members with high vote decision volatility.
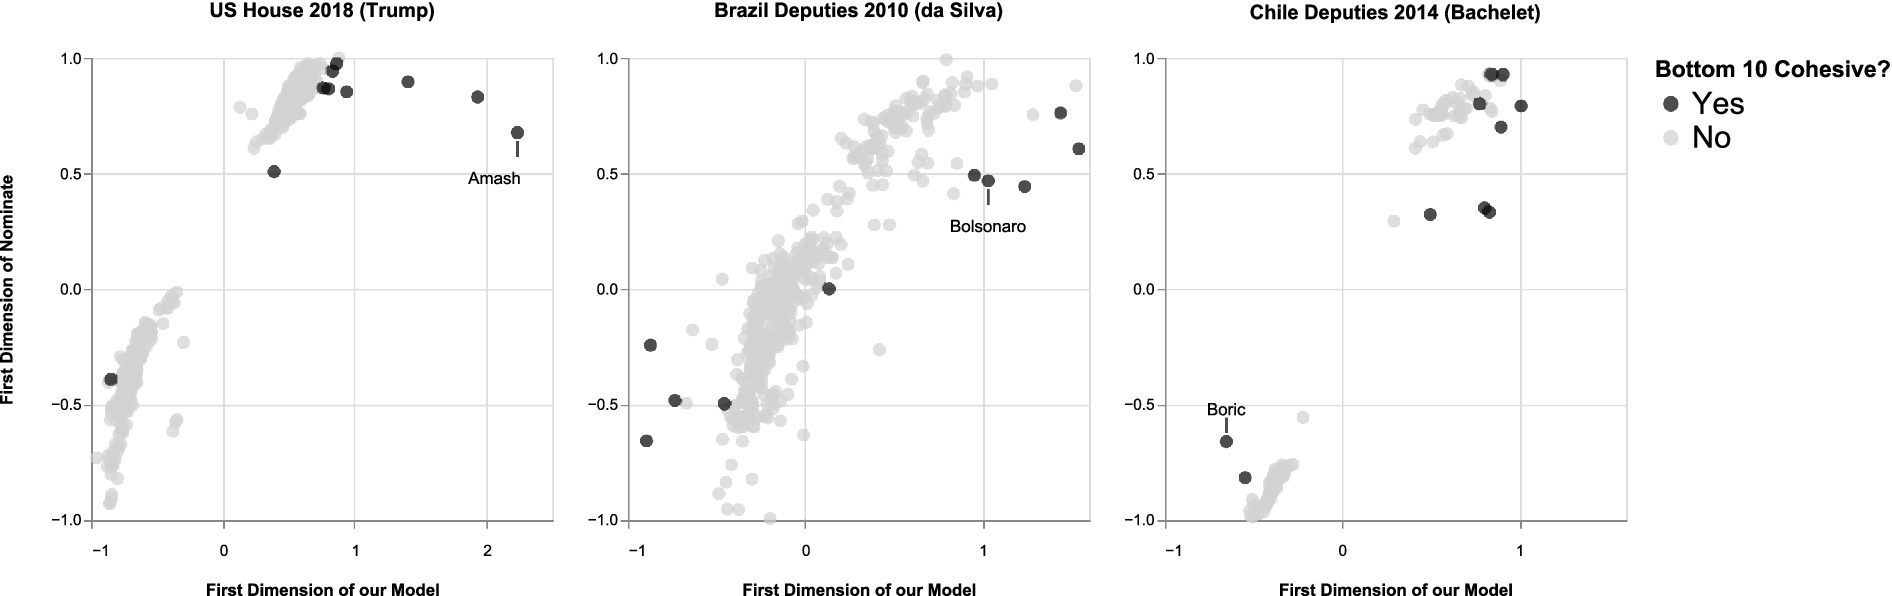
Figure 3. Discrepancies in the ideological estimation.
Concrete examples of legislators whose votes did not follow a party cohesion line will be presented. These examples empirically demonstrate the strength of B-Call over traditional methods. The first is the analysis of the United States Congress in 2018. In this case, W-Nominate shows that U.S. Representative Justin Amash, a Republican and member of the Liberty Caucus until 2019, is positioned as a moderate within the Republican party despite being known as a far-right actor. Similarly, W-NOMINATE positioned two other legislators close to the Liberty Caucus, Thomas Massie and Andrew Bigg, nearer to the ideological center.
The voting analysis demonstrates that these representatives are less cohesive compared to their peers, distorting the positioning measured through traditional techniques. By using B-Call, the legislator’s positioning is corrected for cohesion dimension, placing them more accurately ideologically. The same is observed for Brazil and Chile. In Brazil, despite a marked right-wing stance, W-NOMINATE placed Jair Bolsonaro in 2010 in a much more moderate ideological position, whereas our model considers him as one of the most conservative deputies with low cohesion levels. In Chile 2014, Gabriel Boric was seen by W-NOMINATE as a centrist within the left, while B-Call defines him to the left of the ideological spectrum. In both cases, a detailed inspection of their voting confirms B-Call as a viable alternative for measuring parliamentary behavior.
Another aspect worth noting is that there may be a difference in the way both models space each legislator, even if correlation between NOMINATE and B-Call is high. Consider, for example, the lower-left quadrant in Figure 3 (US House 2018). Figure shows a high correlation, but B-call appears to place the ideological estimates of Democrats much closer together than NOMINATE estimation. The spread between legislators in B-Call is not altered, so it may happen that several legislators with highly consistent voting records appear very densly packed, but this is merely a reflection of the reality. By contrast, NOMINATE emphasizes spatial discrimination, which may yield a wider spread of estimated positions.
5.2 Adaptability of B-Call to analyze different legislative contexts
This section will evaluate the model in roll-call votes of the congresses of the United States, Brazil, and Chile over a 20-year period from 2003 to 2022, for both the lower and upper houses. This broad examination across different periods and legislative chambers in three countries aims to test the model’s effectiveness in stable and fragmented congressional periods, demonstrating B-Call’s empirical utility in capturing both the ideological positioning and the cohesion of legislators’ voting.
The U.S. data were obtained from Lewis et al. (2023), while Brazilian and Chilean voting data were obtained from their respective official open data sections (Camara.leg.br, Senado.leg.br, Camara.cl, and Senado.cl). To avoid distortions in the analysis, legislators who voted in less than 10% of the cases were excluded. Moreover, the left–right division of legislators was determined using a clustering algorithm based on voting behavior (see Supplementary Material). In each institution, eight legislators were arbitrarily selected, either because of their relevance or their low cohesion.
5.2.1 United States
Analysis using B-Call across various legislative periods in the United States reveals dynamic changes in the House of Representatives’ behavior throughout the first two decades of the 21st century. Figure 4 illustrates the division between Democrats and Republicans from 2003 to 2008 under the Bush administration, transitioning to a bridging of the ideological gap during the Obama years (2009–2014). However, in the last legislative period of Obama’s presidency (2015–2016), the division between the two parties became pronounced again. Under the Trump administration, this division deepened with an increasing number of Republican representatives showing low cohesion. During the 2019–2020 legislative period, Democrats appeared organized and cohesive, while Republicans displayed greater ideological spread and lower cohesion, indicating emerging ideological dissonance within the Republican Party.
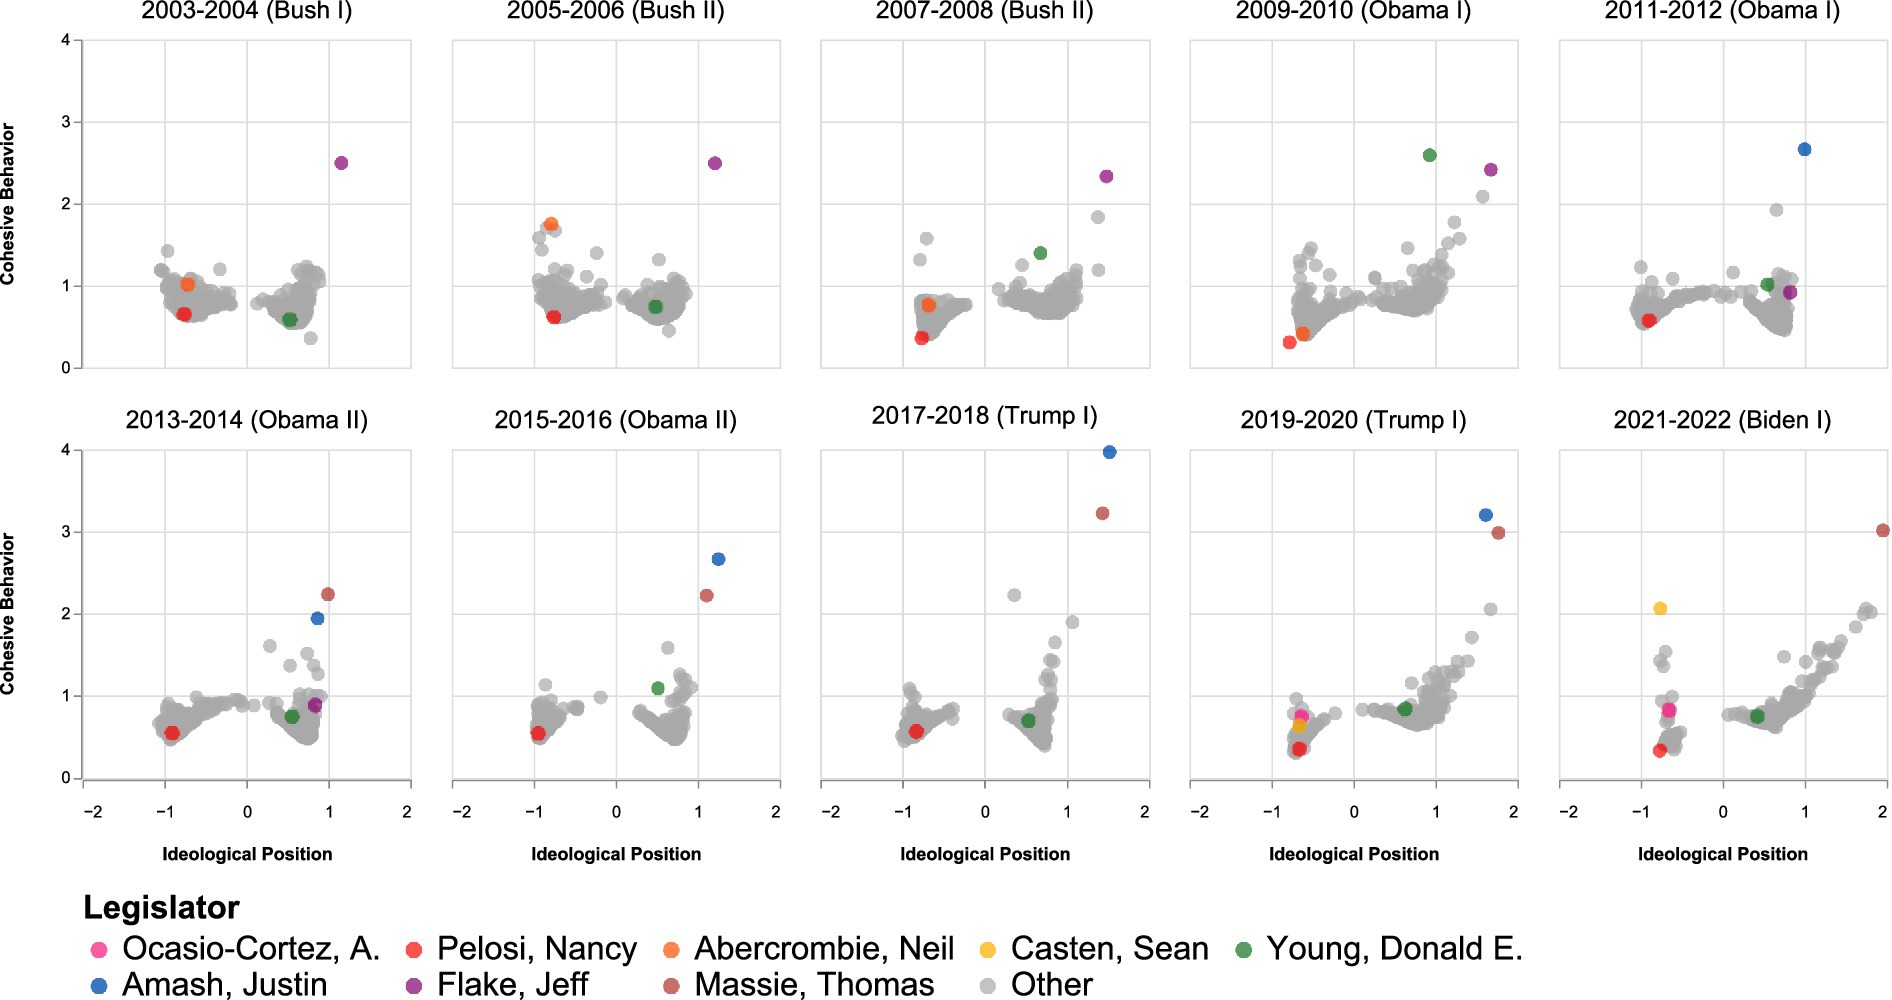
Figure 4. United States house of representatives between 2003 and 2022. Although representative Rand Paul met the minimum number of votes between 2003 and 2010, he was excluded from these periods to improve the visualization. In these 4 legislative periods, he had low cohesion and was the most right-leaning legislator.
Within the Democratic Party, Figure 4 highlights Nancy Pelosi and Alexandria Ocasio-Cortez. Over the 20 years analyzed, Pelosi has been in the House of Representatives, consistently aligning with the left wing of the Democratic Party and maintaining a high level of cohesion, meaning Pelosi has consistently voted in line with her faction. This contrasts with Ocasio-Cortez, who during the 2019–2020 and 2021–2022 periods has been among the less cohesive Democratic legislators. Notably, Representative Sean Casten was the Democrat with the lowest level of cohesion during 2021–2022, despite exhibiting similar voting behavior to Ocasio-Cortez in the previous period. Among Republicans, Representatives Justin Amash, Jeff Flake, Thomas Massie, and Donald Young stand out, as they tend to occupy the far-right wing of the party and exhibit low levels of cohesion.
B-Call was also tested on the evolution of the United States Senate. Figure 5 shows the results of a division between Democrats and Republicans during the Bush Administration. It also shows that in the last legislative period (2007–2008), a large part of the Democratic senators had cohesive behaviors, in contrast, the Republican senators were less so. This dynamic extends from 2007 to 2014. The analyses of the two-dimensional tool reflect that in the last legislative period (2015–2016) during the Obama Administration, the Senate was divided into similar poles between Democrats and Republicans. Then, during the Trump Administration, Republicans voted in a cohesive manner, while Democrats became more disordered. Finally, the legislative period 2021–2022 during the Biden Administration shows a relative symmetry between both parties. Both Democrats and Republicans present senators with low and high levels of cohesion, and there is a group of centrist legislators who bridge both political forces.
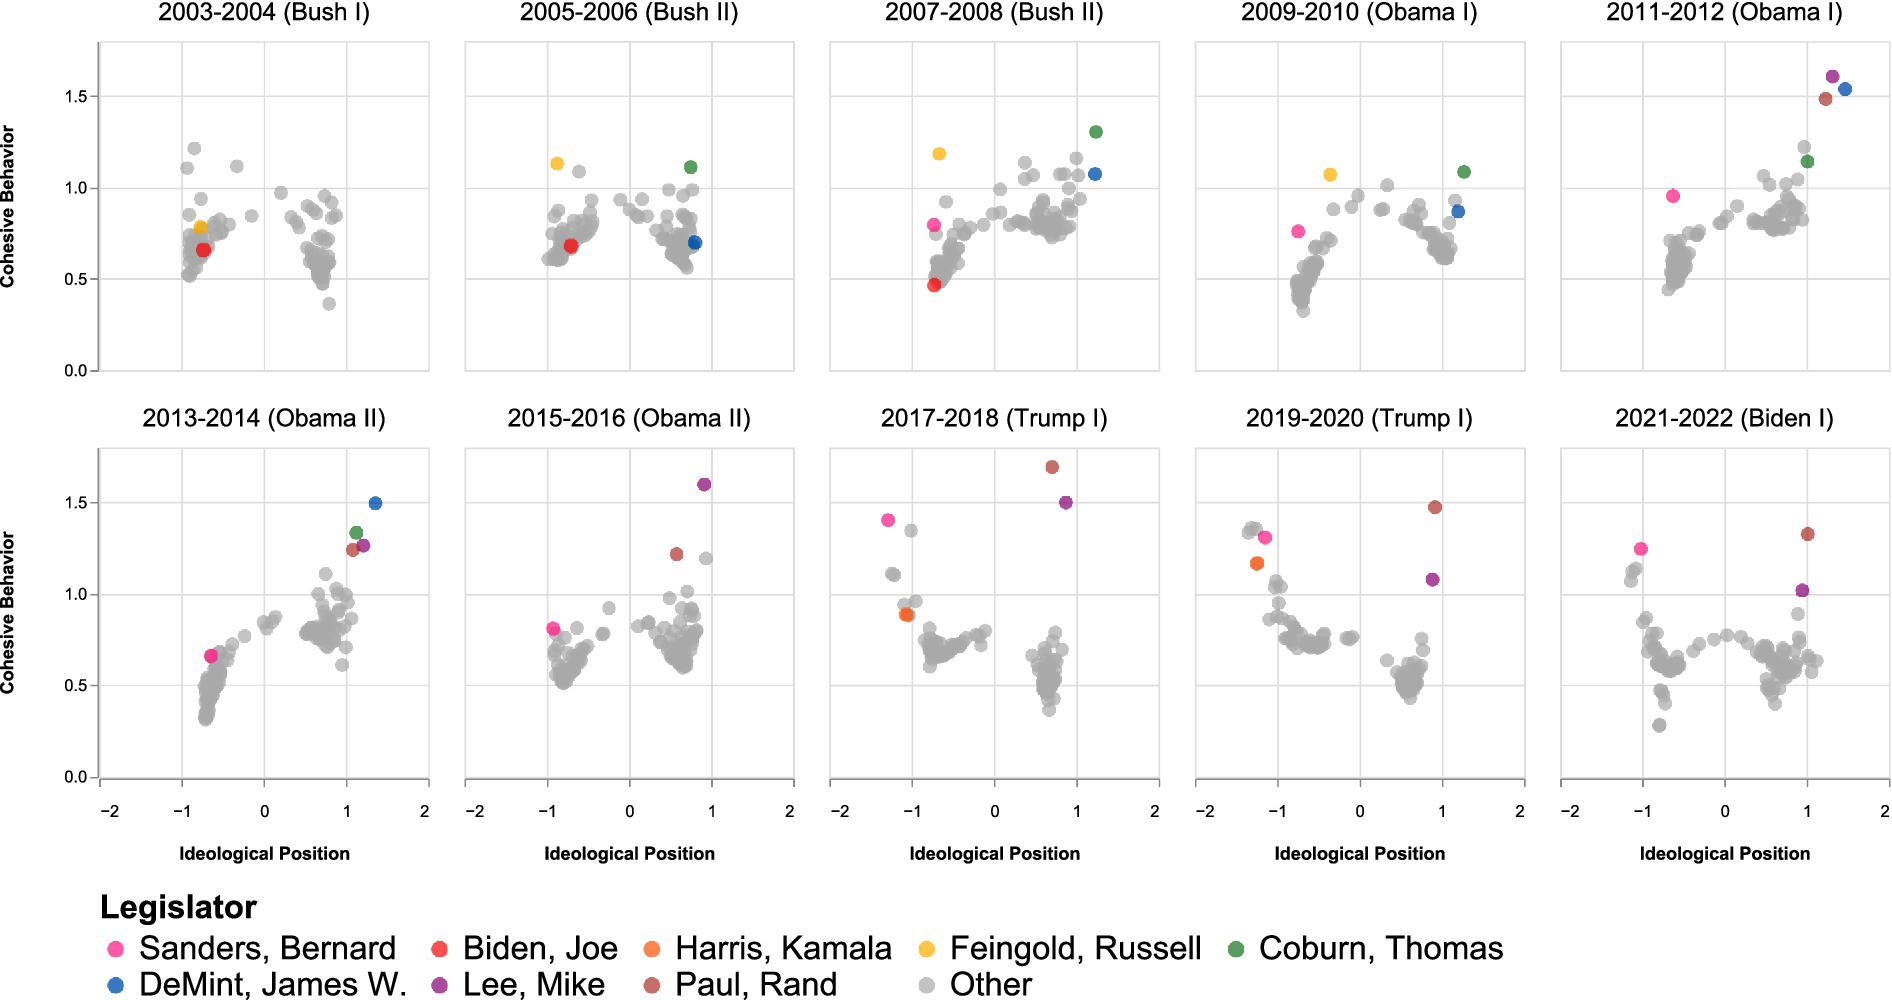
Figure 5. United States Senate between 2003 and 2022. The votes of Presidents Obama and Biden, as well as Vice President Harris, during their terms as executive authorities are not included.
In Figure 4, eight senators are presented. Among the liberals, Bernie Sanders and Kamala Harris exhibit different voting behavior compared to Joe Biden. Sanders is not only positioned as one of the most liberal senators in the Senate but has also often been the least cohesive senator in the entire liberal sector. During her two terms, Harris similarly positioned herself on the far-left side of the Democratic Party, with low levels of cohesion. In contrast, Biden was positioned in the center of the Democratic Party between 2003 and 2006, though in his last period, 2007–2008, which coincided with his vice-presidential candidacy, he is located in the most liberal sector of the Democrats and with high cohesion. Among the Republicans, Senators Thomas Coburn, James DeMint, Mike Lee, and Rand Paul occupy the most extreme and least cohesive positions.
5.2.2 Brazil
The Brazilian context differs completely from the U.S. one, especially due to the high fragmentation of its political system. In such a context, the strengths of B-Call are tested in a highly personalistic and volatile decision-making environment. This personalism is captured by the tool, as it notes diffuse divisions between political forces. Figure 6 shows Brazilian deputies grouped in a large cluster with low cohesion and identifies legislative periods, like 2007–2010 under Lula da Silva’s administration and 2019–2022 under Bolsonaro’s government, where divisions are observed. Similar to the deputies, the Brazilian Senate (Figure 7) does not show a clear separation between two political forces.
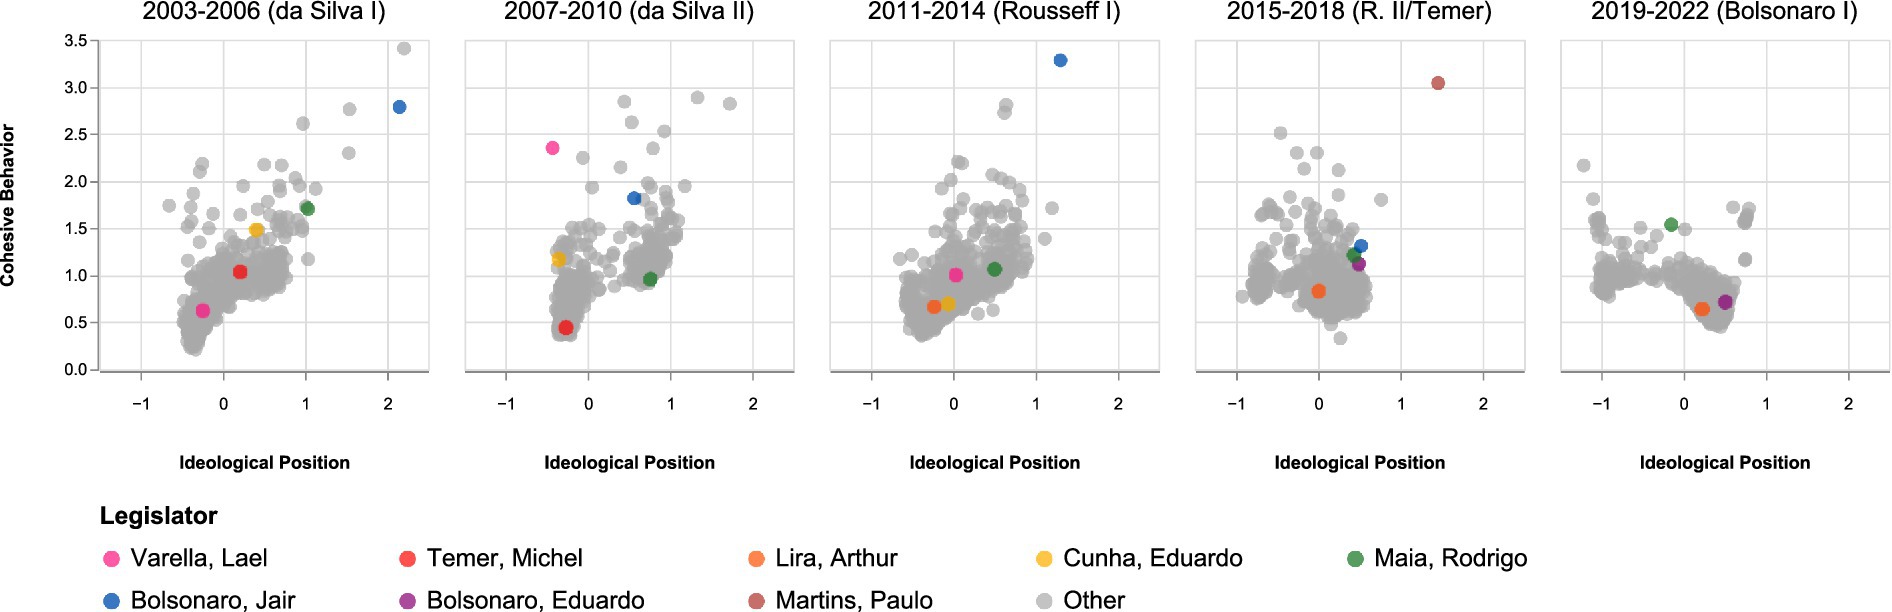
Figure 6. Brazil Chamber of deputies between 2003 and 2022.
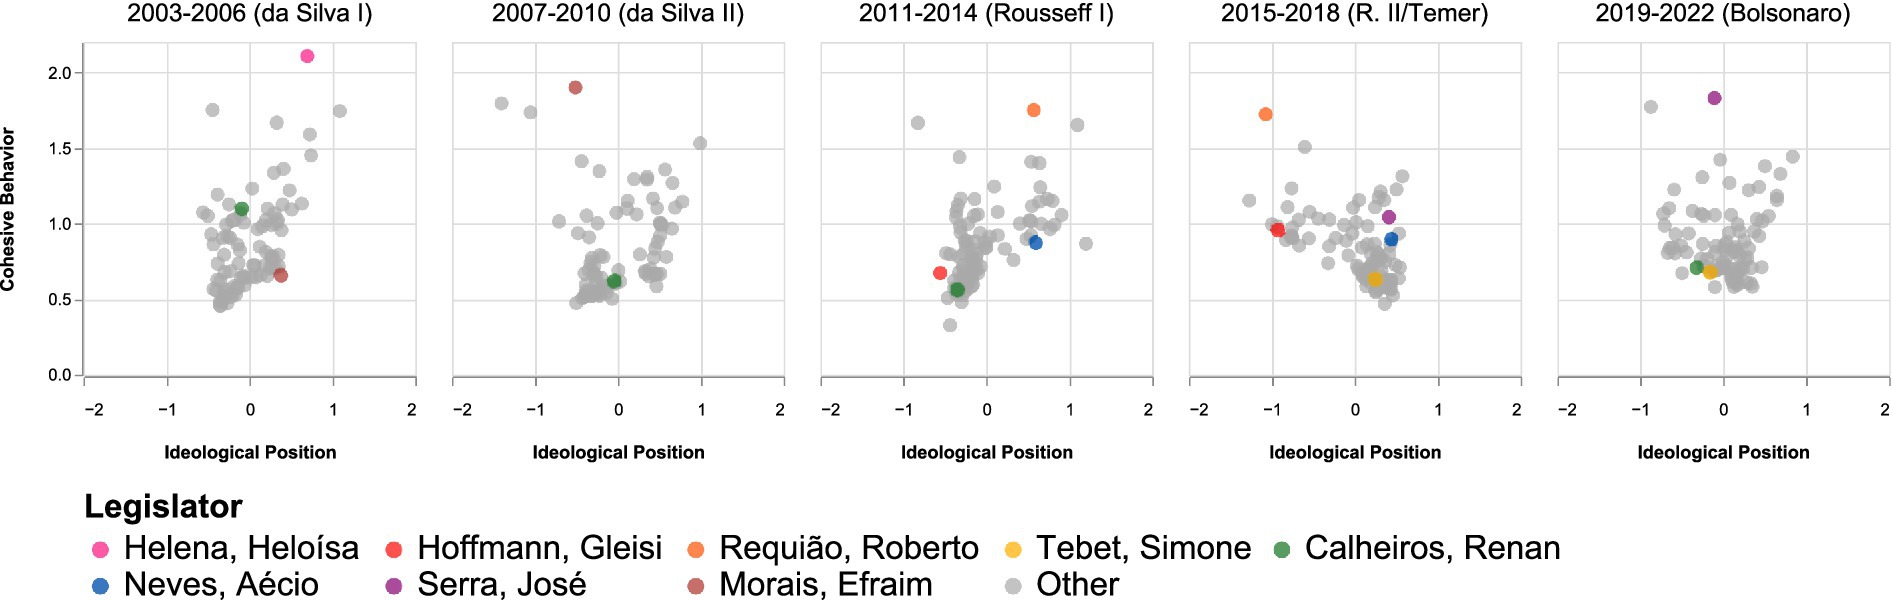
Figure 7. Brazil Senate between 2003 and 2022.
In individual analysis, Jair Bolsonaro presents as a deputy with very little cohesion toward his sector. During his tenure as a deputy between 2003 and 2018, he was mostly a parliamentary actor positioned further to the right of his sector and uncohesive. B-Call shows that Bolsonaro was one of the most right-leaning and least cohesive legislator according to his voting behavior (see Figure 6).
5.2.3 Chile
B-Call is then tested in Chile, a country that maintained relative stability within Congress until 2018 before exhibiting a high level of party fragmentation. The analysis, shown in Figure 8, reveals that under the Concertación governments (up to 2009), there was a clear division between the government (left) and opposition (right). It also shows that with the arrival of Piñera in 2010, the left experienced greater dispersion, with deputies positioned at the far-left extremes not previously seen in Congress. B-Call further indicates that cohesion problems began to surface before the electoral change. During Bachelet II, for instance, legislators with lower levels of cohesion appeared, becoming more evident in the last Piñera II government, where partisan divisions dissolved and personalism with low political cohesion began to emerge (Figure 8).
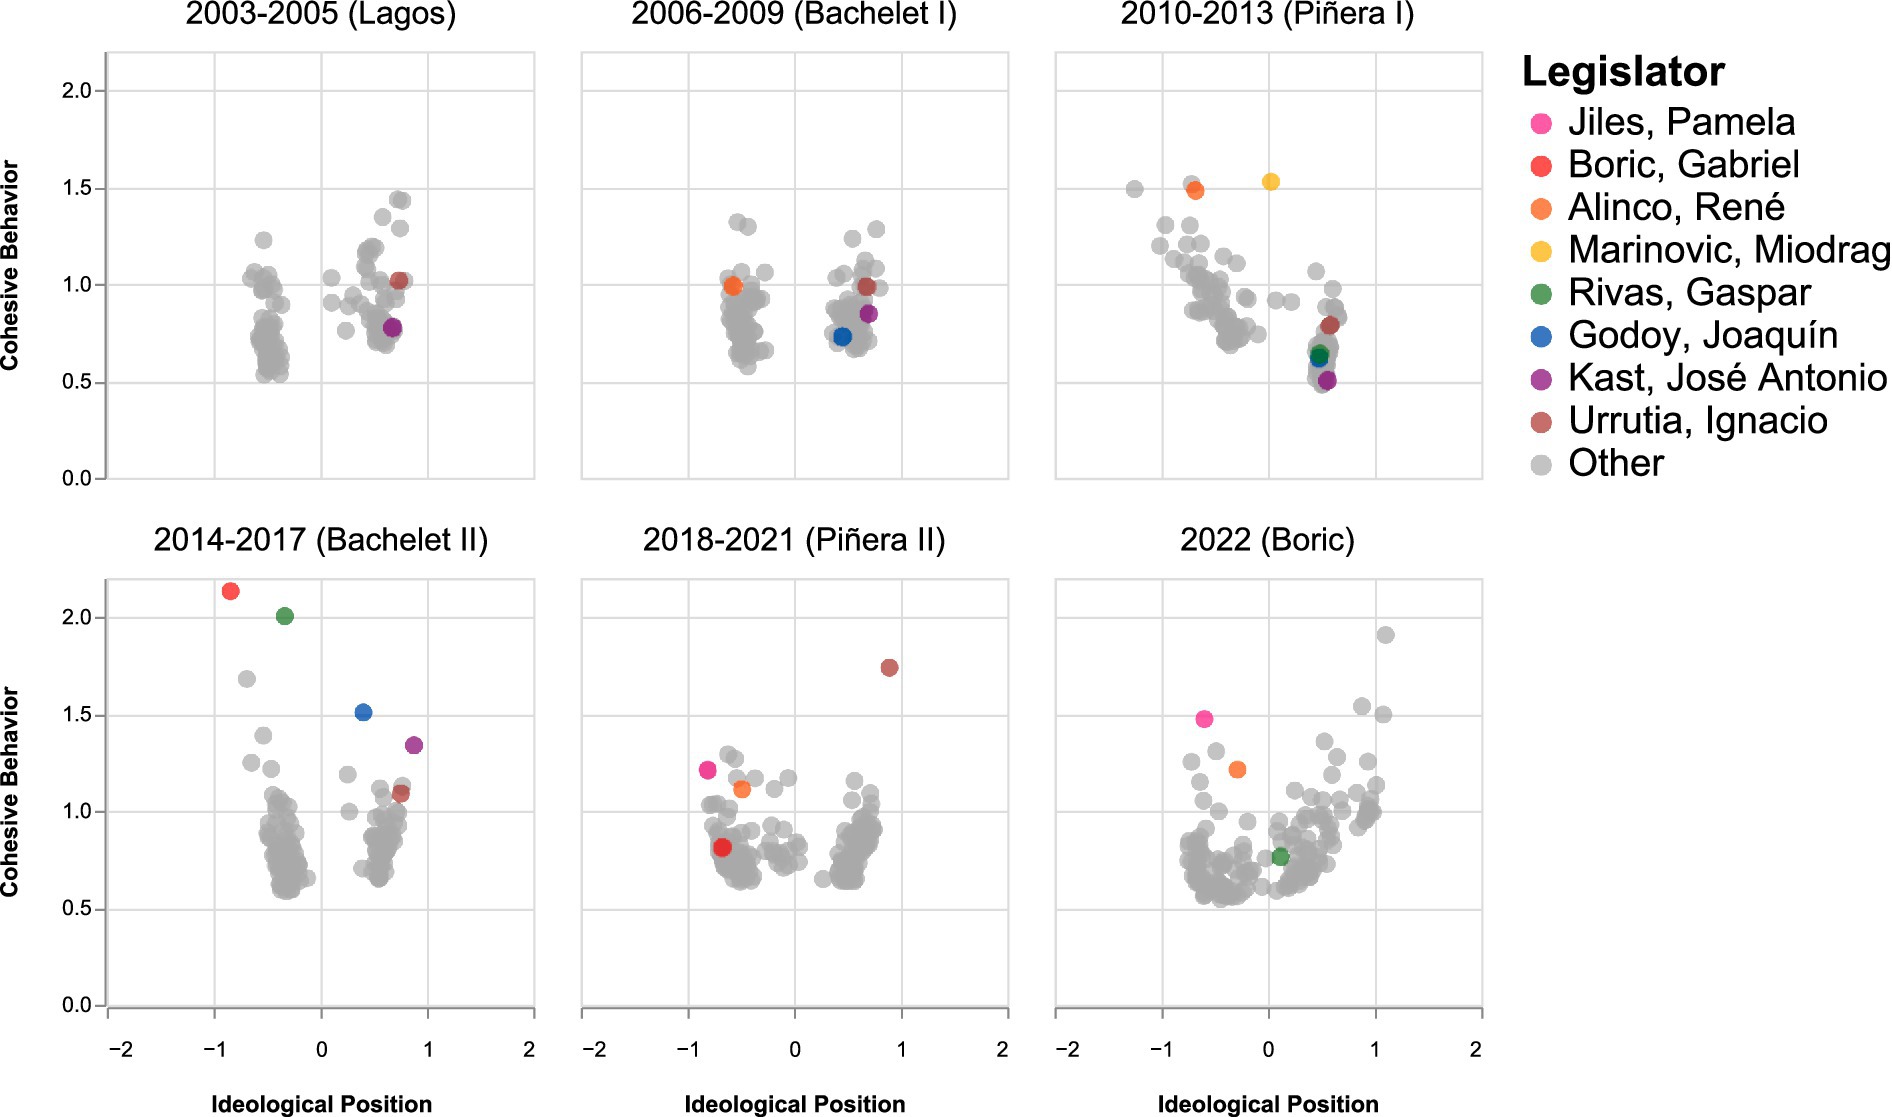
Figure 8. Chile chamber of deputies between 2003 and 2022.
In the Chilean Senate, shown in Figure 9, there is notable disorder among senators with the arrival of the right with Piñera’s Administration between 2010 and 2013. A group of senators in the center, a left sector with high dispersion in cohesion indicators, and a very cohesive right sector are observed. However, during Bachelet II, senators polarized into two factions, a pattern that recurs during Piñera II. In the first year of the Boric Administration, the left and right re-center, and the number of non-cohesive senators increases, especially on the right.
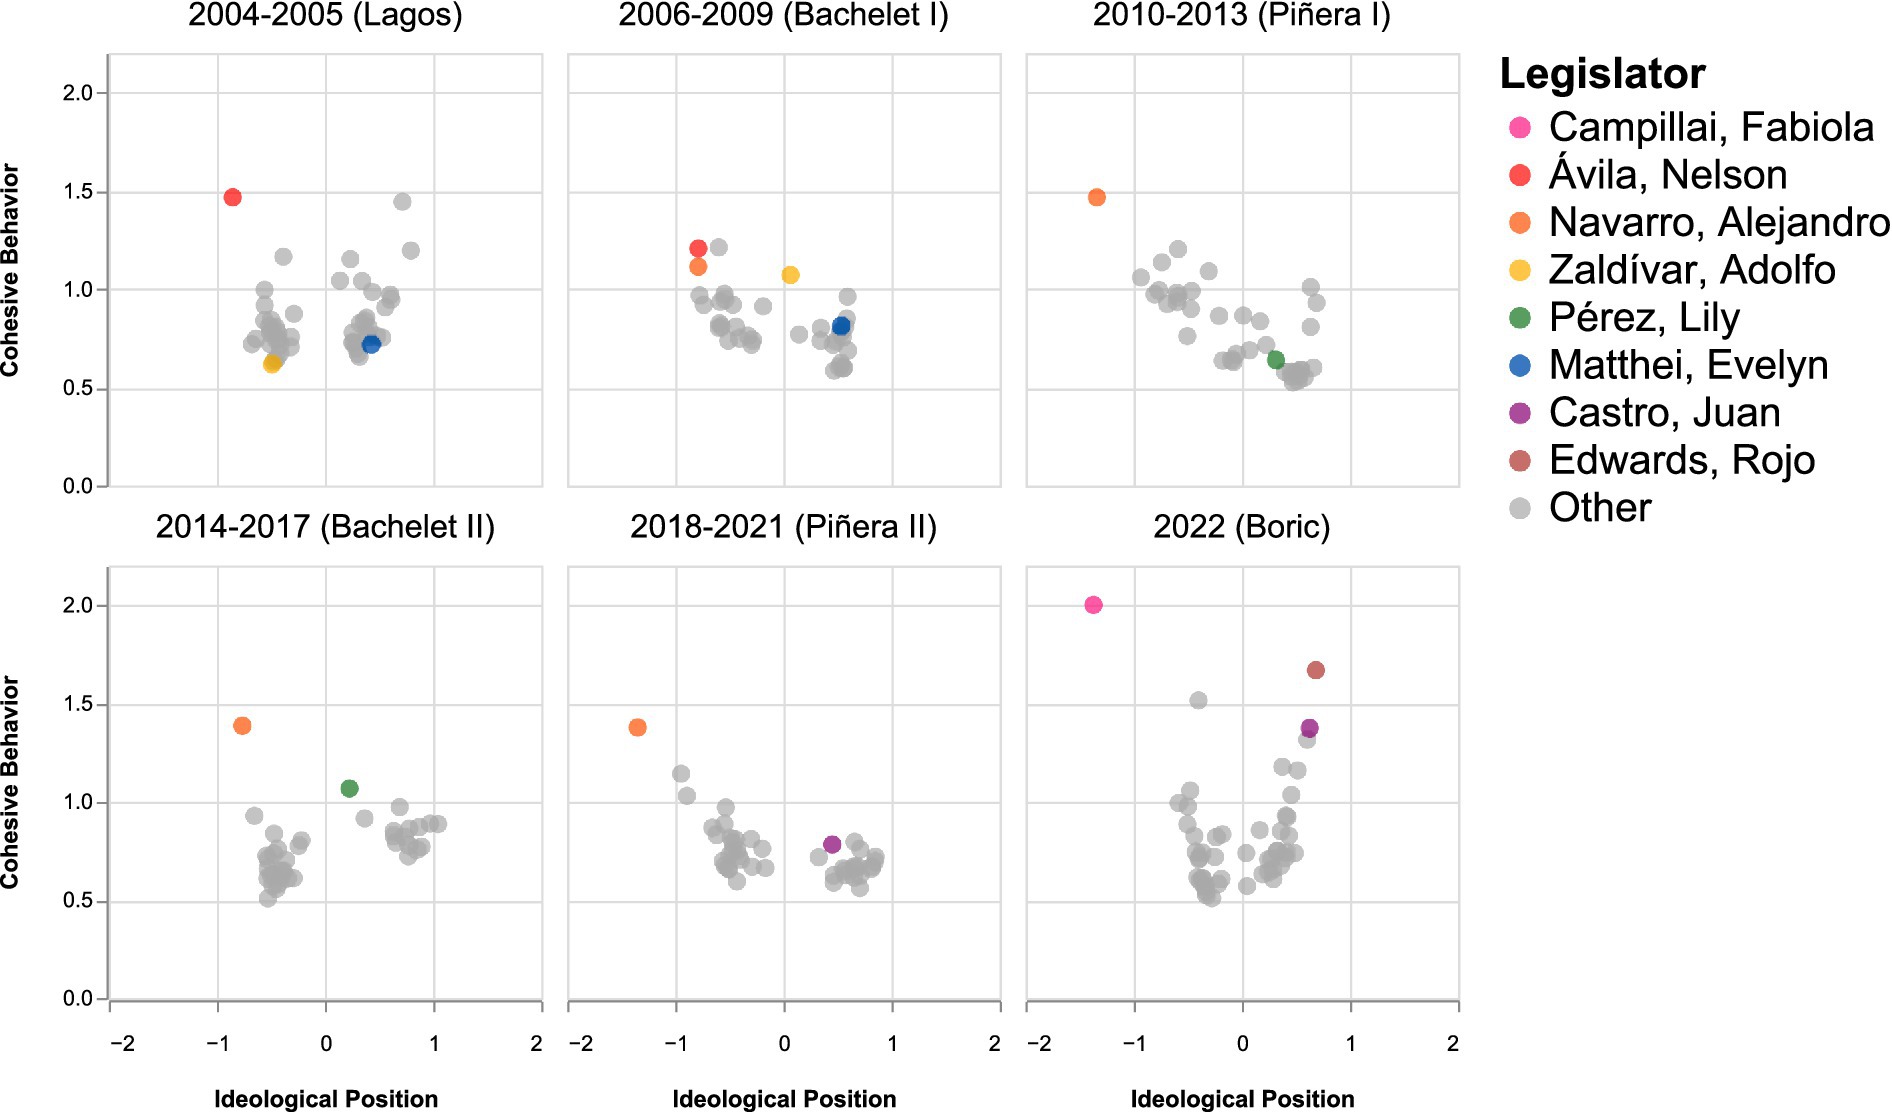
Figure 9. Chile Senate between 2004 and 2022.
In terms of individual analysis, B-Call shows that during his first term (2014–2017), current President Gabriel Boric was the least cohesive deputy, positioned on the left of the ideological spectrum. In the following period, Deputy Boric demonstrated greater cohesion among his left-wing peers. In contrast, José Antonio Kast positioned himself among the deputies furthest to the right, albeit with fluctuating levels of cohesion. The 2014–2017 period is notable because Boric was the most left-leaning and least cohesive deputy, while Kast was the furthest to the right and the sixth least cohesive. In the Senate, Senators Adolfo Zaldívar and Lily Pérez stand out, as they occupied centrist positions during certain legislatures—under Bachelet I and Bachelet II, respectively—yet exhibited low levels of cohesion (Figure 9).
5.2.4 A case study: how the analysis changes then using B-Call instead of NOMINATE
As our final contribution, we present a specific case study that shows how the differences in models can lead to wrong, or different, conclusions.
The Chamber of Deputies during Michelle Bachelet’s second administration (2014–2018) witnessed the emergence of smaller political forces that strained the predominance of the traditional left and the right. On the left, Gabriel Boric, Giorgio Jackson, and Vlado Mirosevic entered as new deputies linked to the student movement (Boric and Jackson as independents; Mirosevic for the Liberal Party) and, by 2017, helped to articulate the Broad Front (Frente Amplio), a coalition founded on January 21, 2017. On the right, Amplitud emerged, a liberal-centrist split from Renovación Nacional (RN) driven by then-senator Lily Pérez and the deputies Karla Rubilar, Pedro Browne, and Joaquín Godoy; it was constituted as a party in 2016 and was dissolved by the Electoral Service in May 2018 for failing to meet legal thresholds. The period also saw Gaspar Rivas, re-elected with RN, resigned definitively in August 2014 and served most of the term as an independent deputy, at the time describing himself as centrist. Finally, José Antonio Kast’s resignation from the Unión Demócrata Independiente (UDI, May 31, 2016), after which he ran as an independent in 2017; later, in 2019, he founded the Republican Party (Figure 10).
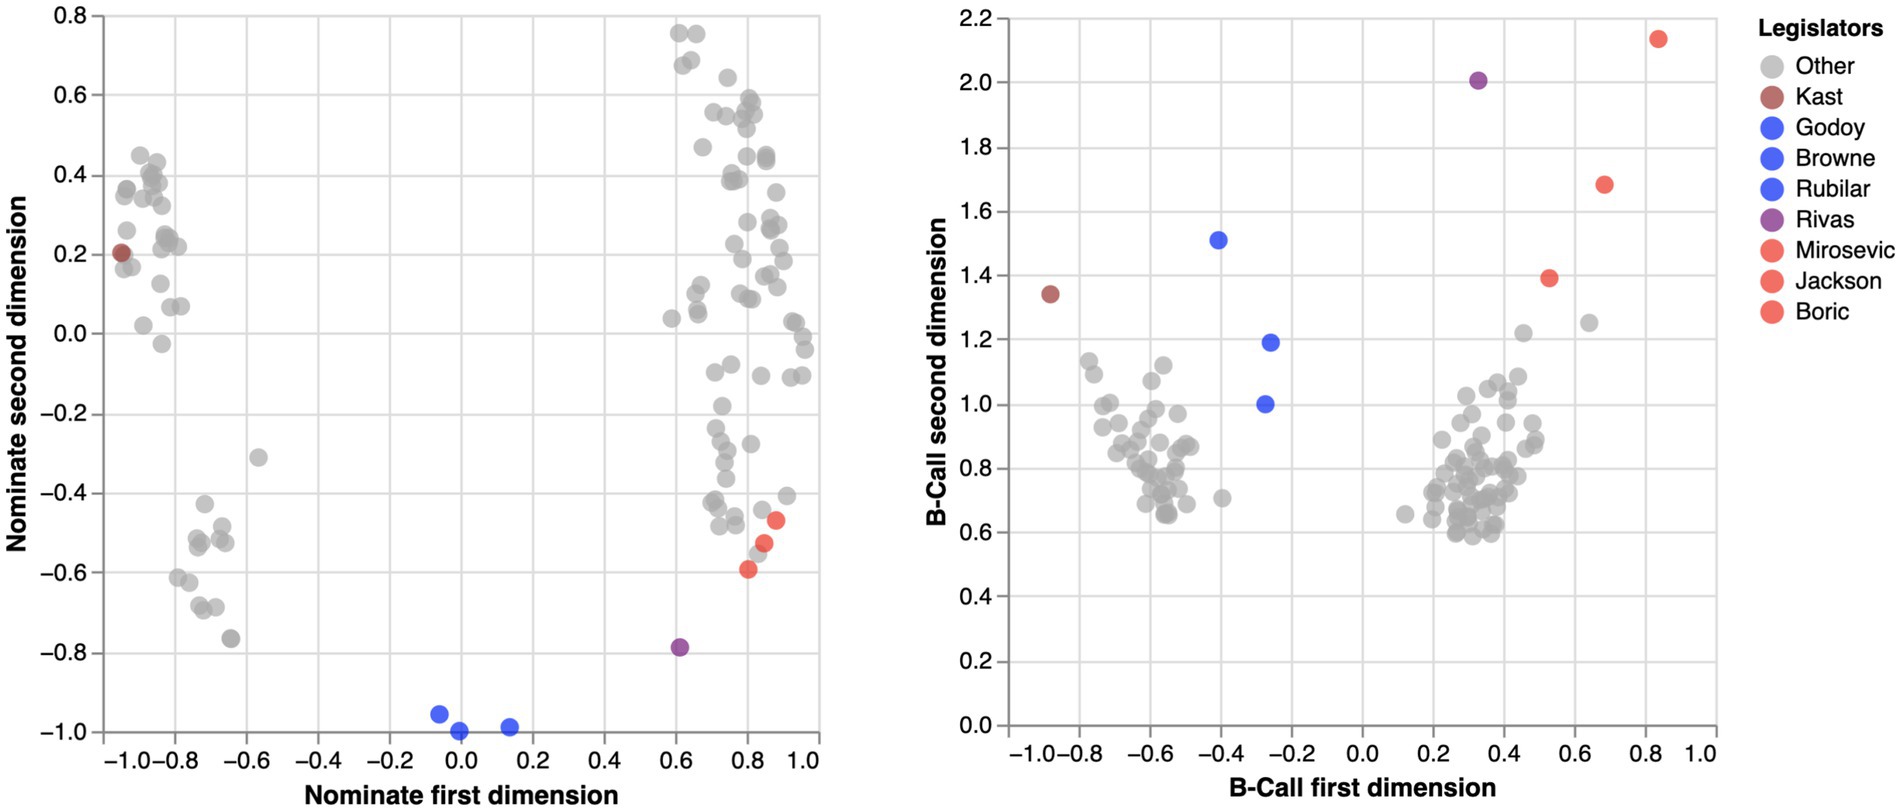
Figure 10. Comparison of NOMINATE and B-call scores—Chilean chamber of deputies (2014–2017).
The placement of Boric, Jackson, and Mirosevic reveals a substantial difference A substantive difference between NOMINATE and B-Call. The first model situates them in a moderate sector within the government parties. B-Call, by contrast, places them at the far left of the spectrum—a result more consistent with their programmatic trajectory and public positions.
Regarding deputies from Amplitud, both models place them near the ideological, as expected. However, under B-Call they display higher and more differentiated scores on the second dimension, suggesting greater dispersion on that dimension despite their centrist position on the first. Same can be inferred from Gaspar Rivas, where we can use B-call to witness the high volatility of his legislative behavior.
Finally, both models place José Antonio Kast farthest from the government parties. NOMINATE offers a more nuanced reading, keeping him within the cluster of the hard right, while B-Call identifies him as an outlier, even more distant from the rest of the bloc.
Taken together, this case illustrates that for certain legislators, B-Call yields mappings more consistent with qualitative evidence than NOMINATE, particularly in identifying far-left positions and right-wing outliers.
6 Conclusion
B-Call continues a line of work in political science that seeks to estimate legislative behavior through data related to roll-call votes. B-Call possesses significant advantages over previous methods. This tool, for example, allows for the estimation of the ideological position alongside the level of cohesion that legislators exhibit in relation to that estimation.
Likewise, this paper demonstrated that it is possible to identify groups of actors with similar ideologies but with very different political behaviors, where some show high group cohesion, and others much less cohesive behavior. We also showed that B-Call can be used to estimate just one of the study dimensions, either ideology or political cohesion. Moreover, by comparing on one hand the ideological values of B-Call with the values of other important methods in the literature, and on the other hand the cohesion values with values from other methods used to measure unity, we see that B-Call delivers quite similar results in both dimensions.
Furthermore, particularly concerning the ideological dimension, we empirically demonstrated how some of B-Call’s discrepancies with methods like W-NOMINATE illustrate how in certain cases it is possible to more accurately correct legislative behavior. Being a fully frequentist method, B-Call can also be used in cases with a poorer amount of data. Furthermore, B-Call can also be inside parties or parlamentary groups, wherein the first dimension represents the ideology of legislators within that group, and the second dimension represents the cohesion with respect to these parties.
Thus, B-Call provides a new tool for political analysis studies, especially when studying fragmented, volatile, or changing systems over time.
The introduction of B-Call opens several avenues for future work in terms of model development. It would be desirable to obtain a dynamic version of B-Call (as with DW-NOMINATE), which we can use to update the ideological position of legislators under the arrival of more data, and even when some of them are replaced. The B-Call model can also be deployed in a hierarchical fashion, where first one computes positioning with respect to one party, and then one focuses on the positioning of each party. This strategy would make sense for a multiparty scenario in which it is not adequate to divide legislators into two separate groups. A second alternative to tackle a scenario with several parties would be to increase the dimensionality of the model, and in which each new dimension compares a different pair of parties.
Data availability statement
The datasets presented in this study can be found in online repositories. The names of the repository/repositories and accession number(s) can be found below: https://github.com/b-call-model/replication/tree/main.
Author contributions
ST-M: Writing – original draft, Writing – review & editing. JR: Conceptualization, Methodology, Writing – original draft, Writing – review & editing. LV: Methodology, Writing – original draft, Writing – review & editing. DA: Conceptualization, Methodology, Writing – original draft, Writing – review & editing. MV: Conceptualization, Methodology, Writing – original draft, Writing – review & editing.
Funding
The author(s) declare that financial support was received for the research and/or publication of this article. This work supported by the Millenium Initiative ICN17_002, NCS2022, and FONDECYT 1211297.
Conflict of interest
The authors declare that the research was conducted in the absence of any commercial or financial relationships that could be construed as a potential conflict of interest.
Generative AI statement
The authors declare that no Gen AI was used in the creation of this manuscript.
Any alternative text (alt text) provided alongside figures in this article has been generated by Frontiers with the support of artificial intelligence and reasonable efforts have been made to ensure accuracy, including review by the authors wherever possible. If you identify any issues, please contact us.
Publisher’s note
All claims expressed in this article are solely those of the authors and do not necessarily represent those of their affiliated organizations, or those of the publisher, the editors and the reviewers. Any product that may be evaluated in this article, or claim that may be made by its manufacturer, is not guaranteed or endorsed by the publisher.
Supplementary material
The Supplementary material for this article can be found online at: https://www.frontiersin.org/articles/10.3389/fpos.2025.1670089/full#supplementary-material
References
Bateman, D. A., and Lapinski, J. (2016). Ideal points and American political development: beyond dw-nominate. Stud. Am. Polit. Dev. 30, 147–171. doi: 10.1017/S0898588X16000080
Caughey, D., and Schickler, E. (2016). Substance and change in congressional ideology: nominate and its alternatives. Stud. Am. Polit. Dev. 30, 128–146. doi: 10.1017/S0898588X16000092
Clinton, J., Jackman, S., and Rivers, D. (2004). The statistical analysis of roll call data: a unified approach. Am. Polit. Sci. Rev. 98, 355–370. doi: 10.1017/S0003055404001194
Géron, A. (2022). Hands-on machine learning with scikit-learn, keras, and tensorflow. Sebastopol, California: O’Reilly Media, Inc.
Itzkovitch-Malka, R., and Hazan, R. Y. (2017). Unpacking party unity: the combined effects of electoral systems and candidate selection methods on legislative attitudes and behavioural norms. Poli. Stud. 65, 452–474. doi: 10.1177/0032321716634094
Jackman, S. (2001). Multidimensional analysis of roll call data via bayesian simulation: identification, estimation, inference, and model checking. Polit. Anal. 9, 227–241. doi: 10.1093/polana/9.3.227
Krehbiel, K., and Peskowitz, Z. (2015). Legislative organization and ideal-point bias. J. Theor. Polit. 27, 673–703. doi: 10.1177/0951629814562290
Lewis, J. B., Poole, K., Rosenthal, H., Boche, A., Rudkin, A., and Sonnet, L. (2023) Voteview: congressional roll-call votes database Available online at: https://voteview.com/ (Accessed August 15, 2024).
Londregan, J. (2000). Estimating legislators’ preferred points. Polit. Anal. 8, 35–56. doi: 10.1093/oxfordjournals.pan.a029804
Poole, K. T., and Rosenthal, H. (1985). A spatial model for legislative roll call analysis. Am. J. Polit. Sci 29, 357–384.
Poole, K. T., and Rosenthal, H. (1997). Congress: A political-economic history of roll call voting. New York: Oxford University Press.
Quinn, K. M. (2004). Bayesian factor analysis for mixed ordinal and continuous response. Polit. Anal. 12, 338–353. doi: 10.1093/pan/mph022
Rice, S. A. (1925). The behavior of legislative groups: a method of measurement. Polit. Sci. Q. 40, 60–72. doi: 10.2307/2142929
Snyder, J. M., and Groseclose, T. (2000). Estimating party influence in congressional roll-call voting. Am. J. Polit. Sci. 44, 193–211. doi: 10.2307/2669305
Keywords: B-Call, ideological position, voting cohesion, W-NOMINATE, congress
Citation: Toro-Maureira S, Reutter J, Valenzuela L, Alcatruz D and Valenzuela M (2025) B-Call: integrating ideological position and voting cohesion in legislative behavior. Front. Polit. Sci. 7:1670089. doi: 10.3389/fpos.2025.1670089
Edited by:
Jan-Erik Refle, Université de Lausanne, SwitzerlandReviewed by:
Maxime Walder, Université de Genève, SwitzerlandLucia Motolinia, Washington University in St. Louis, United States
Copyright © 2025 Toro-Maureira, Reutter, Valenzuela, Alcatruz and Valenzuela. This is an open-access article distributed under the terms of the Creative Commons Attribution License (CC BY). The use, distribution or reproduction in other forums is permitted, provided the original author(s) and the copyright owner(s) are credited and that the original publication in this journal is cited, in accordance with accepted academic practice. No use, distribution or reproduction is permitted which does not comply with these terms.
*Correspondence: Sergio Toro-Maureira, c2VyZ2lvLnRvcm9AdW1heW9yLmNs; Juan Reutter, amxyZXV0dGVAdWMuY2w=; Lucas Valenzuela, bHVjYXMudmFsZW56dWVsYUB1Yy5jbA==