 Jihyeon Ha
 Sangin Park
 Chang-Hwan Im
 Laehyun Kim
- 1Center for Bionics, Korea Institute of Science and Technology, Seoul, South Korea
- 2Department of Biomedical Engineering, Hanyang University, Seoul, South Korea
- 3Department of HY-KIST Bio-Convergence, Hanyang University, Seoul, South Korea
The proliferating and excessive use of internet games has caused various comorbid diseases, such as game addiction, which is now a major social problem. Recently, the American Psychiatry Association classified “Internet gaming disorder (IGD)” as an addiction/mental disorder. Although many studies have been conducted on the diagnosis, treatment, and prevention of IGD, screening studies for IGD are still scarce. In this study, we classified gamers using multiple physiological signals to contribute to the treatment and prevention of IGD. Participating gamers were divided into three groups based on Young’s Internet Addiction Test score and average game time as follows: Group A, those who rarely play games; Group B, those who enjoy and play games regularly; and Group C, those classified as having IGD. In our game-related cue-based experiment, we obtained self-reported craving scores and multiple physiological data such as electrooculogram (EOG), photoplethysmogram (PPG), and electroencephalogram (EEG) from the users while they watched neutral (natural scenery) or stimulating (gameplay) videos. By analysis of covariance (ANCOVA), 13 physiological features (vertical saccadic movement from EOG, standard deviation of N-N intervals, and PNN50 from PPG, and many EEG spectral power indicators) were determined to be significant to classify the three groups. The classification was performed using a 2-layers feedforward neural network. The fusion of three physiological signals showed the best result compared to other cases (combination of EOG and PPG or EEG only). The accuracy was 0.90 and F-1 scores were 0.93 (Group A), 0.89 (Group B), and 0.88 (Group C). However, the subjective self-reported scores did not show a significant difference among the three groups by ANCOVA analysis. The results indicate that the fusion of physiological signals can be an effective method to objectively classify gamers.
Introduction
The proliferating and excessive use of Internet games has caused various comorbidities, such as game addiction, which is a major social problem of contemporary significance (Young, 1998a,c). In 2013, the American Psychiatric Association (APA) included “Internet gaming disorder” (IGD) in DSM-5 (American Psychiatric Association, 2013; Petry and O’Brien, 2013), and in 2019, the World Health Organization (WHO) included the disease as “Gaming disorder” (World Health Organization, 2018). Many studies have been conducted on this disorder (Kuss and Lopez-Fernandez, 2016; Kuss et al., 2018). Therefore, the need for research on its diagnosis, treatment, and prevention is evident.
There have been many ways to treat addiction in the past, such as drug treatment, cognitive behavioral therapy, and cue-exposure therapy (CET) (Monti and Rohsenow, 1999). In particular, various studies have demonstrated that CET can be applied to IGD (Zhang et al., 2016). In order to make the cue and surrounding situation a reality, a virtual reality-based CET was recently conducted (Ghiţã et al., 2019; Hernández-Serrano et al., 2020). Zhang et al. (2016) cited various studies, emphasizing that the neural responses caused by addictive cues are similar between substance use disorder and IGD. They argued that CET treatment would also work for IGD. Although previous studies on other addictions, based on these neural responses, have contributed to the diagnosis of addiction as an objective measurement, cue-based studies, and screening studies for IGD are scarce.
Several studies have defined IGD based on EEG, reported comorbid symptoms, and assessed their severity (Choi et al., 2013; Yao et al., 2015; Jin et al., 2016; Park et al., 2016; Kim et al., 2017). However, previous studies have only compared comorbid symptoms between control and IGD groups either through resting-state-based EEG studies (Choi et al., 2013; Kim et al., 2017) or event-related potential (ERP) (Yao et al., 2015; Park et al., 2016). These studies are substantially limited in their application for the treatment or prevention of IGD. In other attempts, many researchers have investigated EEG responses from patients with IGD while presenting them with game-related stimuli (Han et al., 2010, 2015). In particular, there are a few studies that classify and test the reliability of game-related stimuli by using multiple physiological signals, not including EEG (Kim et al., 2018, 2019). However, while traditional addiction studies help to diagnose or prevent addiction by classifying (Mete et al., 2016; Mumtaz et al., 2018; Sakoglu et al., 2019; Kamarajan et al., 2020) or utilizing biofeedback (Evans and Abarbanel, 1999; Dehghani-Arani et al., 2013; Du et al., 2014), adequate physiological studies of IGD have not been conducted. In previous addiction studies, many researchers distinguished addiction from non-addiction (Doborjeh et al., 2016; Saddam et al., 2017), as diagnostic indicators. There are few studies on classification in the field of IGD research. Ling et al. (2015) classified coexisting diseases using ERP. Lee and Kang (2014) conducted a classification study for IGD using EEG data, classifying only the features of each participant, not groups. Ji et al. (2019) attempted to classify IGD using subjective assessments (Chen’s Internet addiction score) and respiratory data. Since these studies do not directly classify the disease as IGD and non-IGD, offering a limited perspective compared to other addiction studies. Therefore, quantitative research that can contribute to the treatment and diagnosis of IGD is necessary, specifically, to supplement subjective assessment.
In this study, we analyzed three groups, as distinct from previous experiments that divided participants into control and patient groups, since there are several users who enjoy games without developing an addiction. These three groups were categorized as follows: Group A, which rarely plays games; Group B, which enjoys and plays games regularly; and Group C, which is classified as having IGD. Our study was multimodal, and comprised electrooculograms (EOGs), photoplethysmograms (PPGs), and electroencephalography (EEG). The purpose of this study was to contribute to the study of objective measurements for the diagnosis of IGD by identifying statistical features that distinguish the three groups.
Materials and Methods
Experimental Design
Stimuli Selection
We selected three types of games [FIFA online 3 (FIFA), Sudden Attack (SA), and League of Legends (LOL)] as stimuli, which were rated as the top three computer games in the Republic of Korea in 2016 (Gametrics, 2016). Furthermore, 12 game-playing videos (12:3 types of game videos × 4; video running time: 5 min) were selected to conduct an online pre-survey, for selection of stimuli, in which all participants watched videos intended to induce craving, and shortly thereafter reported their degree of craving. Two high-scoring videos were selected per game. Each selected video was divided into six 25-s videos. Finally, 36 game-playing videos were selected. Additionally, 36 natural videos with medium levels of arousal and valance were selected. The selected videos can be found at https://youtu.be/K83jANLQoHE.
Protocol
All participants watched 36 game-playing videos and 36 neutral videos alternately using a head-mounted display (HMD) device (Oculus DK2 HMD; Oculus VR LLC, Menlo Park, CA, United States) to enhance immersion. We tried to remove the familiarity effect by adding neutral videos between the gameplay videos. We also added a break time between sessions to remove the base effect of craving. Video clips showing dynamic scenes were presented in a counterbalanced order. After watching each video clip, the participants reported the degree of craving that they felt at that moment, on a 5-point Likert scale. The self-reporting questionnaire was as follows: the degree of game craving that you are feeling now (1 = I do not feel any craving for gaming now; 3 = I feel craving for gaming now; 5 = I feel very strong craving for gaming now); please press the button (1–5). Figure 1 schematically shows the experimental protocol.
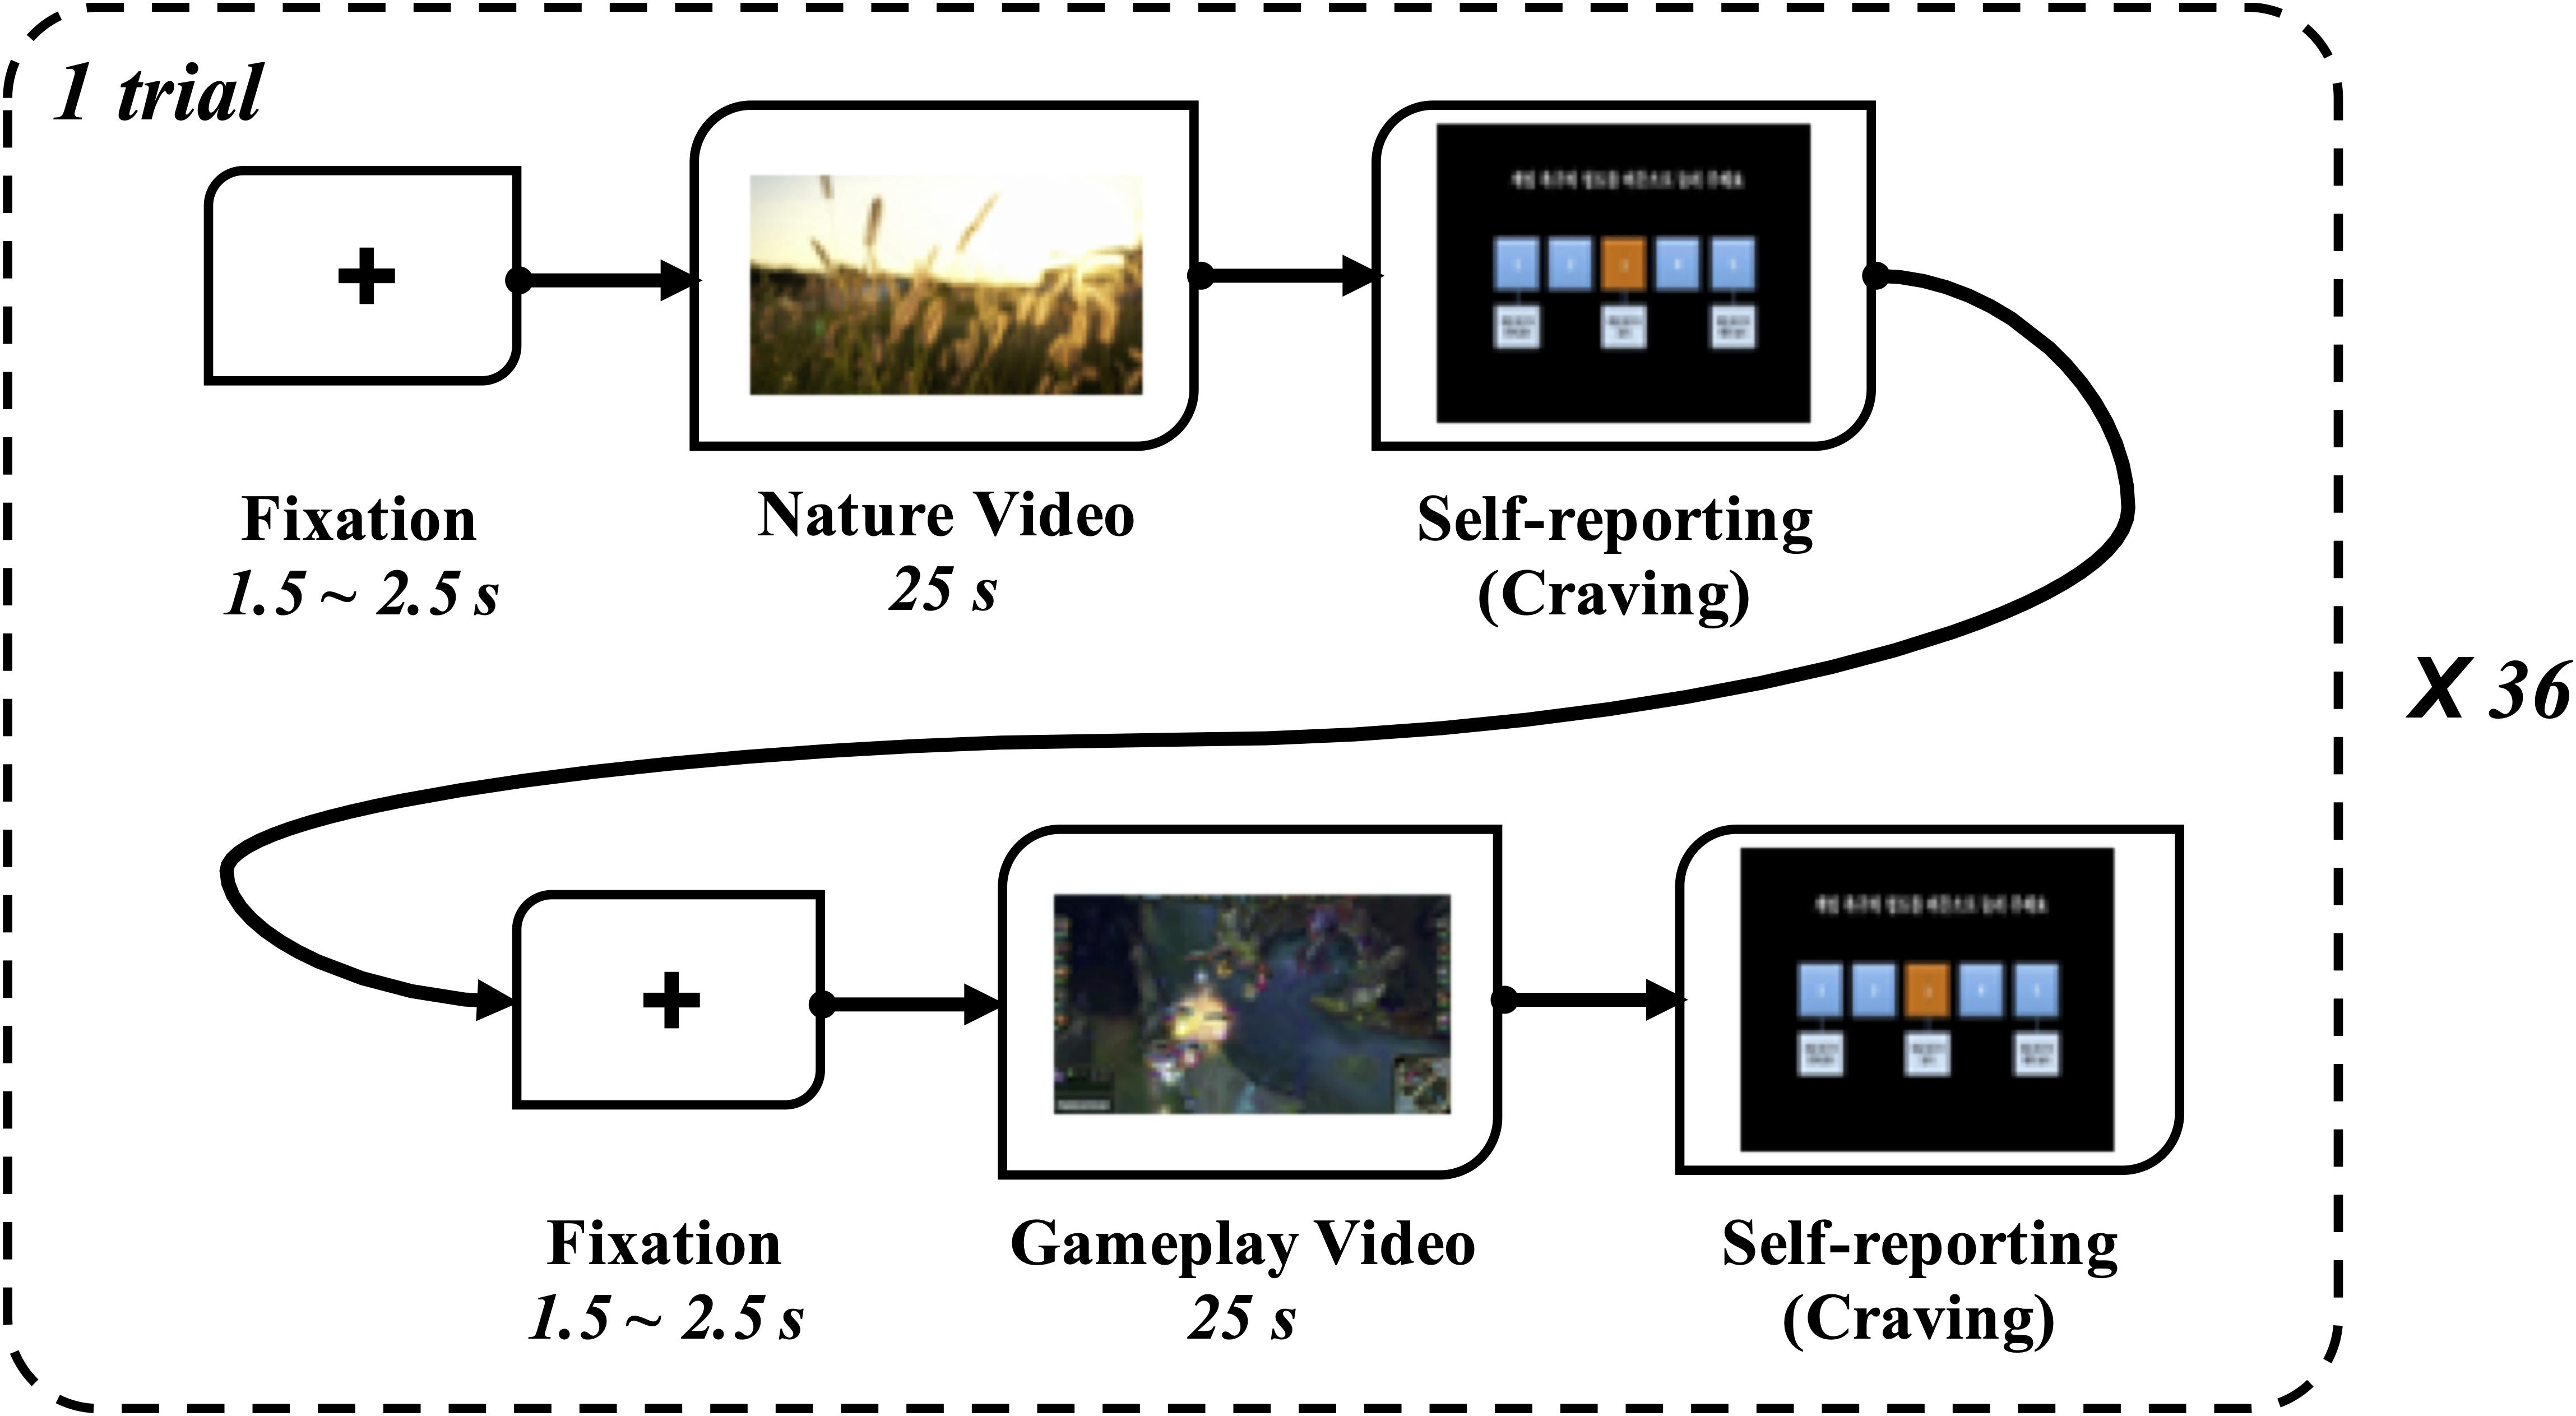
Figure 1. Schematic representation of the experimental protocol.
Participants and Procedures
Before recruitment, we were approved and reviewed by the Institutional Review Board (IRB) (Approval number: 2017-013) of Korea Institute of Science and Technology (KIST). And we made poster including inclusion and exclusion criteria for recruitment according to IRB. The following inclusion criteria were used: (1) Anyone who has played LOL, Sudden Attack and FIFA online. (2) Anyone who rarely or heavily play games. (3) Adolescents/late-adolescents 13–22 years old. The following exclusion criteria were used: (1) Those who have not suffered from, or are currently suffering from, a brain disease or mental illness. (2) Anyone who enjoy or prefer games other than LOL, Sudden Attack or FIFA online. Using online and offline posters, we posted them in online communities (Facebook page related to high school and college) and notice board (offline) at Hanyang university, Seoul, South Korea. Participants were recruited from the Korea Institute of Science and Technology (KIST) in Seoul, South Korea. The experiments were conducted at the KIST between July 8, 2016, and May 25, 2017. Participants were requested to refrain from smoking and caffeine intake, and to get a good amount of sleep the day before the experiment. All procedures were explained to, and informed consent was obtained from all participants before the experiment began. After experiment, we rewarded participants with monetary remuneration according to IRB.
Fifty-one adolescent males (age: 19.20 ± 2.48 years) participated in the experiment. We chose the Young’s Internet Addiction Test, which has been most commonly used to evaluate the severity of game addiction (Young, 1998a), since there was no “Gold standard” for IGD assessment. In this study, we classified all participants into Groups A, B, and C according to the Korean version (Lee et al., 2013) of Young’s Internet Addiction Test (Y-IAT-K). All participants watched three types of gameplay videos to induce game-related cravings. We also analyzed EEG, EOG, and PPG on the preferred gameplay videos, drawing from a previous study in which the favorite game-related stimuli induced craving more than the non-favorite game-related stimuli (Ha et al., 2020).
In this study, Group A rarely played games. Therefore, the possibility of a diagnosis of IGD would be very low, unlike Group C. However, as participants in Group B enjoyed the games as long and often as those in the IGD group and had high risk of developing IGD, we needed to distinguish Group B from other groups. We set three groups with the inclusion criteria as follows: (1) for Group A, Y-IAT-K scores < 30 (Young, 1998b), for Group B, 30 < Y-IAT-K scores < 60 (Wang et al., 2017; Dong et al., 2018), and for Group C, Y-IAT-K scores > 60 (Ha et al., 2020; Zhou et al., 2021); (2) the participants had a favorite game among FIFA, SA, and LOL. The exclusion criteria were as follows: (1) participants diagnosed with substance abuse; (2) participants with previous or current episodes of neurophysiological disease; and (3) participants who preferred other games to FIFA, SA, or LOL. We classified 15 participants into Group A (age: 19.00 ± 2.60 years), 18 participants into Group B (age: 19.30 ± 2.49 years) and 18 participants into Group C (age: 19.30 ± 2.49 years) according to each group’s Y-IAT-K score.
Data Measurements and Processing
An EEG recording system that can measure other physiological signals was used (sampling rate: 2,048 Hz; Active-two, Biosemi S.V., Amsterdam, Netherlands). EEG was acquired using a cap that provided 64 electrodes positioned according to the International 10/20 system. EOG signals were acquired above, below, and on the left side of the right eye and right side of the left eye. The PPG signal was acquired from the left index finger. Figure 2 shows the EEG recording system with the HMD and EOG channel locations in the HMD.
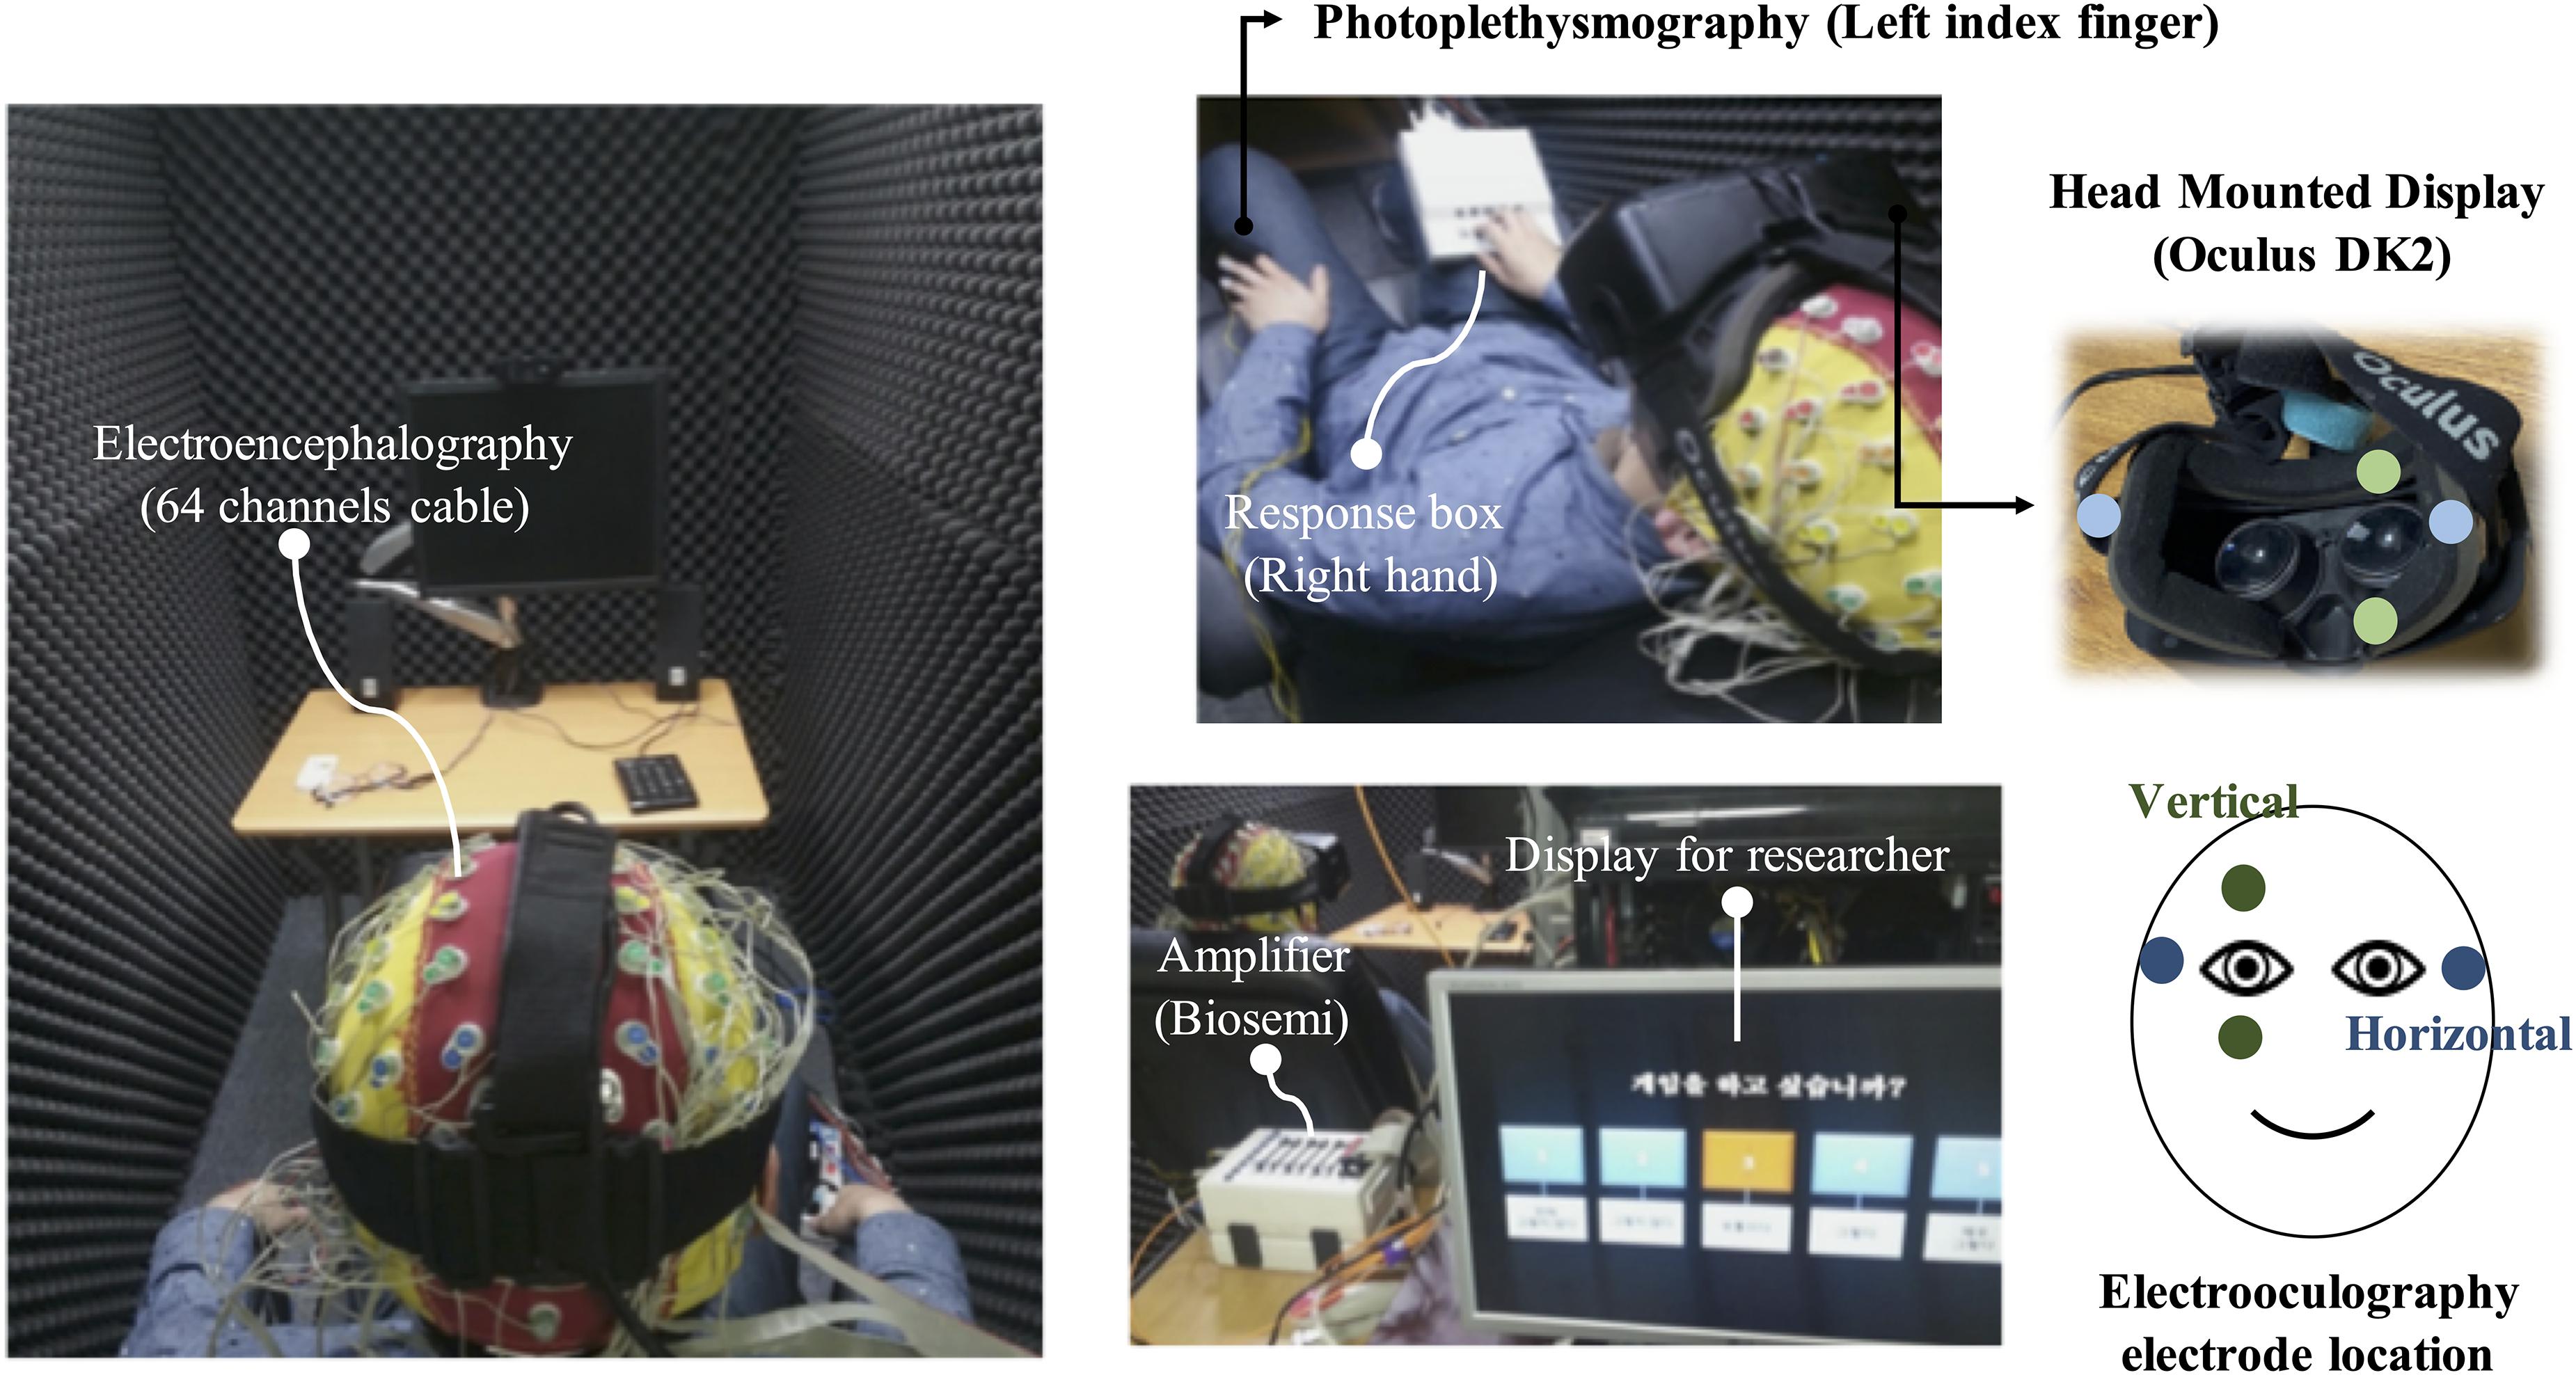
Figure 2. Experimental setup.
EOG Processing
The EOG data preprocessing and analysis were conducted using Matlab. First, we down-sampled from 2,048 to 64 Hz and epoched them during the watching of video clips (25s), using two EOG components (vertical and horizontal) to estimate saccadic eye movements. The vertical EOG component was calculated by subtracting the channel above from the channel below the right eye. The horizontal EOG component was calculated by subtracting the left side channel in the right eye from the right-side channel in the left eye. Second, we applied a median filter (7 points window size) to remove noise and subtracted the median value of each component to remove the baseline drift (Lee et al., 2016). Third, to estimate vertical saccadic eye movements (VSM) and horizontal saccadic eye movements (HSM), the continuous wavelet transform-saccade detection algorithm was used (Chang et al., 2017). Lastly, the degree of saccadic movement was evaluated by calculating the line integration of the estimated eyeball movement path, as in previous studies (Kim et al., 2018, 2019).
PPG Processing
PPG data preprocessing and analysis were conducted using Matlab software. First, we epoched them during the watching of video clips (25 s) and down-sampled t from 2,048 to 128 Hz. Second, we conducted 0.5–4 Hz band-pass filtering and found the peaks of the PPG data by using the toolbox in Matlab. Several abnormal peaks were corrected by visual inspection and were manually indicated as peaks. Finally, heart rates (HR), normal to normal intervals (N-N intervals), standard deviation of N-N intervals (SDNN), and PNN50 were calculated. PNN50 is the % of the total N-N intervals in which the difference between two consecutive N-N intervals is greater than 50 ms.
EEG Processing
EEG data preprocessing and analysis were conducted using EEGLAB,1 a toolbox of Matlab (2020b, Mathworks Inc., Natick, MA, United States). We first down-sampled the EEG data to 512 Hz and epoched them while watching the video clips (25-s). Subsequently, we conducted 0.5–50 band-pass filtering, and removed eye movement and muscle artifacts by conducting artifact subspace reconstruction (Mullen et al., 2013). Finally, a common average reference was obtained. The power spectral density (PSD) was calculated using Welch’s method (Stoica and Moses, 2005). The ranges of the five frequency bands were as follows: delta (1–4 Hz), theta (4–8 Hz), alpha (8–12 Hz), beta (12–30 Hz), and gamma (30–50 Hz) (Kim et al., 2013; Roh et al., 2016). Furthermore, relative power was used as a feature. The percentage of power in any band compared with the total power in the EEG is the relative power (for instance, “relative theta” is the percentage of theta of the combined sum of delta, theta, alpha, beta, and gamma). We denoted regions of interest for EEG analysis as prefrontal (Fpz), frontal (Fz), parietal (Pz), and occipital (Oz) areas.
Feature Extraction
In this study, statistical indicators were selected as features for classification. Therefore, we chose expected indicators which could be significant to conduct statistical tests. EOG, PPG, and EEG indicators which were verified in previous cognitive studies on addiction, memory, and emotion were used as classification features. With regards to EOG, there have been a few addiction-related studies (including IGD). According to Kim et al. (2018), there was a correlation between saccadic movements and attention to game video in the IGD group. In their study, saccadic movements were significantly different between exposure to neutral and gameplay videos. Therefore, we used VSM and HSM obtained from EOG as our features with an assumption that VSM and HSM will be statistical significance on our experiment.
With regards to PPG, we used only the time domain-based indicators (HR, SDNN and PNN50) because the long epoch time was required to extract frequency domain-based PPG-indicators (Smith et al., 2013; Jiang et al., 2017; Castaldo et al., 2019). We also made our decision based on previous PPG studies related to addiction (including IGD). We used HR, SDNN, and PNN50 which are general time-domain indicators of PPG as our features with an assumption that they will be statistical significance on our experiment.
With regards to EEG, we took into account previous studies on emotions and addiction, and we conducted features extraction based on the assumption that the features related to addiction and memory can induce game related craving (Dong et al., 2011; Ha et al., 2020) and attention to stimuli. Some studies have reported a relationship between prefrontal delta power (RDPF) and craving/addiction (Reid et al., 2003, 2006; Pripfl et al., 2014), between prefrontal theta power (RTPF) and reward property (Reid et al., 2003 2006), and between prefrontal alpha power (RAPF) and automatic arousal and anxiety (Reid et al., 2006). As a result, we selected RDPF, RTPF and RAPF as features. To improve classification performance, we extracted a greater number of features based on our research of previous studies. Most EEG based studies previously focused on slow wave (delta, theta, alpha) / fast wave (beta, gamma) ratio: (1) Delta-beta ratio studies: behavioral inhibition and anxiety (Putman, 2011; De Pascalis et al., 2020; Poole et al., 2020). (2) Delta-gamma ratio studies: working memory task (Missonnier et al., 2020). (3) Theta-beta ratio studies: attention and mental stress (Clarke et al., 2019; Yi Wen and Mohd Aris, 2020). (4) Theta-gamma ratio studies: memory (Moretti et al., 2009). (5) Alpha-beta ratio studies: attention and mental stress (Liu et al., 2013; Yi Wen and Mohd Aris, 2020). Based on these studies, we selected delta/beta, delta/gamma, theta/beta, theta/gamma, and alpha/beta ratio as features. Because these studies have also focused on various brain regions (prefrontal-frontal, parieto-occipital etc.), our final selection consists of 23 features [RDPF, RTPF, RAPF, prefrontal delta/beta ratio (DBRPF), frontal delta/beta ratio (DBRF), parietal delta/beta ratio (DBRP), occipital delta/beta ratio (DBRO), prefrontal delta/gamma ratio (DGRPF), frontal delta/gamma ratio (DGRF), parietal delta/gamma ratio (DGRP), occipital delta/gamma ratio (DGRO), prefrontal theta/beta ratio (TBRPF), frontal theta/beta ratio (TBRF), parietal theta/beta ratio (TBRP), occipital theta/beta ratio (TBRO), prefrontal theta/gamma ratio (TGRPF), frontal theta/gamma ratio (TGRF), parietal theta/gamma ratio (TGRP), occipital theta/gamma ratio (TGRO), prefrontal alpha/beta ratio (ABRPF), frontal alpha/beta ratio (ABRF), parietal alpha/beta ratio (ABRP), occipital alpha/beta ratio (ABRO)].
Statistical Method
The Shapiro–Wilk test was conducted to test the normality of the dataset. All demographic, EOG, PPG, and EEG datasets satisfied normality. Analysis of variance (ANOVA) was used to confirm the matched age and compare demographic data (game playtime, Y-IAT-K) among the three groups. Paired sample t-test was used to compare between craving scores for each group, after participants watched neutral videos and favorite gameplay videos. Additionally, analysis of covariance (ANCOVA), a technique for analyzing grouped data with covariates was used to compare EOG, PPG, and EEG features between the three groups, while participants watched neutral videos and favorite gameplay videos (Keselman et al., 1998). We calculated Cohen’s d, the expected effect size for the paired sample t-test, and Cohens’ f2/ partial eta-squared ηP2, the expected effect size for the ANOVA/ANCOVA using G∗power (Faul et al., 2007, 2009). The expected Cohens’ d in this study were as follows: number of participants = 16 (Group A): 0.75 [α: 0.05, 1-β: 0.8], number of participants = 18 (Groups B and C): 0.70 [α: 0.05, 1-β: 0.8]; standard values of 0.1, 0.25, and 0.4, for effect size, generally adjudged as small, moderate, and large, respectively. The expected Cohen’s f2 for ANOVA was 0.45 [α: 0.05, 1-β: 0.8]; standard values of 0.1, 0.25, and 0.4, for effect size are generally adjudged as small, moderate, and large, respectively. The expected partial eta-squared ηP2 for ANCOVA was 0.168 [α: 0.05, 1-β: 0.8]; standard values of 0.01, 0.06, and 0.14, for effect size are generally adjudged as small, moderate, and large, respectively. We performed the Shapiro-Wilk test, paired sample t-test, and ANOVA using GraphPad Prism (Version 8.00 for MAC, GraphPad Software, La Jolla California United States) and ANCOVA using the statistical toolbox of Matlab (2020b, Mathworks Inc., Natick, MA, United States). Benjamini-Yekutli’s false discovery rate (FDR) correction was conducted for multiple comparison corrections (N = 28) in the ANCOVA (Benjamini and Yekutieli, 2001). Bonferroni correction was conducted for multiple comparison corrections (N = 3) in the post hoc analysis.
Classification Method
We used a two-layer feed-forward neural network (FFNN) to conduct classification for a total of 51samples×numberoffeatures. The statistical features were selected using ANCOVA. To design and train the FFNN, we used the Neural Net Fitting App from the Matlab toolbox (2020b, Mathworks Inc., Natick, MA, United States). By using this app, training network with fivefold cross-validation was conducted (the train and validation set in a ratio of 8:2). The training function of FFNN was based on the Levenberg-Maquardt algorithm. Figure 3 shows the graphical structure of the FFNN. To obtain best performance, we put each value in two-layer (first, second layer) and selected the best performance according to each condition (EOG and PPG/EEG/Fusion). To present the performance of classification for each group, the following variables were used: accuracy, recall, precision, and F-1 score.
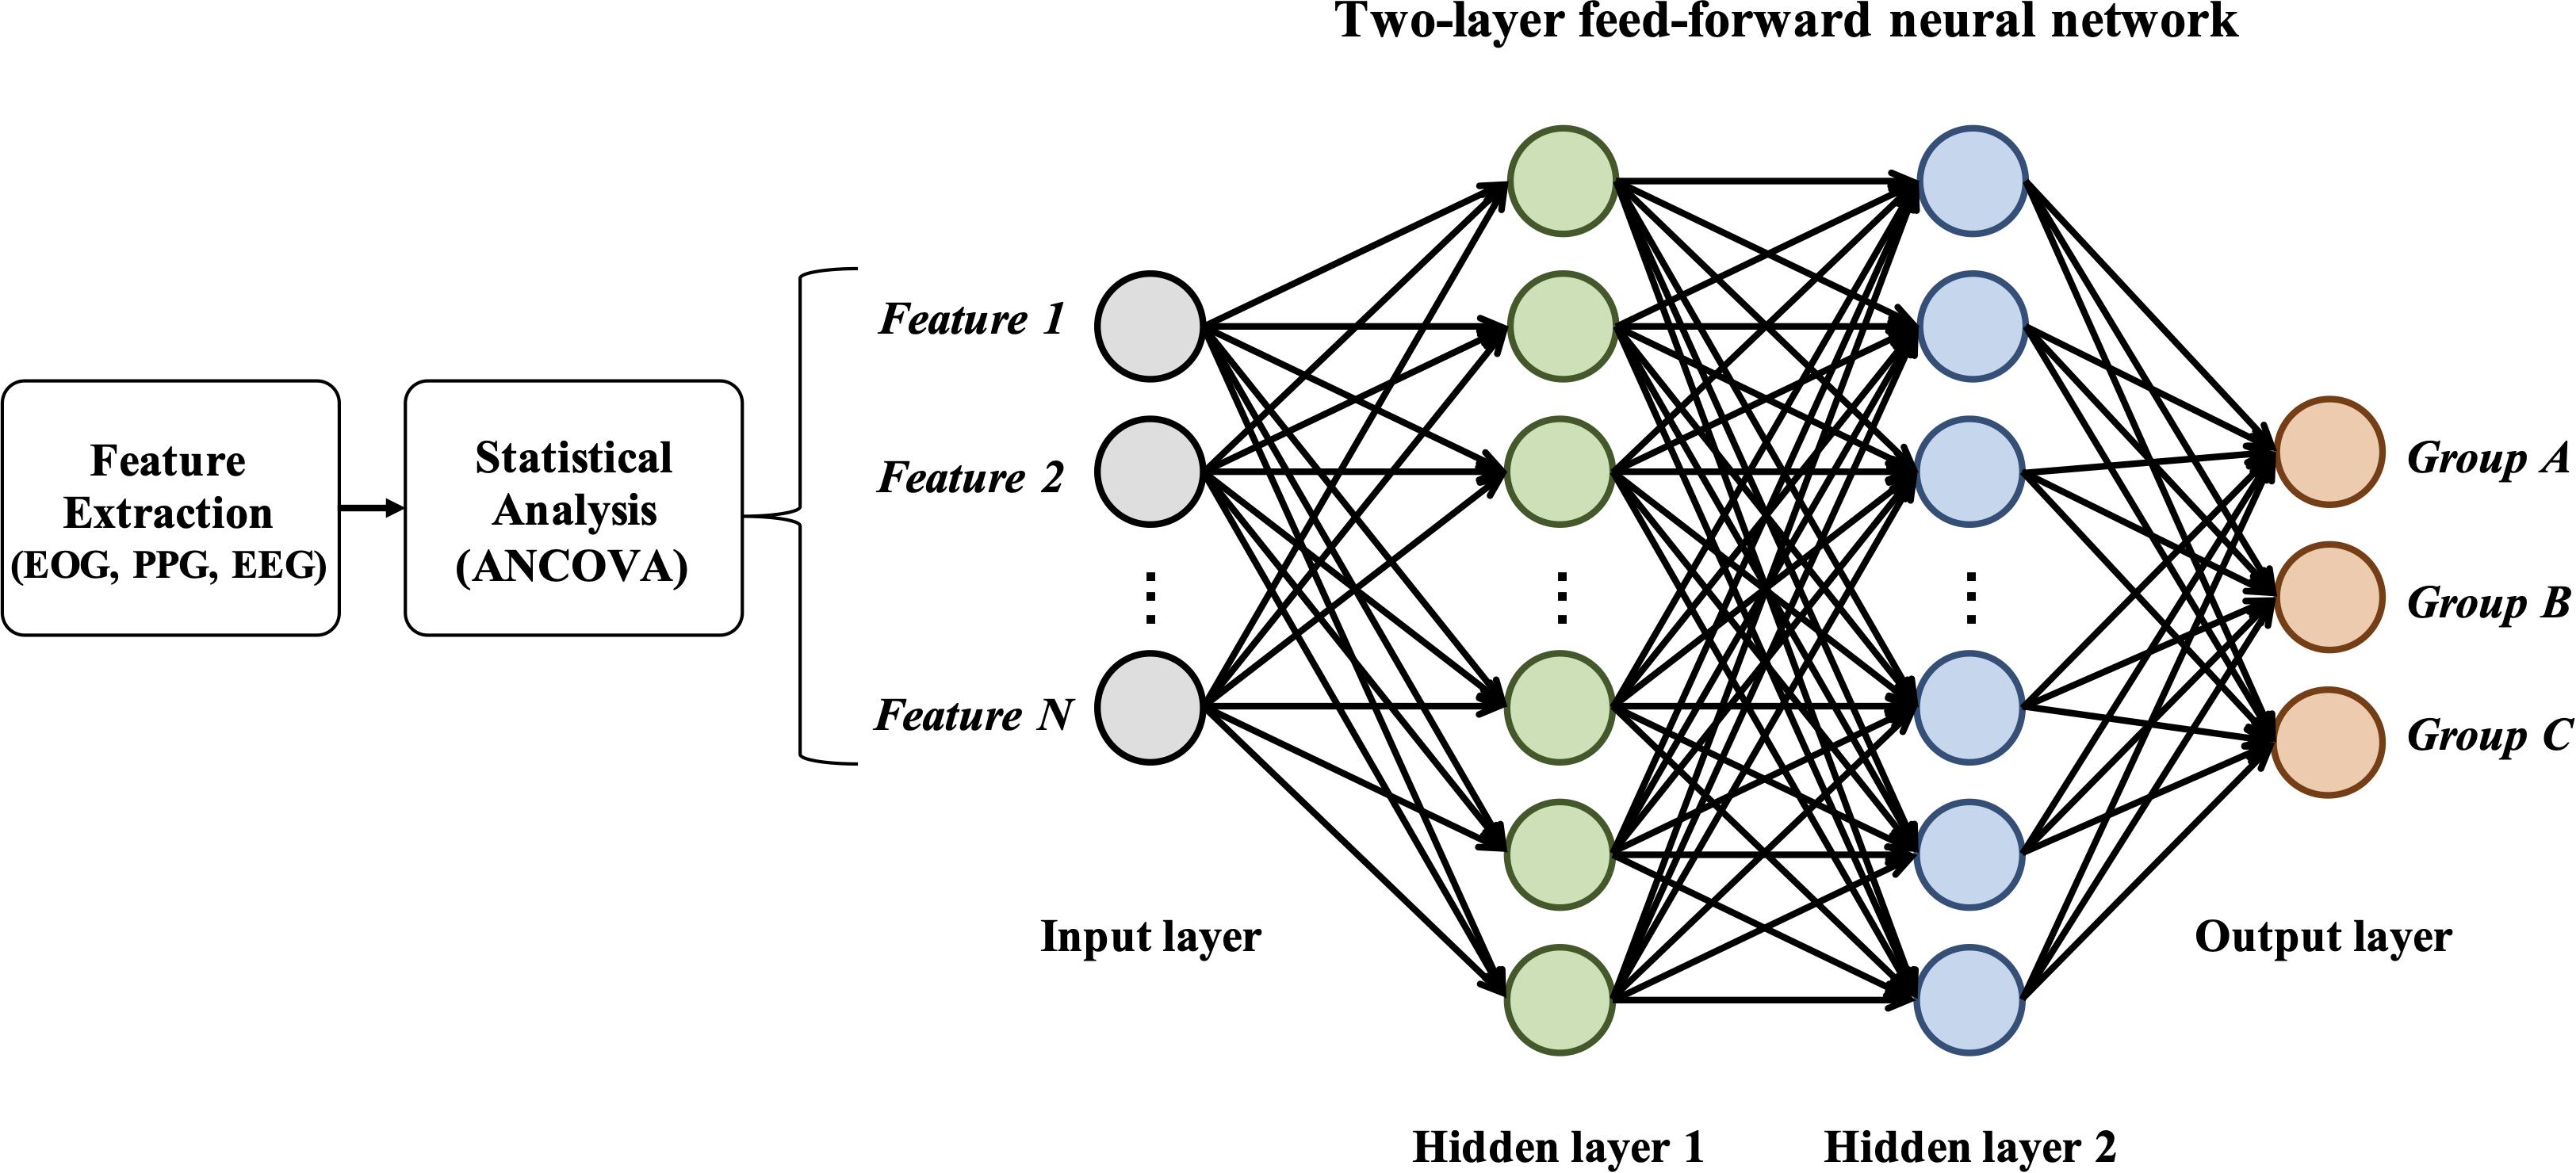
Figure 3. Graphical structure of the two-layer feedforward neural network.
• Accuracy for class α is used to calculate the proportion of the total number of predictions that are correct.
•Recall (also known as sensitivity) for class α is used to measure the proportion of actual positives that are correctly identified.
•Precision (also known as positive predictive value) for class α is used to measure the proportion of actual negatives that are correctly identified.
•F-1 score for class α is used to measure test’s accuracy.
Where TP (true positive), FN (false negative), TN (true negative) and FP (false negative).
Results
Demographic Data and Self-Reported Craving Score
There was no significant difference in age between the three groups. However, game play time, which refers to the average game time in a day, and Y-IAT-K scores differed significantly between the three groups. All the significant results satisfied the expected effect sizes. Detailed values are listed in Table 1. Looking at Figure 4, the paired t-test results for self-reported cravings scores were significant for each group [Group A: t = 5.15 (neutral videos, 1.13 ± 0.21; gameplay videos, 2.06 ± 0.79), Cohens’ d = 1.88; Group B: t = 9.12 (neutral videos, 1.62 ± 0.51; gameplay videos, 3.49 ± 0.94), Cohens’ d = 3.13; Group C: t = 8.08 (neutral videos, 2.26 ± 0.86; gameplay videos, 4.17 ± 0.48), Cohens’ d = 2.77]. However, the ANCOVA results showed no differences between the three groups.
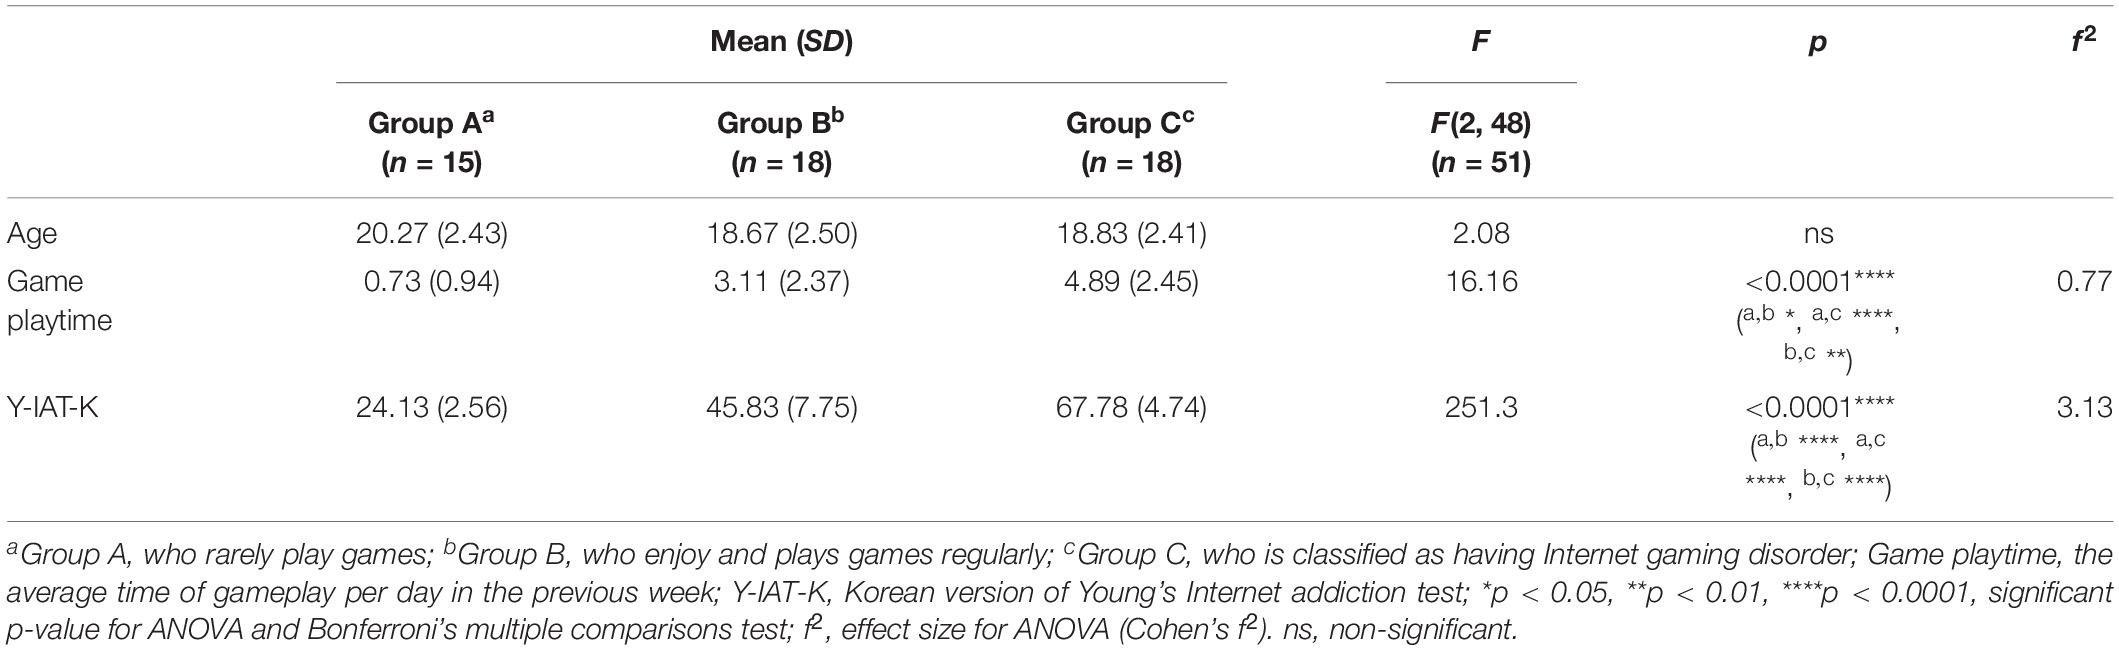
Table 1. Mean, standard deviation (SD), F, and p-value of analysis of variance (ANOVA) on demographic data.
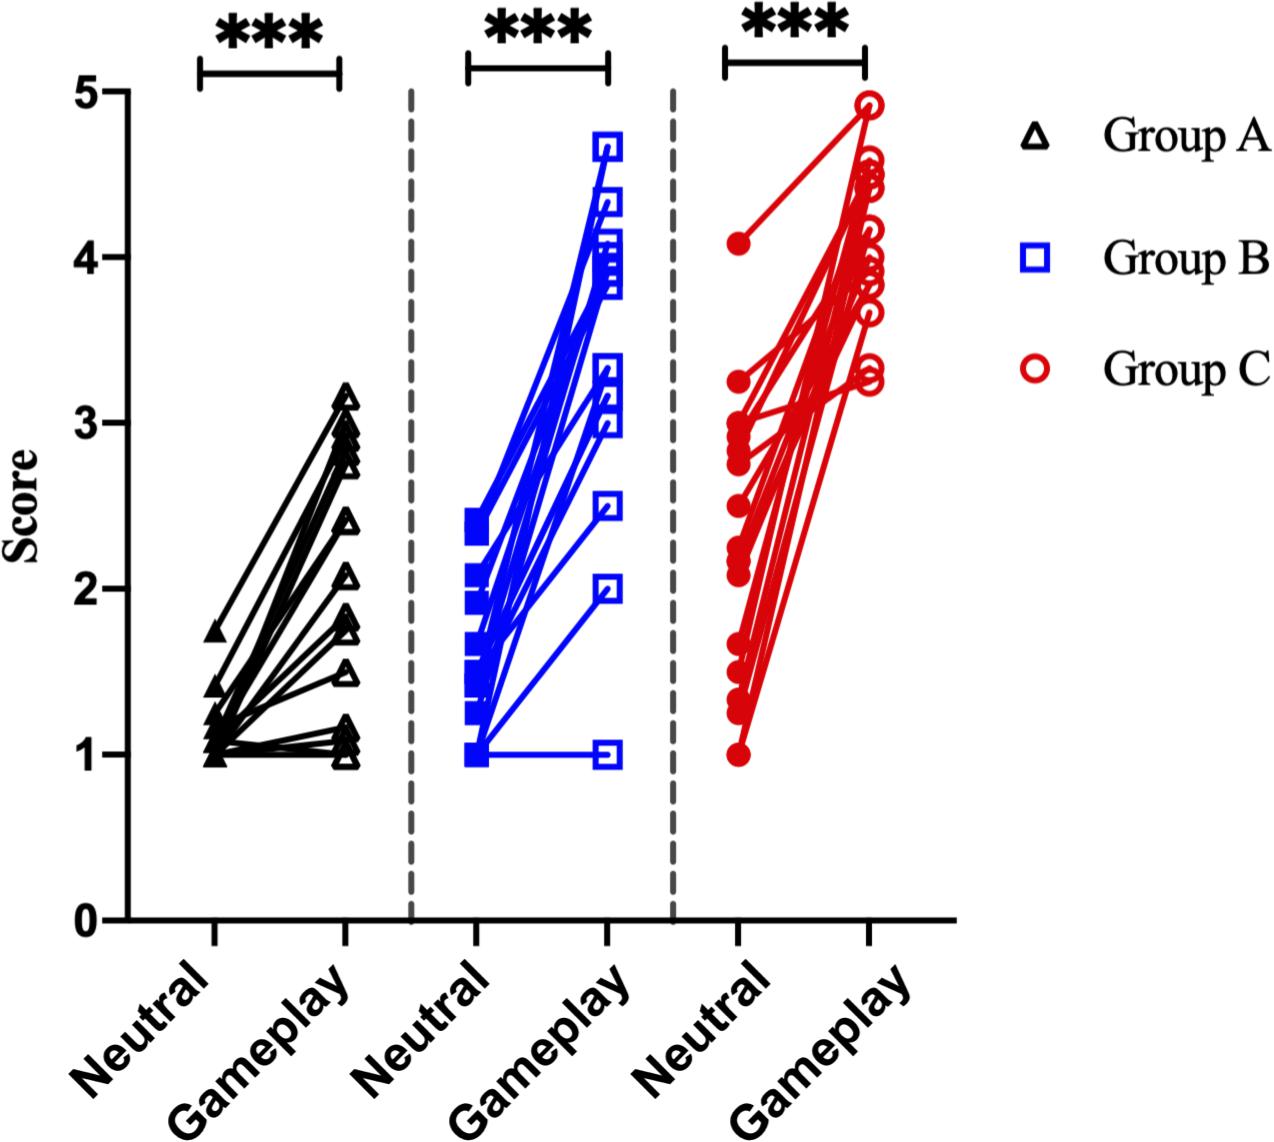
Figure 4. Analysis of the self-reported craving scores of 51 participants. ***p < 0.0001 (paired sample t-test).
Statistical Analysis
Among the EOG components, VSM for gameplay videos controlling neutral videos showed significant results among the three groups (ANCOVA, p-value < 0.05). Among the PPG components, SDNN and PNN50 were statistically significant (ANCOVA, p-value < 0.05). Only the effect size of the VSM is higher than the expected effect size for ANCOVA. However, VSM, SDNN and PNN50 were not highly significant [p-value (FDR Correction) > 0.0075]. Figure 5 and Table 2 present detailed values. Ten EEG indicators for gameplay videos controlling neutral videos showed significant results between the three groups (ANCOVA, p-value < 0.05). The significant indicators were as follows: RTPF, RAPF, DGRPF, DBRPF, TBRPF, ABRPF, ABRF, DGRP, DGRO, and TGRO. There were also six highly significant features (RTPF, DGRO, TBRPF, TGRO, ABRPF, and ABRF) [p-value (FDR Correction) < 0.0075]. Almost all features are higher than the expected effect size for ANCOVA, except for RAPF, DGRPF, and DGRP. Figure 6 and Table 3 present detailed values.
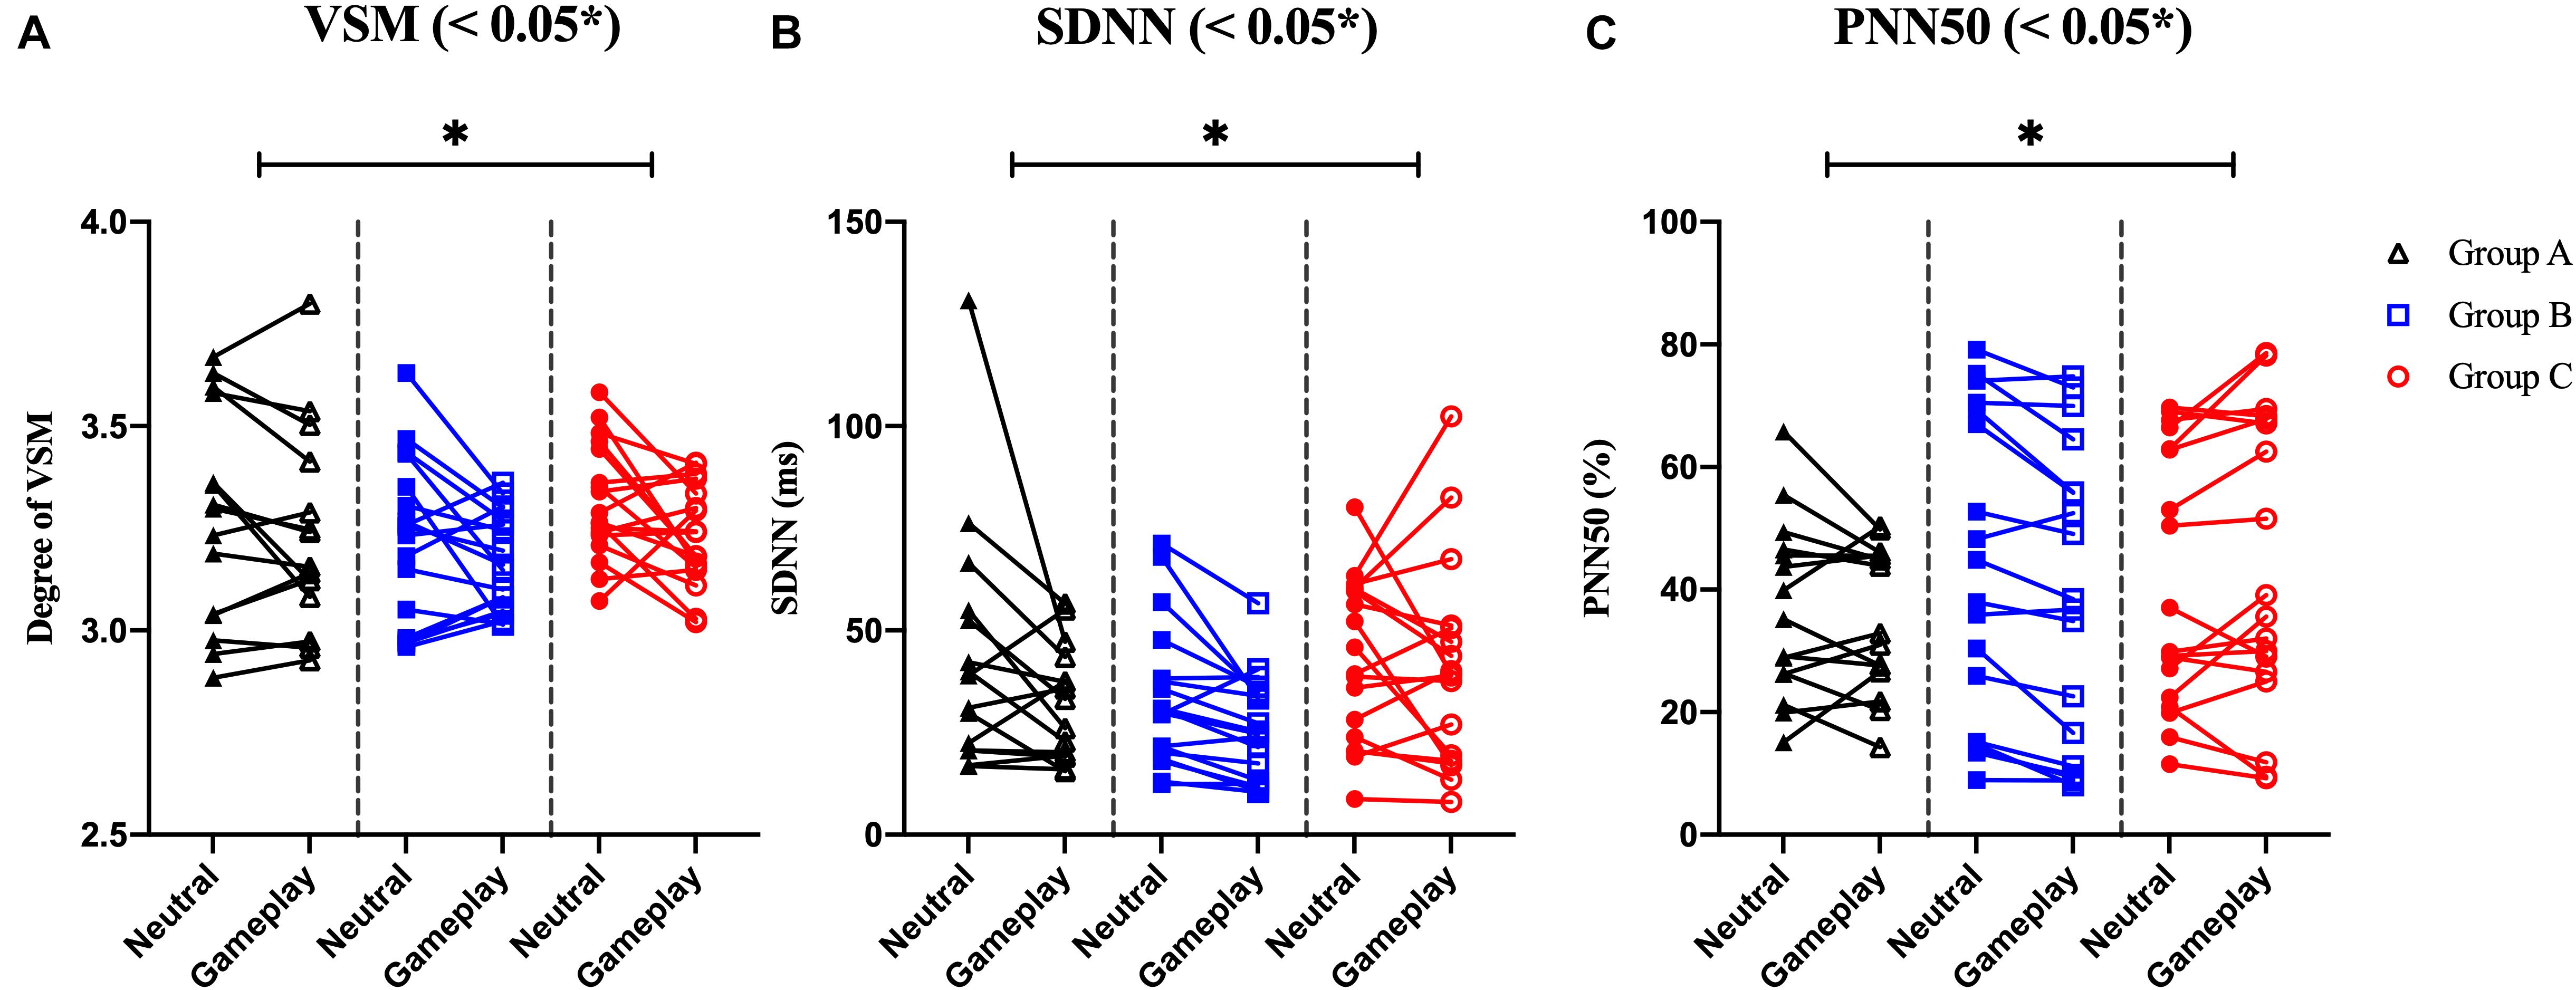
Figure 5. Symbols and lines plot for analysis of covariance with significant results of electrooculogram and photoplethysmogram features. (A) Vertical saccadic movement (VSM). (B) Standard deviation of normal to normal (N-N) intervals (SDNN). (C) The % of the total N-N intervals in which the difference between two consecutive N-N intervals is geater than 50ms (PNN50). *p < 0.05 (post-hoc of analysis of covariance with Bonferroni correction).
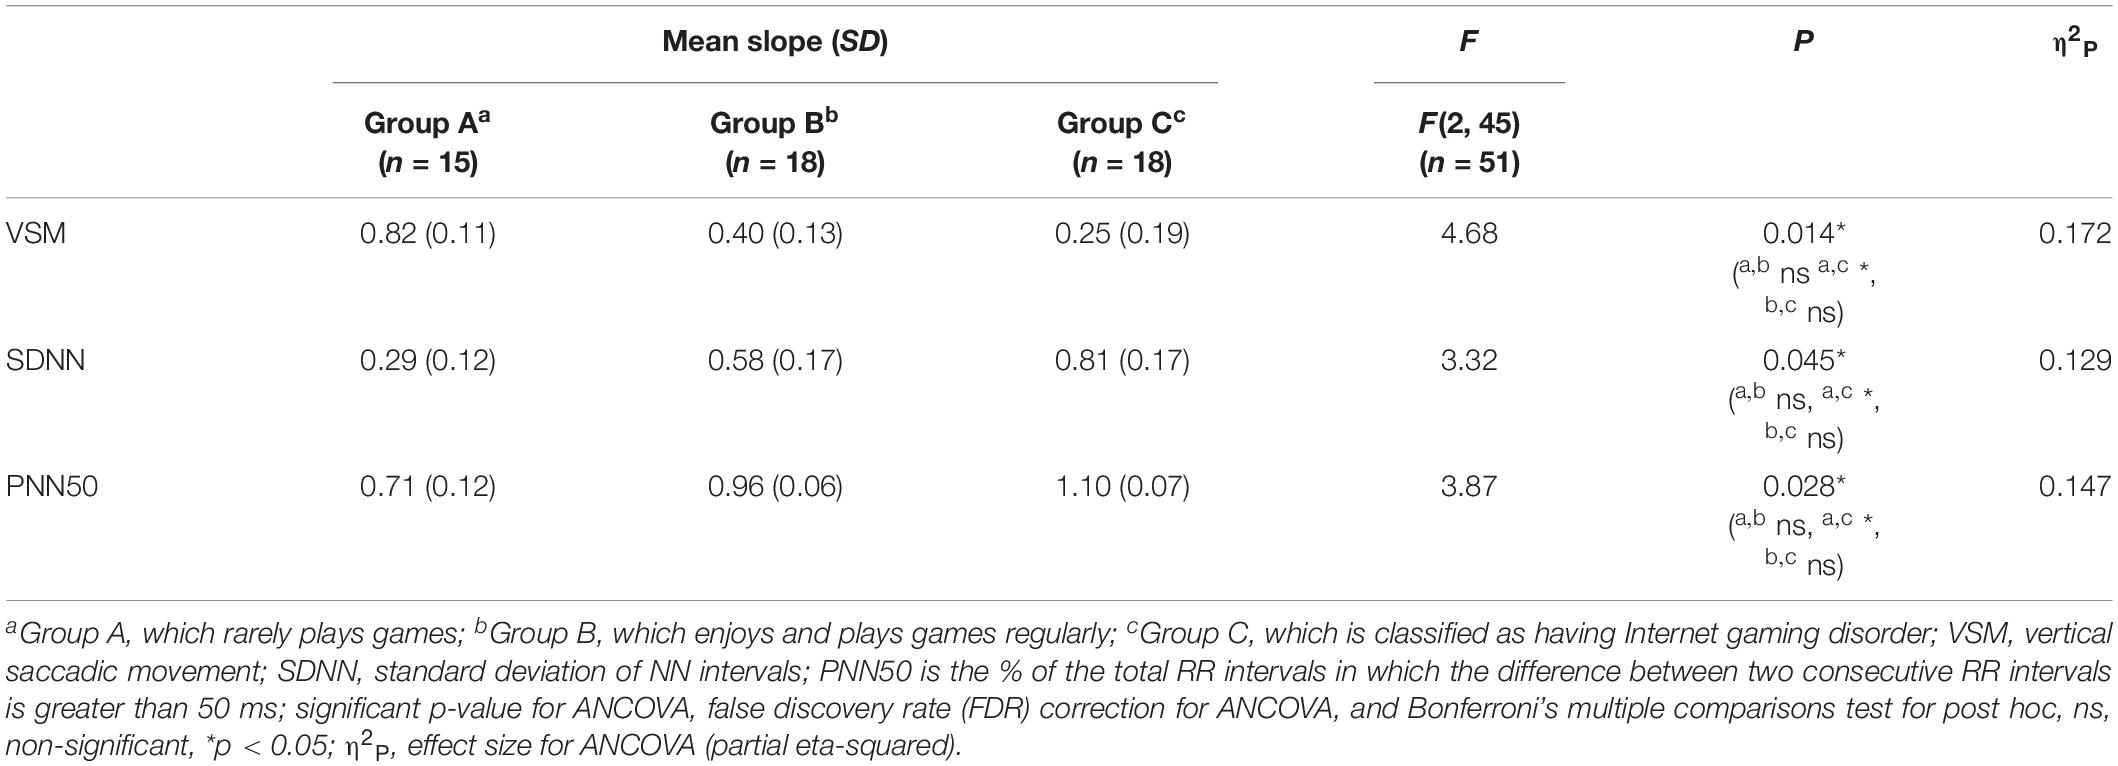
Table 2. Mean and standard deviation (SD) of slope, F, and p-value of analysis of covariance (ANCOVA) on electrooculogram and photoplethysmogram features.
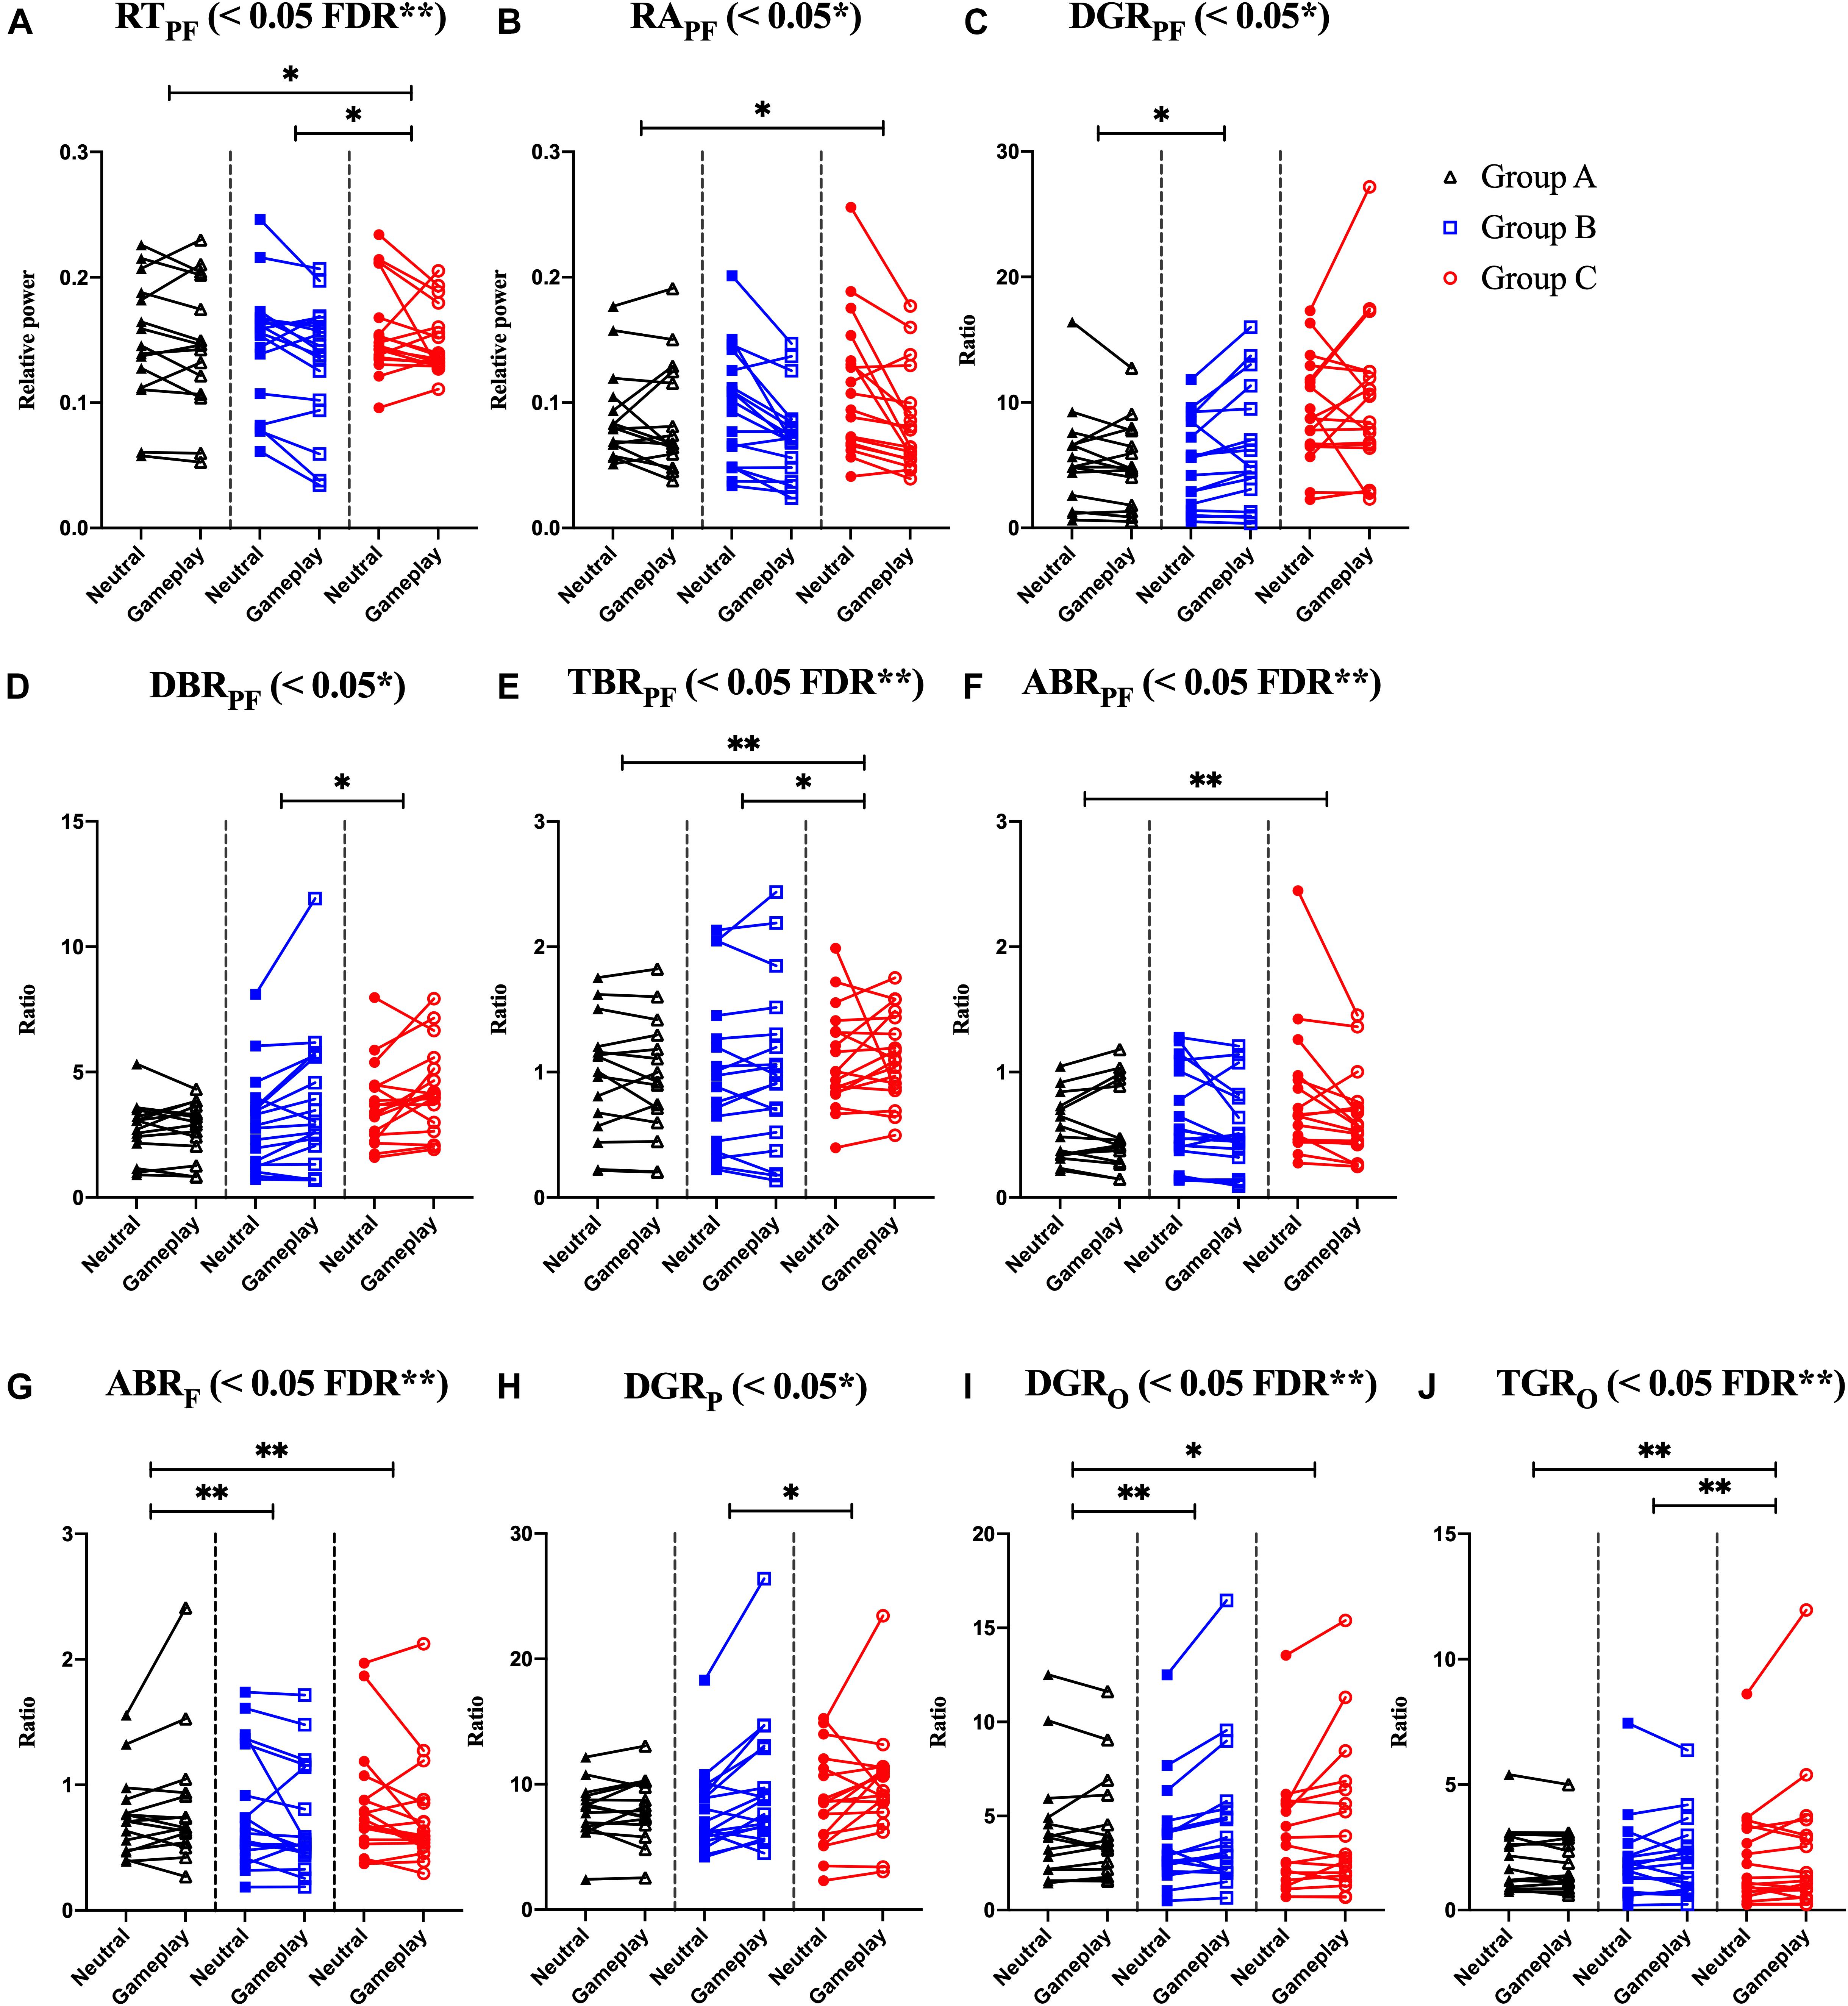
Figure 6. Symbols and lines plot for analysis of covariance with significant results of electroencephalogram features. (A) Prefrontal relative theta power (RTPF). (B) Prefrontal relative alpha power (RAPF). (C) Prefrontal delta/gamma ratio (DGRPF). (D) Prefrontal delta/beta ratio (DBRPF). (E) Prefrontal theta/beta ratio (TBRPF). (F) Prefrontal alpha/beta ratio (ABRPF). (G) Frontal alpha/beta ratio (ABRF). (H) Parietal delta/gamma ratio (DGRP). (I) Occipital delta/gamma ratio (DGRO). (J) Occipital theta/gamma ratio (TGRO). *p < 0.05, **p < 0.01 (post-hoc of analysis of covariance with Bonferroni correction). And FDR **p < 0.05 with FDR correction for analysis of covariance.
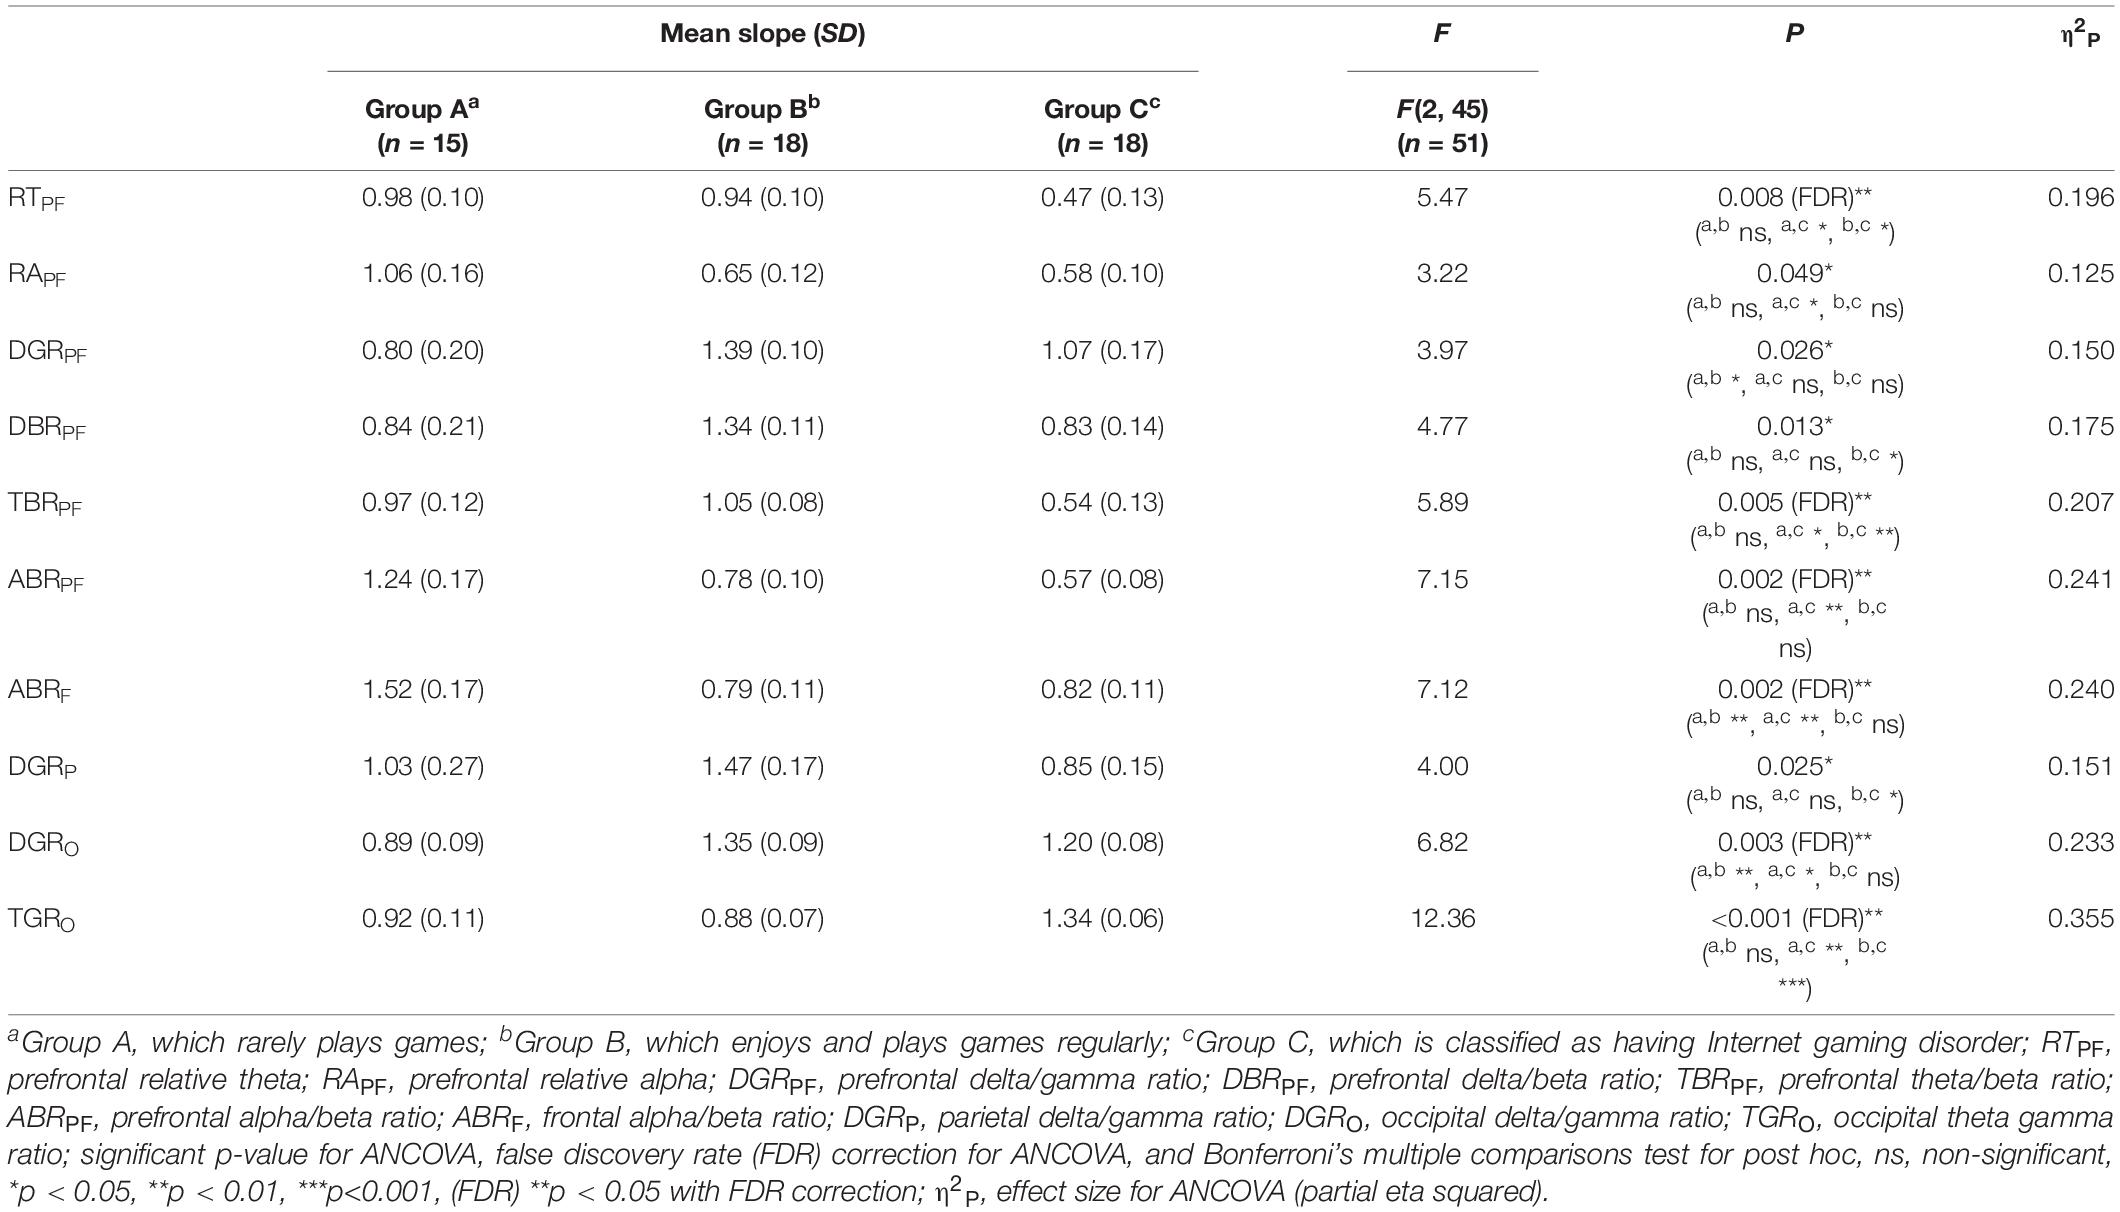
Table 3. Mean and standard deviation (S.D.) of slope, F, and p-value of analysis of covariance (ANCOVA) on electroencephalogram (EEG) features.
Classification
Feature Selection
Indicators that met the statistical criteria (p-value < 0.05) were used as classification features and they are listed as follows: VSM, SDNN, PNN50, RTPF, RAPF, DGRPF, DBRPF, TBRPF, ABRPF, ABRF, DGRP, DGRO, and TGRO. To design the features, they were modified since they were composed of before-and-after data on each indicator. This variation (in this study, the value of gameplay video data—neutral video data) for each indicator is an important characteristic. The modified feature was as follows:
Classification Performances
The results of the classification of 2-layers FFNN were compared according to three cases, and the results were as follows. The accuracy of Case-1 using only significant EOG and PPG features was 0.86 (number of features, 3; number of nodes in the first layer: 33; second layer: 20). The accuracy of Case-2 using only significant EEG features was 0.87 (number of features, 10; number of nodes in the first layer: 25; second layer: 7). The accuracy of Case-3 using all significant features was 0.90 (number of features, 13; number of nodes in the first layer: 26; second layer: 40). Table 4 presents the detailed values of accuracy, recall, precision, and F-1 score.
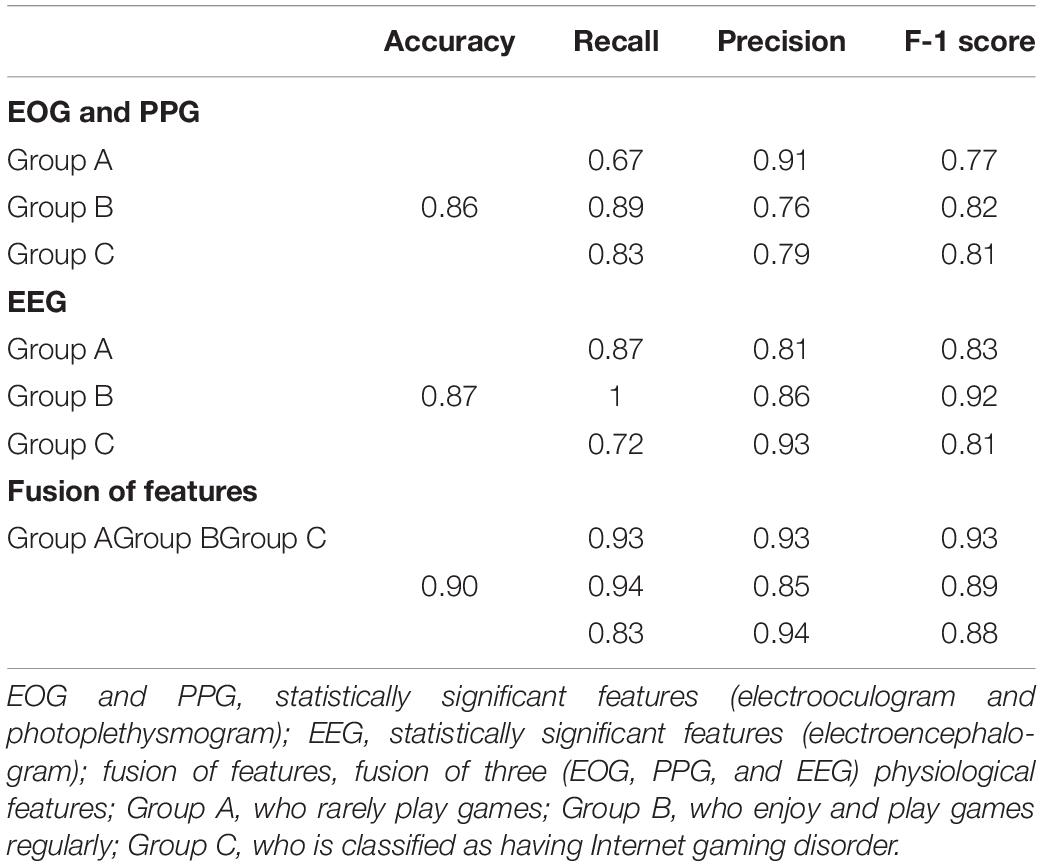
Table 4. Performance (Accuracy, Recall, Precision, F-1 Score) of classification using feed-forward neural network.
Discussion
The purpose of this study was to identify features to objectively measure IGD. Accordingly, participants were classified into groups A, B, and C. Age was statistically matched in the demographic data. Since statistically significant differences were observed for Y-IAT-K scores and the average gameplay time, we were able to clearly classify the experimental groups. Interestingly, all three groups had higher self-reported craving scores while watching gameplay videos (significant paired t-test results), whereas self-reported scores did not significantly distinguish the three groups (non-significant ANCOVA results). These results disprove that game-related cues induced more craving for games. However, these subjective ratings could not classify the three groups.
All physiological signals were statistically analyzed. For EOG, VSM was statistically significant from the result of ANCOVA. The lower the movement of the eyeball while concentrating (when the participant watches gameplay videos), the lower the VSM, and the greater the movement of the eyeball (when the participant watches neutral videos), the more disrupted the concentration, higher the VSM. Several studies have already reported that VSM is related to concentration (Hoffman and Subramaniam, 1995; Mogg et al., 2003). Kim et al. (2018) interpreted high VSM of participants with IGD watching gameplay videos as high concentration. However, we concluded that eye movement on a gameplay video could not be the sole indicator of addiction. We assumed that the more addicted the participants are, the higher their familiarity would be with the game. Ultimately, these factors made the difference between HC and IGD’s focus on the game, which resulted in statistical significance between the groups. For PPG, both SDNN and PNN50 showed similar tendencies. As shown in the results of Group A, the SDNN and PNN50 decreased in the gameplay videos condition than in the neutral videos condition. This finding means that the heart rate fluctuation becomes monotonous. Previous studies have suggested that this phenomenon is stressful and unstable (Park et al., 2011, 2014; Castaldo et al., 2019). Although these EOG and PPG features were not highly significant, and they did not satisfy FDR corrections, they showed a difference between groups. Therefore, we used these indicators (VSM, SDNN, and PNN50) as classification features.
To explain the combined EEG indicators that satisfied FDR corrections, many previous studies on IGD, other addictions, and emotional processes related to EEG features were reviewed. Negative variations of RTPF and TBRPF (a numerator: decreased prefrontal theta, a denominator: increased prefrontal beta) were the highest and positive variation of TGRO (a numerator: increased occipital theta, a denominator: decreased occipital gamma) was the highest in Group C. These results could be attributed to the characteristics of IGD as recent studies have shown that these responses are associated with other addictions or IGD. HajiHosseini and Holroyd (2015) and Marco-Pallarés et al. (2015) speculated that increased prefrontal beta power follows a reward-related response. Minguillon et al. (2016) proposed that lower gamma power means low-level stress. Correas et al. (2019) demonstrated that young binge drinkers exhibited lower prefrontal theta power (desynchronization) than light drinkers when they were exposed to visual targets. Ha et al. (2020) demonstrated that participants with IGD exhibited higher variation in parieto-occipital theta power when exposed to game-related cues and neutral cues than in healthy controls. Positive variations in ABRPF and ABRF (a numerator: increased prefrontal/frontal alpha, a denominator: decreased prefrontal/frontal beta) were the highest in Group A. Conversely, negative variations of these features appeared in Groups B and C (a numerator: decreased prefrontal/frontal alpha, a denominator: increased prefrontal/frontal beta). Liu et al. (1998) reported that increased arousal accompanied alpha desynchronization in cocaine addiction, and Ieong et al. (2019) demonstrated that lower prefrontal alpha in opiate addiction is associated with prefrontal desynchronization in their EEG and functional near-infrared spectrogram studies. Previous studies have shown that lower frontal midline beta power is associated with reward-related responses (HajiHosseini and Holroyd, 2015; Marco-Pallarés et al., 2015). Positive variation in DGRO was the highest in Group B, and the delta power of Group B was the highest. However, the interpretation for Group B is difficult because there are no EEG-based studies for participants who do not have IGD but who still enjoy and play games regularly. Explanations of delta power also vary; therefore, these results could be complex. Several studies have shown that a higher delta indicates a craving state (Phillips et al., 1994; Reid et al., 2003, 2006) and arousal (Sforza et al., 2000; Clarke et al., 2013; Reuderink et al., 2013). Although the increased features of Group B are difficult to interpret, our results show that these features are statistically significant and the classification results including these features are satisfactory. Notably, Group B indicators significantly differ from that of Groups A and C.
If a participant is interested in the game, focusing on gameplay videos can induce cravings. However, such evidence is insufficient to diagnose it as an IGD. Comparing participants with IGD (Group C) to the traditional control group (Group A) could result in misjudgment of IGD by applying these criteria to Group B. In this study, the statistically significant indicators given above were used as features to classify the three groups. Both autonomic and central nervous system signals were classified with a high accuracy of over 0.90. In the field of game addiction, there is no study that classifies gamers as having IGD or not having IGD, by directly using physiological signals. However, in studies on other addictions, those with addiction and those without addiction were classified using EEG or fMRI data. Saddam et al. (2017) reported 0.94 accuracy on 260 samples (130 alcohol use disorders and 130 control groups) using EEG. Mumtaz et al. (2018) reported 0.98 accuracy on 60 samples (30 alcohol use disorders and 30 control groups) using EEG. Kamarajan et al. (2020) reported 0.77 accuracy in 60 samples (30 alcohol use disorders and 30 control groups). Thus, to the best of our knowledge, this study is the first to conduct a three-class classification exceeding 0.90 accuracy, similar to previous addiction studies.
This study makes important contributions to the literature. One such contribution is that the classification was done using features that can be interpreted by using statistically significant indicators of IGD. Another contribution is that the participants were divided into three groups, and not merely into simple categories such as those with addiction and those without addiction. This study suggests that IGD can also be distinguished through the fusion of physiological signals like previous studies based on fMRI or EEG. The concept of a group that merely enjoys an activity and is non-addictive (like Group B) should be interpreted differently from addiction as one of the key topics for game addiction and for the new addictive disorder. This study can also be used directly in CET for IGD treatment. Since we used responses based on gameplay and neutral videos in our experiment, we showed that subjective indicators (self-reported craving scores) could not distinguish between the IGD (Group C) and non-IGD groups (Groups A and B). Thus, we demonstrated that more objective indicators of the autonomous and central nervous systems could distinguish between IGD and non-IGD groups. These objective indicators can supplement conventional assessments, such as Young’s internet addiction test.
This study has some limitations. First, the experiment was conducted on men and teenagers, based on reports and studies that indicated IGD mostly as a problem among men and adolescents. Hence, caution should be taken in applying the results of this study on women. Second, our sample size was relatively small. Therefore, we will repeat the study with a larger sample size in the future. We used statistically significant features for reliability of results, unlike classifications using several uninterpretable features in existing studies. If this study is conducted again in the future, we believe that the results can provide greater confidence. Among features satisfying no multiple comparison correction and expected effect size, caution should be taken in applying them to the classifier. Third, emphasizing practicality, the experiments used PPG and EEG, although there are more efficient ways to clearly identify autonomous and central nervous system functions, such as ECG and fMRI.
In summary, statistically significant physiological signals were extracted by presenting game-related cues. Using these extracted indicators, three groups were distinguished: those who did not play well (Group A), those who enjoyed and played games regularly (Group B), and those who overused games, classified as having IGD (Group C). The classification accuracy was 0.90. Considering the scarcity of studies on IGD and evidence of objective indicators such as physiological signals we found can contribute to research, treatment, and prevention of IGD.
Data Availability Statement
The raw data supporting the conclusions of this article will be made available by the authors, without undue reservation.
Ethics Statement
The studies involving human participants were reviewed and approved by the Institutional Review Board (IRB) (Approval number: 2017-013) of the Korea Institute of Science and Technology (KIST). Written informed consent to participate in this study was provided by the participants’ legal guardian/next of kin.
Author Contributions
JH contributed to performing the experiments, analyzing the data, and writing the manuscript. JH and LK conceived and designed the experiment. SP, C-HI, and LK revised the manuscript. LK supervised the experiments and overall study. All authors contributed to the article and approved the submitted version.
Funding
This research was supported in part by the Institute of Information & Communications Technology Planning & Evaluation (IITP) grant funded by the Korean government (MSIT) (2017-0-00432, Development of non-invasive integrated BCI SW platform to control home appliances and external devices by user’s thought via AR/VR interface).
Conflict of Interest
The authors declare that the research was conducted in the absence of any commercial or financial relationships that could be construed as a potential conflict of interest.
Publisher’s Note
All claims expressed in this article are solely those of the authors and do not necessarily represent those of their affiliated organizations, or those of the publisher, the editors and the reviewers. Any product that may be evaluated in this article, or claim that may be made by its manufacturer, is not guaranteed or endorsed by the publisher.
Supplementary Material
The Supplementary Material for this article can be found online at: https://www.frontiersin.org/articles/10.3389/fpsyg.2021.714333/full#supplementary-material
Abbreviations
VSM, Vertical saccadic movement; HSM, horizontal saccadic movement; RTPF, prefrontal relative theta; RAPF, prefrontal relative alpha; DBRPF, prefrontal delta/beta ratio; DBRF, frontal delta/beta ratio; DBRP, parietal delta/beta ratio; DBRO, occipital delta/beta ratio; DGRPF, prefrontal delta/gamma ratio; DGRF, frontal delta/gamma ratio; DGRP, parietal delta/gamma ratio; DGRO, occipital delta/gamma ratio; TBRPF, prefrontal theta/beta ratio; TBRF, frontal theta/beta ratio; TBRP, parietal theta/beta ratio; TBRO, occipital theta/beta ratio; TGRPF, prefrontal theta/gamma ratio; TGRF, frontal theta/gamma ratio; TGRP, parietal theta/gamma ratio; TGRO, occipital theta/gamma ratio; ABRPF, prefrontal alpha/beta ratio; ABRF, frontal alpha/beta ratio; ABRP, parietal alpha/beta ratio; ABRO, occipital alpha/beta ratio.
Footnotes
References
American Psychiatric Association (2013). Diagnostic and Statistical Manual of Mental Disorders, 5th Edn. Arlington, VA: American Psychiatric Publishing.
Benjamini, Y., and Yekutieli, D. (2001). The control of the false discovery rate in multiple testing under dependency. Ann. Stat. 29, 1165–1188. doi: 10.1214/aos/1013699998
Castaldo, R., Montesinos, L., Melillo, P., James, C., and Pecchia, L. (2019). Ultra-short term HRV features as surrogates of short term HRV: a case study on mental stress detection in real life. BMC Med. Inform. Decis. Mak. 19:12. doi: 10.1186/s12911-019-0742-y
Chang, W.-D., Cha, H.-S., Kim, S. H., and Im, C.-H. (2017). Development of an electrooculogram-based eye-computer interface for communication of individuals with amyotrophic lateral sclerosis. J. Neuroeng. Rehabil. 14:89.
Choi, J.-S., Park, S. M., Lee, J., Hwang, J. Y., Jung, H. Y., Choi, S.-W., et al. (2013). Resting-state beta and gamma activity in Internet addiction. Int. J. Psychophysiol. 89, 328–333. doi: 10.1016/j.ijpsycho.2013.06.007
Clarke, A. R., Barry, R. J., Dupuy, F. E., McCarthy, R., Selikowitz, M., and Johnstone, S. J. (2013). Excess beta activity in the EEG of children with attention-deficit/hyperactivity disorder: a disorder of arousal? Int. J. Psychophysiol. 89, 314–319. doi: 10.1016/j.ijpsycho.2013.04.009
Clarke, A. R., Barry, R. J., Karamacoska, D., and Johnstone, S. J. (2019). The EEG theta/beta ratio: a marker of arousal or cognitive processing capacity? Appl. Psychophysiol. Biofeedback 44, 123–129. doi: 10.1007/s10484-018-09428-6
Correas, Á, López-Caneda, E., Beaton, L., Rodríguez Holguín, S., García-Moreno, L. M., Antón-Toro, L. F., et al. (2019). Decreased event-related theta power and phase-synchrony in young binge drinkers during target detection: an anatomically-constrained MEG approach. J. Psychopharmacol. 33, 335–346. doi: 10.1177/0269881118805498
De Pascalis, V., Vecchio, A., and Cirillo, G. (2020). Resting anxiety increases EEG delta–beta correlation: relationships with the reinforcement sensitivity theory personality traits. Pers. Individ. Differ. 156:109796. doi: 10.1016/j.paid.2019.109796
Dehghani-Arani, F., Rostami, R., and Nadali, H. (2013). Neurofeedback training for opiate addiction: improvement of mental health and craving [OriginalPaper]. Appl. Psychophysiol. Biofeedback 38, 133–141. doi: 10.1007/s10484-013-9218-5
Doborjeh, M. G., Wang, G. Y., Kasabov, N., Kydd, R., and Russell, B. (2016). A Spiking neural network methodology and system for learning and comparative analysis of EEG data from healthy versus addiction treated versus addiction not treated subjects. IEEE Trans. Biomed. Eng. 63, 1830–1841. doi: 10.1109/TBME.2015.2503400
Dong, G., Huang, J., and Du, X. (2011). Enhanced reward sensitivity and decreased loss sensitivity in internet addicts: an fMRI study during a guessing task. J. Psychiatr. Res. 45, 1525–1529. doi: 10.1016/j.jpsychires.2011.06.017
Dong, G., Wu, L., Wang, Z., Wang, Y., Du, X., and Potenza, M. N. (2018). Diffusion-weighted MRI measures suggest increased white-matter integrity in Internet gaming disorder: evidence from the comparison with recreational internet game users. Addict. Behav. 81, 32–38. doi: 10.1016/j.addbeh.2018.01.030
Du, J., Fan, C., Jiang, H., Sun, H., Li, X., and Zhao, M. (2014). Biofeedback combined with cue-exposure as a treatment for heroin addicts. Physiol. Behav. 130, 34–39. doi: 10.1016/j.physbeh.2014.02.055
Evans, J. R., and Abarbanel, A. (1999). Introduction to Quantitative EEG and Neurofeedback. Available online at: https://books.google.com/books?hl=en&lr=&id=nIPyKjhY6ngC&oi=fnd&pg=PP2&dq=Neurofeedback+EEG+addiction&ots=5WvBO3wp1y&sig=zRlTn6AwvtgEEXU-3V7iiJo59FU (accessed April 12, 2021).
Faul, F., Erdfelder, E., Buchner, A., and Lang, A.-G. (2009). Statistical power analyses using G∗ Power 3.1: tests for correlation and regression analyses. Behav. Res. Methods 41, 1149–1160. doi: 10.3758/brm.41.4.1149
Faul, F., Erdfelder, E., Lang, A.-G., and Buchner, A. (2007). G∗ Power 3: a flexible statistical power analysis program for the social, behavioral, and biomedical sciences. Behav. Res. Methods 39, 175–191. doi: 10.3758/bf03193146
Gametrics (2016). Weekly Game Trends for Week 2 of Feburary 2016. Available online at: http://www.gametrics.com/news/news02_view.aspx?seqid=26850 (accessed March 01, 2016).
Ghiţã, A., Hernández-Serrano, O., Fernández-Ruiz, Y., Monras, M., Ortega, L., Mondon, S., et al. (2019). Cue-elicited anxiety and alcohol craving as indicators of the validity of ALCO-VR software: a virtual reality study. J. Clin. Med. 8:1153. doi: 10.3390/jcm8081153
Ha, J., Park, W., Park, S. I., Im, C.-H., and Kim, L. (2020). EEG response to game-craving according to personal preference for games. Soc. Cogn. Affect. Neurosci. 15:nsaa131.
HajiHosseini, A., and Holroyd, C. B. (2015). Reward feedback stimuli elicit high-beta EEG oscillations in human dorsolateral prefrontal cortex. Sci. Rep. 5:13021.
Han, D. H., Kim, Y. S., Lee, Y. S., Min, K. J., and Renshaw, P. F. (2010). Changes in cue-induced, prefrontal cortex activity with video-game play. Cyberpsychol. Behav. Soc. Netw. 13, 655–661. doi: 10.1089/cyber.2009.0327
Han, J. W., Han, D. H., Bolo, N., Kim, B., Kim, B. N., and Renshaw, P. F. (2015). Differences in functional connectivity between alcohol dependence and internet gaming disorder. Addict. Behav. 41, 12–19. doi: 10.1016/j.addbeh.2014.09.006
Hernández-Serrano, O., Ghiţã, A., Figueras-Puigderrajols, N., Fernández-Ruiz, J., Monras, M., Ortega, L., et al. (2020). Predictors of changes in alcohol craving levels during a virtual reality cue exposure treatment among patients with alcohol use disorder. J. Clin. Med. 9:3018. doi: 10.3390/jcm9093018
Hoffman, J. E., and Subramaniam, B. (1995). The role of visual attention in saccadic eye movements. Percept. Psychophys. 57, 787–795. doi: 10.3758/bf03206794
Ieong, H. F., Gao, F., and Yuan, Z. (2019). Machine learning: assessing neurovascular signals in the prefrontal cortex with non-invasive bimodal electro-optical neuroimaging in opiate addiction. Sci. Rep. 9:18262.
Ji, H.-M., Chen, L.-Y., and Hsiao, T.-C. (2019). “Real-time detection of internet addiction using reinforcement learning system,” in Proceedings of the Genetic and Evolutionary Computation Conference Companion, Prague.
Jiang, M., Mieronkoski, R., Rahmani, A. M., Hagelberg, N., Salanterä, S., and Liljeberg, P. (2017). “Ultra-short-term analysis of heart rate variability for real-time acute pain monitoring with wearable electronics,” in Proceedings of the 2017 IEEE International Conference on Bioinformatics and Biomedicine (BIBM), Kansas City, MO.
Jin, C., Zhang, T., Cai, C., Bi, Y., Li, Y., Yu, D., et al. (2016). Abnormal prefrontal cortex resting state functional connectivity and severity of internet gaming disorder [OriginalPaper]. Brain Imaging Behav. 10, 719–729. doi: 10.1007/s11682-015-9439-8
Kamarajan, C., Ardekani, B. A., Pandey, A. K., Kinreich, S., Pandey, G., Chorlian, D. B., et al. (2020). Random forest classification of alcohol use disorder using fMRI functional connectivity, neuropsychological functioning, and impulsivity measures. Brain Sci. 10:115. doi: 10.3390/brainsci10020115
Keselman, H., Huberty, C. J., Lix, L. M., Olejnik, S., Cribbie, R. A., Donahue, B., et al. (1998). Statistical practices of educational researchers: an analysis of their ANOVA, MANOVA, and ANCOVA analyses. Rev. Educ. Res. 68, 350–386. doi: 10.3102/00346543068003350
Kim, D.-J., Bolbecker, A. R., Howell, J., Rass, O., Sporns, O., Hetrick, W. P., et al. (2013). Disturbed resting state EEG synchronization in bipolar disorder: a graph-theoretic analysis. Neuroimage Clin. 2, 414–423.
Kim, H., Ha, J., Chang, W.-D., Park, W., Kim, L., and Im, C.-H. (2018). Detection of craving for gaming in adolescents with internet gaming disorder using multimodal biosignals [Article]. Sensors 18:102. doi: 10.3390/s18010102
Kim, H., Kim, L., and Im, C.-H. (2019). Machine-learning-based detection of craving for gaming using multimodal physiological signals: validation of test-retest reliability for practical use [Article]. Sensors 19:3475. doi: 10.3390/s19163475
Kim, Y. J., Lee, J.-Y., Oh, S., Park, M., Jung, H. Y., Sohn, B. K., et al. (2017). Associations between prospective symptom changes and slow-wave activity in patients with internet gaming disorder: a resting-state EEG study. Medicine 96:e6178. doi: 10.1097/MD.0000000000006178
Kuss, D. J., and Lopez-Fernandez, O. (2016). Internet addiction and problematic internet use: a systematic review of clinical research. World J. Psychiatry 6, 143–176. doi: 10.5498/wjp.v6.i1.143
Kuss, D. J., Pontes, H. M., and Griffiths, M. D. (2018). Neurobiological correlates in internet gaming disorder: a systematic literature review. Front. Psychiatry 9:166. doi: 10.3389/fpsyt.2018.00166
Lee, J.-Y., and Kang, H.-B. (2014). EEG and ERP based degree of internet game addiction analysis. J. Korea Multimed. Soc. 17, 1325–1334.
Lee, K., Lee, H.-K., Gyeong, H., Yu, B., Song, Y.-M., and Kim, D. (2013). Reliability and validity of the Korean version of the internet addiction test among college students. J. Korean Med. Sci. 28, 763–768.
Lee, K.-R., Chang, W.-D., Kim, S., and Im, C.-H. (2016). Real-time “eye-writing” recognition using electrooculogram. IEEE Trans. Neural Syst. Rehabil. Eng. 25, 37–48.
Ling, Z., Yue, C., Wenjie, L., and Fan, J. (2015). Electroencephalogram feature detection and classification in people with internet addiction disorder with visual oddball paradigm. J. Med. Imaging Health Inform. 5, 1499–1503. doi: 10.1166/jmihi.2015.1570
Liu, N.-H., Chiang, C.-Y., and Chu, H.-C. (2013). Recognizing the degree of human attention using EEG signals from mobile sensors. Sensors 13, 10273–10286. doi: 10.3390/s130810273
Liu, X., Vaupel, D. B., Grant, S., and London, E. D. (1998). Effect of cocaine-related environmental stimuli on the spontaneous electroencephalogram in polydrug abusers. Neuropsychopharmacology 19, 10–17.
Marco-Pallarés, J., Münte, T. F., and Rodríguez-Fornells, A. (2015). The role of high-frequency oscillatory activity in reward processing and learning. Neurosci. Biobehav. Rev. 49, 1–7.
Mete, M., Sakoglu, U., Spence, J. S., Devous, M. D., Harris, T. S., and Adinoff, B. (2016). Successful classification of cocaine dependence using brain imaging: a generalizable machine learning approach. BMC Bioinformatics 17(Suppl. 13):357. doi: 10.1186/s12859-016-1218-z
Minguillon, J., Lopez-Gordo, M. A., and Pelayo, F. (2016). Stress assessment by prefrontal relative gamma. Front. Comput. Neurosci. 10:101. doi: 10.3389/fncom.2016.00101
Missonnier, P., Prévot, A., Herrmann, F. R., Ventura, J., Padée, A., and Merlo, M. C. (2020). Disruption of gamma–delta relationship related to working memory deficits in first-episode psychosis. J. Neural Transm. 127, 103–115. doi: 10.1007/s00702-019-02126-5
Mogg, K., Bradley, B. P., Field, M., and De Houwer, J. (2003). Eye movements to smoking-related pictures in smokers: relationship between attentional biases and implicit and explicit measures of stimulus valence. Addiction 98, 825–836. doi: 10.1046/j.1360-0443.2003.00392.x
Monti, P. M., and Rohsenow, D. J. (1999). Coping-skills training and cue-exposure therapy in the treatment of alcoholism. Alcohol Res. Health 23, 107–115.
Moretti, D., Fracassi, C., Pievani, M., Geroldi, C., Binetti, G., Zanetti, O., et al. (2009). Increase of theta/gamma ratio is associated with memory impairment. Clin. Neurophysiol. 120, 295–303. doi: 10.1016/j.clinph.2008.11.012
Mullen, T., Kothe, C., Chi, Y. M., Ojeda, A., Kerth, T., Makeig, S., et al. (2013). “Real-time modeling and 3D visualization of source dynamics and connectivity using wearable EEG,” in Proceedings of the 2013 35th Annual International Conference of the IEEE Engineering in Medicine and Biology Society (EMBC), Osaka.
Mumtaz, W., Kamel, N., Ali, S. S. A., and Malik, A. S. (2018). An EEG-based functional connectivity measure for automatic detection of alcohol use disorder. Artif. Intell. Med. 84, 79–89. doi: 10.1016/j.artmed.2017.11.002
Park, M., Choi, J.-S., Park, S. M., Lee, J. Y., Jung, H. Y., Sohn, B. K., et al. (2016). Dysfunctional information processing during an auditory event-related potential task in individuals with internet gaming disorder [OriginalPaper]. Transl. Psychiatry 6:e721. doi: 10.1038/tp.2015.215
Park, S., Won, M., Mun, S., Lee, E., and Whang, M. (2014). Does visual fatigue from 3D displays affect autonomic regulation and heart rhythm? Int. J. Psychophysiol. 92, 42–48. doi: 10.1016/j.ijpsycho.2014.02.003
Park, S.-I., Whang, M.-C., Kim, J.-W., Mun, S.-C., and Ahn, S.-M. (2011). Autonomic nervous system response affected by 3D visual fatigue evoked during watching 3D TV. Sci. Emot. Sensibility 14, 653–662.
Petry, N. M., and O’Brien, C. P. (2013). Internet gaming disorder and the DSM-5. Addiction 108, 1186–1187. doi: 10.1111/add.12162
Phillips, R. L., Herning, R., and London, E. D. (1994). Morphine effects on the spontaneous electroencephalogram in polydrug abusers: correlations with subjective self-reports. Neuropsychopharmacology 10, 171–181. doi: 10.1038/npp.1994.19
Poole, K. L., Anaya, B., and Pérez-Edgar, K. E. (2020). Behavioral inhibition and EEG delta-beta correlation in early childhood: comparing a between-subjects and within-subjects approach. Biol. Psychol. 149:107785. doi: 10.1016/j.biopsycho.2019.107785
Pripfl, J., Tomova, L., Riecansky, I., and Lamm, C. (2014). Transcranial magnetic stimulation of the left dorsolateral prefrontal cortex decreases cue-induced nicotine craving and EEG delta power. Brain Stimul. 7, 226–233. doi: 10.1016/j.brs.2013.11.003
Putman, P. (2011). Resting state EEG delta–beta coherence in relation to anxiety, behavioral inhibition, and selective attentional processing of threatening stimuli. Int. J. Psychophysiol. 80, 63–68. doi: 10.1016/j.ijpsycho.2011.01.011
Reid, M. S., Flammino, F., Howard, B., Nilsen, D., and Prichep, L. S. (2006). Topographic imaging of quantitative EEG in response to smoked cocaine self-administration in humans. Neuropsychopharmacology 31, 872–884. doi: 10.1038/sj.npp.1300888
Reid, M. S., Prichep, L. S., Ciplet, D., O’Leary, S., Tom, M., Howard, B., et al. (2003). Quantitative electroencephalographic studies of cue-induced cocaine craving. Clin. Electroencephalogr. 34, 110–123. doi: 10.1177/155005940303400305
Reuderink, B., Mühl, C., and Poel, M. (2013). Valence, arousal and dominance in the EEG during game play. Int. J. Auton. Adapt. Commun. Syst. 6, 45–62. doi: 10.1504/ijaacs.2013.050691
Roh, S.-C., Park, E.-J., Shim, M., and Lee, S.-H. (2016). EEG beta and low gamma power correlates with inattention in patients with major depressive disorder. J. Affect. Disord. 204, 124–130. doi: 10.1016/j.jad.2016.06.033
Saddam, M., Tjandrasa, H., and Navastara, D. A. (2017). “Classification of alcoholic EEG using wavelet packet decomposition, principal component analysis, and combination of genetic algorithm and neural network,” in Proceedings of the 2017 11th International Conference on Information & Communication Technology and System (ICTS), Surabaya.
Sakoglu, U., Mete, M., Esquivel, J., Rubia, K., Briggs, R., and Adinoff, B. (2019). Classification of cocaine-dependent participants with dynamic functional connectivity from functional magnetic resonance imaging data. J. Neurosci. Res. 97, 790–803. doi: 10.1002/jnr.24421
Sforza, E., Jouny, C., and Ibanez, V. (2000). Cardiac activation during arousal in humans: further evidence for hierarchy in the arousal response. Clin. Neurophysiol. 111, 1611–1619. doi: 10.1016/s1388-2457(00)00363-1
Smith, A.-L., Owen, H., and Reynolds, K. J. (2013). Heart rate variability indices for very short-term (30 beat) analysis. Part 1: survey and toolbox. J. Clin. Monit. Comput. 27, 569–576. doi: 10.1007/s10877-013-9471-4
Stoica, P., and Moses, R. L. (2005). Spectral Analysis of Signals. Upper Saddle River, NJ: Prentice Hall.
Wang, L., Wu, L., Wang, Y., Li, H., Liu, X., Du, X., et al. (2017). Altered brain activities associated with craving and cue reactivity in people with internet gaming disorder: evidence from the comparison with recreational Internet game users. Front. Psychol. 8:1150. doi: 10.3389/fpsyg.2017.01150
Yao, Y.-W., Wang, L.-J., Yip, S. W., Chen, P.-R., Li, S., Xu, J., et al. (2015). Impaired decision-making under risk is associated with gaming-specific inhibition deficits among college students with Internet gaming disorder. Psychiatry Res. 229, 302–309. doi: 10.1016/j.psychres.2015.07.004
Yi Wen, T., and Mohd Aris, S. (2020). Electroencephalogram (EEG) stress analysis on alpha/beta ratio and theta/beta ratio. Ind. J. Elect. Eng. Comp. Sci. 17, 175–182. doi: 10.11591/ijeecs.v17.i1.pp175-182
Young, K. S. (1998a). Caught in the Net: How to Recognize the Signs of Internet Addiction–and a Winning Strategy for Recovery. New York, NY: John Wiley & Sons.
Young, K. S. (1998b). Internet Addiction Test (IAT) Manual. Available online at: http://netaddiction.com/assessments/ (accessed August 13, 1998).
Young, K. S. (1998c). Internet addiction: the emergence of a new clinical disorder. Cyberpsychol. Behav. 1, 237–244. doi: 10.1089/cpb.1998.1.237
Zhang, Y., Ndasauka, Y., Hou, J., Chen, J., Wang, Y., Han, L., et al. (2016). Cue-induced behavioral and neural changes among excessive internet gamers and possible application of cue exposure therapy to internet gaming disorder. Front. Psychol. 7:675. doi: 10.3389/fpsyg.2016.00675
Keywords: internet gaming disorder, craving, electroencephalogram, addiction, electrooculogram, photoplethysmogram
Citation: Ha J, Park S, Im C-H and Kim L (2021) Classification of Gamers Using Multiple Physiological Signals: Distinguishing Features of Internet Gaming Disorder. Front. Psychol. 12:714333. doi: 10.3389/fpsyg.2021.714333
Received: 25 May 2021; Accepted: 26 August 2021;
Published: 24 September 2021.
Edited by:
Xia-an Bi, Hunan Normal University, ChinaReviewed by:
Theodore Raphan, Brooklyn College (CUNY), United StatesHui Zheng, Zhejiang Normal University, China
Copyright © 2021 Ha, Park, Im and Kim. This is an open-access article distributed under the terms of the Creative Commons Attribution License (CC BY). The use, distribution or reproduction in other forums is permitted, provided the original author(s) and the copyright owner(s) are credited and that the original publication in this journal is cited, in accordance with accepted academic practice. No use, distribution or reproduction is permitted which does not comply with these terms.
*Correspondence: Laehyun Kim, laehyunk@kist.re.kr