 Kathryn Bruchmann
 Subramaniam Vincent2
- 1Department of Psychology, Santa Clara University, Santa Clara, CA, United States
- 2Markkula Center for Applied Ethics, Santa Clara University, Santa Clara, CA, United States
Introduction: Recently, a variety of political bias indicators for social and news media have come to market to alert news consumers to the credibility and political bias of their sources. However, the effects of political bias indicators on how people consume news is unknown. Creators of bias indicators assume people will use the apps and extensions to become less biased news-consumers; however, it is also possible that people would use bias indicators to confirm their previous worldview and become more biased in their perceptions of news.
Methods: Across two studies, we tested how political bias indicators influence perceptions of news articles without partisan bias (Study 1, N = 394) and articles with partisan bias (Study 2, N = 616). Participants read news articles with or without political bias indicators present and rated the articles on their perceived political bias and credibility.
Results: Overall, we found no consistent evidence that bias indicators influence perceptions of credibility or bias in news. However, in Study 2, there was some evidence that participants planned to use bias indicators in the future to become more biased in their future news article selection.
Discussion: These data shed light on the (in) effectiveness of interventions against blindly consuming biased news and media.
Introduction
With the onset of the “Fake News” era and extreme political polarization in the USA, several tools have been developed to spot and mitigate the effects of news bias, such as fact checking websites, apps, and political bias indicators. Political bias indicators tag news articles and social media posts with their political leaning and/or their factual accuracy by using machine learning algorithms to analyze words and images for the purpose of identifying partisan language (Yu et al., 2008). Sites like allsides.com (Allsides, 2021) and mediabiasfactcheck.com (Media Bias/Fact Check, 2021) seek to uncover bias for thousands of articles and sources by providing services where users actively search out information about news sources including political bias while they are reading news. More contemporary are Google Chrome extensions like Nobias.com or TheFactual.com that provide visual labels of article (or source) bias on search results or social media shares before a user has even opened the article. But, there is little information available about how news-consumers actually use these bias indicators. While some may argue that there are clear benefits of transparency with the presence of bias indicators, others question how political bias indicators actually influence the way people read and perceive news articles. The purpose of the present paper is to test if and how the presence of political bias indicators changes readers’ perceptions of news, and to understand how people perceive bias indicators themselves.
Organizations that create bias indicators seem to operate under the assumption that bias indicators help readers correct their own biases, or to become more aware of the political leaning of news media. In effect, they seem to believe that bias indicators might help readers have greater news media literacy; specifically in that they would develop awareness of the political lean of news even if from unfamiliar sources. However, given people’s tendency to seek out and agree with pro-attitudinal and worldview confirming information (e.g., Knobloch-Westerwick and Meng, 2009), it is also possible that bias indicators make people more biased in their perceptions and selection of news media. The present research provided the first exploratory test of whether the presence of bias indicators helps people become more news media literate, or more world-view confirming (or neither) in their perceptions of news.
Bias indicators as news literacy cues
In general, news media literacy is touted as a promising antidote for the spread of misinformation (e.g., Bulger and Davison, 2018; for a review of other strategies to correct misinformation, see Lewandowsky et al., 2012) in part because media literacy has been shown to increase skepticism toward news (Vraga and Tully, 2018). However, developing news media literacy requires effort; specifically, people who are more news literate have knowledge about the content in the news, but also understand how things like news production or personal beliefs can influence the way news is interpreted (Craft et al., 2016). People who have more news literacy also perceive that they are more in control over the influence that media might have on them (Maksl et al., 2013). Presumably, the visual tags of a bias indicator could provide a heuristic cue for readers to help increase their news literacy with little to no effort on their part. As a matter of fact, Nobias describes the need for their product by saying “to make successful decisions [about how valuable information is] one needs to be more skeptical, more vigilant, more rigorous, and invest more labor and time than ever before” (Nobias, 2021).
There is some evidence that this type of news media literacy cue can indeed help people become less susceptible to misinformation. For example, explicitly warning people that they are about to encounter false or biased information can be useful in protecting against persuasion (i.e., “pre-bunking”; Chambers and Zaragoza, 2001; Compton, 2013; van der Linden et al., 2020; Lewandowsky and van der Linden, 2021), but there is evidence that these warnings need to be given repeatedly and be specific about which information specifically is inaccurate (Marsh and Fazio, 2006). One experiment testing perceptions of news articles shared on Facebook found that articles tagged with labels of “disputed” or “rated false” were rated as less accurate than a control (Clayton et al., 2019; see also Bode and Vraga, 2015 col), demonstrating that these kinds of tags can increase scrutiny or skepticism the same way that media literacy might. And, research examining the effectiveness of an intervention created by Facebook giving readers “tips to spot false news” also led to a decrease in perceived accuracy of fake news articles (Guess et al., 2020); regardless of the political leaning of the articles.
Bias indicators as worldview confirming
However, another way that bias indicators might influence people’s perceptions of news is by indicating whether a news article will be worldview confirming– by signaling political beliefs– or not. A myriad of research has examined people’s tendency to seek out pro-attitudinal or worldview-confirming information (for a review, see Knobloch-Westerwick, 2015), particularly in the domain of politics (e.g., Iyengar et al., 2012). One explanation for this type of confirmation bias is people’s political social identity; decades of research suggest that people like and trust political ingroup members more than outgroup members (e.g., Tajfel and Turner, 1979; Byrne, 1997), in part because they view their political ingroup members as sharing moral values (Bruchmann et al., 2018). Other research suggests that it is actually a dislike for the political outgroup more than a like for the political ingroup that could drive these effects (i.e., negative partisanship, e.g., Abramowitz and Webster, 2018).
As such, if people learn that a news article is aligned with their political beliefs it might lead them to like and trust it more, or perhaps finding a news article to be counter to their political beliefs might lead people to like and trust it less. Indeed, research (Slothuus and de Vreese, 2010) has demonstrated that people are more persuaded by political arguments that are ostensibly from political ingroups than outgroups, suggesting that articles tagged in politically consistent ways would be viewed as more credible or persuasive, and corrections to misinformation are more successful at changing opinions when they do not threaten people’s worldview [see Jerit and Zhao (2020) for a review]. Thus, if a bias indicator makes a newsource seem like it will be worldview confirming, it may be viewed as more credible or trustworthy, and people might rate stories marked as biased in their own political direction to be viewed as more credible.
Political ideology1
People’s own political ideology might influence perceptions of news in other ways, as well. While there is some evidence that political ingroup bias is equally likely for liberals and conservatives (Chambers et al., 2013), and liberals and conservatives are equally likely to try to avoid information from the other side (e.g., Frimer et al., 2017), other research suggests that conservatives are more likely to reject counter-attitudinal information than liberals (Fessler et al., 2017).
Additionally, trust in news has decreased for U.S. Americans (Pew Research Center, 2022)– something that many bias-indicator sites are attempting to address– and there is consistent research demonstrating that political conservatives feel much more negatively about news media in general (Pew Research Center, 2020), and view news media to be liberally biased across the board (Mitchell et al., 2020). In fact, research from the Knight Foundation (2020) suggests that almost 70% of Republicans have an unfavorable view of the media, versus only 20% of Democrats.
As such, political bias indicators might influence political liberals versus conservatives differently. It is possible that conservatives might be more influenced by bias indicators, in that they might provide a greater signal of credibility or legitimacy to news; or that they might provide more (less) confidence in worldview-(dis)confirming information. However, because of the mixed findings of previous research, these questions are exploratory.
The present research
The goals of the present research are four-fold. First, we aim to test whether and how political bias indicators influence the way U.S. Americans read and perceive news, and whether partisanship plays a role in this influence. And second, this research will examine how people perceive bias indicators themselves and how people intend to use them as part of their news consumption. Specifically, we asked the following four research questions.
RQ1: Do bias indicators influence how politically biased people perceive news articles to be?
RQ2: Do bias indicators influence how credible people perceive news articles to be?
RQ3: Do people believe that bias indicators are accurate representations of article bias?
RQ4: How do people predict they would use bias indicators in the future?
Across two exploratory experiments, participants who identified as either liberal or conservative read news stories that included bias indicators or not. In Study 1, participants read a neutral news story (as determined by NoBias), and in some cases received a bias indicator label that said it was right-leaning, left-leaning, or center-leaning. After reading, participants rated the credibility and perceived bias of the article. In Study 2, participants read an article that was actually biased either liberally or conservatively (as determined by NoBias), and saw a bias indicator that either indicated the bias (in the direction determined by NoBias), or falsely stated that the article was unbiased. Participants then rated the credibility and political bias of the articles (Studies 1 and 2), their perceptions of the accuracy of bias indicators (Studies 1 and 2), and their intentions of how to use bias indicators in the future (Study 2).
These two experiments allowed for a test between the two competing hypotheses: bias indicators as shortcuts for media literacy, or bias indicators as world-view confirming tools. If bias indicators increase media literacy and add an overarching cue of (il)legitimacy to the articles, we would predict that articles labeled as politically biased (in either direction) would be perceived as less credible than articles labeled as having no bias, or articles without a label. However, if bias indicators are instead used in a worldview confirming way, we predict that partisans would view articles that were biased in the same (opposing) political direction and would view them as more (less) credible.
Study 1
Materials and methods
Participants and design
U.S. American MTurk workers (N = 394) were compensated $2.50 to complete a study called “Perceptions of Journalism.” Participants ranged in ages from 19 to 74 (Mage = 36.8 years, SDage = 16.4 years), and a majority were men (65.2%) and white (76.9%; 9.87% were Black or African-American, 9.64% were Hispanic or Latino, 6.28% were Asian, and less than 2% were other races). Participants’ areas of residence largely followed typical demographic trends in the USA with most participants living in the South (32.2%), the West (30%) followed by the Northeast (22.6%), and the Midwest (22.3%).
Consistent with the US nationwide demographics (Pew Research Center, 2020), more participants identified as Democrat (42.6%) than Republican (33.2%); however, a smaller portion of our sample identified as Independent or Other (25.2%) than in the general population. Because we were interested in whether the bias indicators matched the political ideology of the participants or not, the sample was bifurcated to be liberal (N = 193) or conservative (N = 159). Participants who did not lean right or left (N = 42) were excluded from analyses, leaving a final sample of N = 352.
Both studies were approved by the Santa Clara University human subjects committee (approval number: 19-04-1260). Upon starting the study, participants provided consent, and were randomly assigned to view an article with one of four bias indicators: left-leaning bias, right-leaning bias, center bias, or the no-indicator control.
Materials
Articles
The research team chose three articles covering topics without a current partisan angle to them that were between 600 and 900 words. The three articles were determined to be highly credible and “center-leaning” by the NoBias Google Chrome extension. The Nobias software uses machine learning technology to verify patterns of word usage that match significant phrases and text patterns with those used by liberals and conservatives in order to establish an ideological “slant index” (Gentzkow and Shapiro, 2010). The first article was “Did John Wilkes Booth get away with murdering President Abraham Lincoln?” from The Philadelphia Inquirer (Colimore, 2019). The other two articles were “South Florida, in effort to save tourism industry, may spend millions to remove seaweed invading beaches” from Fox News and “Rates are low, and mortgages are cheap. So why aren’t Americans buying more homes?” from CNN (Shirazi, 2019; Tappe, 2019). In order to control for perceptions of source familiarity, credibility, or bias, the research team re-formatted all articles to appear to be shared by the Quad City Times, a center-leaning (per analysis of MediaBias/FactCheck, The Factual, and NoBias) and small regional news source in the upper Midwestern United States.
Bias indicators
Each article (aside from the control group) included a bias indicator label. These were created by using images of bias indicators from NoBias.com. The image included a paw print colored with either red (leans right), blue (leans left) or purple (leans center), and written information about the political slant of the article (leans left, leans right, leans center) and of the source (labeled as ‘‘very credible’’ for all conditions).2 The bias indicators were displayed three times on each article: at the top, in the middle, and at the bottom of the article. See Figure 1 for example bias indicators. The control condition did not contain any bias indicators.
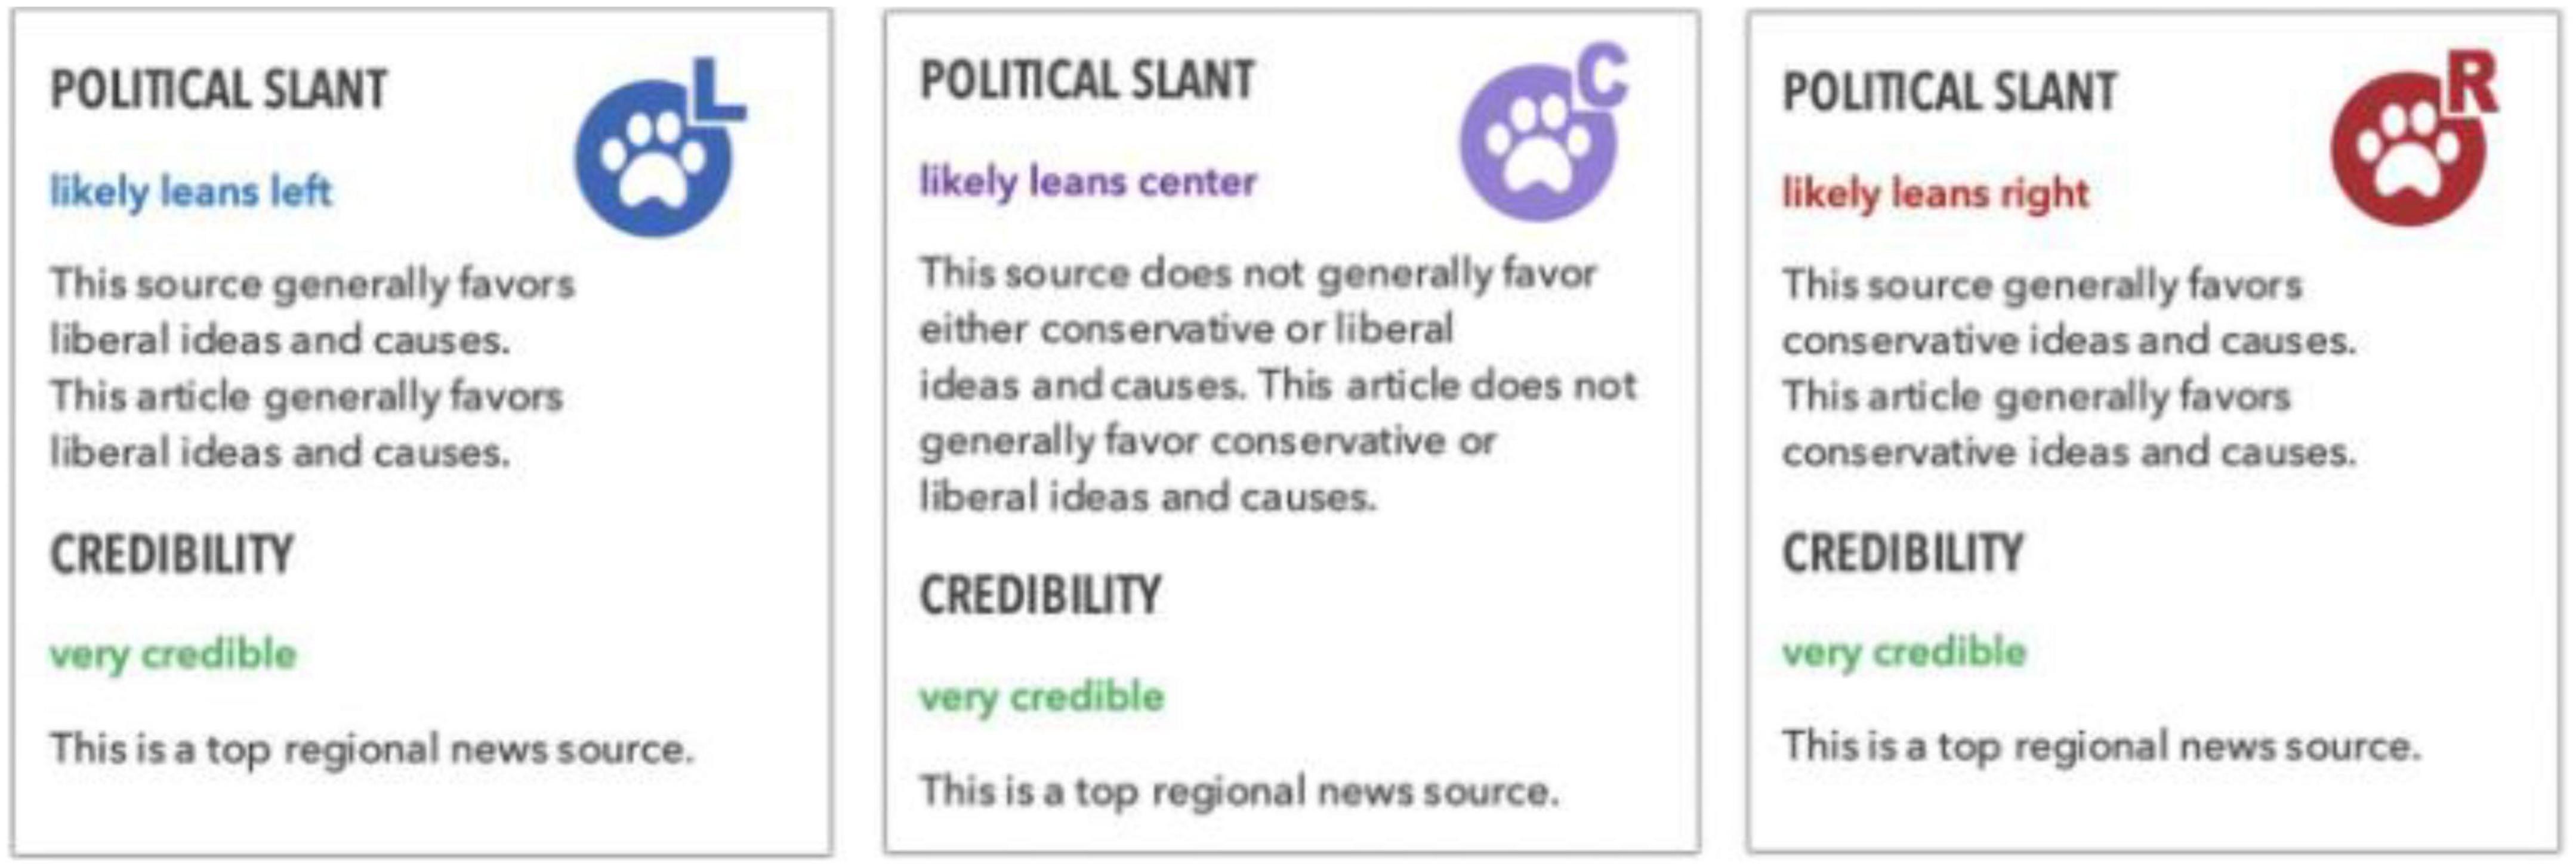
Figure 1. Sample bias indicators used in Study 1 and 2. Reproduced with the permission of NoBias, LLC.
Procedure
First, participants read instructions asking them to examine how “political bias indicators” on websites can influence perceptions of news articles. They saw sample bias indicators in order to learn what the symbols meant, and learned they would be reading articles and answering questions about what they read. Then, participants read one of the articles with (or without, for control) the No Bias indicator images.
Article questions
In line with the cover story, after finishing the news article, participants answered multiple choice questions that tested their comprehension or memory of the article (e.g., “Where does the Miami-Dade Parks, Recreation, and Open Spaces Department move excess seaweed?”), and provided their impression of the article (e.g., “How interesting did you find this article?” 1 = not at all, 7 = very interesting). Participants also indicated how familiar they were with the news source, the Quad City Times (1 = not at all, 7 = extremely).
Dependent measures
Next, participants rated how politically biased they believed the article to be (1 = not at all biased, 7 = extremely biased), and in which direction they believed the bias to be (1 = very conservatively biased, 7 = very liberally biased). Then, participants rated how credible they believed the article and source to be (1 = not at all credible, 7 = very credible; credibility responses were aggregated to form a composite, a = 0.81). Participants also indicated how accurate they thought the bias indicator was (1 = not at all accurate, 7 = extremely accurate). Participants then responded to a number of exploratory questions about the bias indicators that are not reported here.
Finally, participants provided demographic data including their political identity and were debriefed.
Results
In order to conduct our primary analyses, we collapsed across news article conditions3 and conducted a series of 2 (participant political ideology: liberal, conservative) × 4 (bias indicator: control, left, center, right) ANOVAs. See Table 1 for means and SDs of all dependent variables across experimental conditions and political ideology.
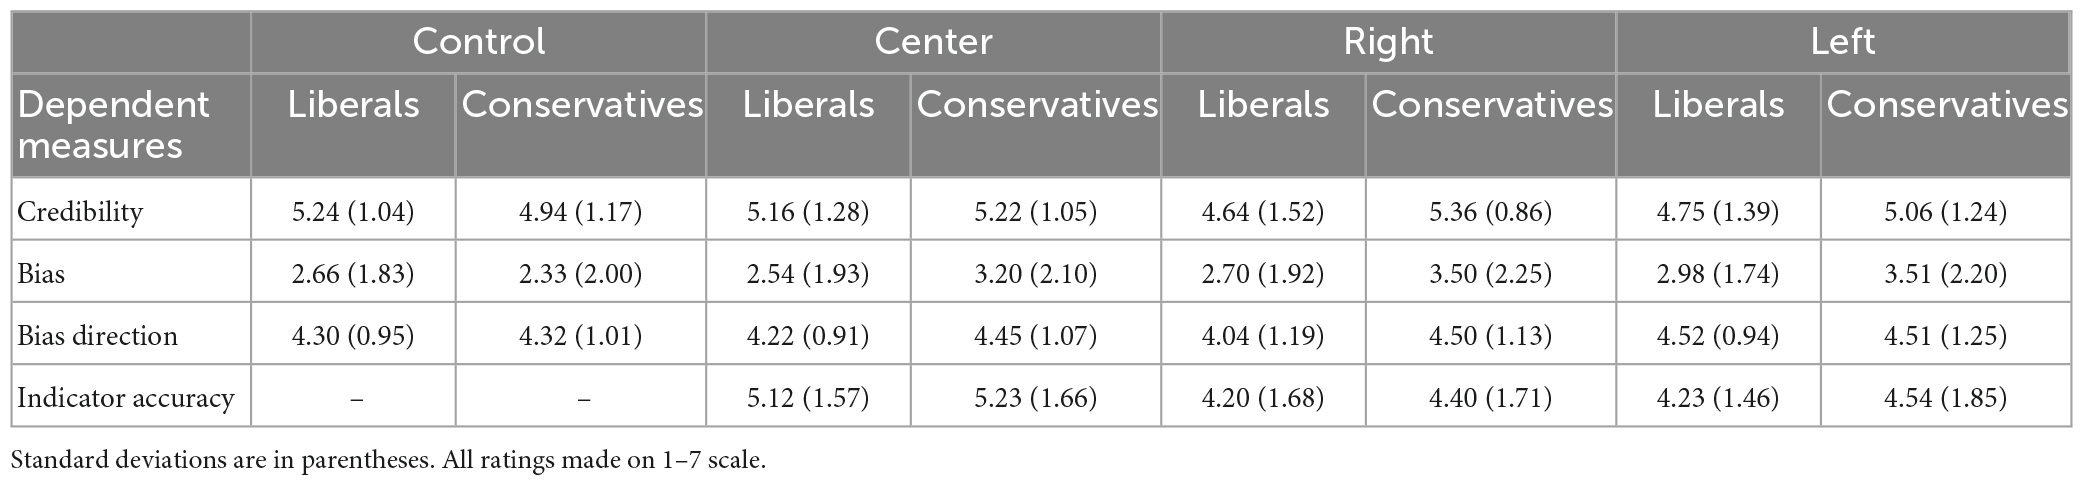
Table 1. Study 1 means and standard deviations across bias indicator conditions and participant political ideology.
RQ1: Do bias indicators influence how politically biased people perceive articles to be?
No, there was no effect of the bias indicator condition, F < 1, on participants’ perceptions of the bias of the article, nor was there a bias indicator x participant political ideology interaction, F < 1. Additionally, there was no significant effect of bias indicators on the perceived direction of bias, F < 1. There was not a significant effect of participant politics, F(1,341) = 2.26, p = 0.134, ηp2 = 0.007; nor was there a significant politics x bias interaction, F < 1. While this finding could suggest that our bias indicator manipulation may not have been effective, it also could point to the fact that the articles we chose were, indeed, not-biased, and that the readers were picking up on that even with the bias indicators.
RQ2: Do bias indicators influence how credible participants perceived the articles to be?
It depends on political identity. There was a political ideology × bias indicator interaction on participants’ credibility ratings, F(3,344) = 4.09, p = 0.042, ηp2 = 0.023. Simple effects tests suggest that for conservatives, there was not a significant main effect of bias indicator condition, F(3,344) = 1.19, p = 0.316, ηp2 = 0.022. For liberals, however, there was a marginal effect of the bias indicator, F(3,344) = 2.45, p = 0.065, ηp2 = 0.037. Post hoc comparisons suggest that, in line with the world-view confirming hypothesis, articles with right-leaning indicators were viewed as less credible than the control (p = 0.026), and marginally less credible than those with left-leaning indicators (p = 0.056) or center-leaning indicators (p = 0.069). Neither the main effect of participants’ political ideology F(1,344) = 2.37, p = 0.124, ηp2 = 0.007, nor of the bias indicator, F(3,344) = 0.86, p = 0.460, ηp2 = 0.007 were significant. Overall, people found the articles to be credible, M = 4.97, SD = 1.24; a one-sample t-test revealed that participants rated the articles to be more credible than the midpoint of the scale (4), t(393) = 15.58, p < 0.001, d = 1.24.
RQ3: Do people believe that the bias indicator is an accurate representation of the article bias?
Maybe. There was a main effect of the bias indicator condition on how accurate the participants perceived the bias indicator to be, F(1,249) = 7.08, p = 0.001, ηp2 = 0.054. Participants in the center-leaning condition (M = 5.12, SD = 1.57) thought the indicator was more accurate than those in the right-leaning condition (M = 4.29, SD = 1.69, p = 0.001) and the left-leaning condition (M = 4.35, SD = 1.63, p = 0.001). As the articles we selected were all considered “center-leaning” (or unbiased), this result suggests that the participants were more likely to believe the bias indicator was accurate when it actually was presenting factually correct information. There was no significant effect of participant political ideology, F(1,249) = 1.00, p = 0.318, ηp2 = 0.004, or interaction, F < 1, on perceived accuracy of the bias indicator.
Discussion
Overall, Study 1 did not provide much evidence that bias indicators actually influenced the way that people read or perceive news articles. The one exception is that there was evidence in support of the worldview-confirming hypothesis, but unexpectedly only for liberal participants; they reported that articles labeled as biased (especially right-leaning) were less credible. We also saw evidence that conservative participants believed articles to have more political bias regardless of condition, consistent with the national trends that Republicans have higher distrust of the media, overall (Pew Research Center, 2020). The most notable effects found in Study 1, however, were that people seemed to feel that bias indicators themselves were less accurate when they suggested the articles were politically biased. Because the articles we chose were, in fact, center-leaning according to the bias indicators, our participants correctly identified the “center-leaning” bias indicator as being more accurate than the others. This suggests that people might not actually need a bias indicator to know when news is unbiased; however, because all articles were actually center-leaning, we do not know whether bias indicators would be important for interpreting actually left or right-leaning articles. Additionally, because our study was underpowered, it is possible that bias indicators do have a small effect on perceptions of news that we were not able to capture.
Study 2
Overview
The goal of Study 2 was to test how bias indicators influence the way people read and perceive news articles that actually contain political bias. Study 1 used unbiased articles, and participants accurately did not perceive the articles labeled as biased to contain political bias (more than the center-leaning or control), nor did they perceive the bias indicators to be accurate if they signified bias. As such, it is important to test whether bias indicators are more persuasive or believable to readers when the articles actually contain a political slant. In Study 2, participants read one of two articles on the same partisan topic that were either right or left-leaning, and were told that the articles were either biased (correct information) or not (incorrect information) before rating the credibility of the article, and their perceptions of the indicators themselves. A secondary goal of Study 2 was to examine how people believe they would use bias indicators in the future. Finally, Study 2 improved upon Study 1 by increasing statistical power and improving sample size.
Materials and methods
Participants and design
U.S. American MTurk workers (N = 580) were recruited via Cloud Research and compensated $2.50. We specifically recruited participants who were pre-screened as Democrats or Republicans in an attempt to capture people whose ideologies leaned left or right, and to avoid losing as many participants as we did in Study 1. An a priori power analysis (Faul et al., 2007) assuming a small effect size (as determined by Study 1), determined that a total sample size of N = 432 was needed to achieve 80% power. Because in Study 1 our sample leaned liberal and we lost several participants for not having a political leaning, we recruited additional participants to compensate. Participants ranged in ages from 19 to 78 (Mage = 38.44 years, SDage = 12.08 years), and were majority male (63.9%) and white (75.00%; 16.20% were Black or African-American, 9.64% were Hispanic or Latino, 5.68% were Asian, and less than 2% were other races). Participants’ areas of residence largely followed typical demographic trends in the USA with most participants living in the South (25.9%), the West (17.8%) followed by the Midwest (16.6%), East Coast (15.4%), and the Mountain region (4.6%). Inconsistent with the nationwide demographics (Pew Research Center, 2020), more participants identified as Republican (43.8%) than Democrat (36.7%). Despite specifically recruiting participants who had previously self-identified as Democrats or Republicans, a significant portion of our sample identified as Independent or Other (19.5%). As in Study 1, we bifurcated the political ideology of participants in order to include those who identified as Independent (N = 263 liberals, N = 270 conservatives) and dropped participants who identified as neither (N = 83), leaving a total sample of 533.
Most participants (64.3%) reported not having previous experience with bias indicators. Upon starting the study, participants were randomly assigned to one of six conditions in a 2 (Actual Bias: left, right) × 3 (Bias Indicator: control, center, biased) between-subjects design.
Materials
Articles
In Study 2, the research team selected articles on partisan topics; each was about 600 words long. The research team found one left-leaning and one right-leaning article (according to the NoBias chrome extension) on each of three political topics: The visit of Kent State’s “Gun Girl” to Ohio University (Rahman, 2020; Wallace, 2020), the Arizona supreme court case regarding businesses refusing to serve same-sex couples (NBC Universal News Group, 2019; Parke, 2019), and the Louisiana “heartbeat” bill struck down by the state supreme court (Berry, 2019; Borter and Dobuzinskis, 2019). As in Study 1, news articles were re-formatted to reflect the Quad City Times, a center-leaning, small, Midwestern regional news source, to standardize the effects of the source of the articles.
Bias indicators
The bias indicator manipulation was included in the margins at 3 points on each of the articles for participants not in the control condition. The bias indicators either indicated that the article was center-leaning, or that the article leaned left or right (whatever the true lean of the article was). In other words, participants in the bias condition saw the actual bias associated with the article.
Procedure
The procedure was largely the same as in Study 1. First, participants read their assigned article and answered 4 multiple choice questions as part of the cover story testing their comprehension of the articles. These questions were the same across both the left and right versions of each article; and were broad enough that they could be answered by both articles. Next, participants responded to the same questions about the political bias and credibility of the articles and source as in Study 1 (1 = not at all, 7 = extremely; a = 0.88).
Perceptions of bias indicators
Participants who received bias indicators also rated how accurate they thought the bias indicator was, and whether the indicators made the article seem more credible (1 = not at all, 7 = extremely).
As in Study 1, participants also responded to several exploratory questions about bias indicators that are not discussed here.
Behavioral intentions
Participants also rated their likelihood of choosing a center, right, or left-leaning article if they were to use a bias indicator in the future (1 = not at all, 7 = extremely).
Results
To conduct our primary analyses, we collapsed across news article topic conditions4 and conducted a series of 2 (participant’s political ideology: liberal, conservative) × 2 (actual bias: left, right) × 3 (bias indicator: control, center, biased) ANOVAs. See Table 2 for means and SDs of all variables across experimental conditions and political ideology.
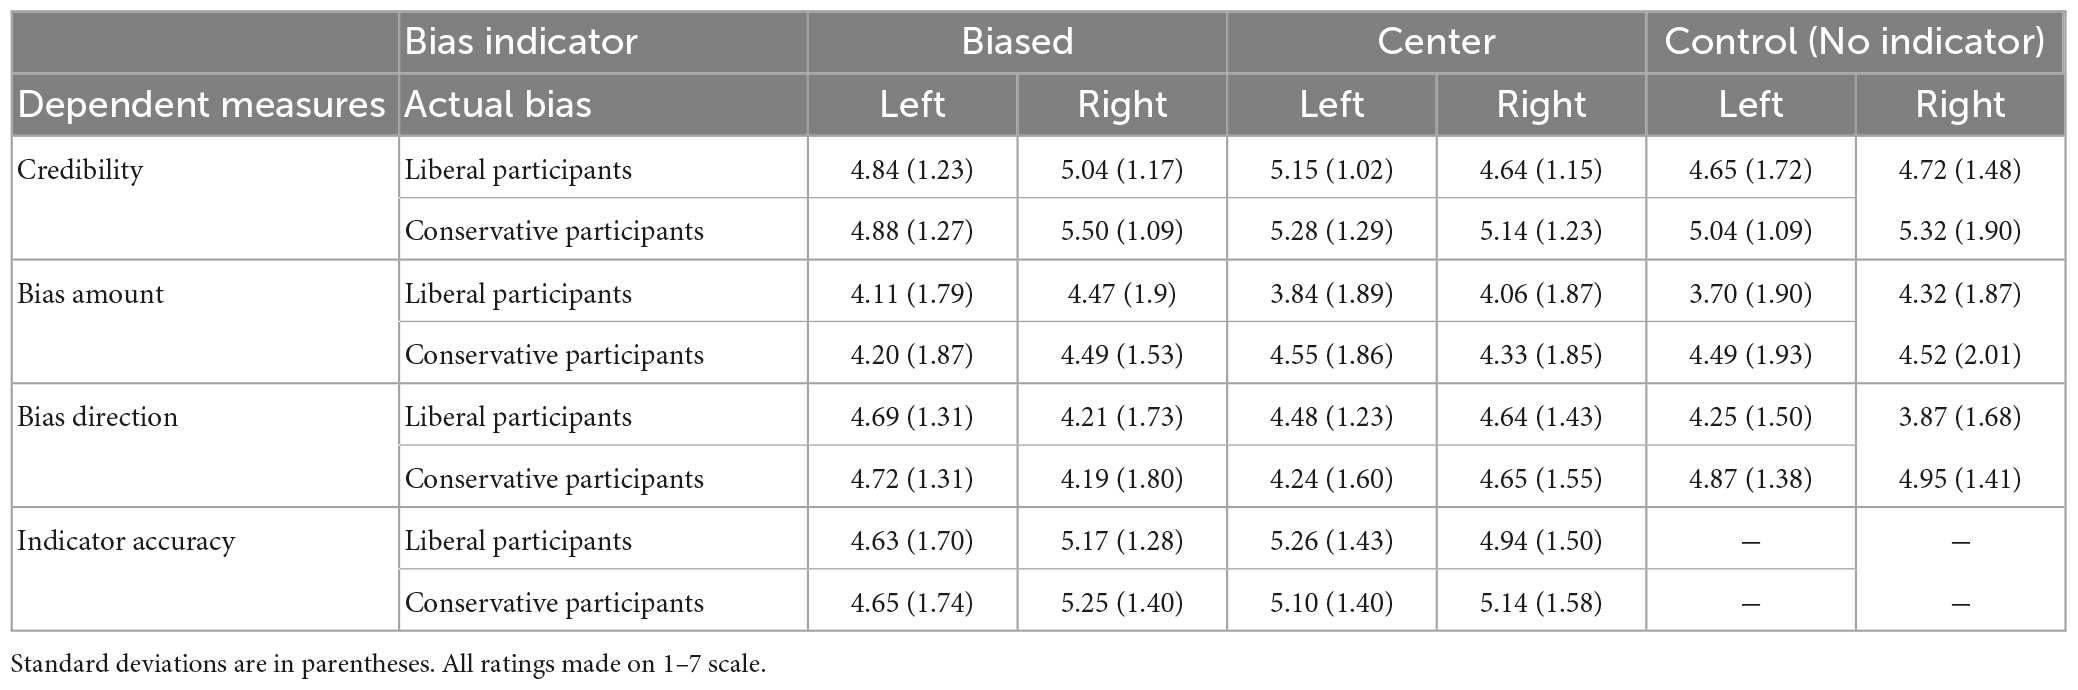
Table 2. Study 2 means and standard deviations of dependent measures across bias indicator and political conditions.
RQ1: Do bias indicators influence how politically biased people perceive articles to be?
No. Only participant political ideology predicted perceptions of bias, F(1,521) = 4.50, p = 0.034, ηp2 = 0.009. Consistent with national trends, conservatives (M = 4.41, SD = 1.82) perceived more bias in the articles than liberals (M = 4.06, SD = 1.87), overall, regardless of whether bias indicators were present.
However, there were effects of the bias indicator on which type of political bias people perceived. Specifically there was a bias indicator x participant politics interaction, F(2,509) = 5.12, p = 0.006, ηp2 = 0.02. Liberal participants perceived the control articles (M = 4.05, SD = 1.60) to be more conservatively biased than those with a center-leaning label (M = 4.54, SD = 1.34; p = 0.029). Conservative participants perceived the control articles (M = 4.91, SD = 1.39) to be more liberally biased than those with biased labels (M = 4.45, SD = 1.59; p = 0.038).
RQ2: Do bias indicators influence how credible participants viewed the articles?
Maybe. There was not a main effect of bias indicator on perceptions of credibility, F < 1; however, there was a significant bias indicator x actual bias interaction, F(2,521) = 4.15, p = 0.016, ηp2 = 0.016. In line with the media literacy hypothesis, simple effects tests revealed that for participants who viewed left-leaning articles, there was a main effect of bias indicator, F(2,310) = 2.98, p = 0.052, ηp2 = 0.019, such that they found the articles more credible when they had a center-leaning indicator (M = 5.19, SD = 1.11) than biased (M = 4.86, SD = 1.25; p = 0.046) or control (M = 4.84, SD = 1.14; p = 0.029). There was no effect of bias indicator for participants who viewed the right-leaning articles, F(2,303) = 1.68, p = 0.189, ηp2 = 0.011. As in Study 1, there was also a main effect of participants’ political ideology on perceptions of credibility, F(1,521) = 11.20, p = 0.001, ηp2 = 0.021. However, in this case, conservative participants perceived more credibility (M = 5.19, SD = 1.18) than liberals (M = 4.86, SD = 1.21). No other main effects or interactions were significant.
RQ3: Do people believe that the bias indicator is an accurate representation of the article bias?
Maybe. Overall, participants who received bias indicators rated them as more accurate (M = 4.99, SD = 1.53) than the midpoint of the scale (4), t(414) = 66.49, p < 0.001, d = 1.53. However, the perceived accuracy depended on the actual bias of the article. That is, there was a bias indicator x actual bias interaction on perceptions of accuracy, F(1,355) = 4.67, p = 0.031, ηp2 = 0.013. Simple effect tests indicated that, among participants who viewed the left-leaning articles, there was a main effect of bias indicator, F(1,213) = 9.21, p = 0.003, ηp2 = 0.041, such that articles with the center-leaning indicator (M = 5.22, SD = 1.43) were viewed as more accurate than those with the left-leaning bias indicator (M = 4.56, SD = 1.72). For participants who viewed the right-leaning article, there was not an effect of bias indicator on perceptions of accuracy, F < 1.
RQ4: How do people predict they would use bias indicators in the future?
In order to test what types of articles people predicted they would use a bias indicator to choose in the future, we conducted a 3 (Choice: left, center, right) × 2 (Participant Partisanship: liberal, conservative) Repeated Measures ANOVA where choice was within-subjects and politics was between-subjects. There was a main effect of choice, F(2,722) = 23.83, p < 0.001, ηp2 = 0.062, such that participants reported a greater likelihood of choosing center-leaning articles (M = 5.13, SD = 1.62) than left-leaning articles (M = 4.31, SD = 1.91, p < 0.001) and right-leaning articles (M = 4.47, SD = 1.97, p < 0.001). However, a significant choice x politics interaction also emerged, F(2,722) = 29.21, p < 0.001, ηp2 = 0.075; See Figure 2.
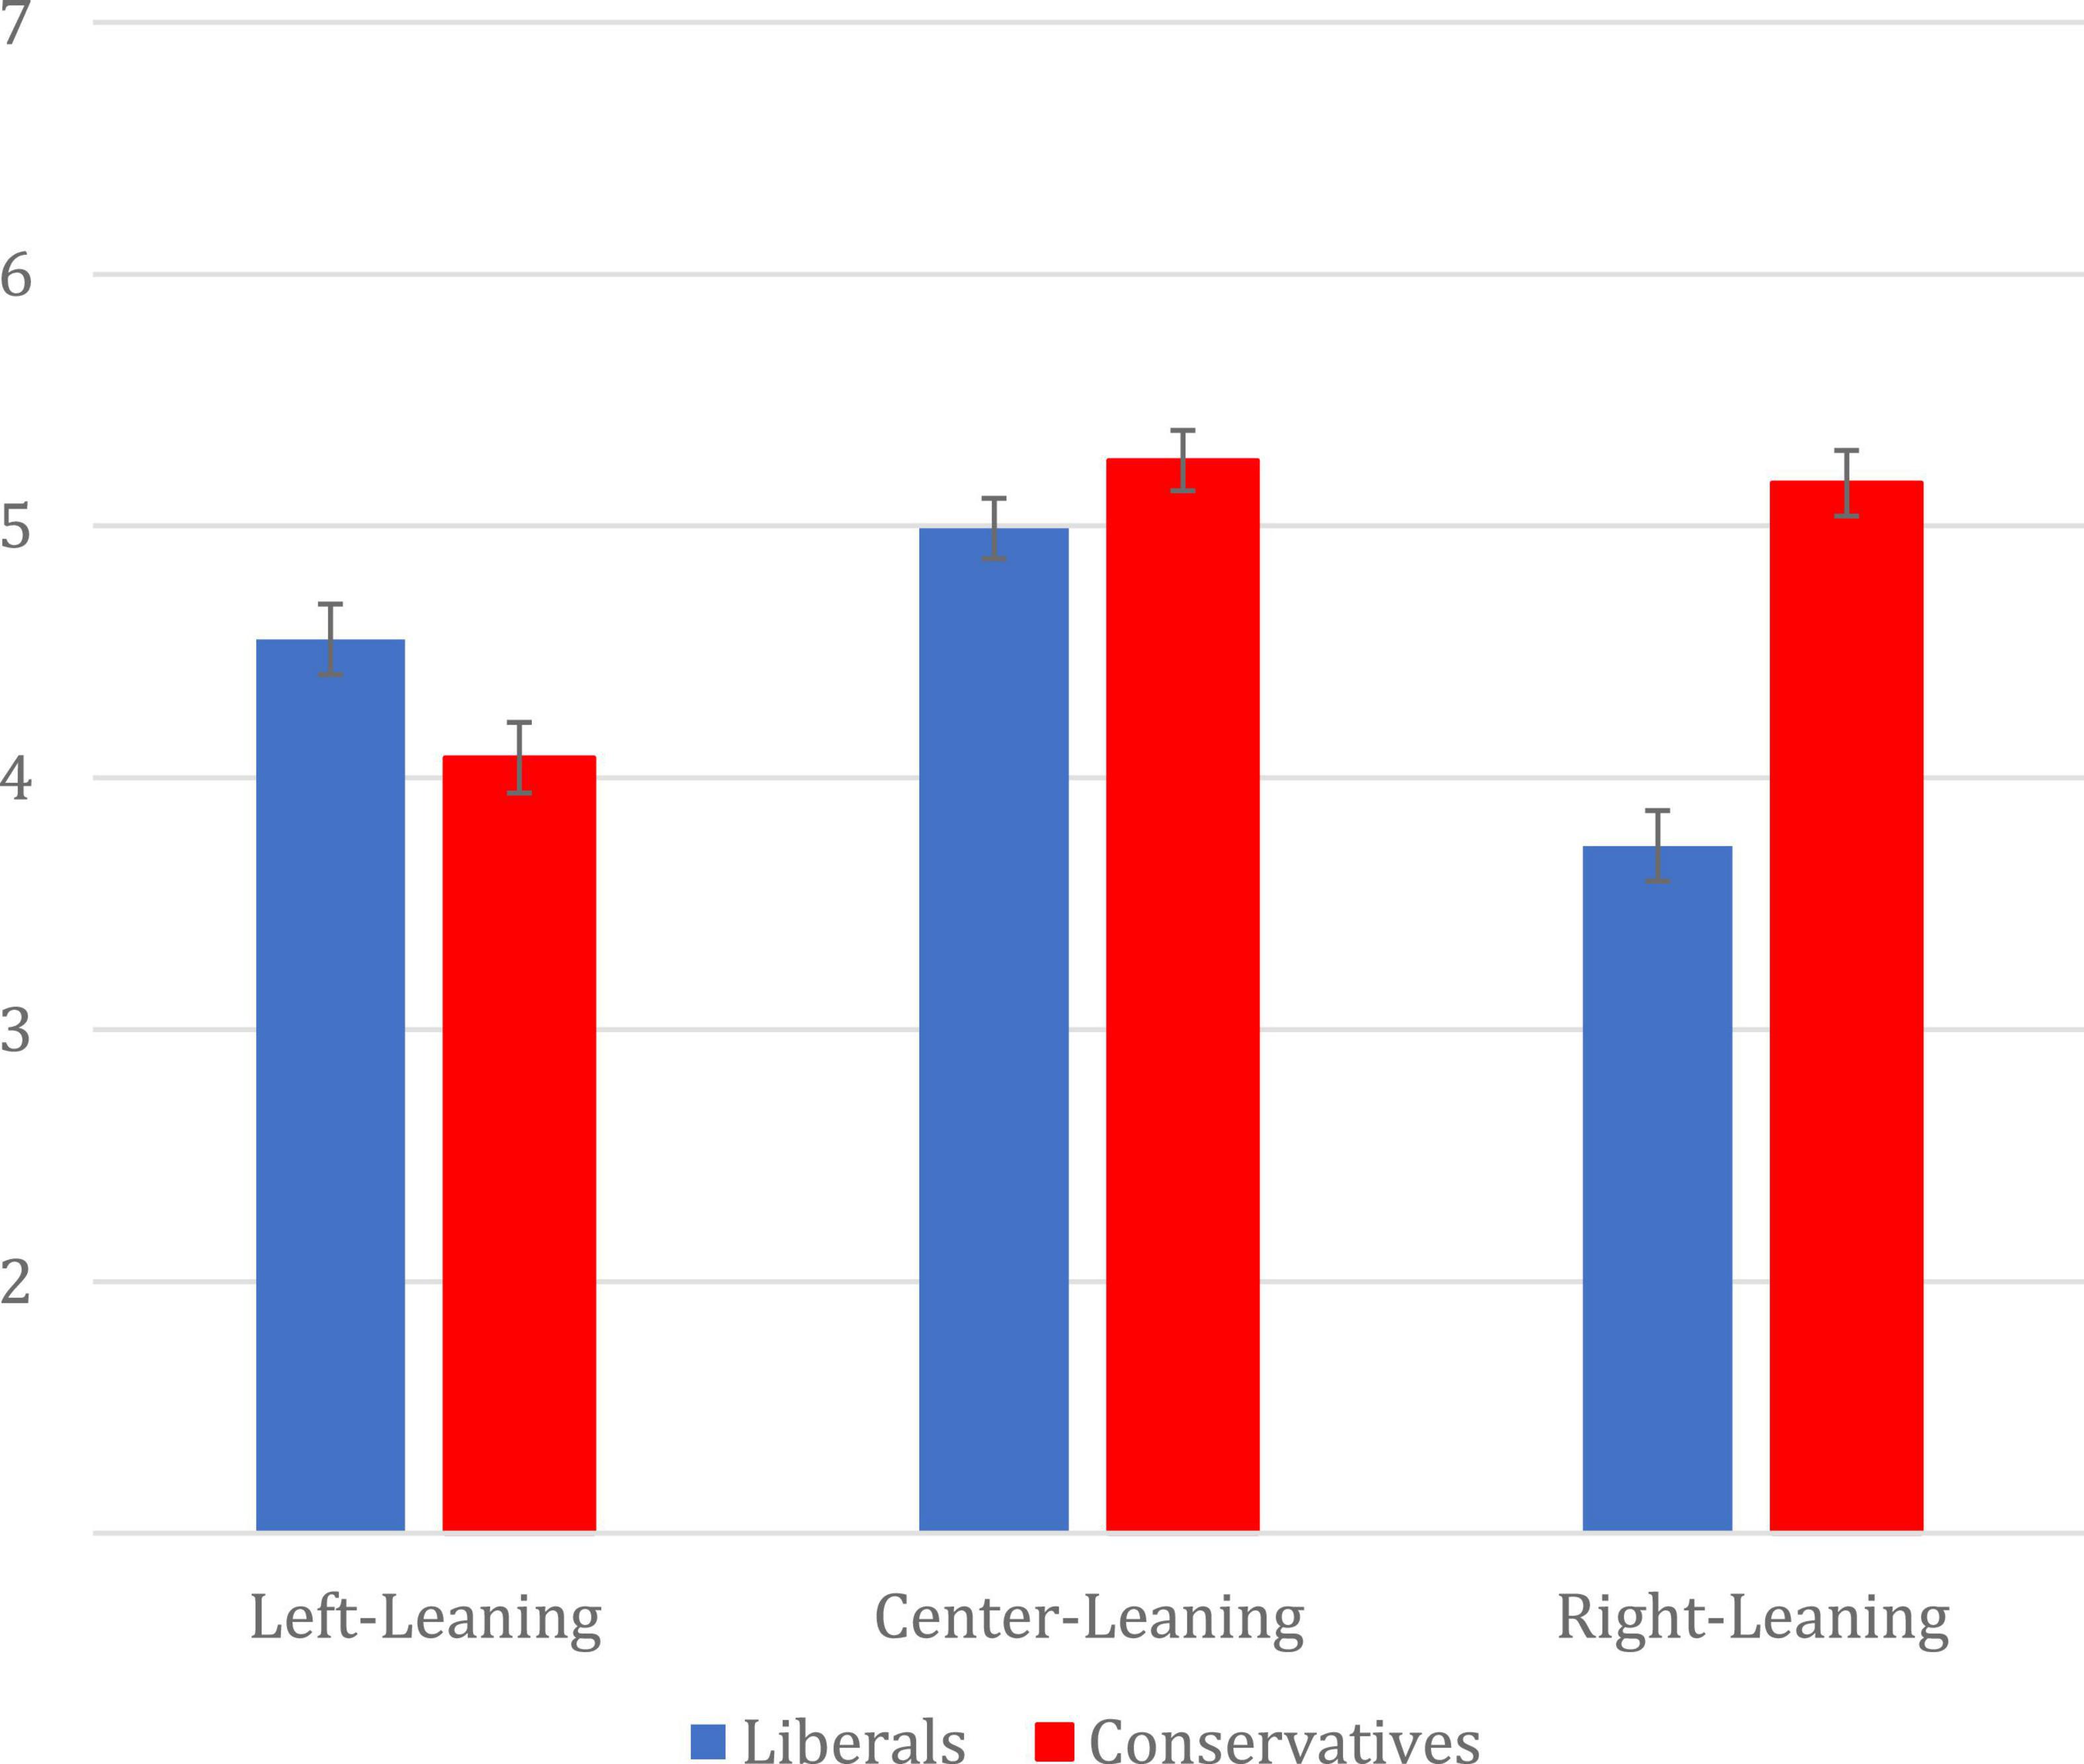
Figure 2. Mean likelihood ratings of choosing left, center, or right-leaning articles by political ideology. Error bars represent standard error.
Simple effects tests reveal that for liberals, there was a main effect of Choice, F(2,350) = 24.31, p < 0.001, ηp2 = 0.122. Post hoc comparisons reveal that liberals reported being more likely to choose a center-leaning article (M = 4.99, SD = 1.69) than a left-leaning (M = 4.55, SD = 1.69, p = 0.008), or right-leaning (M = 3.73, SD = 2.03, p < 0.001). However, they were also more likely to report wanting to choose a left-leaning article over a right-leaning article (p < 0.001). For conservatives there was also a main effect of Choice, F(2,372) = 28.92, p < 0.001, ηp2 = 0.135, such that they reported being more likely to choose a center-leaning (M = 5.26, SD = 1.55) or right-leaning (M = 5.17, SD = 1.64) than a left-leaning (M = 4.08, SD = 2.08, ps < 0.001). These findings are consistent with the world-view confirming hypothesis; both liberals and conservatives reported they would be more likely to use a bias indicator to choose an article that leaned in their political direction than one that opposed.
Discussion
Study 2 provided more evidence that bias indicators do not generally influence the way that people perceive news articles. One exception is that left-leaning articles were considered to be more credible when they were described as being “center-leaning” versus left-biased or not including a bias indicator. This finding is consistent with the media-literacy hypothesis that describing something as biased makes it seem less credible.
Like in Study 1, we see some evidence that people didn’t believe the bias indicator; it was considered most believable for people in the “center-leaning” condition. Because the articles chosen for this study actually did contain bias, this was unexpected.
Notably, we also saw evidence that participants thought they would use bias indicators in the future in a worldview-confirming way. That is, people reported that they would be less likely to use bias indicators in the future to seek out counter-attitudinal news (and “balance” their media diet, as bias indicator sites suggest), and would instead be more likely to choose center-leaning or pro-attitudinal news pieces.
General discussion
Across two experiments, we tested whether bias indicators influence readers’ perceptions of news. Study 1, tested how bias indicators affect perceptions of center-leaning articles, while Study 2 tested how bias indicators affect perceptions of actually biased articles. Across both studies, we saw little to no evidence that bias indicators actually change how people read or perceive articles, though they do affect other associated behavioral factors.
We saw some slight evidence that liberals view conservative-labeled (i.e., right-leaning) pieces as less credible, consistent with a worldview-confirming hypothesis, but we also saw some slight evidence that people view liberal-leaning articles as more credible when labeled as leaning center, consistent with the framing hypothesis. Neither result was consistent across both studies, suggesting that actual political bias (or lack thereof) may be more influential to readers’ perceptions than bias indicators.
Notably, in Study 2, people reported that they would be more likely to use bias indicators in the future to choose center-leaning or pro-attitudinal articles, consistent with the worldview-confirming hypothesis. While this finding did not suggest that bias indicators actually influence how people read or perceive news, it does suggest that it might influence how people choose the news they read, and not how bias indicator creators assume. While most bias indicator companies develop their products to reduce media bias or help people have a more balanced “media-diet,” this data suggests that instead, U.S. Americans might be motivated to use bias indicators in order to become more biased and increase their selective partisan exposure (e.g., Arendt et al., 2019). Future research should examine how bias indicators influence article choices in this way. Allowing participants to freely select which articles to read would increase ecological validity by more closely mirroring the functionality of bias indicators in the real world.
Limitations
Our work is not without limitations. First is our convenient MTurk sample; there has been a significant decrease in quality participants from MTurk in recent years (see Chmielewski and Kucker, 2020), namely, in that they do not pay close attention to the studies they are participating in. Future research would ideally be performed in a lab setting to offer more control. While doing so would encourage a more focused environment, it is important to acknowledge that real news consumers also may not be highly focused while scrolling through headlines and viewing the indicators.
Additionally, the articles that were chosen in both studies were real articles, which means that we sacrificed experimental control over what the participants read in favor of more external validity. While we relied on the NoBias algorithm to determine the political slant of the articles, future research should pre-test articles with participants to ensure they are perceived as neutral or biased.
Additionally, while the articles we chose had topics still relevant to the time period we ran participants in, they were not necessarily as recent as news would be on an active news media site, and we did not capture measures of personal involvement with or familiarity with the different topics. Also, we purposefully chose articles that did not have broad national coverage with hopes that our participants did not have pre-existing attitudes about the stories. As a result of both of these factors, participants may not have been as engaged in the articles chosen as if they were breaking news or more nationally relevant. Future research should test whether and how these factors influence the use and effects of bias indicators.
Another limitation of our work was that we only included liberals and conservatives in our sample, and not moderates. Our primary interest was on how U.S. partisans respond to bias indicators that either matched their political perspective or not, in line with the goals of many bias indicator apps and sites. However, including moderates in future studies could provide insights about the types of media they typically consume and whether they use bias indicators differently than partisans. Presumably, moderates would be more motivated to focus on center-leaning news, or to expose themselves to a balance of left- and right-leaning sources.
Conclusion
Political bias indicators for news sites and articles are being designed as a response situated in the U.S. American news literacy movement. However, the present studies provide initial evidence that political bias indicators might not be having the intended effects. The present data suggests that, at best, bias indicators do not actually influence people’s perceptions of news media, and at worst, they might actually increase people’s exposure to biased news sources. This preliminary evidence suggests that political bias indicator sites or extensions may not predictably drive users to become less biased in their consumption of news; in fact, they may be counterproductive, which would become an ethical concern for bias indicator design. Organizations that make bias indicators may opt to provide more transparency about not only the purpose of these products, but the observed effects. For example, showing users data about how they used the bias indicator tools (e.g., did they read more articles that leaned left, right, or center) might help people realize their biased behaviors. While more work needs to be done to understand these effects, initiatives interested in creating bias indicators or other interventions that signal media-bias should take these studies into account when designing and implementing their tools.
Data availability statement
The raw data supporting the conclusions of this article will be made available by the authors, without undue reservation.
Ethics statement
The studies involving human participants were reviewed and approved by the Santa Clara University IRB. The patients/participants provided their written informed consent to participate in this study.
Author contributions
KB organized the data. KB and AF performed the statistical analysis and wrote the first draft of the manuscript. All authors contributed to conception and design of the study, manuscript revision, read, and approved the submitted version.
Funding
This work was supported by funding from NoBias, LLC, a New York-based startup developing bias indicators for political and financial news through browser extensions. This work was also supported through a publication grant from Santa Clara University.
Acknowledgments
We thank the RAs in the Social Comparison and Cognition lab group for piloting these studies, and especially to Rosie Dillon for help with formatting references. We would also like to thank Glenn Baker for providing feedback on drafts of this manuscript.
Conflict of interest
The authors declare that this study received funding from NoBias, LLC. The funder was not involved in the study design, collection, analysis, interpretation of data, the writing of this article, or the decision to submit it for publication.
Publisher’s note
All claims expressed in this article are solely those of the authors and do not necessarily represent those of their affiliated organizations, or those of the publisher, the editors and the reviewers. Any product that may be evaluated in this article, or claim that may be made by its manufacturer, is not guaranteed or endorsed by the publisher.
Footnotes
- ^ We will use the terms “liberal” and “conservative,” as well as “political ideology” and “political beliefs” throughout this manuscript when describing our own study and hypotheses; but might describe “Democrats” and “Republicans” when describing other research or our participants’ self-identified group membership. We recognize that examining political ideology instead of identity or partisanship might lead to more variability in the data (as “liberals” and “conservatives” are not monolithic groups with a single set of beliefs or identities), but political bias indicators examine an ideological slant in news more so than categorizing news as being “Republican” or “Democrat.”
- ^ The source credibility was held constant across articles in order to explicitly test how bias indicators of the articles themselves influenced perceptions of the articles.
- ^ While the articles were rated slightly differently on items like interest, the article variable did not interact with our main variables of interest.
- ^ As in Study 1, the news topic conditions did not interact with any of our variables of interest.
References
Abramowitz, A. I., and Webster, S. W. (2018). Negative partisanship: why Americans dislike parties but behave like rabid partisans. Polit. Psychol. 39, 119–135. doi: 10.1111/pops.12479
Allsides (2021). AllSides media bias chart. Media Bias. Available online at: https://www.allsides.com/media-bias/media-bias-chart (accessed July 28, 2021).
Arendt, F., Northrup, T., and Camaj, L. (2019). Selective exposure and news media brands: implicit and explicit attitudes as predictors of news choice. Media Psychol. 22, 526–543. doi: 10.1080/15213269.2017.1338963
Berry, D. S. (2019). Louisiana democrat gov. john bel edwards signs ‘Heartbeat’ bill into law. breitbart. Available online at: https://www.breitbart.com/politics/2019/05/30/louisiana-democrat-gov-john-bel-edwards-signs-heartbeat-abortion-ban-into-law/ (accessed May 30, 2019).
Bode, L., and Vraga, E. K. (2015). In related news, that was wrong: the correction of misinformation through related stories functionality in social media. J. Commun. 65, 619–638. doi: 10.1111/jcom.12166
Borter, G., and Dobuzinskis, A. (2019). Louisiana governor to sign ‘Heartbeat’ ban, latest move to CURB U.S. abortion rights. Reuters. Available online at: https://www.reuters.com/article/us-usa-abortion/louisiana-governor-to-sign-heartbeat-ban-latest-move-to-curb-u-s-abortion-rights-idUSKCN1SZ2I8 (accessed May 29, 2019).
Bruchmann, K., Koopmann-Holm, B., and Scherer, A. (2018). Seeing beyond political affiliations: the mediating role of perceived moral foundations on the partisan similarity-liking effect. PLoS One 13:e0202101. doi: 10.1371/journal.pone.0202101
Bulger, M., and Davison, P. (2018). The promises, challenges, and futures of media literacy. J. Media Literacy Educ. 10, 1–21. doi: 10.23860/JMLE-2018-10-1-1
Byrne, D. (1997). An overview (and underview) of research and theory within the attraction paradigm. J. Soc. Pers. Relationsh. 14, 417–431. doi: 10.1177/0265407597143008
Chambers, J. R., Schlenker, B. R., and Collisson, B. (2013). Ideology and prejudice: the role of value conflicts. Psychol. Sci. 24, 140–149. doi: 10.1177/0956797612447820
Chambers, K. L., and Zaragoza, M. S. (2001). Intended and unintended effects of explicit warnings on eyewitness suggestibility: evidence from source identification tests. Mem. Cogn. 29, 1120–1129. doi: 10.3758/BF03206381
Chmielewski, M., and Kucker, S. C. (2020). An MTurk crisis? Shifts in data quality and the impact on study results. Soc. Psychol. Pers. Sci. 11, 464–473. doi: 10.1177/1948550619875149
Clayton, K., Blair, S., Busam, J. A., Forstner, S., Glance, J., Green, G., et al. (2019). Real solutions for fake news? Measuring the effectiveness of general warnings and fact-check tags in reducing beliefs in false stories on social media. Polit. Behav. 42, 1073–1095. doi: 10.1007/s11109-019-09533-0
Colimore, E. (2019). Did John Wilkes booth get away with murdering President Abraham Lincoln? Philadelphia Inquirer. Available online at: https://www.inquirer.com/news/john-wilkes-booth-lincoln-conspiracy-photo-recognition-20190415.html (accessed April 15, 2019).
Compton, J. (2013). “Inoculation theory,” in The SAGE handbook of persuasion: developments in theory and practice, 2nd Edn, eds J. P. Dillard and L. Shen (Thousand Oaks, CA: SAGE Publications), 220–236. doi: 10.4135/9781452218410
Craft, S., Ashley, S., and Maksl, A. (2016). Elements of news literacy: a focus group study of how teenagers define news and why they consume it. Electr. News 10, 143–160. doi: 10.1177/1931243116656716
Faul, F., Erdfelder, E., Lang, A.-G., and Buchner, A. (2007). G*Power 3: a flexible statistical power analysis program for the social, behavioral, and biomedical sciences. Behav. Res. Methods 39, 175–191. doi: 10.3758/BF03193146
Fessler, D. M. T., Pisor, A. C., and Holbrook, C. (2017). Political orientation predicts credulity regarding putative hazards. Psychol. Sci. 28, 651–660. doi: 10.1177/0956797617692108
Frimer, J. A., Skitka, L. J., and Motyl, M. (2017). Liberals and conservatives are similarly motivated to avoid exposure to one another’s opinions. J. Exp. Soc. Psychol. 72, 1–12. doi: 10.1016/j.jesp.2017.04.003
Gentzkow, M., and Shapiro, J. M. (2010). What drives media slant? Evidence from U.S. daily newspapers. Econometrica 78, 35–71. doi: 10.3982/ECTA7195
Guess, A. M., Lerner, M., Lyons, B., Montgomery, J. M., Nyhan, B., Riefler, J., et al. (2020). A digital media literacy intervention increases discernment between mainstream and false news in the United States and India. Proc. Natl. Acad. Sci. U.S.A. 117, 15536–15545. doi: 10.1073/pnas.1920498117
Iyengar, S., Sood, G., and Lelkes, Y. (2012). Affect, not ideology: a social identity perspective on polarization. Public Opin. Q. 76, 405–431. doi: 10.1093/poq/nfs038
Jerit, J., and Zhao, Y. (2020). Political misinformation. Annu. Rev. Polit. Sci. 23, 77–94. doi: 10.1146/annurev-polisci-050718-032814
Knight Foundation (2020). Gallup/Knight poll: Americans’ concerns about media Bias Deepen, even as they see it as vital for democracy. Available online at: https://knightfoundation.org/press/releases/gallup-knight-poll-americans-concerns-about-media-bias-deepen-even-as-they-see-it-as-vital-for-democracy/ (accessed August 4, 2020).
Knobloch-Westerwick, S. (2015). Choice and preference in media use: advances in Selective exposure theory and research. New York, NY: Routledge. doi: 10.4324/9781315771359
Knobloch-Westerwick, S., and Meng, J. (2009). Looking the other way: selective exposure to attitude-consistent and counterattitudinal political information. Commun. Res. 36, 426–448. doi: 10.1177/0093650209333030
Lewandowsky, S., and van der Linden, S. (2021). Countering misinformation and fake news through inoculation and prebunking. Eur. Rev. Soc. Psychol. 32, 348–384. doi: 10.1080/10463283.2021.1876983
Lewandowsky, S., Ecker, U. K. H., Seifert, C. M., Schwarz, N., and Cook, J. (2012). Misinformation and its correction: continued influence and successful debiasing. Psychol. Sci. Public Interest 13, 106–131. doi: 10.1177/1529100612451018
Maksl, A., Ashley, S., and Craft, S. (2013). Measuring news media literacy. J. Media Literacy Educ. 6, 29–45.
Marsh, E. J., and Fazio, L. K. (2006). Learning errors from fiction: difficulties in reducing reliance on fictional stories. Mem. Cogn. 34, 1140–1149. doi: 10.3758/BF03193260
Media Bias/Fact Check (2021). Media Bias/Fact Check - About. Available online at: https://mediabiasfactcheck.com/about/ (accessed July 28, 2021).
Mitchell, A., Gottfried, J., Kiley, J., and Matsa, K. E. (2020). Political polarization & media habits. pew research center’s journalism project. Available online at: https://www.pewresearch.org/journalism/2014/10/21/political-polarization-media-habits/ (accessed February 2, 2022).
NBC Universal News Group (2019). Arizona artists WIN suit over same-sex wedding invitations. NBCNews.com. Available online at: https://www.nbcnews.com/feature/nbc-out/arizona-artists-win-suit-over-same-sex-wedding-invitations-n1055291. (accessed September 17, 2019)
Nobias (2021). Nobias FAQ. Available online at:https://nobias.com/politics-faq (accessed July 28, 2021).
Parke, C. (2019). Christian artists celebrate religious Freedom win in Arizona Supreme Court. Fox News. Available online at: https://www.foxnews.com/faith-values/arizona-christian-artists-religious-freedom-court (accessed September 18, 2019).
Pew Research Center (2020). 1. Trends in party affiliation among demographic groups. Pew Research Center - U.S. Politics & Policy. Available online at: https://www.pewresearch.org/politics/2018/03/20/1-trends-in-party-affiliation-among-demographic-groups/ (accessed August 28, 2020).
Pew Research Center (2022). Trust in America: do Americans trust the news media?. Washington, DC: Pew Research Center.
Rahman, K. (2020). Ohio University police deny gun rights ADVOCATE Kaitlin Bennett’s claims that her visit “started a riot”. Newsweek. Available online at: https://www.newsweek.com/kaitlin-bennett-forced-flee-ohio-university-students-protest-appearance-1487759 (accessed February 18, 2020).
Shirazi, E. (2019). South Florida, in effort to save tourism industry, may spend millions to remove seaweed invading beaches. Fox News. Available online at: https://www.foxnews.com/travel/slimy-stinky-seaweed-invades-south-florida-beaches (accessed August 10, 2019).
Slothuus, R., and de Vreese, C. H. (2010). Political parties, motivated reasoning, and issue framing effects. J. Polit. 72, 630–645. doi: 10.1017/S002238161000006X
Tajfel, H., and Turner, J. C. (1979). “An integrative theory of intergroup conflict,” in The social psychology of intergroup relations, eds W. G. Austin and S. Worchel (Monterey, CA: Brooks/Cole), 33–47.
Tappe, A. (2019). Rates are low, and mortgages are CHEAP. So why aren’t Americans buying more HOMES? | CNN BUSINESS. CNN. Available online at: https://www.cnn.com/2019/08/09/economy/mortgages-home-buyers/index.html (accessed August 9, 2019).
van der Linden, S., Roozenbeek, J., and Compton, J. (2020). Inoculating against fake news about COVID-19. Front. Psychol. 11:566790. doi: 10.3389/fpsyg.2020.566790
Vraga, E. K., and Tully, M. (2018). News literacy, social media behaviors, and skepticism toward information on social media. Inform. Commun. Soc. 24, 150–166. doi: 10.1080/1369118X.2019.1637445
Wallace, D. (2020). Kent state ‘gun girl’ confronted by protesters at Ohio University. Fox News. Available online at: https://www.foxnews.com/us/kent-state-gun-girl-kaitlin-bennett-ohio-university-protest (accessed February 19, 2020).
Keywords: bias indicator, news media, media literacy, political bias, news bias
Citation: Bruchmann K, Vincent S and Folks A (2023) Political bias indicators and perceptions of news. Front. Psychol. 14:1078966. doi: 10.3389/fpsyg.2023.1078966
Received: 24 October 2022; Accepted: 31 March 2023;
Published: 26 April 2023.
Edited by:
Mark Shephard, University of Strathclyde, United KingdomReviewed by:
Ozen Bas, Kadir Has University, TürkiyeMyojung Chung, Northeastern University, United States
Copyright © 2023 Bruchmann, Vincent and Folks. This is an open-access article distributed under the terms of the Creative Commons Attribution License (CC BY). The use, distribution or reproduction in other forums is permitted, provided the original author(s) and the copyright owner(s) are credited and that the original publication in this journal is cited, in accordance with accepted academic practice. No use, distribution or reproduction is permitted which does not comply with these terms.
*Correspondence: Kathryn Bruchmann, kbruchmann@scu.edu