 Yan Song
 Chunyan Huang2†
 Yi Zhong
 Xi Wang
- 1Nanning Fifth People's Hospital, Nanning, China
- 2Department of Cardiology, Tongren Hospital of Wuhan University (Wuhan Third Hospital), Wuhan, China
- 3Peking University Sixth Hospital, Peking University Institute of Mental Health, NHC Key Laboratory of Mental Health (Peking University), Beijing, China
- 4Department of Mental Health, Taihe Hospital, Hubei University of Medicine, Shiyan, China
Objective: There is no objective method to diagnose major depressive disorder (MDD). This study explored the neuroimaging biomarkers using the support vector machine (SVM) method for the diagnosis of MDD.
Methods: 52 MDD patients and 45 healthy controls (HCs) were involved in resting-state functional magnetic resonance imaging (rs-fMRI) scanning. Imaging data were analyzed with the regional homogeneity (ReHo) and SVM methods.
Results: Compared with HCs, MDD patients showed increased ReHo in the left anterior cingulum cortex (ACC) and decreased ReHo in the left precentral gyrus (PG). No correlations were detected between the ReHo values and the Hamilton Rating Scale for Depression (HRSD) scores. The SVM results showed a diagnostic accuracy of 98.96% (96/97). Increased ReHo in the left ACC, and decreased ReHo in the left PG were illustrated, along with a sensitivity of 98.07%(51/52) and a specificity of100% (45/45).
Conclusion: Our results suggest that abnormal regional neural activity in the left ACC and PG may play a key role in the pathophysiological process of first-episode MDD. Moreover, the combination of ReHo values in the left ACC and precentral gyrusmay serve as a neuroimaging biomarker for first-episode MDD.
Introduction
Major depressive disorder (MDD) is a very prevalent psychiatric disorder that significantly impacts patients' quality of life and physical health. According to the World Health Organization, more than 300 million people in the world suffered from depression. The suffering caused by self-mutilation, suicide, and other behaviors of depression patients to patients and their families and the loss to society cannot be ignored (1). In the past few decades, researchers have sought breakthroughs in the diagnosis of depression, from relying solely on symptomatic diagnosis to the birth of various markers, such as blood biomarkers and molecular genetics biomarkers: BDNF Val66Met, 5-HTTLPR risk gene biomarkers, and gut microbiota (2–4). However, a simple and objectively effective diagnostic marker has not been found.
Functional Magnetic Resonance Imaging (fMRI) is a feasible non-invasive medical imaging to examine the structure and connectivity of the brain (5). fMRI can be utilized to explore the working mechanism and regularity of the brain in the resting state, which mainly reflects the functional connection characteristics of the neural network of the brain (6). The principle of fMRI is to capture the hemodynamic changes under neural activity. Given that the brain's neural activity requires the local blood flow with sufficient oxygen supply, increasing the local blood oxygen supply results in the change in blood oxygen concentration, leading to the change of the magnetic resonance signal in the local brain area. This latter change can be detected by The Blood Oxygenation Level Dependent (BOLD) signal of each voxel point of the brain and recorded as the magnetic resonance imaging signal (7). Therefore, fMRI can decipher the differences of BOLD signals in various regions in the brain of depressed patients from healthy populations, facilitating the diagnosis of MDD.
A large number of studies have found that patients with depression have abnormal signals in various brain regions on fMRI (8–11). The most prominent regions are the medial prefrontal cortex, the limbic system, and the default network (12–15). Adolescent patients with MDD have been associated with heightened connectivity within default mode network (DMN) regions and diminished connectivity within FPN regions (16). A study of MDD patients with somatic symptoms showed that both ReHo and ALFF values in the bilateral precentral gyrus, postcentral gyrus, and left paracentral gyrus were lower than those in the control group (17). First-episode, treatment-naive patients with MDD showed decreased activity in the left dorsolateral prefrontal cortex and bilateral medial orbitofrontal cortex (18), and reduced ALFF was found in bilateral orbital frontal cortex (OFC), while increased ALFF in the bilateral temporal lobe extending to theinsular and left fusiform cortices in MDD patients compared to healthy controls (19). A meta-analysis of whole-brain rs-fMRI studies found that MDD patients displayed decreased ALFF in the bilateral cerebellum and bilateral precuneus cortex (20). The inconsistency of these results may be related to the interference of different disease courses, medications, and other factors. Therefore, selecting patients with first-episode drug-naïve depression as study subjects can reduce the interference of these confounding factors.
The support vector machine (SVM) has solved clinical problems since the mid-nineties. Several studies have used SVM combined with neuroimaging data to explore the diagnosis and treatment response prediction of depression at the individual level to improve the diagnostic accuracy of depression (21–27). By using SVM analysis, the possibility of distinguishing MDD from healthy controls by using the extracted abnormal ReHo values in brain regions can be examined in our study. We aimed to explore specific or distinctive alterations in first-episode MDD and whether the alterations could be used to separate first-episode MDD from healthy controls. We hypothesized that first-episode untreated depression patients have multiple abnormal ReHo brain regions, and these abnormal brain regions singly/combined as a biomarker to assist in diagnosing depression patients.
Methods
Participants
Fifty-two first-episode MDD patients and 45 age-, gender-, education-matched, health controls were recruited from the First Affiliated Hospital of Guangxi Medical University, China. All participants were right-handed. The patient's final diagnoses were independently confirmed by two experienced psychiatrists using the Structured Clinical Interview of the DSM-IV (SCID) (28) and assessed by the 17-item Hamilton Rating Scale for Depression (HRSD-17). The inclusion criteria for MDD patients were as follows: first major depressive episode; 17-item Hamilton Rating Scale for Depression (HRSD-17) total scores ≥17. Exclusion criteria were as follows for the patients: any history of head injury or lost consciousness, serious physical or neurological illness, other mental disorders meeting DSM-IV diagnostic criteria, such as a cute physical illness, substance abuse or dependence, schizophrenia, bipolar disorder. None of the healthy controls had a severe physical illness, history of mental disorders, or family history of mental disorders.
Each participant has submitted a written informed consent before enrollment. The study was approved by the Medical Research Ethics Committee of the First Affiliated Hospital of Guangxi Medical University, China, and performed in accordance with the Declaration of Helsinki.
Image Acquisition
The resting-state MRI data were obtained by using an Achieva 3.0T scanner (Philips, Amsterdam, the Netherlands) at the First Affiliated Hospital of Guangxi Medical University in the first day after enrollment. All the participants were instructed to lie still, close their eyes, and remain awake during the scan. The resting-state functional images were employed, using an echo-planar imaging sequence with the following parameters: repetition time/echo time (TR/TE) 2000/30ms, 31 slices, 90° flip angles, 22 cm ×22 cmFOV, 5 mm slice thickness, and 1 mm gap.
Data Preprocessing
DPARSF software in MATLAB was used to preprocess imaging data (29). Due to initial signal instability and participants' adaption time, the first five-time points were deleted in order to minimize the influence of participants' adaption time and the instability of the initial signal. Slice time and head motion were corrected.
All imaging data were with a maximum displacement in the x-, y-, or z-axis no more than 2 mm and maximum angular rotation no more than 2°. The corrected imaging data were spatially normalized to the standard Montreal Neurological Institute space and resampled to 1 mm ×1 mm ×1 mm. The obtained fMRI data were temporally band-pass filtered (0.01–0.08 Hz) and linearly detrended. Several spurious covariates were removed from the imaging data, such as the signal from the ventricular seed-based region of interest, the six-head motion parameters obtained by rigid body correction, and the white matter-centered region. The global signal was regressed out during the processing of the resting-state functional connectivity data.
ReHo analysis was performed using REST software. The formula used to calculate ReHo according to the previous study (30).
Classification Analysis
Distributions of age, years of education, and voxel-based comparisons of whole-brain ReHo maps were compared by using two-sample t-tests. The gender ratio was compared by using Chi-square test. The resulting statistical maps were set at a threshold (p <0.01) for multiple comparisons (GRF corrected, voxel significance: P <0.01; clustering significance: p <0.01). Furthermore, linear correlations were calculated between abnormal ReHo values and psychological performances. The significance threshold was set at p <0.05.
SVM analysis was applied to examine the possibility of distinguishing MDD from healthy controls by using the extracted abnormal ReHo values in brain regions. The method of SVM was operated using the LIBSVM software package in MATLAB. The best parameters including C (penalty coefficient) and gamma value were selected. Through the LIBSVM tool, the grid of parameters were evaluated and all the parameter settings' accuracies were acquired. The highest cross-validation accuracy of the parameter was determined.
Results
Demographics Characteristics and Clinical Information
A total of 52 MDD patients and 45 healthy controls were involved in the study. No significant differences in age, gender, and year of education were observed between the two groups. Demographic information and clinical characteristics were shown in Table 1.
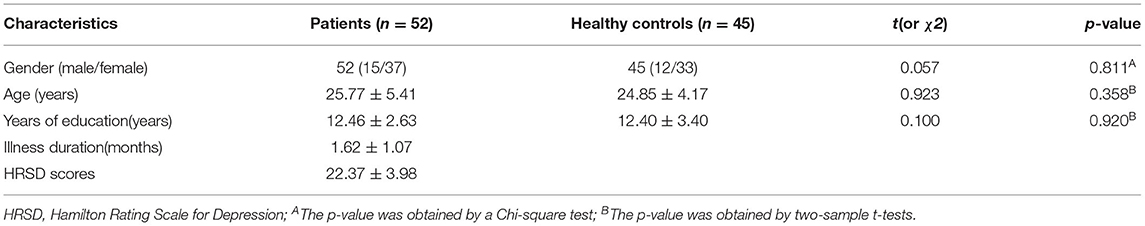
Table 1. Clinical information of the participants.
ReHo: Patients vs. Controls
Compared with healthy controls, patients with MDD exhibited a significantly increased ReHo in the left anterior cingulum cortex (ACC) and decreased ReHo in the left precentral gyrus (PG) (Table 2; Figure 1).
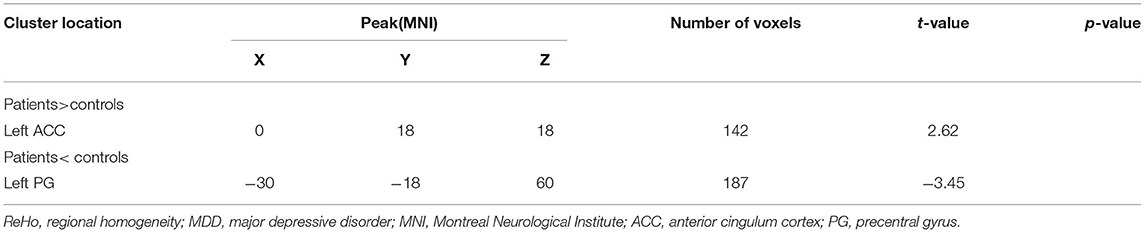
Table 2. Brain regions with abnormal ReHo in MDD.
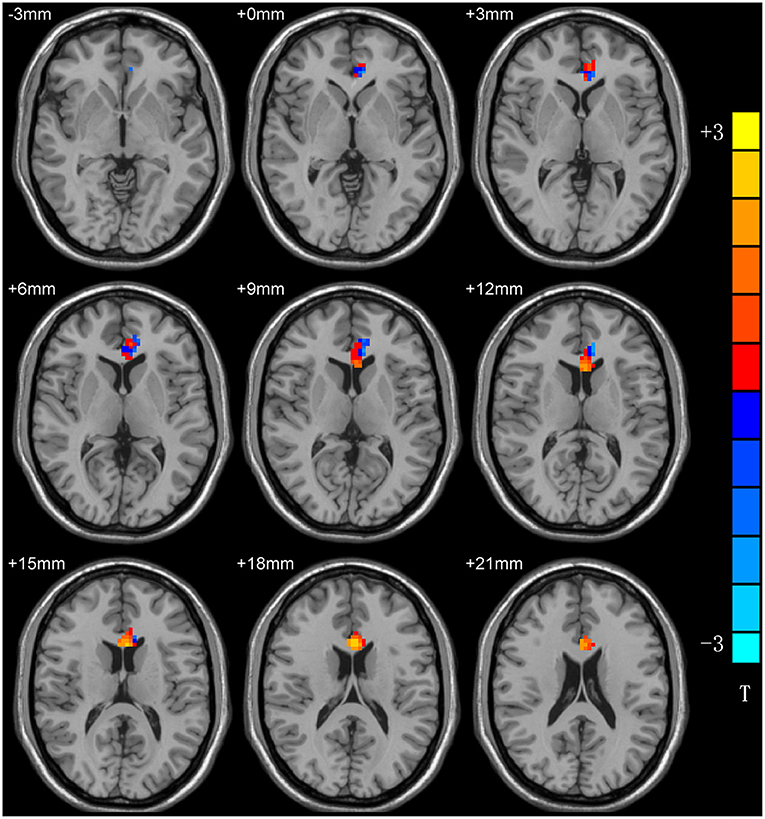
Figure 1. ReHo differences between patients with MDD and HCs. Red and blue denote higher and lower ReHo, respectivsely, and the color bars represent the T-values from the two-sample t-test of the group analysis. ReHo, regional homogeneity; MDD, major depressive disorder; HCs, healthy controls.
The Correlations Between the ReHo Values and Other Factors
There was no correlations detected between the ReHo values and the Hamilton Rating Scale for Depression (HRSD) scores. There were no other factors such as gender and years of education in MDD patients were detected be related to the abnormal ReHo values.
SVM Results
A combination of the increased ReHo values in the left ACC and decreased ReHo in the left PG was used as a potential biomarker to diagnose MDD patients by the SVM method. The classification accuracies were as follows: diagnostic accuracy of 98.96% (96/97), a sensitivity of 98.07%(51/52), and a specificity of 100% (45/45) (Figure 2).
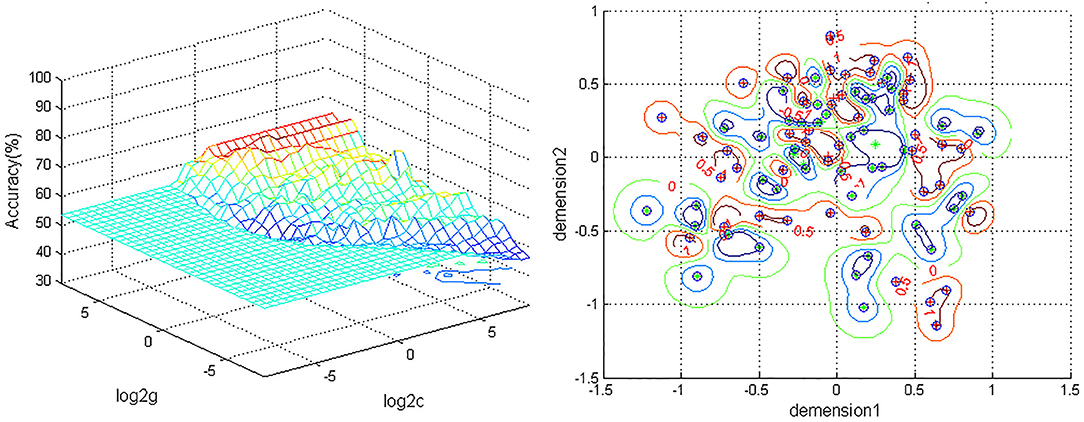
Figure 2. Depiction of classifications based on the SVM using a combination of ReHo values in the left ACC and PG to differentiate MDD patients from HCs. Left: SVM parameters result of 3D view. g, means gamma; c, penalty coefficient; Right, dimension 1 and dimension 2 represent the ReHo values in the left ACC and PG. Green crosses represent MDD patients, and the red crosses represent HCs. SVM, support vector machine; ReHo, regional homogeneity; ACC, anterior cingulum cortex; PG, precentral gyrus; MDD, major depressive disorder; HCs,s healthy controls.
Discussion
The objective, effective and rapid diagnosis of MDD has always been a hot spot in clinical research. However, there are no effective diagnostic methods for MDD, and its diagnosis still depends on depressive syndromes. Rs-fMRI research is increasingly used to assist clinical diagnosis. This study explored the utility of altered ReHo values in the left ACC and PG as a potential neuroimaging biomarker for the first-episode MDD by the SVM method.
The cingulum is a key component of the limbic lobe, and it also plays a key role in the DMN. The cingulum is the major interconnecting apparatus of all cerebral lobes (31). It has been described as the “seat of dynamic vigilance by which environmental experiences are endowed with an emotional awareness” by Papez (32). Based on the characteristics and anatomy of the cingulum gyrus, the cingulum gyrus is divided into four subregions such as the ACC, middle cingulum cortex, posterior cingulum cortex, and retrosplenial cortex (33). Anterior cerebrum The ACC is the first half of the cingulum gyrus, which is closely related to human cognitive execution, emotional processing, and other brain functions (34). When ACC is damaged, it will produce many clinical symptoms, including inattention, dysfunction of autonomic function regulation, emotional instability (35, 36). Studies have found that the ACC is prone to damage in depression (37, 38). Structural magnetic resonance study found that the anterior cingulum white matter fibrosis of the ACC recovered after 8 weeks of antidepressant treatment (39, 40). In the present study, similar results were noticed. Increased ReHo values of the left ACC and decreased PG were found in the patients with MDD, and thus we speculated that abnormal ReHo in the left ACC and PG has a critical role in the physiological processes of MDD. Another finding of this study was left-sided affected brain regions in MDD patients. As the ACC is considered to have a key role in the pathophysiology of the disorder, lack of normal symmetries in ACC has been long observed. In task-related fMRI, decreased functional connectivity between the left amygdala and the left ACC during negative stimuli in participants with MDD was found (41), while the increased depression duration was correlated with decreased perfusion of the right ACC (42). Consistent with the previous findings, our results suggest that lack of normal symmetries may be a characteristic for patients with MDD.
Prefrontal lobe dysfunction is associated with a variety of depressive symptoms, such as attention deficit, psychomotor retardation, executive dysfunction, etc., and is related to the treatment of depression (43). The prefrontal-striatal neural circuit underlies behavioral disinhibition (32). Previous studies have found that dorsal medial prefrontal gyrus lesions are associated with susceptibility to depression (44). In MDD patients, behavioral disinhibition is associated with increased suicidal behavior, mental agitation, impulsivity loss, and substance use disorders. related to (44, 45). Furthermore, Structural magnetic resonance studies found that the precentral gyrus volume was reduced in patients with depression compared with normal people (46). Carlson et al. also found that in patients with MDD, increased depression was associated with a decrease in PFC volume (47). A recent study also found that compared with MDD patients who did not attempt suicide, suicide attempters had a greater surface area in the left retrocentral gyrus and lateral occipital gyrus but a smaller surface area in the left superior frontal gyrus (48). These studies suggest that the damage to the precentral cortex in patients with depression is involved in the pathological mechanism of depression.
Antidepressants may have an effect on brain structure and function (49–51). Therefore, it is essential to select drug-naive patients as a starting point to minimize the potentialeffects of medication. Long illness duration may have a neurotoxic effect on brain structure (52). Guo and his companies found that the combination of abnormal ReHo in the right fusiform gyrus/cerebellar and right superior/middle occipital gyrus showed an accuracy of 83.05%, the sensitivity of 90.32%, and specificity was 75.00%, which was used to distinguish depressive MDD patients from non-depressed MDD patients, and the combination of abnormal ReHo in right fusiform gyrus/cerebellar and left precentral gyrus showed the accuracy of 98.41%, sensitivity of 96.77%, and specificity of 100.00%, used to distinguish depressive MDD patients from healthy controls (21). In the present study, our study found abnormal ReHo values in ACC and PG within patients with first-episode MDD. Furthermore, an SVM was used to combine the ReHo signals of these two abnormal brain regions as a biomarker for diagnosing MDD with an accuracy of 98.96%, a sensitivity of 98.07%,and a specificity of 100%. A slightly larger sample size, unmedicated, and shorter disease duration may explain our results may have better clinical value.
Some limitations exist in the study. First, the age of the patients is concentrated in the young and the mean illness duration is <2 months. Further study is needed to justify these results in order to enhance the possibility of generalizing the results of this study to MDD patients with various clinical characteristics. Second, we did not know whether changes in the left anterior Cingulum cortex and Precentral gyrus occurred before or as a result of MDD. A long-term follow-up observation may help us to understand the cause and effect.
Conclusion
In conclusion, the altered ReHo in the left ACC and PG may be state-related changes of MDD. Also, the combination of increased ReHo in the left ACC and left PG may be a potential neuroimaging biomarker for the first-episode MDD.
Data Availability Statement
The original contributions presented in the study are included in the article/supplementary material, further inquiries can be directed to the corresponding author/s.
Ethics Statement
The studies involving human participants were reviewed and approved by the Medical Research Ethics Committee of the First Affiliated Hospital of Guangxi Medical University, China. The patients/participants provided their written informed consent to participate in this study.
Author Contributions
XW and GT contributed to the conception and design of the study. CH and YZ supervised the progress of the study. YS performed the data analysis and wrote the manuscript. All authors contributed to manuscript revision, and approved it for publication.
Conflict of Interest
The authors declare that the research was conducted in the absence of any commercial or financial relationships that could be construed as a potential conflict of interest.
Publisher's Note
All claims expressed in this article are solely those of the authors and do not necessarily represent those of their affiliated organizations, or those of the publisher, the editors and the reviewers. Any product that may be evaluated in this article, or claim that may be made by its manufacturer, is not guaranteed or endorsed by the publisher.
Acknowledgments
The investigation was supported by grants from the Natural Science Foundation of Guangxi Province for Distinguished Young Scientists (Grant No. 2014GXNSFGA118010) and the Health Commission of Guangxi Province Self-Funded Research Project (Grant No. Z20201097). We thank all the individuals who served as the research participants.
References
1. Chen M, Ketenci M, Lee JS, Srinivasan A, Wang YM, Rosoklija G, et al. Proteomics profiling of MDD, suicide and SSRI treatment in the human hippocampus. Biol Psychiatry. (2020) 87:S213. doi: 10.1016/j.biopsych.2020.02.553
2. Bai SJ, Bai HL Li DT, Zhong Q, Xie J, Chen JJ. Gut Microbiota-related inflammation factors as a potential biomarker for diagnosing major depressive disorder. Front Cell Infect Microbiol. (2022) 12:831186. doi: 10.3389/fcimb.2022.831186
3. Zhang GY, Xu SX, Zhang ZQ, Zhang Y, Wu YK, An J, et al. Identification of key genes and the pathophysiology associated with major depressive disorder patients based on integrated bioinformatics analysis. Front Psychiatry. (2020) 11:192. doi: 10.3389/fpsyt.2020.00192
4. Whittlesey R. Identification of Potential Biomarkers in PDAC. Chapel Hill, NC: University of North Carolina at Chapel Hill Graduate School (2014).
5. Fox MD, Raichle ME. Spontaneous fluctuations in brain activity observed with functional magnetic resonance imaging. Nat Rev Neurosci. (2007) 8:700–11. doi: 10.1038/nrn2201
6. Forman SD, Cohen JD, Fitzgerald M, Eddy WF, Mintun MA, Noll DC. Improved assessment of significant activation in functional magnetic resonance imaging (fMRI): use of a cluster-size threshold. Magn Reson Med. (1995) 33:636–47. doi: 10.1002/mrm.1910330508
7. Fransson P. Spontaneous low-frequency BOLD signal fluctuations: an fMRI investigation of the resting-state default mode of brain function hypothesis. Hum Brain Mapp. (2005) 26:15–29. doi: 10.1002/hbm.20113
8. Marchitelli R, Paillère-Martinot ML, Bourvis N, Guerin-Langlois C, Kipman A, Trichard C, et al. Dynamic functional connectivity in adolescence-onset major depression: relationships with severity and symptom dimensions. Biol Psychiatry Cogn Neurosci Neuroimaging. (2022) 7:385–96. doi: 10.1016/j.bpsc.2021.05.003
9. Han SQ, Cui Q, Wang X, Li L, Li D, He ZL, et al. Resting state functional network switching rate is differently altered in bipolar disorder and major depressive disorder. Hum Brain Mapp. (2020) 41:3295–304. doi: 10.1002/hbm.25017
10. Burrows K, Stewart JL, Kuplicki R, Figueroa-Hall L, Spechler PA, Zheng H, et al. Elevated peripheral inflammation is associated with attenuated striatal reward anticipation in major depressive disorder. Brain Behav Immun. (2021) 93:214–25. doi: 10.1016/j.bbi.2021.01.016
11. Van Tol MJ, Van der Wee NJA, Veltman DJ. Fifteen years of NESDA neuroimaging: an overview of results related to clinical profile and bio-social risk factors of major depressive disorder and common anxiety disorders. J Affect Disord. (2021) 289:31–45. doi: 10.1016/j.jad.2021.04.009
12. Hou ZH, Kong YY, Yin YY, Zhang YQ, Yuan YG. Identification of first-episode unmedicated major depressive disorder using pretreatment features of dominant coactivation patterns. Prog Neuropsychopharmacol Biol Psychiatry. (2021) 104:110038. doi: 10.1016/j.pnpbp.2020.110038
13. Liang SG, Deng W, Li XJ, Greenshaw AJ, Wang Q, Li ML, et al. Biotypes of major depressive disorder: neuroimaging evidence from resting-state default mode network patterns. Neuroimage Clin. (2020) 28:102514. doi: 10.1016/j.nicl.2020.102514
14. Provenzano J, Fossati P, Dejonckheere E, Verduyn P, Kuppens P. Inflexibly sustained negative affect and rumination independently link default mode network efficiency to subclinical depressive symptoms. J Affect Disord. (2021) 293:347–54. doi: 10.1016/j.jad.2021.06.051
15. Pan YZ, Liu ZN, Xue ZM, Sheng YY, Cai Y, Cheng YX, et al. Abnormal network properties and fiber connections of DMN across major mental disorders: a probability tracing and graph theory study. Cereb Cortex. (2021). doi: 10.1093/cercor/bhab405 [Epub ahead of print].
16. Qu YY, Rappaport BI, Luby JL, Barch DM. No associations in preregistered study of youth depression and functional connectivity of fronto-parietal and default mode networks. Neuroimage. (2021) 3:100036. doi: 10.1016/j.ynirp.2021.100036
17. Liu PH, Tu HW, Zhang AX, Yang CX, Liu ZF, Lei L, et al. Brain functional alterations in MDD patients with somatic symptoms: a resting-state fMRI study. J Affect Disord. (2021) 295:788–96. doi: 10.1016/j.jad.2021.08.143
18. Wang L, Dai WJ, Su YN, Wang G, Tan YL, Jin Z, et al. Amplitude of low-frequency oscillations in first-episode, treatment-naive patients with major depressive disorder: a resting-state functional MRI study. PLoS One. (2012) 7: e48658. doi: 10.1371/journal.pone.0048658
19. Zhang XC, Zhu XL, Wang X, Zhu XZ, Zhong MT Yi JY, et al. First-episode medication-naive major depressive disorder is associated with altered resting brain function in the affective network. PLoS ONE. (2014) 9:e85241. doi: 10.1371/journal.pone.0085241
20. Gong JY, Wang JJ, Qiu SJ, Chen P, Luo ZY, Wang JR, et al. Common and distinct patterns of intrinsic brain activity alterations in major depression and bipolar disorder: voxel-based meta-analysis. Transl Psychiatry. (2020) 10:353. doi: 10.1038/s41398-020-01036-5
21. Yan MQ, He YQ, Cui XL, Liu F, Li HB, Huang RZ, et al. Disrupted regional homogeneity in melancholic and non-melancholic major depressive disorder at rest. Front Psychiatry. (2021) 12:618805. doi: 10.3389/fpsyt.2021.618805
22. Sen B, Cullen KR, Parhi KK. Classification of adolescent major depressive disorder via static and dynamic connectivity. IEEE J Biomed Health Inform. (2021) 25:2604–14. doi: 10.1109/JBHI.2020.3043427
23. Shan XX, Cui XL, Liu F, Li HB, Huang RZ, Tang YQ, et al. Shared and distinct homotopic connectivity changes in melancholic and non-melancholic depression. J Affect Disord. (2021) 287:268–75. doi: 10.1016/j.jad.2021.03.038
24. Gao YJ, Wang X, Xiong ZY, Ren HW, Liu RS, Wei YF, et al. Abnormal fractional amplitude of low-frequency fluctuation as a potential imaging biomarker for first-episode major depressive disorder: a resting-state fmri study and support vector machine analysis. Front Neurol. (2021) 12:751400. doi: 10.3389/fneur.2021.751400
25. Gao YJ, Xiong ZY, Wang X, Ren HW, Liu RS, Bai B, et al. Abnormal degree centrality as a potential imaging biomarker for right temporal lobe epilepsy: a resting-state functional magnetic resonance imaging study and support vector machine analysis. Neuroscience. (2022) 487:198–206. doi: 10.1016/j.neuroscience.2022.02.004
26. Gao YJ, Wang X, Xiong PG, Ren HW, Zhou SY, Yan YG, et al. Abnormalities of the default-mode network homogeneity and executive dysfunction in people with first-episode, treatment-naive left temporal lobe epilepsy. Eur Rev Med Pharmacol Sci. (2021) 25:2039–49.
27. Li DB, Liu RS, Wang X, Xiong PA, Ren HW, Wei YF, et al. Abnormal ventral attention network homogeneity in patients with right temporal lobe epilepsy. Eur Rev Med Pharmacol Sci. (2021) 25:2031–8.
28. Lobbestael J, Leurgans M, Arntz A. Inter-rater reliability of the Structured Clinical Interview for DSM-IV Axis I Disorders (SCID I) and Axis II Disorders (SCID II). Clin Psychol Psychother. (2011)18:75–9. doi: 10.1002/cpp.693
29. Yan CG, Zang YF, DPARSF. A MATLAB Toolbox for “Pipeline” Data Analysis of Resting-State fMRI. Front Syst Neurosci. (2010) 4:13. doi: 10.3389/fnsys.2010.00013
30. Song Y, Su QJ, Jiang ML, Liu F, Yao DP Dai Y, et al. Abnormal regional homogeneity and its correlations with personality in first-episode, treatment-naive somatization disorder. Int J Psychophysiol. (2015) 97:108–12. doi: 10.1016/j.ijpsycho.2015.05.012
31. Wade-Kane R, Ba E, Camara M, Thiam M. Contribution of the neuroanatomy of the cingulate Gyrus to the neuroscientific approach to depression. O J Psychs. (2022) 12:37–48. doi: 10.4236/ojpsych.2022.121004
32. Petrides M, Pandya DN. Efferent association pathways from the rostral prefrontal cortex in the macaque monkey. J Neurosci. (2007) 27:11573–86. doi: 10.1523/JNEUROSCI.2419-07.2007
33. Papez JW. A proposed mechanism of emotion, 1937. J Neuropsychiatry Clin Neurosci. (1995) 7:103–12. doi: 10.1176/jnp.7.1.103
34. Devinsky O, Morrell MJ, Vogt BA, Review article. Contributions of anterior cingulate cortex to behaviour. Brain. (1995) 118:279–306. doi: 10.1093/brain/118.1.279
35. Asayesh V, Nikjeh MT, Asayesh A. Investigation the differences of Anterior Cingulate Cortex (ACC) and frontal lobe activity between MDD and control group with EEG. 7th Iranian Human Brain Mapping Congress. (2021). Available online at: https://civilica.com/doc/1257490
36. Wei YC, Qi KM, Yu Y, Lu W, Xu W, Yang CZ, et al. Analysis of Differentially Expressed Genes in the Dentate Gyrus and Anterior Cingulate Cortex in a Mouse Model of Depression. Biomed Res Int. (2021) 2021:5013565. doi: 10.1155/2021/5013565
37. Zavorotnyy M, Zöllner R, Rekate H, Dietsche P, Bopp M, Sommer J, et al. Intermittent theta-burst stimulation moderates interaction between increment of N-Acetyl-Aspartate in anterior cingulate and improvement of unipolar depression. Brain Stimul. (2020) 13:943–52. doi: 10.1016/j.brs.2020.03.015
38. Seewoo BJ, Rodger J, Demitrack MA, Heart KL, Port JD, Strawn JR, et al. Neurostructural differences in adolescents with treatment resistant depression and treatment effects of transcranial magnetic stimulation. Int J Neuropsychopharmacol. (2022). doi: 10.1093/ijnp/pyac007 [Epub ahead of print].
39. Han KM, Han MR, Kim A, Kang W, Kang Y, Kang J, et al. A study combining whole-exome sequencing and structural neuroimaging analysis for major depressive disorder. J Affect Disord. (2020) 262:31–9. doi: 10.1016/j.jad.2019.10.039
40. Chen LP Dai HY, Dai ZZ, Xu CT, Wu RH. Anterior cingulate cortex and cerebellar hemisphere neurometabolite changes in depression treatment: A 1H magnetic resonance spectroscopy study. Psychiatry Clin Neurosci. (2014) 68:357–64. doi: 10.1111/pcn.12138
41. Robert G, Bannier E, Comte M, Domain L, Corouge I, Dondaine T, et al. Multimodal brain imaging connectivity analyses of emotional and motivational deficits in depression among women. J Psychiatry Neurosci. (2021) 46:E303–12. doi: 10.1503/jpn.200074
42. Tastevin M, Boyer L, Korchia T, Fond G, Lançon Lançon C, Richieri R, et al. Brain SPECT perfusion and PET metabolism as discordant biomarkers in major depressive disorder. EJNMMI Res. (2020) 10:121. doi: 10.1186/s13550-020-00713-2
43. Hamon M, Blier P. Monoamine neurocircuitry in depression and strategies for new treatments. Prog Neuro-psychopharmacol Biol Psychiatry. (2013) 45:54–63. doi: 10.1016/j.pnpbp.2013.04.009
44. Koenigs M, Huey ED, Calamia M, Raymont V, Tranel D, Grafman J. Distinct regions of prefrontal cortex mediate resistance and vulnerability to depression. J Neurosci. (2008) 28:12341–8. doi: 10.1523/JNEUROSCI.2324-08.2008
45. Kittnar O. Selected sex related differences in pathophysiology of cardiovascular system. Physiol Res. (2020) 69:21–31. doi: 10.33549/physiolres.934068
46. Taki Y, Kinomura S, Awata S, Inoue K, Sato K, Ito H, et al. Male elderly subthreshold depression patients have smaller volume of medial part of prefrontal cortex and precentral gyrus compared with age-matched normal subjects: a voxel-based morphometry. J Affect Disord. (2005) 88:313–20. doi: 10.1016/j.jad.2005.08.003
47. Carlson JM, Depetro E, Maxwell J, Harmon-Jones E, Hajcak G. Gender moderates the association between dorsal medial prefrontal cortex volume and depressive symptoms in a subclinical sample. Psychiatry Res. (2015) 233:285–8. doi: 10.1016/j.pscychresns.2015.06.005
48. Chang CH, Chen MC, Qiu MH, Lu J. Ventromedial prefrontal cortex regulates depressive-like behavior and rapid eye movement sleep in the rat. Neuropharmacology. (2014) 86:125–32. doi: 10.1016/j.neuropharm.2014.07.005
49. Jaworska N, Salle S D L, Ibrahim MH, Blier P, Knott V. Leveraging machine learning approaches for predicting antidepressant treatment response using Electroencephalography (EEG) and clinical data. Front Psychiatry. (2019) 9:768. doi: 10.3389/fpsyt.2018.00768
50. Vinne NVD, Vollebregt MA, Rush AJ, Eebes M, Putten MJAM, Arns M, et al. biomarker informed prescription of antidepressants in MDD: a feasibility trial. Eur Neuropsychopharmacol. (2021) 44:14–22. doi: 10.1016/j.euroneuro.2020.12.005
51. Wu CK, Tseng PT, Wu MK Li DJ, Chen TY, Kuo FC, et al. Antidepressants during and after menopausal transition: a systematic review and meta-analysis. Sci Rep. (2020) 10:8026. doi: 10.1038/s41598-020-64910-8
Keywords: regional homogeneity, major depressive disorder, rs-fMRI, support vector machine, biomarker
Citation: Song Y, Huang C, Zhong Y, Wang X and Tao G (2022) Abnormal Reginal Homogeneity in Left Anterior Cingulum Cortex and Precentral Gyrus as a Potential Neuroimaging Biomarker for First-Episode Major Depressive Disorder. Front. Psychiatry 13:924431. doi: 10.3389/fpsyt.2022.924431
Received: 20 April 2022; Accepted: 06 May 2022;
Published: 01 June 2022.
Edited by:
Liang Liang, Xinjiang Medical University, ChinaCopyright © 2022 Song, Huang, Zhong, Wang and Tao. This is an open-access article distributed under the terms of the Creative Commons Attribution License (CC BY). The use, distribution or reproduction in other forums is permitted, provided the original author(s) and the copyright owner(s) are credited and that the original publication in this journal is cited, in accordance with accepted academic practice. No use, distribution or reproduction is permitted which does not comply with these terms.
*Correspondence: Xi Wang, NDIyNzE4MDU4QHFxLmNvbQ==; Guangyuan Tao, MTY0MTEwNDAyQHFxLmNvbXM=
†These authors have contributed equally to this work