 Dong Xia
 Wenxiang Quan
 Tongning Wu
- 1China Academy of Information and Communications Technology, Beijing, China
- 2Peking University Sixth Hospital, Peking University Institute of Mental Health, NHC Key Laboratory of Mental Health (Peking University), National Clinical Research Center for Mental Disorders (Peking University Sixth Hospital), Beijing, China
Objective: We aimed to reduce the complexity of the 52-channel functional near-infrared spectroscopy (fNIRS) system to facilitate its usage in discriminating schizophrenia during a verbal fluency task (VFT).
Methods: Oxygenated hemoglobin signals obtained using 52-channel fNIRS from 100 patients with schizophrenia and 100 healthy controls during a VFT were collected and processed. Three features frequently used in the analysis of fNIRS signals, namely time average, functional connectivity, and wavelet, were extracted and optimized using various metaheuristic operators, i.e., genetic algorithm (GA), particle swarm optimization (PSO), and their parallel and serial hybrid algorithms. Support vector machine (SVM) was used as the classifier, and the performance was evaluated by ten-fold cross-validation.
Results: GA and GA-dominant algorithms achieved higher accuracy compared to PSO and PSO-dominant algorithms. An optimal accuracy of 87.00% using 16 channels was obtained by GA and wavelet analysis. A parallel hybrid algorithm (the best 50% individuals assigned to GA) achieved an accuracy of 86.50% with 8 channels on the time-domain feature, comparable to the reported accuracy obtained using 52 channels.
Conclusion: The fNIRS system can be greatly simplified while retaining accuracy comparable to that of the 52-channel system, thus promoting its applications in the diagnosis of schizophrenia in low-resource environments. Evolutionary algorithm-dominant optimization of time-domain features is promising in this regard.
Introduction
Schizophrenia is a chronic, frequently disabling mental disorder (1). Patients with schizophrenia (SZs) can display both visual and phonological impairments (2), which are vital for the successful development/attainment of literacy skills, resulting in deficits in rapid naming and phonological awareness (3, 4). Schizophrenia results in mixed deficits in morphological, orthographical, and phonological processing skills (5–8) depending on their native language. Therefore, the verbal fluency task (VFT), a language-related neuropsychological task, has been employed for discriminating schizophrenia (9). During the VFT, the participant was asked to make as many phrases as possible, starting with the character or letter appearing on the screen. The phrases could be made based on the semantic or phonological approach. Neuroimaging techniques were used to detect the hemodynamic changes or neuronal firing during the task. Among them, functional near-infrared spectroscopy (fNIRS) can noninvasively measure hemodynamic signals from the cortex (10), and derive underlying neuronal networks and functional connectivity (11). Although the spatial resolution of fNIRS is relatively low (most current fNIRS system has 52 channels), it has advantages on portability and cost, which make fNIRS popular in schizophrenic studies, especially in developing countries with poor medical resources.
Signals from multiple channels enhance the classification capability but at the cost of increased complexity, making it difficult to move and preventing its extensive usage in clinical situations of low-resource environments. Therefore, researchers have attempted channel simplification. Our group obtained a classification accuracy of 85.83% [120 SZs and 120 healthy controls (HCs)] with 11 components by using principal component analysis on time-varying features (12); however, each component was a linear combination of signals from dozens of channels. In this study, the performance of four machine-learning classifiers, namely linear discriminant analysis, k-nearest neighbors, Gaussian process classifier, and support vector machine (SVM), were assessed; the results revealed that SVM performed the best. By using the same dataset, Ji et al. (13) and Yang et al. (14) conducted seed-based analysis on functional connectivity (FC) for classification and achieved an accuracy of 89.67% with 26 channels. Einalou et al. (15) and Dadgostar et al. (16) achieved an accuracy exceeding 84.00% with eight channels after selecting from a 16-channel fNIRS by using genetic algorithm (GA) and wavelet analysis. However, these studies involved only 16 participants. Chen et al. (17) achieved an accuracy of 89.5% with 39 channels by using the general linear model on time-domain features. These results indicate that redundancy exists in multichannel signals, and this redundancy can be reduced by applying appropriate optimization methods.
Metaheuristic optimization is based on functional evaluation and relies less on the properties of objective functions and constraints. This method does not take advantage of the specificity of the targeted problem and is thus widely used in physiological signal processing. These optimization processes generally use a set of solutions inspired by a certain natural analogy or philosophy. As mentioned earlier, a preliminary trial with GA, an evolutionary algorithm, was carried out for 16 participants (15, 16). In effect, the searching process employed by GA is, to some extent, omnidirectional because the crossover and mutation are randomly initiated. This may degrade the exploration ability, although a faster convergence can be achieved. In nature, animals' foraging behavior is not only under genetic control but also changes by interactive learning within the population. Inspired by the biological mechanism, integrating GA with a swarm intelligence-based method [e.g., particle swarm optimization (PSO)] might further reduce the channels for diagnosing schizophrenia by using fNIRS.
In this study, GA, PSO, and their parallel and serial hybrids were proposed with SVM for identifying schizophrenia during a VFT. This is the first study on optimizing the channels of fNIRS for diagnosing schizophrenia. The features derived by time-domain, FC, and wavelet analyses were considered. The results showed that GA and GA-dominant algorithms yielded better results, where an accuracy of 87.00% was achieved with 16 channels by using GA and wavelet feature. The use of a parallel algorithm reduced the number of channels (8 with an accuracy of 86.50% by a parallel GA–PSO optimizer on the time-domain feature). The obtained accuracy was close to that of the 52-channel system. Time-domain and wavelet features demonstrated advantages over FC feature due to schizophrenic hypofrontality, a salient characteristic in the time domain. Therefore, our findings facilitated the development of a portable fNIRS system for the diagnosis of schizophrenia during a VFT in low-resource environments.
Materials and methods
Participants
The dataset was provided by Peking University Sixth Hospital, Beijing, China (18). It consists of 100 SZs (male/female: 48/52, age: 30.45 ± 10.45 years) and 100 HCs (male/female: 65/35, age: 34.43 ± 12.36 years). They were all right-handed native Chinese speakers with minimum education as high school degree. Each patient was diagnosed independently by two clinical psychiatrists according to the Structured Clinical Interview for DSM-IV (19). The study was approved by the Ethics Committee of Peking University Sixth Hospital, and all participants provided written informed consent.
Verbal fluency test
The Chinese version of the VFT (18) is illustrated in Figure 1. It included an initial 30-s pre-task baseline period, followed by a 60-s VFT period, and finally by a 30-s post-task baseline period. During the pre-task and post-task baseline periods, the participants were asked to gaze at the center of the screen, which was placed 1 m in front of them, and continuously repeat the numbers from one to five. During the VFT, three Chinese characters—“中”, “日” and “蓝”, which indicate middle, sun, and blue, respectively—were displayed on the screen successively, each for 20 s. The participants were instructed to orally coin as many phrases as possible starting with these characters, and the oxygenated hemoglobin (oxy-Hb) signal, due to its better signal-to-noise ratio (20, 21), was measured throughout the three periods.
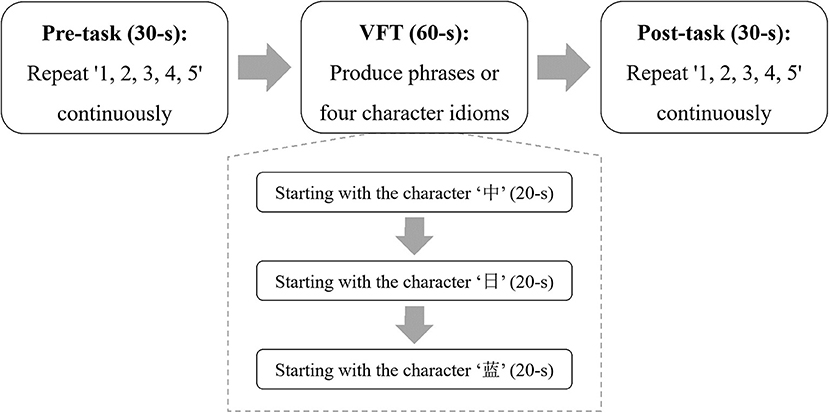
Figure 1. The paradigm of the VFT. During the VFT, three Chinese characters were displayed on the screen for making as many phrases as possible.
ETG-4000 (Hitachi Medical Co., Japan) with 52 channels was used in the experiment. As shown in Figure 2, 17 emitters and 16 detectors were positioned on the prefrontal and temporal regions based on the international 10–20 system. The sampling rate was 10 Hz. Raw signals of a random HC and a random SZ in channel 19 are shown in Figure 3 for example. The 60-s oxy-Hb signals recorded during the VFT were organized as a matrix of 200 × 52 × 600 (number of participants × number of channels × number of signal points) for further analysis.
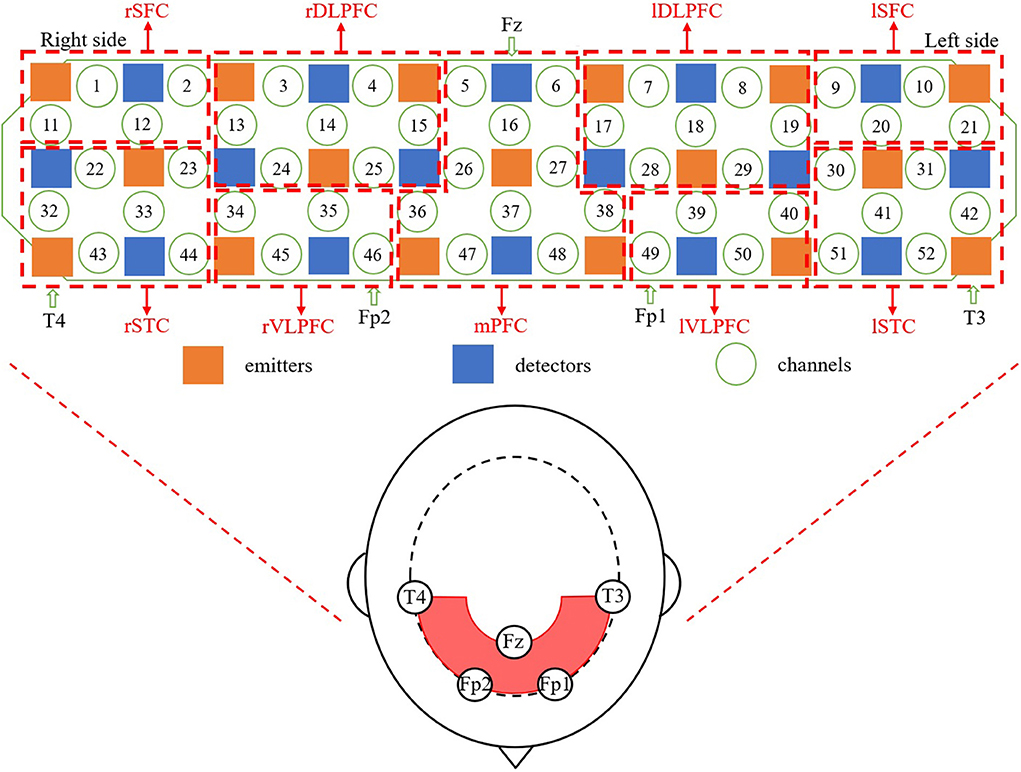
Figure 2. The positions of fNIRS probes and channels according to the international 10–20 system. rSFC, right superior frontal cortex; rDLPFC, right dorsolateral prefrontal cortex; lDLPFC, left dorsolateral prefrontal cortex; lSFC, left superior frontal cortex; rSTC, right superior temporal cortex; rVLPFC, right ventrolateral prefrontal cortex; mPFC, medial prefrontal cortex; lVLPFC, left ventrolateral prefrontal cortex; lSTC, left superior temporal cortex.
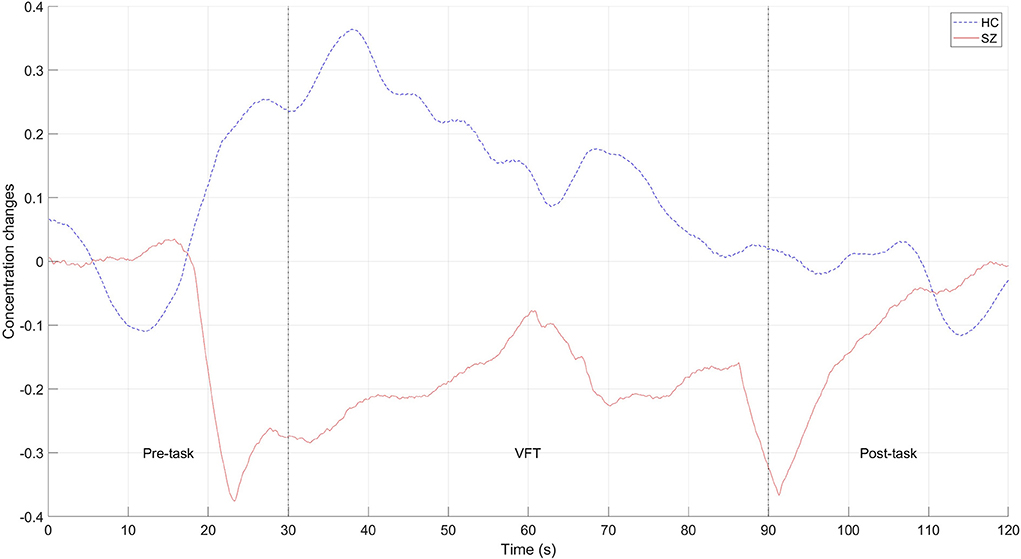
Figure 3. Raw signals of a random HC and a random SZ in channel 19 for example.
Signal processing pipeline
A low-pass filter with a cutoff frequency of 0.6 Hz was used to remove non-physiological noises and motion artifacts (22). Consequently, temporal average, channel-wise FC of oxy-Hb within the 60-s task period were calculated. Raw signals (without prefiltering) were used for wavelet analysis. Based on the features calculated using time-domain, FC, and wavelet analysis, GA, PSO, and their parallel and serial hybrids were employed to optimize channel selection. SVM was the most suitable classifier in discriminating schizophrenia (12). The performance of the methods (including the selected features and the classifiers) was evaluated by ten-fold cross-validation. The pipeline for signal processing is shown in Figure 4.
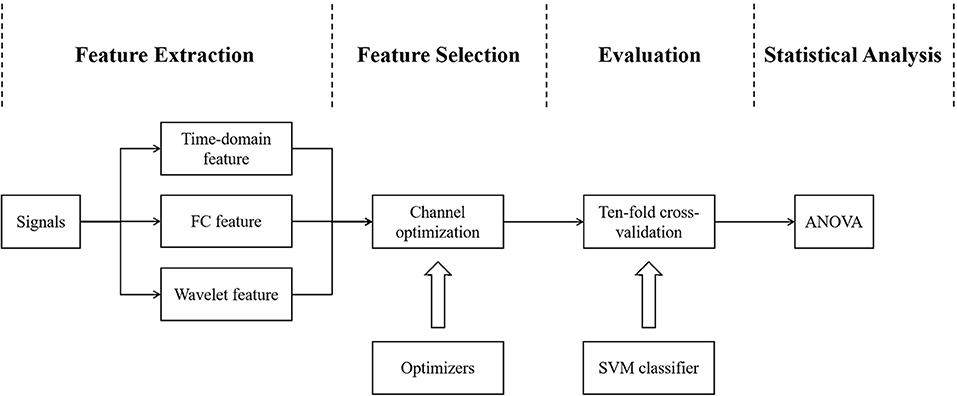
Figure 4. Pipeline for signal processing. GA, PSO and their parallel and serial hybrid optimizers were used for channel optimization on three fNIRS features, respectively. SVM was chosen as the classifier. The classification performance of the selected features and classifiers was evaluated by ten-fold cross-validation. Statistical analysis was performed on the accuracy and the number of channels.
Feature extraction
Time-domain analysis: Mean values of the signals from each channel recorded during the VFT for each participant were computed. The results were normalized by subtracting the mean and dividing the standard deviation from all the participants.
FC analysis: Pearson's correlation coefficient was calculated to evaluate the FC between two channels.
Wavelet analysis: A three-level decomposition tree was used for discrete wavelet transform. Daubechies 5 was selected as the mother wavelet because of its similarity to hemodynamic response (23). As the sampling rate was 10 Hz, the frequency range for the investigation was 0–5 Hz. The procedure is illustrated in Figure 5. Time-domain and wavelet features were provided in the Supplementary Material (Supplementary Tables 1, 2, respectively).
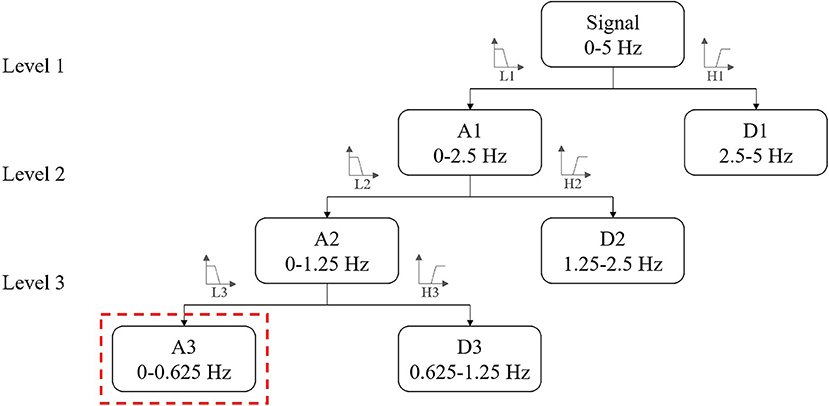
Figure 5. The three-level decomposition tree for discrete wavelet transform. A3 with the frequency range of 0–0.625 Hz was selected to compute wavelet energy.
Encoding scheme
For feature selection by using GA and PSO, the individuals in GA and particles in PSO needed to be encoded properly. In GA, each individual was represented by a binary string of length D = 52, where “0” and “1” indicated that the corresponding channel was removed and selected, respectively. In PSO, the position of each particle was represented by a D-dimensional vector (D = 52) in which each element was distributed in [0,1] and changed into a binary format according to the threshold of 0.5, with “1” denoting the selection of the corresponding channel and “0” indicating the removal of the channel.
Canonical GA, PSO, and their hybrids
GA
GA is inspired by evolution (24). In each generation, better-performing individuals are selected as parents to produce offspring by crossover (crossover rate = 0.8), thereby providing individuals with higher fitness. In addition, mutation (mutation rate = 0.01) is applied to increase the individual diversity. The fitness of every individual is evaluated by the fitness function, which is defined as
where the weight of the number “0” is set as 0.01 to facilitate the selection of fewer channels when two solutions have the same classification accuracy.
PSO
PSO simulates the social behavior of bird flocks, with the concept extended to particles flying to potential solutions through hyperspace and accelerating toward “better” solutions (25). Let Pbest denote the previous best positions of the particles, and Gbest denotes the global best position found by the swarm. Let pi,d represent the Pbest of particle i at dimension d (d = 1, 2, …, D) and gd represent the Gbest of particle i at dimension d. The velocity and position of i-th particle (i = 1, 2, …, N, where N is the population size) at dimension d are represented as vi,d and xi,d, respectively. Then, the update for the d-th dimension of particle i can be defined as
where ω = 0.9 is the inertia weight, c1 = c2 = 2, and r1, d and r2, d are random numbers uniformly distributed in [0,1]. The velocities of particles are limited to [−0.5, 0.5].
Hybrid of GA and PSO
In reality, animals' foraging behavior is controlled by interactive social learning and genetics, and can be explained by its evolutionary history (26). For example, bees' foraging paths are optimized according to sensitivity to the color and smell of flowers. A hybrid of GA and PSO, combining the biological natures of both, can facilitate the optimization process. To specify, the hybrid algorithms can take either serial or parallel forms.
Parallel algorithms
The parallel hybrid algorithms might differ at two stages, i.e., the population partition and information exchange between two optimizers. Therefore, three variants have been considered as pGAPSO-I/II/III. To specify, in pGAPSO-I, the best 50% individuals were assigned to GA, and the best 20% individuals were allocated to PSO in pGAPSO-II, while in pGAPSO-III the individuals were randomly distributed to GA and PSO. The specific partition of the individuals in I and II was adopted from the optimized parameters from previous studies (27, 28). The pipelines of the parallel GA-PSO algorithms are shown in Figures 6A–C.
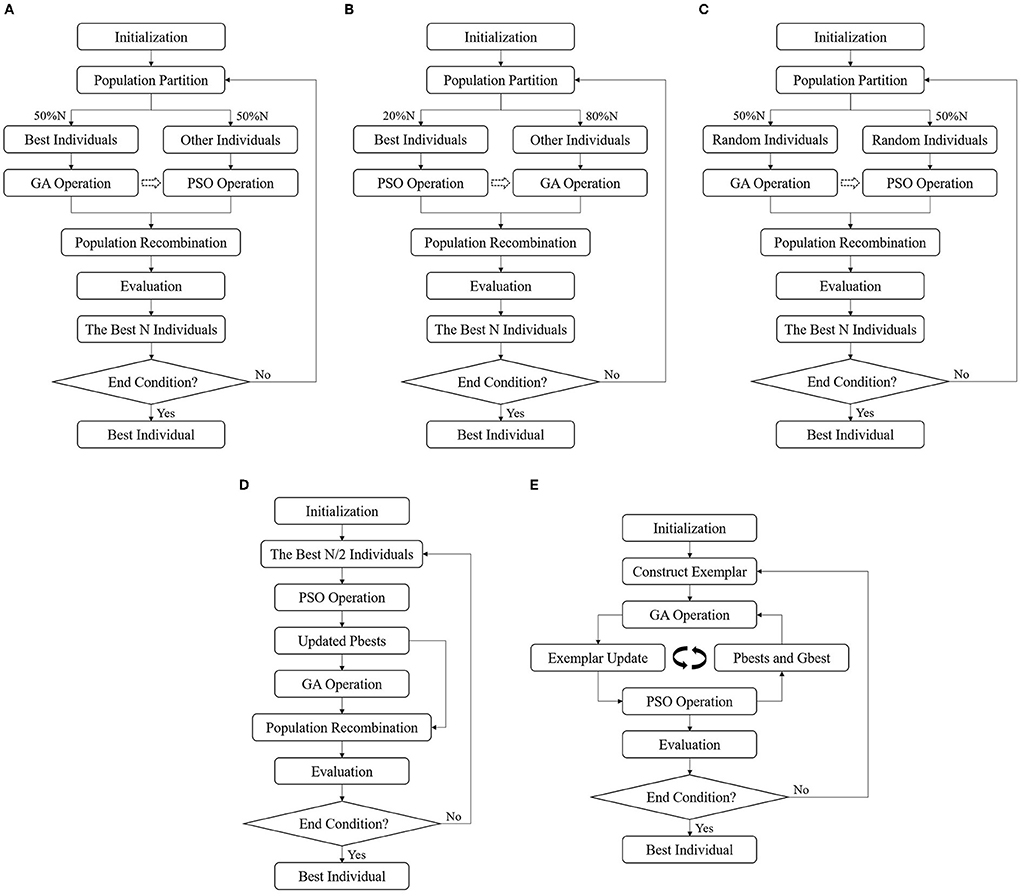
Figure 6. The paradigms of five hybrid algorithms. (A) pGAPSO-I: the best 50% individuals were assigned to GA; (B) pGAPSO-II: the best 20% individuals were allocated to PSO; (C) pGAPSO-III: the individuals were randomly distributed to GA and PSO with equal chance; (D) sPSOGA: PSO was first executed and then GA was applied; (E) sGAPSO: GA was implemented before PSO.
Serial algorithms
The sequence of GA and PSO may vary as the population is firstly transferred to GA or PSO.
In particular, by mimicking the maturing phenomenon in nature, serial PSO-GA (sPSOGA) adopts half of the best-performing individuals for updating by PSO, whereas the other half is discarded. The updated Pbest individuals are then used for GA operation to generate better offspring. Both Pbest individuals and their offspring constitute the next population. The paradigm of sPSOGA is shown in Figure 6D.
Alternatively, inspired by the foraging behavior of birds, which is influenced by genetic control and learned from peers (29), GA was implemented before PSO (serial GA-PSO, sGAPSO): GA was first implemented using Pbest and Gbest to construct exemplars, which were then used for PSO operation to overcome premature convergence, as shown in Figure 6E.
Parametric setting
The maximum number of iterations was 200 for all algorithms. The population size N was 50 because previous studies demonstrated that population size close to the dimension of the problem (52 in this study) worked well (30). The parameters of GA and PSO were adopted from previous studies (29, 31) and used for optimizing real-life problems.
Evaluation
The number of participants correctly classified as patients (TP) and healthy controls (TN) and then incorrectly classified as patients (FP) and healthy controls (FN) were calculated. The classification accuracy, sensitivity and specificity were defined as
The accuracy/number of channels were subjected to two-way (feature × optimizer) analysis of variance (ANOVA). The variable “feature” included three levels: time-domain feature, FC feature, and wavelet feature. The variable “optimizer” consisted of seven levels: GA, PSO, pGAPSO-I/II/III, sGAPSO, and sPSOGA. Bootstrap was used for statistical inferences if normal distribution with equal variance was not achieved (32). When a statistically significant difference was detected, multiple comparisons were performed for each factor. Bonferroni correction was applied to minimize the likelihood of a type I error. SPSS 21.0 (IBM, Endicott, NY, USA) was used for statistical analysis in the study.
Implementation
The parallel computing strategy of MATLAB was employed to reduce the calculation time. Codes of GA and PSO were adopted from the Wrapper-Feature-Selection-Toolbox (33). The in-house codes for the parallel and serial hybrid algorithms were available online (https://github.com/Xiadonn/Channel-Reduction-of-fNIRS). SVM was realized using the LIBSVM library, and the parameters of SVM were determined by performing a grid search (34). Two units of Intel Xeon CPU E5-2640 v4 @ 2.40GHz (20 cores in total) with 64-GB memory involved in the calculations.
Results
Performance of different features and optimizers
Table 1 shows the accuracy and the number of channels obtained using different features and optimizers. The optimized channels of the best results obtained by different features and optimizers are detailed in Table 2. Figure 7 depicts the overlay heatmap of these channels according to the number of their occurrences. The best results were obtained by GA and wavelet feature, with the highest accuracy of 87.00% by using 16 channels. Furthermore, the number of channels was reduced to eight, and an accuracy of 86.50% was achieved by using pGAPSO-I on the time-domain feature. Table 3 shows the sensitivity and specificity by different features and optimizers. The comparison for sensitivity and specificity by channel optimization is in Table 4. It was found that accuracy, sensitivity and specificity were improved by channel optimization.
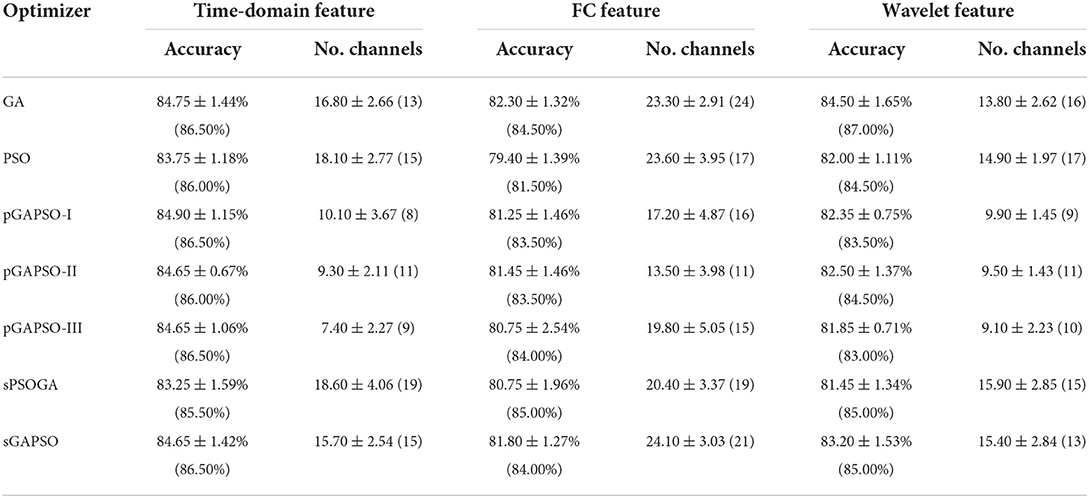
Table 1. Accuracy and the number of channels of different features and optimizers by 10-fold cross-validation, with the best results in the parathesis.
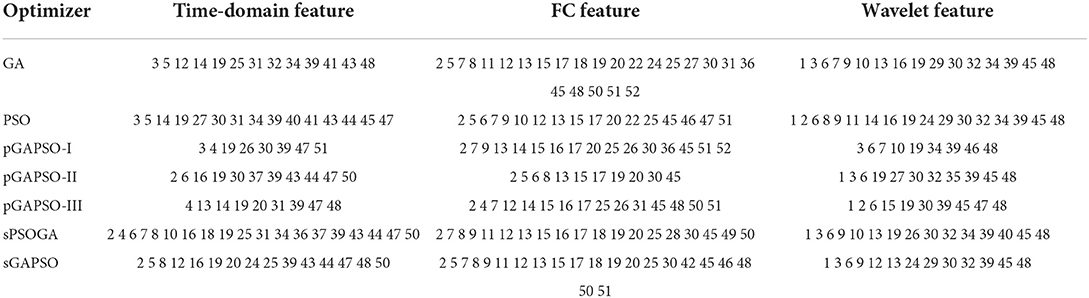
Table 2. The specific channels corresponding to the best results obtained by different features and optimizers.
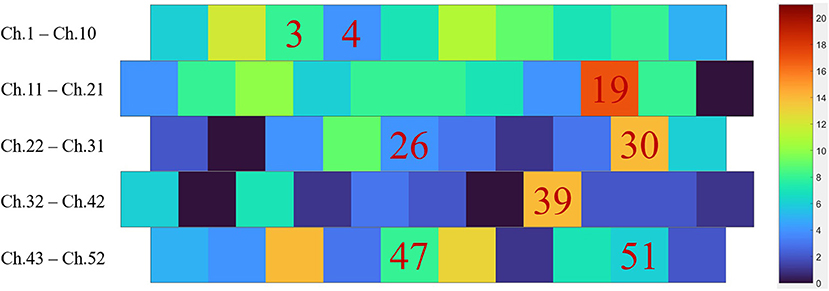
Figure 7. The overlay heatmap of the channels in Table 2 according to the number of their occurrences. The specific 8 channels of the optimal combination were marked.
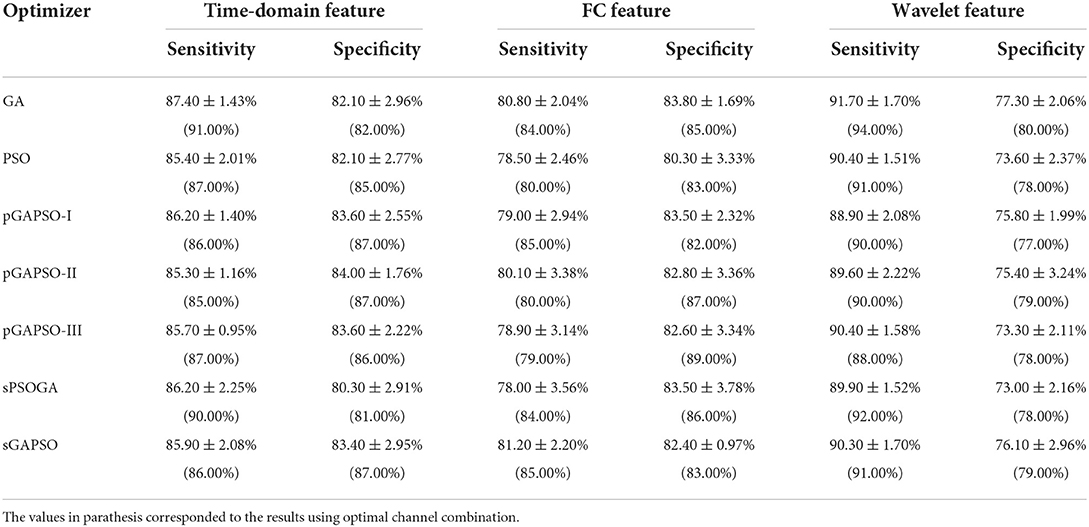
Table 3. Sensitivity and specificity of different features and optimizers by 10-fold cross-validation.
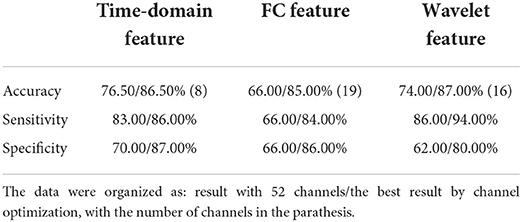
Table 4. Comparison of the 10-fold cross-validation results using different features before and after channel optimization.
Statistical analysis of accuracy with different features and optimizers
As the interaction between the feature and optimizer was not statistically significant (F = 1.427, p = 0.156, η2 = 0.083), the additive model was used for statistical analysis of classification accuracy. Results showed that both feature (F = 92.215, p < 0.001, η2 = 0.479) and optimizer (F = 8.476, p < 0.001, η2 = 0.202) significantly affected the accuracy. Among three features, the time-domain feature performed better than the wavelet feature (p < 0.001, mean difference (MD) = 1.821%), which, in return, performed better than the FC feature (p < 0.001, MD = 1.450%). In the case of optimizers, GA performed better than PSO (p < 0.001, MD = 2.133%), pGAPSO-III (p = 0.003, MD = 1.433%), and sPSOGA (p < 0.001, MD = 2.033%), while no significant difference was noted between GA and pGAPSO-I/II (p = 0.134/0.174) and between GA and sGAPSO (p = 1.000). sGAPSO performed significantly better than PSO (p = 0.001, MD = 1.500%) and sPSOGA (p = 0.004, MD = 1.400%), and no significant difference was found between sGAPSO and pGAPSO-I/II (p = 1.000 for both) and between sGAPSO and pGAPSO-III (p = 0.656). No significant difference was observed between sPSOGA and PSO (p = 1.000) and between sPSOGA and pGAPSO-I/II/III (p = 0.134/0.102/1.000). No significant difference was noted between pGAPSO-I/II/III (p = 1.000 for all). However, pGAPSO-II performed significantly better than PSO (p = 0.044, MD = 1.150%), and no significant difference was found between PSO and pGAPSO-I/III (p = 0.058/1.000).
In conclusion, the time-domain feature yielded the best accuracy, followed by the features from wavelet and FC. GA, pGAPSO-II, and sGAPSO exhibited similar performances in terms of accuracy, outperforming PSO, pGAPSO-I/III, and sPSOGA.
Statistical analysis of the number of channels between different features and optimizers
As the interaction between the feature and optimizer was significant (F = 3.588, p < 0.001, η2 = 0.186), the interaction model was applied for statistical analysis of the number of channels. Both feature (F = 121.452, p < 0.001, η2 = 0.562) and optimizer (F = 39.280, p < 0.001, η2 = 0.555) significantly influenced the number of channels. Among different features, FC feature utilized more channels than time-domain and wavelet features (p < 0.001 for both; MD = 6.56 and 7.63, respectively), and no significant difference was observed between time-domain and wavelet features (p = 0.134). No significant difference was found between the serial hybrid algorithm and GA and between the serial hybrid algorithm and PSO (p = 1.000 for both), while all of them required much more channels than pGAPSO-I/II/III (p < 0.001, MD ≥ 5.57). No significant difference was noted between pGAPSO-I and II (p = 0.946) and between pGAPSO-I/II and III (p = 1.000 for both).
To summarize, channel reduction by using time-domain and wavelet features was similar, and both of them were superior to the FC feature. The ability of channel reduction by pGAPSO-I/II/III was similar and outperformed the other optimizers.
Discussion
Accuracy achieved using different features and optimizers
Temporal average, pair-wise FC, and wavelet feature are shown in Figures 8–10, respectively. The results were averaged for the HCs and SZs during the VFT. The reduced activation within SZs was salient in time-domain and wavelet features. The results were consistent with hypofrontality (reduced frontal cortical activation), which is frequently reported in schizophrenia (35). This has been demonstrated by many practices as the primary hemodynamic effect was widely used in identifying schizophrenia. In contrast, FC measured the regional and interregional interactions. We hypothesized that SZs were incapable of modulating the segregation and integration of hemodynamic activities from various brain regions, seemingly indiscernible compared to time-domain and wavelet features (Figure 9 vs. Figures 8, 10). Moreover, the difference between HCs and SZs in terms of wavelet features was significant, resulting in the analysis based on wavelet features yielding the highest accuracy.
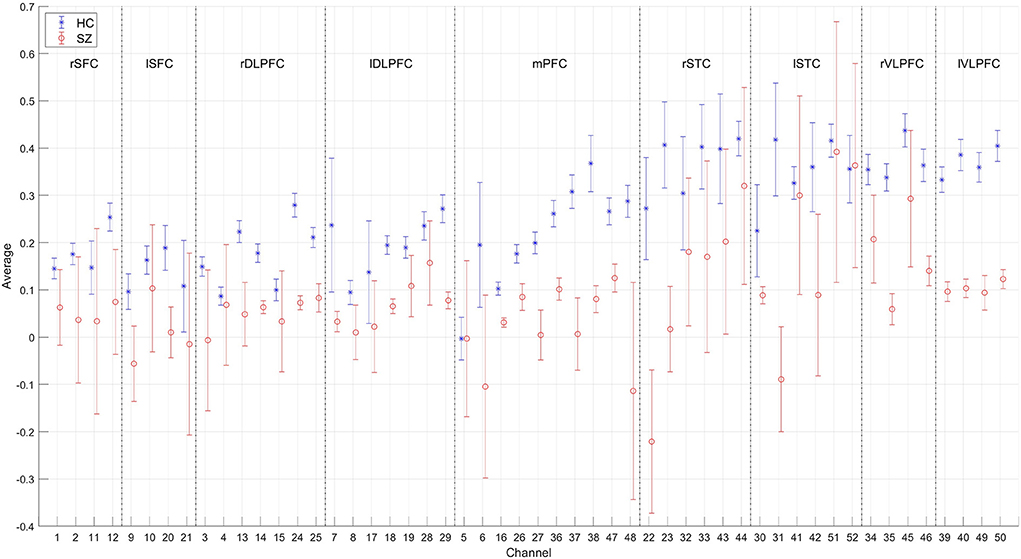
Figure 8. Time-domain feature of 52 channels averaged for the HCs and SZs during the VFT, respectively. The error bars were drawn with standard errors.
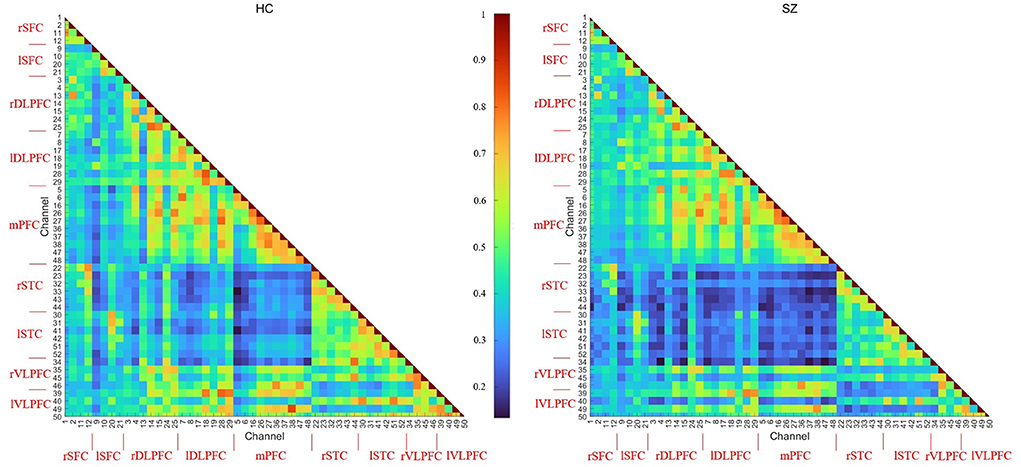
Figure 9. FC feature of 52 channels averaged for the HCs and SZs during the VFT, respectively.
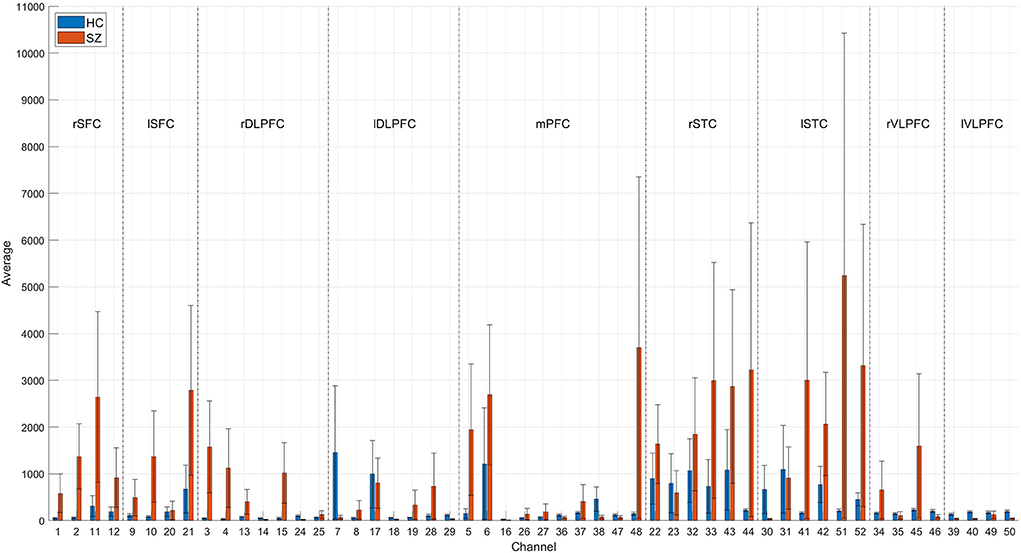
Figure 10. Wavelet feature of 52 channels averaged for the HCs and SZs during the VFT, respectively. The error bars were drawn with standard errors.
Both GA and PSO are based on nature-inspired stochastic searching techniques. GA is popular for its superior global searching ability and PSO for its local exploration ability. However, GA and PSO have certain limitations, such as a lack of diversity resulting in a suboptimal solution or a slow convergence rate (30). In this study, GA and GA-dominant (pGAPSO-II and sGAPSO) optimizers exhibited superior performances than PSO-dominant optimizers in terms of accuracy, indicating that the search volume might contain many local optima, thus being liable to trap the PSO particles during local exploration. A previous study substantiated this assumption: the discriminating ability achieved by signals from an individual channel was rather similar; for example, the highest accuracy of the first five channels ranged from 77.50 to 82.50% (12). Thus, different combinations can achieve similar performances. Serial algorithms performed worse compared with parallel algorithms. This can be attributed to the PSO process leading to premature convergence of the individuals, which can be avoided in parallel algorithms, or the diversity produced by GA getting obscured by the follow-up PSO step (36).
Parallel algorithms achieved higher accuracy compared to GA while using fewer channels, thereby showing the importance of incorporating PSO in the optimizer because it facilitates local exploration in a feature hyperspace comprising very subtle differences.
The analysis provided insights on future work of discriminating schizophrenia with fewer fNIRS channels during a VFT by using time-domain/wavelet features and evolutional algorithm-dominated parallel algorithms while achieving an overall accuracy comparable to that of contemporary 52-channel fNIRS [70–90% (12–14, 37–40)]. Furthermore, Table 5 lists the detailed comparison between this work and similar studies aiming at channel reduction. We achieved an accuracy of 86.50% with 8 channels by using pGAPSO-I, SVM, and time-domain average features derived from oxy-Hb signals during the VFT, outperforming other studies. This result demonstrates the effectiveness of discriminating SZs and HCs with fewer channels, promoting the application of portable fNIRS devices in clinical scenarios. By then, for people with developmental dyslexia/specific language impairment the Structured Clinical Interview for DSM-IV will be used for co-diagnosis.
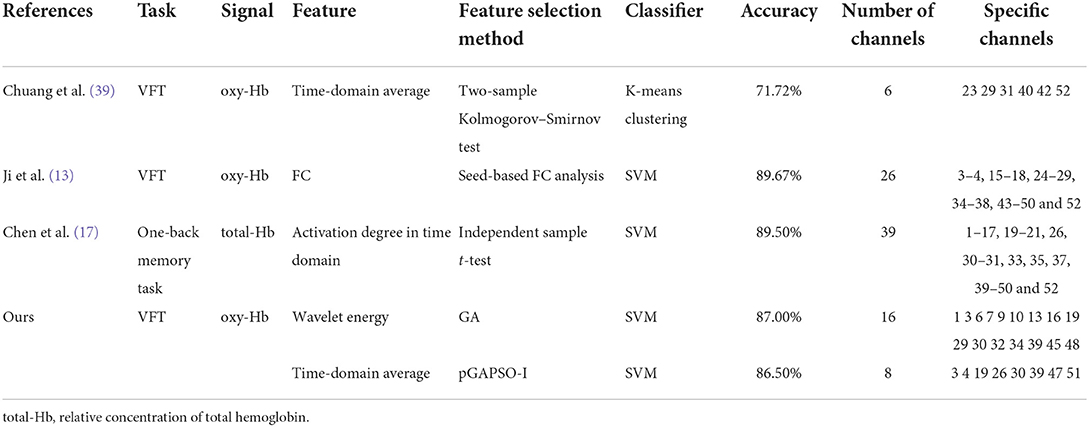
Table 5. Comparison between this study and similar 52-channel fNIRS studies aiming at channel reduction in schizophrenic identification.
Tables 3, 4 indicates enhanced classification performance by optimization. It could be attributed to the elimination of the irrelevant features (e.g., noise, outliers, redundant features), which affected the system performance (41).
Optimized channel combinations
The best channel sets (Table 2) varied for different features and optimizers, but some common points existed. First, channels in lDLPFC and mPFC were manifested in every combination; in particular, most cases contained no less than two channels in mPFC, with one exception (sPSOGA on FC feature). Second, lDLPFC acted as key nodes in FC analysis because more than two channels in lDLPFC were included in the results of the analysis. Third, lDLPFC, mPFC, and rDLPFC appeared in most of the cases (with the exception of pGAPSO-II in the time-domain feature). Fourth, channels in ISTC were found in most of the cases (with exceptions of sGAPSO in the time-domain feature and pGAPSO-I in the wavelet feature), while channels in lVLPFC were missing in FC analysis (PSO and pGAPSO-I/II). The results were consistent with the neurophysiological function of the individual cortex; for example, mPFC plays an important role in decision making and short- and long-term memory (42). It coordinated bilateral DLPFC and VLPFC functions (43), which were recruited in cognitive control and self-control (44–46), response inhibition, and goal-appropriate response selection (47). Further, dysfunction in lDLPFC is related to the severity of schizophrenic symptoms and conceptual disorganization, which are not related to antipsychotic treatment (48). Therefore, it was reasonable to observe abnormalities in these cortices and the importance of lDLPFC as a key node for FC feature. In addition, because lSTC was critical for language ability (49), the dysfunction of this region could be manifested in the VFT. Remarkedly, its absence was observed only in two cases with mediocre accuracy (sGAPSO on the time-domain feature and pGAPSO-I on the wavelet feature). The abovementioned findings correlated with the cortical abnormalities of schizophrenia observed across different imaging modalities.
Limitations
This study has some limitations. Firstly, the staging of schizophrenia was not conducted due to the lack of labels on the stages of schizophrenia. Secondly, most of the parameters were adopted from previous studies and were not further fine-tuned. Further extensive tuning of the parameters can be conducted in future work.
Conclusion
In this paper, two nature-inspired optimizers, GA and PSO, as well as their parallel and serial hybrid combinations, were used to simplify the number of fNIRS channels employed for discriminating schizophrenia during a VFT. The optimization was conducted on time-domain, FC, and wavelet features of 52-channel fNIRS signals. By using the time-domain feature, pGAPSO-I, and SVM, we achieved an accuracy of 86.50% (ten-fold cross-validation) with 8 channels. Based on the results, the impact of specific features and optimizers on the classification results was discussed. Furthermore, the results provided insights into identifying patients with schizophrenia by using fewer channels, thus promoting the development of portable fNIRS diagnostic systems in low-resource environments.
Data availability statement
The original contributions presented in the study are included in the article/supplementary materials, further inquiries can be directed to the corresponding author/s.
Ethics statement
The studies involving human participants were reviewed and approved by the Ethics Committee of Peking University Sixth Hospital. The patients/participants provided their written informed consent to participate in this study.
Author contributions
TW and DX initiated and designed the study. WQ was responsible for data collection. DX implemented the codes, performed statistical analyses, and drafted the manuscript. TW revised the final version. All authors have approved the final version.
Funding
This study was supported in part by grants from the National Natural Science Foundation Project (No. 61971445) and the National Key Research and Development Program of China (Nos. 2019YFF0216302 and 2018YFC1314200).
Acknowledgments
We would like to thank all the participants enrolled in this study.
Conflict of interest
The authors declare that the research was conducted in the absence of any commercial or financial relationships that could be construed as a potential conflict of interest.
Publisher's note
All claims expressed in this article are solely those of the authors and do not necessarily represent those of their affiliated organizations, or those of the publisher, the editors and the reviewers. Any product that may be evaluated in this article, or claim that may be made by its manufacturer, is not guaranteed or endorsed by the publisher.
Supplementary material
The Supplementary Material for this article can be found online at: https://www.frontiersin.org/articles/10.3389/fpsyt.2022.939411/full#supplementary-material
References
2. Revheim N, Corcoran CM, Dias E, Hellmann E, Martinez A, Butler PD, et al. Reading deficits in schizophrenia and individuals at high clinical risk: relationship to sensory function, course of illness, and psychosocial outcome. Am J Psychiatry. (2014) 171:949–59. doi: 10.1176/appi.ajp.2014.13091196
3. Arnott W, Sali L, Copland D. Impaired reading comprehension in schizophrenia: evidence for underlying phonological processing deficits. Psychiatry Res. (2011) 187:6–10. doi: 10.1016/j.psychres.2010.11.025
4. Whitford V, O'Driscoll GA, Pack CC, Joober R, Malla A, Titone D. Reading impairments in schizophrenia relate to individual differences in phonological processing and oculomotor control: evidence from a gaze-contingent moving window paradigm. J Exp Psychol Gen. (2013) 142:57–75. doi: 10.1037/a0028062
5. Ho CS, Chan DW, Lee SH, Tsang SM, Luan VH. Cognitive profiling and preliminary subtyping in Chinese developmental dyslexia. Cognition. (2004) 91:43–75. doi: 10.1016/S0010-0277(03)00163-X
6. Ho CS, Chan DW, Chung KK, Lee SH, Tsang SM. In search of subtypes of Chinese developmental dyslexia. J Exp Child Psychol. (2007) 97:61–83. doi: 10.1016/j.jecp.2007.01.002
7. Shu H, McBride-Chang C, Wu S, Liu H. Understanding Chinese developmental dyslexia: Morphological awareness as a core cognitive construct. J Educ Psychol. (2006) 98:122–33. doi: 10.1037/0022-0663.98.1.122
8. Siok WT, Spinks JA, Jin Z, Tan LH. Developmental dyslexia is characterized by the co-existence of visuospatial and phonological disorders in Chinese children. Curr Biol. (2009) 19:R890–2. doi: 10.1016/j.cub.2009.08.014
9. Dieler AC, Tupak SV, Fallgatter AJ. Functional near-infrared spectroscopy for the assessment of speech related tasks. Brain Lang. (2012) 121:90–109. doi: 10.1016/j.bandl.2011.03.005
10. Cui X, Bray S, Reiss AL. Functional near infrared spectroscopy (NIRS) signal improvement based on negative correlation between oxygenated and deoxygenated hemoglobin dynamics. Neuroimage. (2010) 49:3039–46. doi: 10.1016/j.neuroimage.2009.11.050
11. Hong KS, Yaqub MA. Application of functional near-infrared spectroscopy in the healthcare industry: a review. J Innov Opt Health Sci. (2019) 12:1930012. doi: 10.1142/S179354581930012X
12. Li Z, Wang Y, Quan W, Wu T, Lv B. Evaluation of different classification methods for the diagnosis of schizophrenia based on functional near-infrared spectroscopy. J Neurosci Methods. (2015) 241:101–10. doi: 10.1016/j.jneumeth.2014.12.020
13. Ji X, Quan W, Yang L, Chen J, Wang J, Wu T. Classification of schizophrenia by seed-based functional connectivity using prefronto-temporal functional near infrared spectroscopy. J Neurosci Methods. (2020) 344:108874. doi: 10.1016/j.jneumeth.2020.108874
14. Yang J, Ji X, Quan W, Liu Y, Wei B, Wu T. Classification of schizophrenia by functional connectivity strength using functional near infrared spectroscopy. Front Neuroinform. (2020) 14:40. doi: 10.3389/fninf.2020.00040
15. Einalou Z, Maghooli K, Setarehdan SK, Akin A. Effective channels in classification and functional connectivity pattern of prefrontal cortex by functional near infrared spectroscopy signals. Optik. (2016) 127:3271–5. doi: 10.1016/j.ijleo.2015.12.090
16. Dadgostar M, Setarehdan SK, Shahzadi S, Akin A. Classification of schizophrenia using SVM via fNIRS. Biomed Eng App Bas C. (2018) 30:1850008. doi: 10.4015/S1016237218500084
17. Chen L, Li Q, Song H, Gao R, Yang J, Dong W, et al. Classification of schizophrenia using general linear model and support vector machine via fNIRS. Phys Eng Sci Med. (2020) 43:1151–60. doi: 10.1007/s13246-020-00920-0
18. Quan W, Wu T, Li Z, Wang Y, Dong W, Lv B. Reduced prefrontal activation during a verbal fluency task in Chinese-speaking patients with schizophrenia as measured by near-infrared spectroscopy. Prog Neuropsychopharmacol Biol Psychiatry. (2015) 58:51–8. doi: 10.1016/j.pnpbp.2014.12.005
19. American Psychiatric Association. Diagnostic and Statistical Manual of Mental Disorders. 4th Edition. Washington, DC: American Psychiatric Press. (2000).
20. Hoshi Y. Functional near-infrared spectroscopy: current status and future prospects. J Biomed Opt. (2007) 12:062106. doi: 10.1117/1.2804911
21. Yang D, Hong KS, Yoo SH, Kim CS. Evaluation of neural degeneration biomarkers in the prefrontal cortex for early identification of patients with mild cognitive impairment: an fNIRS study. Front Hum Neurosci. (2019) 13:317. doi: 10.3389/fnhum.2019.00317
22. Rosas-Romero R, Guevara E, Peng K, Nguyen DK, Lesage F, Pouliot P, et al. Prediction of epileptic seizures with convolutional neural networks and functional near-infrared spectroscopy signals. Comput Biol Med. (2019) 111:103355. doi: 10.1016/j.compbiomed.2019.103355
23. Molavi B, Dumont GA. Wavelet-based motion artifact removal for functional near-infrared spectroscopy. Physiol Meas. (2012) 33:259–70. doi: 10.1088/0967-3334/33/2/259
25. Kennedy J, Eberhart R. Particle swarm optimization. In: Proceedings of ICNN'95 - International Conference on Neural Networks. Perth, WA (1995) 4:1942–8.
26. Raine NE, Ings TC, Dornhaus A, Saleh N, Chittka L. Adaptation, genetic drift, pleiotropy, and history in the evolution of bee foraging behavior. Adv Stud Behav. (2006) 36:305–54. doi: 10.1016/S0065-3454(06)36007-X
27. Kao YT, Zahara E. A hybrid genetic algorithm and particle swarm optimization for multimodal functions. Appl Soft Comput. (2008) 8:849–57. doi: 10.1016/j.asoc.2007.07.002
28. Li WT, Shi XW, Hei YQ, Liu SF, Zhu J. A hybrid optimization algorithm and its application for conformal array pattern synthesis. IEEE Trans Antennas Propag. (2010) 58:3401–6. doi: 10.1109/TAP.2010.2050425
29. Gong Y, Li J, Zhou Y, Li Y, Chung HS, Shi YH, et al. Genetic Learning Particle Swarm Optimization. IEEE Trans Cybern. (2016) 46:2277–90. doi: 10.1109/TCYB.2015.2475174
30. Alander JT. On optimal population size of genetic algorithms. In: CompEuro 1992 Proceedings Computer Systems and Software Engineering. Hague (1992). p. 65–70.
31. Too J, Abdullah AR. A new and fast rival genetic algorithm for feature selection. J Supercomput. (2021) 77:2844–74. doi: 10.1007/s11227-020-03378-9
32. Hesterberg T. Bootstrap. Wiley Interdiscip Rev Comput Stat. (2011) 3:497–526. doi: 10.1002/wics.182
33. Too J,. Wrapper-Feature-Selection-Toolbox (2020). Available online at: https://github.com/JingweiToo/Wrapper-Feature-Selection-Toolbox (accessed December 9, 2020).
34. Chang CC, Lin CJ. LIBSVM a library for support vector machines. ACM T Intel Syst Tec. (2011) 2:1–27. doi: 10.1145/1961189.1961199
35. Salgado-Pineda P, Radua J, Sarro S, Guerrero-Pedraza A, Salvador R, Pomarol-Clotet E, et al. Sensitivity and specificity of hypoactivations and failure of de-activation in schizophrenia. Schizophr Res. (2018) 201:224–30. doi: 10.1016/j.schres.2018.06.013
37. Arbabshirani MR, Kiehl KA, Pearlson GD, Calhoun VD. Classification of schizophrenia patients based on resting-state functional network connectivity. Front Neurosci. (2013) 7:133. doi: 10.3389/fnins.2013.00133
38. Pina-Camacho L, Garcia-Prieto J, Parellada M, Castro-Fornieles J, Gonzalez-Pinto AM, Bombin I, et al. Predictors of schizophrenia spectrum disorders in early-onset first episodes of psychosis: a support vector machine model. Eur Child Adolesc Psychiatry. (2015) 24:427–40. doi: 10.1007/s00787-014-0593-0
39. Chuang CC, Nakagome K, Pu S, Lan TH, Lee CY, Sun CW. Discriminant analysis of functional optical topography for schizophrenia diagnosis. J Biomed Opt. (2014) 19:011006. doi: 10.1117/1.JBO.19.1.011006
40. Song H, Chen L, Gao R, Bogdan IIM, Yang J, Wang S, et al. Automatic schizophrenic discrimination on fNIRS by using complex brain network analysis and SVM. BMC Med Inform Decis Mak. (2017) 17:166. doi: 10.1186/s12911-017-0559-5
41. Nguyen MH, Torre F. Optimal feature selection for support vector machines. Pattern Recogn. (2010) 43:584–91. doi: 10.1016/j.patcog.2009.09.003
42. Euston DR, Gruber AJ, Mcnaughton BL. The role of medial prefrontal cortex in memory and decision making. Neuron. (2012) 76:1057–70. doi: 10.1016/j.neuron.2012.12.002
43. Peng K, Steele SC, Becerra L, Borsook D. Brodmann area 10: collating, integrating and high level processing of nociception and pain. Prog Neurobiol. (2018) 161:1–22. doi: 10.1016/j.pneurobio.2017.11.004
44. Hare TA, Camerer CF, Rangel A. Self-control in decision-making involves modulation of the vmPFC valuation system. Science. (2009) 324:646–8. doi: 10.1126/science.1168450
45. MacDonald AW, Cohen JD, Stenger VA, Carter CS. Dissociating the role of the dorsolateral prefrontal and anterior cingulate cortex in cognitive control. Science. (2000) 288:1835–8. doi: 10.1126/science.288.5472.1835
46. Miller EK, Cohen JD. An integrative theory of prefrontal cortex function. Annu Rev Neurosci. (2001) 24:167–202. doi: 10.1146/annurev.neuro.24.1.167
47. Aron AR, Robbins TW, Poldrack RA. Inhibition and the right inferior frontal cortex. Trends Cogn Sci. (2004) 8:170–7. doi: 10.1016/j.tics.2004.02.010
48. van Veelen NM, Vink M, Ramsey NF, Kahn RS. Left dorsolateral prefrontal cortex dysfunction in medication-naive schizophrenia. Schizophr Res. (2010) 123:22–9. doi: 10.1016/j.schres.2010.07.004
Keywords: schizophrenia, functional near-infrared spectroscopy (fNIRS), verbal fluency task (VFT), metaheuristic algorithms, support vector machine (SVM)
Citation: Xia D, Quan W and Wu T (2022) Optimizing functional near-infrared spectroscopy (fNIRS) channels for schizophrenic identification during a verbal fluency task using metaheuristic algorithms. Front. Psychiatry 13:939411. doi: 10.3389/fpsyt.2022.939411
Received: 09 May 2022; Accepted: 27 June 2022;
Published: 18 July 2022.
Edited by:
Tianhong Zhang, Shanghai Jiao Tong University, ChinaReviewed by:
Wei Yanyan, Shanghai Jiao Tong University, ChinaTian Hong, Shanghai Jiao Tong University, China
Qinglin Li, University of Tübingen, Germany
Copyright © 2022 Xia, Quan and Wu. This is an open-access article distributed under the terms of the Creative Commons Attribution License (CC BY). The use, distribution or reproduction in other forums is permitted, provided the original author(s) and the copyright owner(s) are credited and that the original publication in this journal is cited, in accordance with accepted academic practice. No use, distribution or reproduction is permitted which does not comply with these terms.
*Correspondence: Tongning Wu, d3V0b25nbmluZ0BjYWljdC5hYy5jbg==
†These authors have contributed equally to this work and share first authorship