 Xiaoxu Ding1
 Li Qi
Li Qi Yu Chen
- 1Department of Otorhinolaryngology, Shengjing Hospital Affiliated With China Medical University, Shenyang, Liaoning, China
- 2Department of Otorhinolaryngology, The First Hospital of China Medical University, Shenyang, Liaoning, China
Background: Obstructive sleep apnea (OSA) has been reported to affect cardiometabolic diseases. However, whether such association is causal is still unknown. Here, we attempt to explore the effect of OSA on type 2 diabetes (T2D), nonalcoholic fatty liver disease (NAFLD) and coronary heart disease (CHD).
Methods: Genetic variants associated with OSA were requested from a published genome-wide association study (GWAS) and those qualified ones were selected as instrumental variables (IV). Then, the IV-outcome associations were acquired from T2D, NAFLD and CHD GWAS consortia separately. The Mendelian randomization (MR) was designed to estimate the associations of genetically-predicted OSA on T2D, NAFLD and CHD respectively, using the inverse-variance weighted (IVW) method. We applied the Bonferroni method to adjust the p-value. Besides, MR-Egger regression and weighted median methods were adopted as a supplement to IVW. The Cochran's Q value was used to evaluate heterogeneity and the MR-Egger intercept was utilized to assess horizontal pleiotropy, together with MR-PRESSO. The leave-one-out sensitivity analysis was carried out as well.
Results: No MR estimate reached the Bonferroni threshold (p < 0.017). Although the odds ratio of T2D was 3.58 (95% confidence interval (CI) [1.06, 12.11], IVW-p-value = 0.040) using 4 SNPs, such causal association turned insignificant after the removal of SNP rs9937053 located in FTO [OR = 1.30 [0.68, 2.50], IVW p = 0.432]. Besides, we did not find that the predisposition to OSA was associated with CHD [OR = 1.16 [0.70, 1.91], IVW p = 0.560] using 4 SNPs.
Conclusion: This MR study reveals that genetic liability to OSA might not be associated with the risk of T2D after the removal of obesity-related instruments. Besides, no causal association was observed between NAFLD and CHD. Further studies should be carried out to verify our findings.
Introduction
As a kind of severe sleep disorder, obstructive sleep apnea (OSA) is usually denoted as nocturnally repetitive episodes of breathing stops caused by upper airway collapse, resulting in mild to severe sleep deprivation and dysregulation of breathing, sleep, and blood pressure. It was estimated that at least 9% of the population suffered from it and its prevalence is increasing since 35% of individuals over 60 years of age suffer from it (1). Numerous patients remain underdiagnosed despite several available diagnostic tools and treatments (2). Continuous OSA status is usually accompanied by serious comorbidities through systemic inflammation and intermittent hypoxia (3). Besides, OSA is affected by multiple risk factors such as obesity, male sex, family history of OSA, high age and problems of upper airway flow or jaw anatomy (4).
Consequently, OSA burdens the public with increased mortality (5), which is caused by many cardiometabolic comorbidities including an increased risk of coronary heart disease (CHD), nonalcoholic fatty liver disease (NAFLD) (6), type 2 diabetes (T2D) and its complications (7, 8). Therein, the interplay between T2D and NAFLD has been reported where the genetically-predicted NAFLD could increase the risk of T2D and vice versa (9). Also, NAFLD and T2D could increase the risk of CHD as well (10, 11). However, whether the observed association is causal is still unknown and can be biased by potential confounders like socioeconomic status.
As a popular method of causal inference in molecular epidemiology, Mendelian randomization (MR) uses genetic variants as instrumental variables to detect the existence of causation and estimate its magnitude (12). It can simulate a randomized trial as the allocation of genetic variants at conception is random. Nowadays, it has made great contributions to causal inference, such as ruling out the association of genetically-predicted serum HDL with the risk of myocardial infarction (13). Thanks to the accumulating genome-wide association studies (GWAS), the summary statistics of the association between genetic variants and phenotype can be accessed much easier. However, it is still unknown whether OSA can lead to deleterious consequences in a causal setting. A recent MR study indicated that there was no causal association between sleep duration and glycemic traits (14), and our recent publication suggested that genetic susceptibility to OSA cannot affect the risk of Alzheimer's disease and Parkinson's disease (15). Additionally, a recent OSA GWAS only explored its causal relationship with body mass index (BMI) (16). Besides, there were no other MR studies focused on OSA.
We attempted to evaluate the associations of genetically-predicted OSA with T2D, CHD and NAFLD where OSA is the exposure and the remaining diseases are outcomes, hoping to disentangle their complex causal relationship.
Methods
Data description and study design
We retrieved data from the OSA GWAS using the FinnGen study (16). The GWAS summary statistics were extracted from it where 16,761 OSA patients and 201,194 controls were included in this FinnGen study. The nationwide health registries were used to identify OSA cases where the diagnosis of OSA was based on ICD-codes (ICD-10: G47.3, ICD-9: 3472A). The ICD-10 data were collected from the Finnish National Hospital Discharge Registry and the Causes of Death Registry. Several indicators were involved in diagnosing OSA, namely subjective symptoms, clinical examination and sleep registration applying AHI ≥ 5/h or respiratory event index (REI) ≥ 5/h. The GWAS analysis was performed using SAIGE, applying saddle point approximation (SPA) to calibrate unbalanced case-control ratios (17). Analyses were adjusted for age, sex, genotyping chip, genetic relationship and first 10 principal components.
We extracted IV for CHD from the Coronary ARtery DIsease Genome wide Replication and Meta-analysis (CARDIoGRAM) plus the Coronary Artery Disease (C4D) Genetics Consortium, with 60,801 cases and 123,504 controls adjusting for sex and age (18). The GWAS summary statistics of T2D were obtained from a European study with 62,892 cases and 596,424 controls, with adjustment of sex, age and study-specific information (19). The NAFLD GWAS consisted of 1,483 European NAFLD cases and 17,781 matched controls, adjusting for the first five principal components in multiple logistic regression (20).
Here, we appraise the effect of genetically-predicted OSA on three predefined outcomes, which consisted of three main previously-reported cardiometabolic comorbidities, including coronary heart disease, type 2 diabetes (21) and nonalcoholic fatty liver disease. There was no sample overlapping between exposure and outcome as the outcomes' GWAS data contained no FinnGen samples (22). For OSA cases, the median age was 58.9 years, the median BMI was 31.72 kg/m2, and the proportion of the males was 63.0%. For NAFLD cases, the median age was 50.1 years, the median BMI was 35.19 kg/m2 and the proportion of males was 52.7%. The samples of OSA, NAFLD and T2D were all of the European ancestry while the majority of CHD were of European ancestry (77%). Although we cannot give precise estimates on baseline characteristics of CHD and T2D, the two studies have adjusted for age, sex, and population stratification in the analyses. Thus, the bias caused by the imbalance of these distribution characteristics should not have a main impact on the MR results.
Instrumental variable selection
Three basic assumptions should be satisfied in MR analysis: (1) The genetic variant should have a strong link to exposure; (2) There are no other potential confounders associated with the genetic variant; (3) The association of the genetic variant with the outcome can only be mediated via the way of exposure (Figure 1). Five genetic variants were reported to be associated with OSA by Strausz et al. (16). Considering its low minor allele frequency (MAF = 0.005), the single nucleotide polymorphism (SNP) rs185932673 was removed in the subsequent analyses. Generally, hypothesis 2 for MR analysis is untestable since we cannot determine all the potential confounders. Thus, we searched all 4 SNPs' associations in the open GWAS database (https://gwas.mrcieu.ac.uk/) to identify potential confounded associations and found that the SNP rs9937053 was strongly associated with BMI. Besides, the SNP rs9937053 was an intron in FTO, a well-established gene associated with obesity (23), and this SNP was marginally associated with OSA after adjustment of BMI (adjusted p = 0.04). Thus, we considered performing MR analyses with or without it in our study to assess the impact of the obesity-associated gene on the results. Therein, we were mainly focused on the results of MR analysis without SNP rs9937053. All the remaining SNPs displayed a genome-wide significance (p < 5 × 10⁻⁸) and a high imputation quality (INFO > 0.9). When the information of one SNP is missing the outcome, we would use another SNP in high linkage disequilibrium with it as the proxy using a predefined threshold LD r2 > 0.8. It should be noted that only SNP rs10507084 remained significant after adjusting for BMI and a single IV-based MR analysis was conducted using it as well.
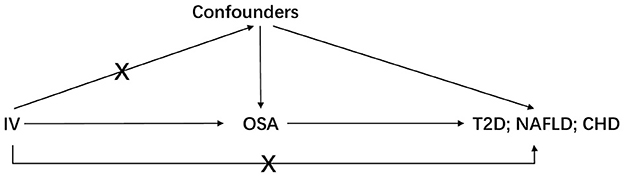
Figure 1. The basic assumptions of Mendelian randomization. IV is instrumental variable; OSA is obstructive sleep apnea; T2D is type 2 diabetes; NAFLD is nonalcoholic fatty liver disease; CHD is coronary heart disease.
Statistical analysis
Before MR analysis, each IV's F-statistic was calculated using the formula as follows: F = . Here, beta represents the effect size of SNP on exposure and se is its corresponding standard error (24).
Besides, the general F-statistic was calculated as well: F = . The N is the sample size of exposure, and k is the number of used IVs. R2 represents the exposure's genetic variance explained by IVs.
The Wald ratio estimation was used to calculate the association of genetically-predicted OSA with the outcome for each SNP and the inverse-variance weighted (IVW) method was utilized to synthesize each SNP's casual estimation. Cochran's Q value was used to assess the heterogeneity and we would adopt a multiplicative random effect (MRE) model if the heterogeneity exists. Otherwise, we would combine the results using a fixed effect model. Besides, two other methods, including MR-Egger and weighted median, would also be adopted as a supplement to IVW.
Horizontal pleiotropy is a major issue in MR analysis and it should be sophisticatedly addressed. In our study, two methods were adopted, namely, MR-Egger intercept (25) and Mendelian randomization pleiotropy residual sum and outlier (MR-PRESSO) (26). For the MR-Egger intercept, there should be no difference between 0 and it if no horizontal pleiotropy exists. If the intercept significantly differs from 0, we assume there is horizontal pleiotropy and the results should be corrected by MR-Egger regression and be interpreted carefully. The MR-PRESSO is an effective method to detect outliers that might introduce horizontal pleiotropy into MR analyses using the residual sum. The MR analysis was performed using the R package “TwoSampleMR” (27) and “MRPRESSO” (26).
Sensitivity analysis and power calculation
The sensitivity analysis was mainly carried out using a leave-one-out sensitivity analysis where each SNP was removed and the remaining SNPs were assumed as the IVs to estimate the associations of genetically-predicted exposure with the outcomes. If an SNP was detected as a driving IV obviously, we would drop it in the MR analysis. Such a “leave-one-out” method was used to judge whether the causal conclusion was robust to the outlier. This analysis was performed using the R package “TwoSampleMR” (27). We applied the mRnd to statistical power calculation (Power calculations for Mendelian Randomization) (https://cnsgenomics.shinyapps.io/mRnd/) (28).
Results
Four genetic variants were used as eligible IVs in this MR analysis (Table 1). The general and each IV's F were all greater than the empirical threshold 10.
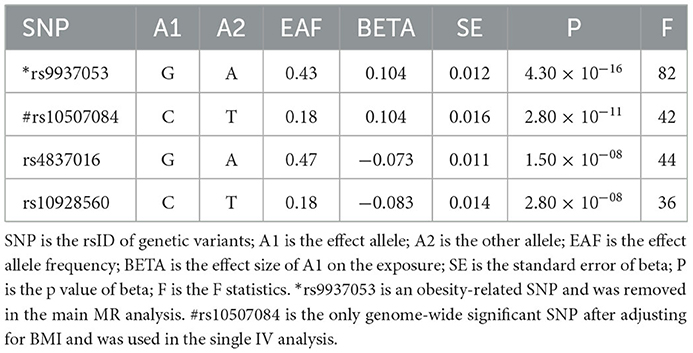
Table 1. Instrumental variables of obstructive sleep apnea.
In the main analysis, three SNPs were used, including rs10507084, rs4837016 and rs10928560. This analysis suggested genetic susceptibility to OSA cannot affect the risk of T2D [OR = 1.30 [0.68, 2.50], IVW p = 0.432], NAFLD [OR = 0.65 [0.18, 2.37], IVW p = 0.513] and CHD [OR = 0.93 [0.45, 1.91], IVW p = 0.842] (Supplementary Figures 1–3). The leave-one-out sensitivity analyses suggested that the SNP rs10928560 might drive the main estimates among the 3 SNPs (Supplementary Figures 1B, 3B).
The odds ratio of T2D was 3.58 [95% confidence interval (CI) [1.06, 12.11], IVW-p = 0.040] per 1-unit increase in log OR of OSA (Figures 2, 3A). From Figure 3A, the results of IVW and weighted median were similar while they were different from that of MR-Egger. However, there was significant heterogeneity (Cochrane's Q = 90.56, Q p = 1.66 × 10⁻¹⁹) and outliers were detected by MR-PRESSO. Besides, there was no pleiotropy by MR-Egger intercept (intercept = −0.19, se = 0.12, p = 0.252), thus, the results of IVW and weighted median should be more plausible. After the removal of outliers (SNP rs10928560 and rs9937053) in MR-PRESSO, the corrected OR was 2.16 [95%CI [1.08, 4.34], p = 0.030] per 1-unit increase in log OR of OSA. Also, the weighted median suggested a causal relationship between OSA and T2D [OR = 1.76 [1.15, 2.71], weighted median p = 0.010]. All the evidence indicated that the liability to OSA could elevate the risk of T2D.
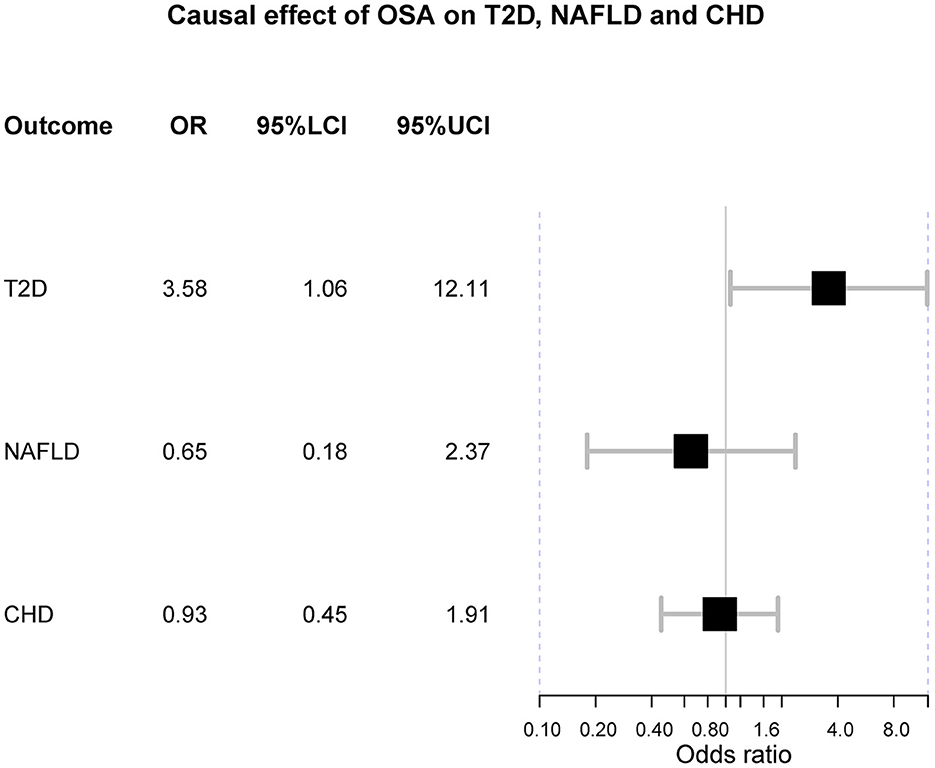
Figure 2. The forest plot of Mendelian randomization. OSA is obstructive sleep apnea; T2D is type 2 diabetes; NAFLD is nonalcoholic fatty liver disease; CHD is coronary heart disease; OR is odds ratio; 95%LCI is the lower limit of 95% confidence interval of OR; 95%UCI is the upper limit of 95% confidence interval of OR.
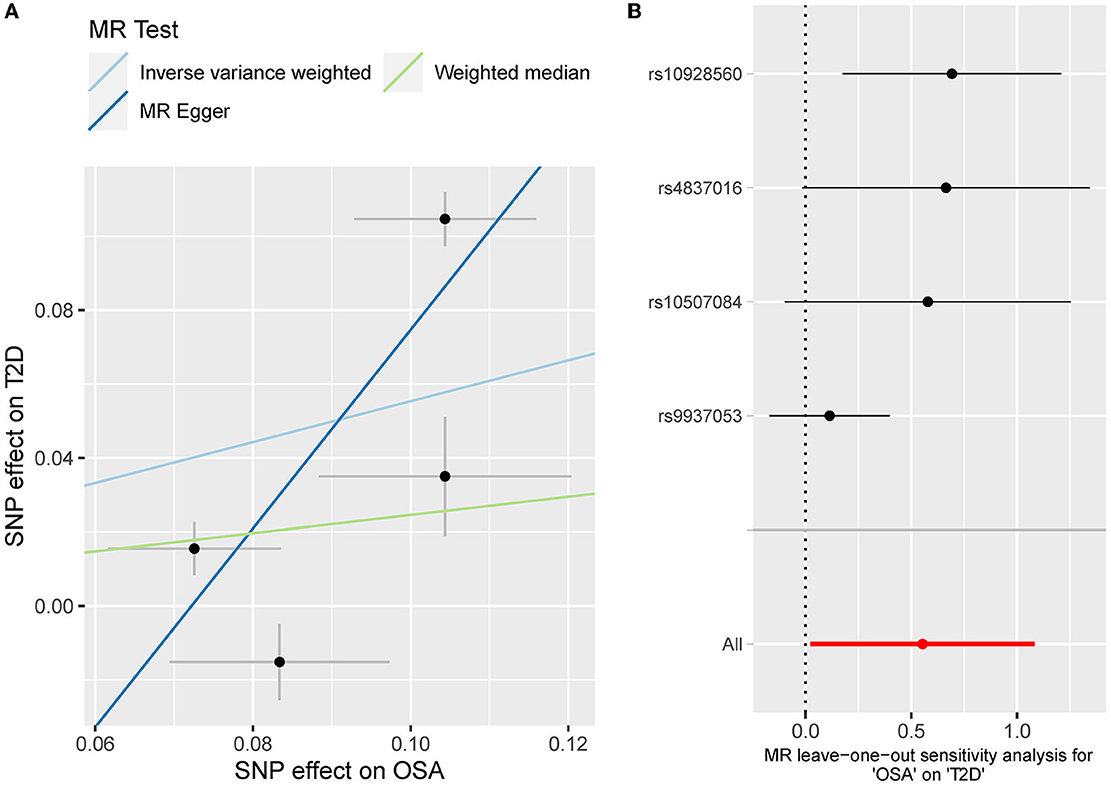
Figure 3. (A) The scatterplot of OSA-T2D results. Different colors represent different methods and each point is a single nucleotide polymorphism. The horizontal and vertical lines of each point represent the 95% confidence interval of the effect size. (B) The leave-one-out-sensitivity forest plot of OSA-T2D results.
Besides, the MR results indicated that genetically-predicted OSA could not be directly associated with the risk of NAFLD [OR = 1.57 [0.42, 5.82], IVW p = 0.501] (Figures 2, 4A) and CHD [OR = 1.16 [0.70, 1.91], IVW p = 0.560] (Figures 2, 5A). There was neither heterogeneity nor horizontal pleiotropy in OSA-NAFLD causal estimation (heterogeneity: Cochran's Q = 5.41, Q p = 0.144; pleiotropy: intercept = −0.24, se = 0.17, p = 0.302]. Also, no outliers were detected for it. While in OSA-CHD estimation, there was slight heterogeneity (Cochran's Q = 10.24, Q p = 0.017), and the corrected OR was 0.80 [95%CI [0.54, 1.20], p = 0.396] by MR-PRESSO. No horizontal pleiotropy was detected (intercept = −0.10, se = 0.04, p = 0.114).
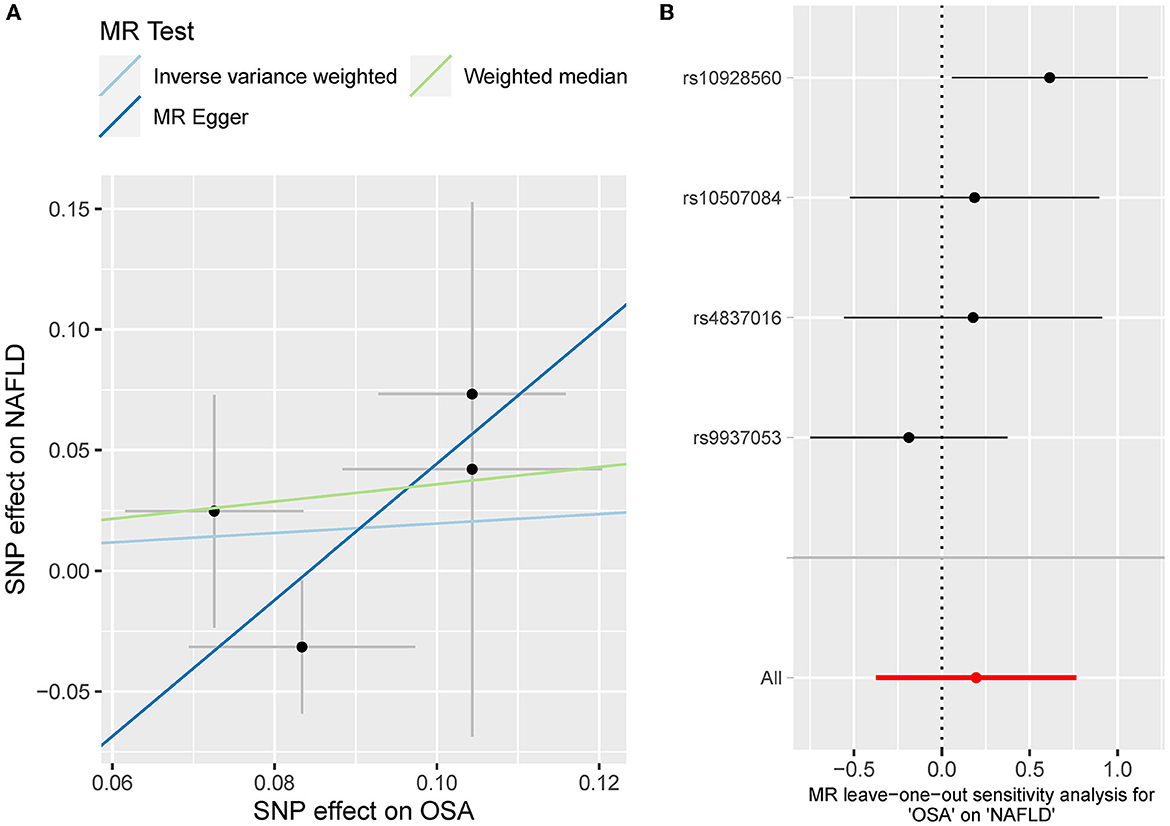
Figure 4. (A) The scatterplot of OSA-NAFLD results. Different colors represent different methods and each point is a single nucleotide polymorphism. The horizontal and vertical lines of each point represent the 95% confidence interval of the effect size. (B) The leave-one-out-sensitivity forest plot of OSA-NAFLD results.
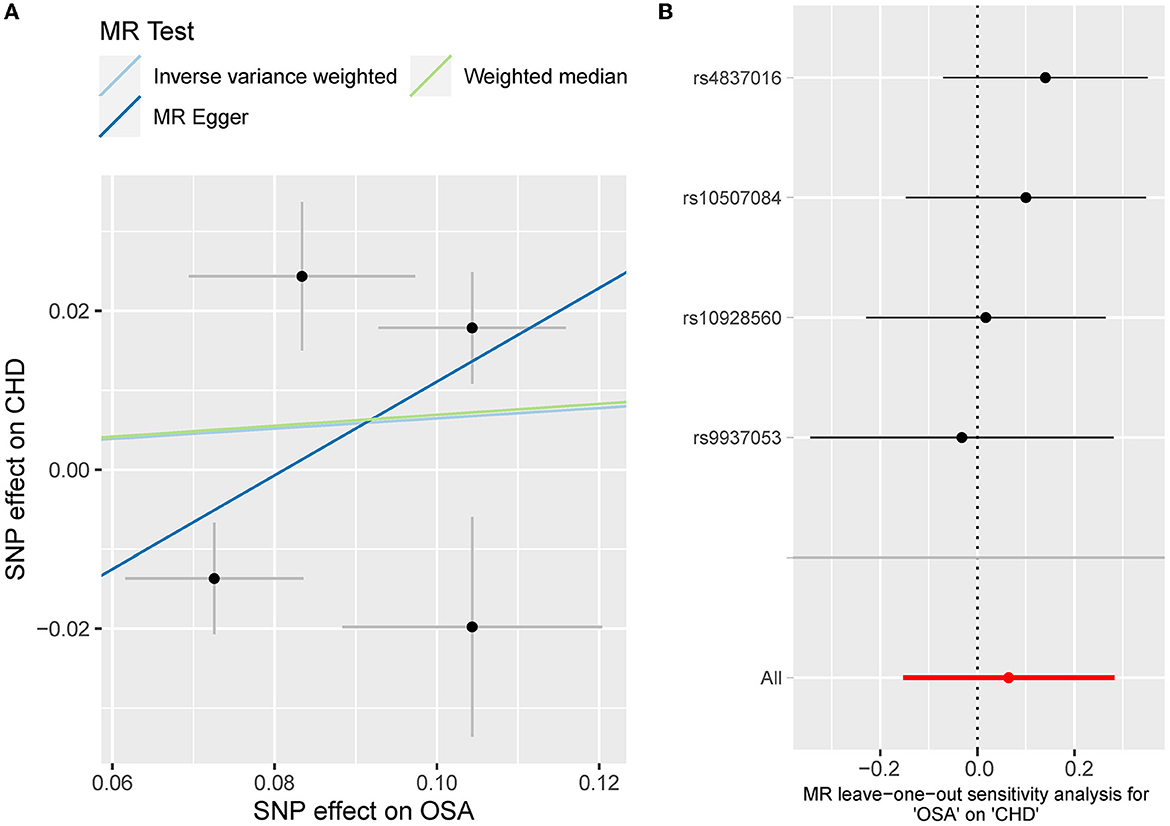
Figure 5. (A) The scatterplot of OSA-CHD results. Different colors represent different methods and each point is a single nucleotide polymorphism. The horizontal and vertical lines of each point represent the 95% confidence interval of the effect size. (B) The leave-one-out-sensitivity forest plot of OSA-CHD results.
After the removal of SNP rs9937053 located in FTO, the causal association with T2D turned insignificant [OR = 1.30 [0.68, 2.50], IVW p = 0.432]. No horizontal pleiotropy was observed (intercept = −0.01, se = 0.13, p = 0.960). However, there was heterogeneity (Cochrane's Q = 8.82, Q p = 0.012). And the weighted median also suggested a null association [OR = 1.42 [0.91, 2.21], weighted median p = 0.124]. Besides, no significant association was observed for CHD [OR = 0.93 [0.45, 1.91], IVW p = 0.842] and NAFLD [OR = 0.65 [0.18, 2.37], IVW p = 0.513]. No heterogeneity or horizontal pleiotropy was detected for OSA-CHD and OSA-NAFLD associations (Cochran's Q p > 0.05 and MR-Egger intercept p > 0.05). The single IV analysis revealed that genetic predisposition to OSA can increase the risk of T2D [OR = 1.36 [1.03, 1.80], p = 0.030] after adjustment of BMI while not for NAFLD [OR = 1.45 [0.21, 9.85], p = 0.704] and CHD [OR = 0.84 [0.66, 1.07], p = 0.153].
The leave-one sensitivity suggested that the SNP rs10928560 might drive the causal estimation in OSA-T2D (Figure 3B) and OSA-NAFLD (Figure 4B) since its association was different from that of the other 3 SNPs. After removing rs10928560, the genetic predisposition to OSA would increase the risk of NAFLD [OR = 4.11 [1.14, 14.85], IVW p = 0.031] and T2D [OR = 4.92 [1.50, 16.18], IVW p = 0.009] (Figures 6, 7). And the estimates of IVW and weighted median methods are similar. We did not find SNPs that could drive the results in OSA-CHD estimation (Figure 5B). All statistical powers were above 80%.
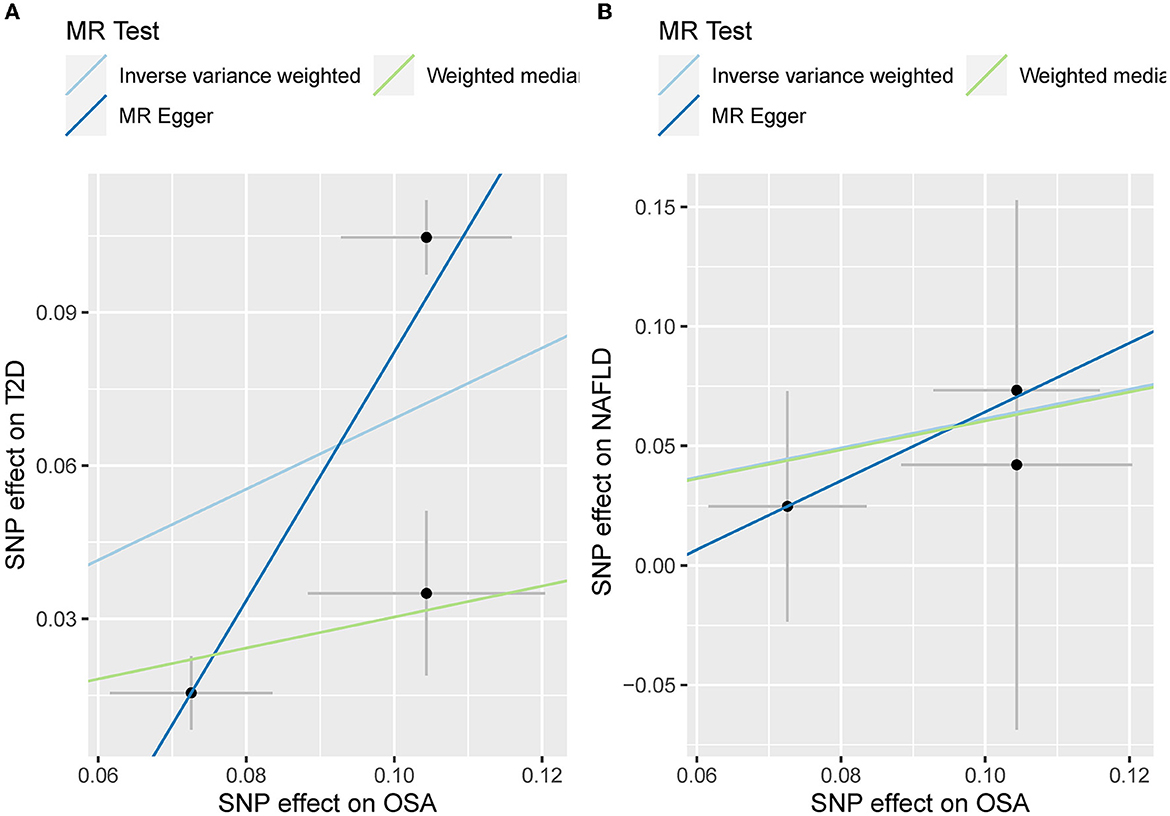
Figure 6. (A) The scatterplot of OSA-T2D results after removal of SNP rs10928560. Different colors represent different methods and each point is a single nucleotide polymorphism. The horizontal and vertical lines of each point represent the 95% confidence interval of the effect size. (B) The scatterplot of OSA-NAFLD results after removal of SNP rs10928560. Different colors represent different methods and each point is a single nucleotide polymorphism. The horizontal and vertical lines of each point represent the 95% confidence interval of the effect size.
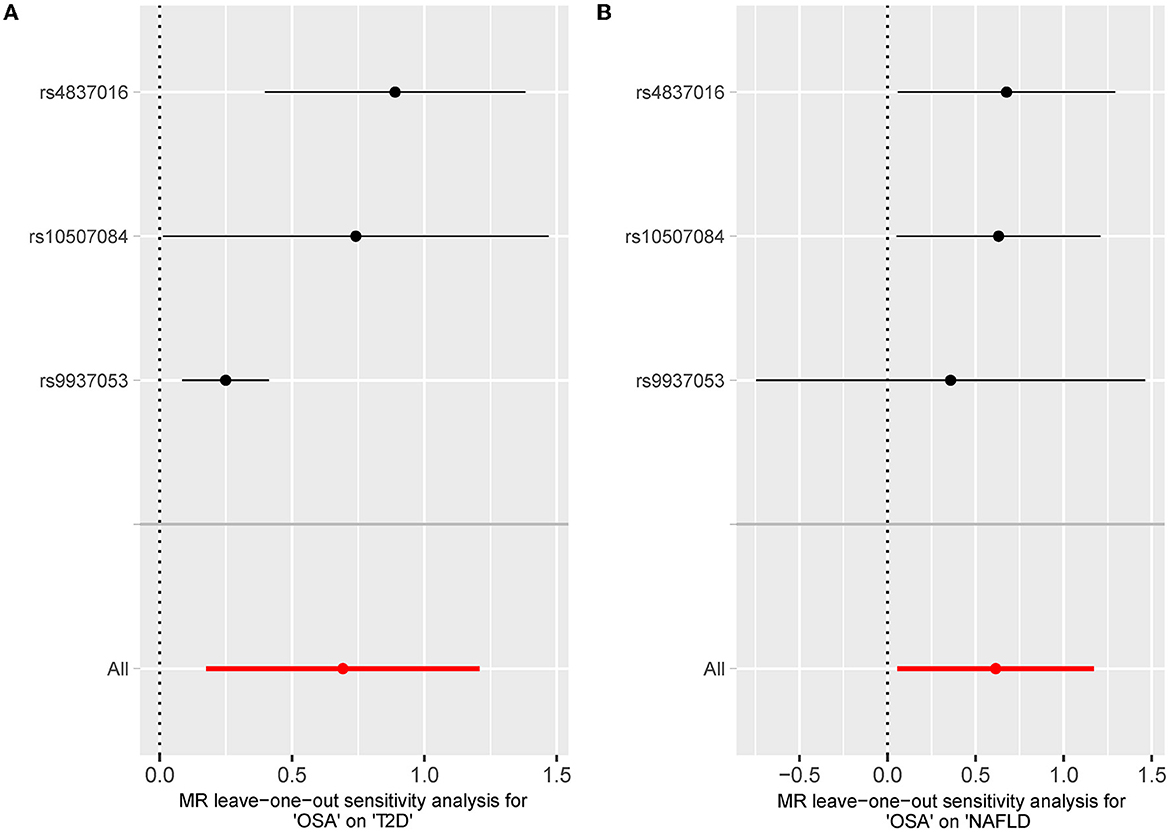
Figure 7. (A) The leave-one-out-sensitivity forest plot of OSA-T2D results after removal of SNP rs10928560. (B) The leave-one-out-sensitivity forest plot of OSA-NAFLD results after removal of SNP rs10928560.
Generally, we observed that genetic liability to OSA could increase the risk of T2D. However, such causation disappeared after the removal of SNP rs9937053 in FTO, an obesity-related gene. In leave-one-out sensitivity analysis, the genetic predisposition to OSA could elevate the risk of T2D and NAFLD after removing the driving SNP rs10928560. Besides, we did not discover any association between OSA and CHD. There was no other heterogeneity or horizontal pleiotropy detected in the analyses except the abovementioned.
Discussion
Our MR study rules out the associations of genetically-predicted OSA with the risk of T2D, NAFLD, and CHD in a robust way and suggests that obesity-related genes might confound previous observational findings.
A recent dose-response meta-analysis indicated that a linear association should exist between OSA and T2D, and such an association was still significant after the adjustment of BMI (29). However, our MR analysis did not find a robust association, suggesting the previous finding might be mediated by obesity as the OSA-T2D association turned insignificant after the removal of SNP rs9937053 in FTO, an obesity-related gene. The relationship between OSA and BMI has been well recognized where a shared genetic background of them was reported and obesity played (30) an important role in the initiation of OSA (16). It should be noted that obesity is not always linked to an increased risk of cardiometabolic diseases and that accounting for metabolically healthy obesity (31) may provide clearer results about the proposed pathophysiological relationships. This might account for the heterogeneity in the MR results and why the OSA-T2D association turned insignificant after the removal of SNP rs9937053 in FTO. However, we cannot separate the effects of metabolically healthy and unhealthy obesity due to the unavailability of individual-level data, which needs further exploration. A higher risk for OSA could lead to an increased level of glycated hemoglobin (HbA1c) (32), and many studies reported that sleep restriction, intermittent hypoxia, and sleep fragmentation could lead to compromised insulin sensitivity in healthy individuals (33–35). Moreover, experimental studies have shown that intermittent hypoxia and sleep fragmentation can cause β-cell dysfunction or β-cell death (36). Additionally, it was reported that OSA can increase the T2D risk via the alteration of circadian rhythm (37). The possible intermediary pathways include increased sympathetic activity, altered hypothalamic-pituitary-adrenal axis, increased oxidative stress, activation of inflammatory pathways, and altered levels of circulating adipokines (38).
Many studies have implicated that the association of OSA with the initiation and development of NAFLD is independent of obesity or other shared risk factors (6). A recent large meta-analysis confirmed the strong association between the severity of OSA and steatosis (39). And previous large meta-analysis demonstrated that OSA was associated with higher triglycerides, low-density lipoprotein (LDL), and total cholesterol concentrations, as well as lower HDL concentrations after analyzing 107 datasets with over 18,000 patients (40). All the evidence corroborated the strong association between OSA and NAFLD. Our MR analysis found a high risk of OSA could elevate the risk of NAFLD after removing the SNP rs10928560 which could drive the result. This result further lent support to the OSA-NAFLD association. The OSA usually leads to sleep fragmentation, intrathoracic pressure swings, hypercapnia and intermittent hypoxia (41, 42). Rodent models suggested that the hypoxic status associated with OSA could play an important role in the development of dyslipidemia in OSA. Chronic intermittent hypoxia in obese mice could increase liver triglyceride concentration (43), promote hepatic lipid biosynthesis (43), and in lean mice, it could elevate total cholesterol and LDL concentrations (44), and induce atherosclerosis (45). These results help to explain why the genetic predisposition to OSA can increase the risk of NAFLD. However, NAFLD is also not homogenous regarding its pathophysiology and particularly genetically-induced fatty liver is, in most cases, not associated with an increased cardiometabolic risk (46). The innate heterogeneity of NAFLD might lead to opposite effects caused by OSA, and these effects might cancel out each other leading to a null association.
We did not discover a causal relationship between OSA and CHD, and this result is inconsistent with many previous studies where that suggested a high risk of OSA could elevate the risk of CHD (47). Also, a recent meta-analysis indicated OSA, especially severe OSA, is associated with reduced coronary flow reserve (48). Recently, Li et al. performed an MR analysis and found that genetically-predicted OSA should increase the risk of heart failure, however, the OSA-CHD association was not significant either. Li et al. included the SNPs rs9937053 and rs185932673 in their MR analyses, however, we removed them to avoid the bias caused by horizontal pleiotropy and imprecise statistical estimates since the SNP rs9937053 is located in the FTO gene, which is closely associated with obesity and the allele frequency of SNP rs185932673 is extremely low (< 0.01), which might cause statistical issues. Thus, we removed them in the main analysis. Additionally, we also included the SNPs rs9937053 in the supplementary analyses and found that genetic susceptibility to OSA should increase the risk of T2D [OR = 3.58 [1.06, 12.11], IVW-p = 0.040], suggesting the FTO variant should have a great impact on the results. To give conservative results, we chose to remove two ineligible SNPs in the main analysis and obtained negative results. OSA is common in patients with heart failure, stroke, and atrial fibrillation (49). Many studies have emphasized nuclear factor (NF)-κB–mediated pathways where rapid reoxygenation at the end of apnea produces free radicals, accelerating the reaction of oxidative stress and up-regulation of nuclear factor-κB (50). The pathogenesis of OSA can be attributed to another molecular signature called increased catecholamines, which is consistent with perturbations in the autonomic nervous system. As explained in NAFLD, OSA could disturb lipid metabolism, elevate total cholesterol and LDL concentrations (44), and induce atherosclerosis (45). All these mean OSA should be associated with CHD no matter of epidemiological or experimental studies and we cannot rule out their causal relationship merely based on MR results. This MR analysis failed to detect such association, and several reasons might account for it: (1) The strict criteria of IV selection might reduce the statistical power and lead to an increased false negative rate. This is common in MR analysis; (2) We failed to observed the total effect of OSA on CHD, but we cannot disregard the possibility that OSA can lead to CHD via mediated ways, such as obesity, T2D, and NAFLD; (3) The direct and indirect effects can cancel out and further result in null association, possibly due to undetected mediators. Another important aspect is that the OSA might be caused by CHD or obesity, which might lead to the observed association between OSA and cardiometabolic diseases, however, the observed association did not indicate that OSA was a risk factor and such reverse causation for CHD-OSA cannot be assessed currently due to a lack of full summary statistics of OSA GWAS. These potential reasons warrant further investigations into the causal relationship between OSA and CHD.
Our MR study strengthens the OSA-T2D and OSA-NAFLD causal associations using a robust causal inference method. However, we have to clarify several limitations for future investigations: (1) Horizontal pleiotropy is the main issue in MR analysis and our study is no exception. We have applied MR-Egger interception and MR-PRESSO to evaluate it. Furthermore, we excluded the SNP rs9937053 in the FTO gene and reevaluate the result. It should be noted that the OSA-T2D association became insignificant after the removal of SNP rs9937053 and we deemed obesity might play an important role in OSA-T2D association. However, considering that SNP rs9937053 was still significantly associated with OSA after adjustment of BMI, we still included it in our main analysis. (2) Since OSA is a binary exposure, we cannot appropriately appraise the selection bias and exclusive restriction bias due to data limitations. (3) Neither multivariable nor mediation MR analysis can be performed to disentangle the mediation effects and we cannot include more genetic instruments because of the unavailability of the full summary GWAS statistics for OSA. (4) We are mainly focused on the European population and the generalizability of our conclusion is limited. We cannot easily expand our conclusion to other populations. (5) The relationship between the severity of OSA and other parameters cannot be assessed due to a lack of individual-level data. Overall, such negative results pinpointed that OSA might not directly affect T2D, NAFLD, and CHD if not using the SNP shared by OSA and obesity. Obesity might be a key factor that links OSA to T2D, NAFLD and CHD, which should be paid attention to in future clinical and scientific research work.
Conclusion
This MR analysis indicated that genetically-predicted OSA might not affect the risk of type 2 diabetes, nonalcoholic fatty liver disease and coronary heart disease.
Data availability statement
The original contributions presented in the study are included in the article/Supplementary material, further inquiries can be directed to the corresponding author.
Author contributions
YC contributed to the study design, supervised the data analysis process, and mainly revised the manuscript. XD and LZ were responsible for data acquisition, statistical analysis, and data visualization. XD drafted the original manuscript. XC and LQ read and revised the original manuscript and gave substantial suggestions on statistics. YC takes responsibility for the integrity of the data and the accuracy of the data analysis. All authors have approved for the publication of this study.
Acknowledgments
We would like to thank all investigators who make GWAS summary statistics publicly available.
Conflict of interest
The authors declare that the research was conducted in the absence of any commercial or financial relationships that could be construed as a potential conflict of interest.
Publisher's note
All claims expressed in this article are solely those of the authors and do not necessarily represent those of their affiliated organizations, or those of the publisher, the editors and the reviewers. Any product that may be evaluated in this article, or claim that may be made by its manufacturer, is not guaranteed or endorsed by the publisher.
Supplementary material
The Supplementary Material for this article can be found online at: https://www.frontiersin.org/articles/10.3389/fpsyt.2023.1068756/full#supplementary-material
Supplementary Figure 1. (A) The scatterplot of OSA-T2D results after removal of SNP rs9937053. Different colors represent different methods and each point is a single nucleotide polymorphism. The horizontal and vertical lines of each point represent the 95% confidence interval of the effect size. (B) The leave-one-out-sensitivity forest plot of OSA-T2D results after removal of SNP rs9937053.
Supplementary Figure 2. (A) The scatterplot of OSA-NAFLD results after removal of SNP rs9937053. Different colors represent different methods and each point is a single nucleotide polymorphism. The horizontal and vertical lines of each point represent the 95% confidence interval of the effect size. (B) The leave-one-out-sensitivity forest plot of OSA-NAFLD results after removal of SNP rs9937053.
Supplementary Figure 3. (A) The scatterplot of OSA-CHD results after removal of SNP rs9937053. Different colors represent different methods and each point is a single nucleotide polymorphism. The horizontal and vertical lines of each point represent the 95% confidence interval of the effect size. (B) The leave-one-out-sensitivity forest plot of OSA-CHD results after removal of SNP rs9937053.
References
1. Senaratna CV, Perret JL, Lodge CJ, Lowe AJ, Campbell BE, Matheson MC, et al. Prevalence of obstructive sleep apnea in the general population: a systematic review. Sleep Med Rev. (2017) 34:70–81. doi: 10.1016/j.smrv.2016.07.002
2. Bottaz-Bosson G, Midelet A, Mendelson M, Borel JC, Martinot JB, Le Hy R, et al. Remote monitoring of positive airway pressure data: challenges, pitfalls and strategies to consider for optimal data science applications. Chest. (2022). doi: 10.1016/j.chest.2022.11.034
3. Paschou SA, Bletsa E, Saltiki K, Kazakou P, Kantreva K, Katsaounou P, et al. Sleep apnea and cardiovascular risk in patients with prediabetes and type 2 diabetes. Nutrients. (2022) 14. doi: 10.3390/nu14234989
4. Rundo JV. Obstructive sleep apnea basics. Cleve Clin J Med. (2019) 86(9 Suppl 1):2–9. doi: 10.3949/ccjm.86.s1.02
5. Fu Y, Xia Y, Yi H, Xu H, Guan J, Yin S. Meta-analysis of all-cause and cardiovascular mortality in obstructive sleep apnea with or without continuous positive airway pressure treatment. Sleep Breath. (2017) 21:181–9. doi: 10.1007/s11325-016-1393-1
6. Mesarwi OA, Loomba R, Malhotra A. Obstructive sleep apnea, hypoxia, and nonalcoholic fatty liver disease. Am J Respir Crit Care Med. (2019) 199:830–41. doi: 10.1164/rccm.201806-1109TR
7. Strausz S, Havulinna AS, Tuomi T, Bachour A, Groop L, Mäkitie A, et al. Obstructive sleep apnoea and the risk for coronary heart disease and type 2 diabetes: a longitudinal population-based study in Finland. BMJ Open. (2018) 8:e022752. doi: 10.1136/bmjopen-2018-022752
8. Khalil M, Power N, Graham E, Deschênes SS, Schmitz N. The association between sleep and diabetes outcomes - a systematic review. Diabetes Res Clin Pract. (2020) 161:108035. doi: 10.1016/j.diabres.2020.108035
9. Liu Z, Zhang Y, Graham S, Wang X, Cai D, Huang M, et al. Causal relationships between NAFLD, T2D and obesity have implications for disease subphenotyping. J Hepatol. (2020) 73:263–76. doi: 10.1016/j.jhep.2020.03.006
10. Ren Z, Simons P, Wesselius A, Stehouwer CDA, Brouwers M. Relationship between NAFLD and coronary artery disease: a Mendelian randomization study. Hepatology. (2022) 77:230–8. doi: 10.1002/hep.32534
11. Goodarzi MO, Rotter JI. Genetics insights in the relationship between type 2 diabetes and coronary heart disease. Circ Res. (2020) 126:1526–48. doi: 10.1161/CIRCRESAHA.119.316065
12. Smith GD, Ebrahim S. 'Mendelian randomization': can genetic epidemiology contribute to understanding environmental determinants of disease? Int J Epidemiol. (2003) 32:1–22. doi: 10.1093/ije/dyg070
13. Voight BF, Peloso GM, Orho-Melander M, Frikke-Schmidt R, Barbalic M, Jensen MK, et al. Plasma HDL cholesterol and risk of myocardial infarction: a mendelian randomisation study. Lancet. (2012) 380:572–80. doi: 10.1016/S0140-6736(12)60312-2
14. Bos MM, van Heemst D, Donga E, de Mutsert R, Rosendaal FR, Blauw GJ, et al. The association between habitual sleep duration and sleep quality with glycemic traits: assessment by cross-sectional and mendelian randomization analyses. J Clin Med. (2019) 8. doi: 10.3390/jcm8050682
15. Li J, Zhao L, Ding X, Cui X, Qi L, Chen Y. Obstructive sleep apnea and the risk of Alzheimer's disease and Parkinson disease: a Mendelian randomization study OSA, Alzheimer's disease and Parkinson disease. Sleep Med. (2022) 97:55–63. doi: 10.1016/j.sleep.2022.06.004
16. Strausz S, Ruotsalainen S, Ollila HM, Karjalainen J, Kiiskinen T, Reeve M, et al. Genetic analysis of obstructive sleep apnoea discovers a strong association with cardiometabolic health. Eur Respir J. (2021) 57. doi: 10.1183/13993003.03091-2020
17. Zhou W, Nielsen JB, Fritsche LG, Dey R, Gabrielsen ME, Wolford BN, et al. Efficiently controlling for case-control imbalance and sample relatedness in large-scale genetic association studies. Nat Genet. (2018) 50:1335–41. doi: 10.1038/s41588-018-0184-y
18. Nikpay M, Goel A, Won HH, Hall LM, Willenborg C, Kanoni S, et al. A comprehensive 1,000 Genomes-based genome-wide association meta-analysis of coronary artery disease. Nat Genet. (2015) 47:1121–30. doi: 10.1038/ng.3396
19. Xue A, Wu Y, Zhu Z, Zhang F, Kemper KE, Zheng Z, et al. Genome-wide association analyses identify 143 risk variants and putative regulatory mechanisms for type 2 diabetes. Nat Commun. (2018) 9:2941. doi: 10.1038/s41467-018-04951-w
20. Anstee QM, Darlay R, Cockell S, Meroni M, Govaere O, Tiniakos D, et al. Genome-wide association study of non-alcoholic fatty liver and steatohepatitis in a histologically characterised cohort(?). J Hepatol. (2020) 73:505–15. doi: 10.1016/j.jhep.2020.04.003
21. Borel AL. Sleep apnea and sleep habits: relationships with metabolic syndrome. Nutrients. (2019) 11. doi: 10.3390/nu11112628
22. Burgess S, Davies NM, Thompson SG. Bias due to participant overlap in two-sample Mendelian randomization. Genet Epidemiol. (2016) 40:597–608. doi: 10.1002/gepi.21998
23. Loos RJ, Yeo GS. The bigger picture of FTO: the first GWAS-identified obesity gene. Nat Rev Endocrinol. (2014) 10:51–61. doi: 10.1038/nrendo.2013.227
24. Chen L, Yang H, Li H, He C, Yang L, Lv G. Insights into modifiable risk factors of cholelithiasis: a Mendelian randomization study. Hepatology. (2022) 75:785–96. doi: 10.1002/hep.32183
25. Burgess S, Thompson SG. Interpreting findings from Mendelian randomization using the MR-egger method. Eur J Epidemiol. (2017) 32:377–89. doi: 10.1007/s10654-017-0255-x
26. Verbanck M, Chen CY, Neale B, Do R. Detection of widespread horizontal pleiotropy in causal relationships inferred from Mendelian randomization between complex traits and diseases. Nat Genet. (2018) 50:693–8. doi: 10.1038/s41588-018-0099-7
27. Hemani G, Zheng J, Elsworth B, Wade KH, Haberland V, Baird D, et al. The MR-Base platform supports systematic causal inference across the human phenome. Elife. (2018) 7. doi: 10.7554/eLife.34408
28. Brion MJ, Shakhbazov K, Visscher PM. Calculating statistical power in Mendelian randomization studies. Int J Epidemiol. (2013) 42:1497–501. doi: 10.1093/ije/dyt179
29. Qie R, Zhang D, Liu L, Ren Y, Zhao Y, Liu D, et al. Obstructive sleep apnea and risk of type 2 diabetes mellitus: a systematic review and dose-response meta-analysis of cohort studies. J Diabetes. (2020) 12:455–64. doi: 10.1111/1753-0407.13017
30. Xu J, Long YS, Gozal D, Epstein PN. Beta-cell death and proliferation after intermittent hypoxia: role of oxidative stress. Free Radic Biol Med. (2009) 46:783–90. doi: 10.1016/j.freeradbiomed.2008.11.026
31. Stefan N. Causes, consequences, and treatment of metabolically unhealthy fat distribution. Lancet Diabetes Endocrinol. (2020) 8:616–27. doi: 10.1016/S2213-8587(20)30110-8
32. Tan X, Benedict C. Sleep characteristics and HbA1c in patients with type 2 diabetes on glucose-lowering medication. BMJ Open Diabetes Res Care. (2020) 8. doi: 10.1136/bmjdrc-2020-001702
33. Reutrakul S, Van Cauter E. Interactions between sleep, circadian function, and glucose metabolism: implications for risk and severity of diabetes. Ann N Y Acad Sci. (2014) 1311:151–73. doi: 10.1111/nyas.12355
34. Broussard JL, Ehrmann DA, Van Cauter E, Tasali E, Brady MJ. Impaired insulin signaling in human adipocytes after experimental sleep restriction: a randomized, crossover study. Ann Intern Med. (2012) 157:549–57. doi: 10.7326/0003-4819-157-8-201210160-00005
35. Stamatakis KA, Punjabi NM. Effects of sleep fragmentation on glucose metabolism in normal subjects. Chest. (2010) 137:95–101. doi: 10.1378/chest.09-0791
36. Donga E, van Dijk M, van Dijk JG, Biermasz NR, Lammers GJ, van Kralingen KW, et al. A single night of partial sleep deprivation induces insulin resistance in multiple metabolic pathways in healthy subjects. J Clin Endocrinol Metab. (2010) 95:2963–8. doi: 10.1210/jc.2009-2430
37. Cambras T, Romero O, Díez-Noguera A, Lecube A, Sampol G. Circadian patterns of patients with type 2 diabetes and obstructive sleep apnea. J Clin Med. (2021) 10. doi: 10.3390/jcm10020244
38. Reutrakul S, Mokhlesi B. Obstructive sleep apnea and diabetes: a state of the art review. Chest. (2017) 152:1070–86. doi: 10.1016/j.chest.2017.05.009
39. Jullian-Desayes I, Trzepizur W, Boursier J, Joyeux-Faure M, Bailly S, Benmerad M, et al. Obstructive sleep apnea, chronic obstructive pulmonary disease and NAFLD: an individual participant data meta-analysis. Sleep Med. (2021) 77:357–64. doi: 10.1016/j.sleep.2020.04.004
40. Nadeem R, Singh M, Nida M, Waheed I, Khan A, Ahmed S, et al. Effect of obstructive sleep apnea hypopnea syndrome on lipid profile: a meta-regression analysis. J Clin Sleep Med. (2014) 10:475–89. doi: 10.5664/jcsm.3690
41. Chopra S, Polotsky VY, Jun JC. Sleep apnea research in animals. Past, present, and future. Am J Respir Cell Mol Biol. (2016) 54:299–305. doi: 10.1165/rcmb.2015-0218TR
42. Dempsey JA, Veasey SC, Morgan BJ, O'Donnell CP. Pathophysiology of sleep apnea. Physiol Rev. (2010) 90:47–112. doi: 10.1152/physrev.00043.2008
43. Li J, Grigoryev DN, Ye SQ, Thorne L, Schwartz AR, Smith PL, et al. Chronic intermittent hypoxia upregulates genes of lipid biosynthesis in obese mice. J Appl Physiol. (2005) 99:1643–8. doi: 10.1152/japplphysiol.00522.2005
44. Li J, Savransky V, Nanayakkara A, Smith PL, O'Donnell CP, Polotsky VY. Hyperlipidemia and lipid peroxidation are dependent on the severity of chronic intermittent hypoxia. J Appl Physiol. (2007) 102:557–63. doi: 10.1152/japplphysiol.01081.2006
45. Jun J, Reinke C, Bedja D, Berkowitz D, Bevans-Fonti S, Li J, et al. Effect of intermittent hypoxia on atherosclerosis in apolipoprotein E-deficient mice. Atherosclerosis. (2010) 209:381–6. doi: 10.1016/j.atherosclerosis.2009.10.017
46. Stefan N, Cusi K. A global view of the interplay between non-alcoholic fatty liver disease and diabetes. Lancet Diabetes Endocrinol. (2022) 10:284–96. doi: 10.1016/S2213-8587(22)00003-1
47. Bradley TD, Floras JS. Obstructive sleep apnoea and its cardiovascular consequences. Lancet. (2009) 373:82–93. doi: 10.1016/S0140-6736(08)61622-0
48. Zhang RH, Zhao W, Shu LP, Wang N, Cai YH, Yang JK, et al. Obstructive sleep apnea is associated with coronary microvascular dysfunction: a systematic review from a clinical perspective. J Sleep Res. (2020) 29:e13046. doi: 10.1111/jsr.13046
49. Kasai T. Sleep apnea and heart failure. J Cardiol. (2012) 60:78–85. doi: 10.1016/j.jjcc.2012.05.013
Keywords: obstructive sleep apnea, type 2 diabetes, cardiometabolic diseases, Mendelian randomization, causal inference
Citation: Ding X, Zhao L, Cui X, Qi L and Chen Y (2023) Mendelian randomization reveals no associations of genetically-predicted obstructive sleep apnea with the risk of type 2 diabetes, nonalcoholic fatty liver disease, and coronary heart disease. Front. Psychiatry 14:1068756. doi: 10.3389/fpsyt.2023.1068756
Received: 13 October 2022; Accepted: 23 January 2023;
Published: 09 February 2023.
Edited by:
Xiaoyong Ren, The Second Affiliated Hospital of Xi'an Jiaotong University, ChinaReviewed by:
Ningning She, The Second Affiliated Hospital of Xi'an Jiaotong University, ChinaYitong Zhang, The Second Affiliated Hospital of Xi'an Jiaotong University, China
Copyright © 2023 Ding, Zhao, Cui, Qi and Chen. This is an open-access article distributed under the terms of the Creative Commons Attribution License (CC BY). The use, distribution or reproduction in other forums is permitted, provided the original author(s) and the copyright owner(s) are credited and that the original publication in this journal is cited, in accordance with accepted academic practice. No use, distribution or reproduction is permitted which does not comply with these terms.
*Correspondence: Yu Chen,  ZHJjaGVueXVAMTYzLmNvbQ==