 Linn Goldberg
 Chondra Lockwood
 Bharti Garg
 Kerry S. Kuehl
- Department of Medicine, Division of Health Promotion and Sports Medicine, Oregon Health & Science University, Portland, OR, USA
Objective: To evaluate the effects of a research-tested, team-based health promotion and wellness program combined with digital technologies and implemented in a diverse worksite setting among hospital, clinic, and university employees.
Methods: A prospective cohort study of employees completing biometrics and questionnaires before and after the initial 12-session wellness program and its 12-session booster, 1 year later.
Results: After both the initial intervention and booster, blood pressure and weight were reduced, with greater reductions among employees with pre-hypertension and hypertension and those with a body mass index ≥25. After both the initial intervention and booster, there was a significant increase in (1) daily intake of fruit and vegetable servings, (2) days/week of ≥30 min of exercise, (3) days/week of strength training, and (4) levels of moderately vigorous and vigorous daily physical activity. Self-reported indices of both depression and work-related stress were reduced, while participants reported increased happiness. Post booster, average sleep quality, and sleep duration increased among higher risk employees reporting ≤6 h of daily sleep. Employees reported receiving encouragement from co-workers to engage in healthful diet and physical activities, and exercised together more, and indicated that they would recommend the program to other employees. Longitudinal analysis revealed the durability of the initial intervention outcomes with further beneficial effects after the booster.
Conclusion: A research tested, comprehensive team-based health promotion and wellness program, combined with digital technologies, improved employee health behaviors, mood, sleep, elements of co-worker cohesion, and biometrics among a diverse multi-site workforce. Positive program effects were durable, with enhanced results after the booster.
Introduction
The majority of U.S. health care costs are due to conditions related to unhealthy behaviors and their associated consequences (1–4). During the past decade, workers and employers have experienced an 80% increase in total premiums without the benefit of improved health outcomes (5). Recognizing that effective health promotion and wellness programs may be a low-cost solution to change unhealthy behaviors, improving employee health, and lower rising medical expenditures, the National Institute of Occupational Safety and Health and the U.S. government’s Affordable Care Act support use of health promotion initiatives in the workplace (6, 7). Although occupational settings have the potential to provide programs that lead to beneficial health outcomes, few commercialized wellness programs have documented effectiveness, and fewer evidence-based programs are available for commercial use (8).
Improving health behaviors have the potential to impact employee health, safety, and productivity, as well as reduce employee and employer direct and indirect costs. For example, overweight and obese employees contribute to higher medical and operating costs due to more absenteeism and presenteeism, and greater medical expenditures related to higher body mass indices (9, 10). Employees with pre-hypertension or hypertension report higher levels of stress and greater absenteeism (11, 12). Furthermore, previous research has demonstrated that higher workplace costs are related to depression, higher stress, and inadequate sleep quality and quantity (13–17).
Workplace wellness programs can benefit both workers and employers by targeting healthy behaviors and certain medical conditions. Interventions that increase fruit and vegetable intake and enhance physical activity (PA) have been shown to lower health care expenditures (18). Fruit and vegetable intake of five servings/day is associated with a lower risk of chronic medical illnesses, including cardiovascular disease, type 2 diabetes, and certain cancers (18–22). Likewise, achieving even low levels of regular PA among those who are sedentary can attenuate health effects of obesity and reduce blood pressure (23, 24).
The wellness intervention assessed is Healthy Team Healthy U™ (HTHU), a team based health and safety intervention paradigm developed by the Division of Health Promotion and Sports Medicine at the Oregon Health & Science University. The intervention includes a research-tested behavior change program based on our previous randomized controlled clinical trials (25–37). The program comprises an interactive curriculum targeting specific health, exercise, and nutrition topics with theoretical underpinnings influenced by the Social Learning Theory and Theory of Reasoned Action and its modification, the Theory of Planned Behavior (38–40). To enhance workplace translation and scalability for employees located at multiple sites, we combined our prior team-based intervention paradigm with a web-based digital platform in order to (1) facilitate increased interaction, communication, and peer support, (2) improve participants’ activity tracking and monitoring capabilities, and (3) deliver digital resources to participants.
The prior research-studied models were implemented with small teams of three to seven participants, self-administered by team members. The intervention paradigm has demonstrated numerous benefits, including enhanced health knowledge (25–28, 33), improved dietary practices (25, 28–32), greater exercise self-efficacy and PA (25, 29, 31, 32), and higher measured fitness, as assessed by both maximal oxygen uptake (VO2 max) and muscular endurance (27, 29, 32). Other positive outcomes have included maintaining or achieving a healthier body mass index (BMI) (kilogram body weight per square millimeter) (27, 29), reduced LDL-cholesterol (29), decreased drug and alcohol use (26, 28, 33), lower levels of drinking and driving (31), improved sleep quantity and quality (30), reduced injuries (27, 28, 30, 34), less workman compensation claims, and lower health care costs (34). Beyond indices of physical health and reduced expenditures, the intervention model has improved mood (26) and worker cohesion (27, 29), reduced personal stress (30) and resulted in a higher perception of wellbeing (27, 37). The mechanism of the model’s programmatic effects have been delineated by deconstructing its processes using mediation analysis, so that the components shown to be effective could be used to target future health promotion and wellness strategies (31–33).
Healthy Team Healthy U was implemented at Oregon Health & Science University (OHSU) as a wellness offering for benefited employees during 2011–2014. The aim of this study was to discover whether our team-based intervention paradigm, when combined with a scalable digital platform could be effectively translated to a worksite setting among a wide spectrum of hospital, clinic, and university workers.
Materials and Methods
Study Design
Data were collected using a prospective cohort study to evaluate feasibility, health behaviors, outcomes, and participant perceptions of the HTHU intervention’s initial 12-session program (HTHU Level-1) and the 12-session booster (HTHU Level-2), the following year. The pre- and post-intervention and assessments included questionnaires and biometric indices of blood pressure, height, and body weight. The interventions were among benefited employees at the OHSU. The initial cohort was engaged in Level-1 during work year 2011–2012. The second cohort started the Level-1 intervention during 2012–2013. Those completing the Level-1 intervention could participate in the Level-2 health promotion and wellness intervention the subsequent year. A longitudinal analysis consisted of those participants completing all four questionnaires and/or biometric assessments. This latter analysis was used to assess the durability of the Level-1 intervention and potential enhancement effects of the Level-2 program. Objective targets included reductions in weight and BMI for those overweight and obese and reduction in blood pressure among employees with pre-hypertension and hypertension.
The study followed the recommendations of the STROBE (41) statement for observational studies. Employees provided informed consent at enrollment for confidential data collection, and those consenting were offered participation in pre and post survey collection and biometric measures. There was no incentive either for survey completion or biometric assessments. OHSU’s Institutional Review Board approved the study and its procedures (IRB number #6638).
Setting and Participants
All benefited OHSU employees (N ~ 8,500–9,500, depending on the year) were eligible to participate in HTHU as one of the university’s healthy options. OHSU has a central campus and hospital with additional suburban and rural campuses and clinics. With numerous departments, centers, and support services, OHSU employee education levels range from less than a high school diploma to multiple doctorate degrees.
Recruitment to the program included web-based information, health fairs, and informational sessions. All participants were encouraged to have blood pressure, height, and weight measured pre and post intervention and to complete an anonymous self-report questionnaire before and after the Level-1 and Level-2 interventions. Email and phone communications, posters, and in-person communication encouraged participation and assessments.
Measures
Study staff, either by walk-in or appointment, conducted all biometric assessments. Weight was measured using a digital electronic scale. Participants were weighed without shoes and wore indoor clothing. Height was measured using a stadiometer. Height and weight were used to calculate BMI in kilogram per square millimeter. Blood pressure measurement was performed after a 5-min seated rest with an automated aneroid sphygmomanometer, with 2 min between subsequent measurements. An average of three measurements was made for both systolic and diastolic blood pressure.
Employees volunteered to complete a brief personal health behavior assessment, written at an approximately sixth grade level. The surveys were derived from validated instruments used in prior studies (25–37). During 2011–2012 and 2012–2013, employees participating in HTHU Level-1 completed a 28-item survey prior to participation and a 39-item survey after the program. During 2012–2013 and 2013–2014, employees participating in HTHU Level-2 completed a 25-item survey prior to participation and a 39-item survey after the program’s conclusion. Each survey contained questions that included an estimation of daily servings of fruits and vegetable intake, daily PA of ≥30 min, and the intensity of exercise. The perceived level of employee wellbeing, stress, happiness, and depression were each reported on a 7-point Likert agreement scale. Seven-point and other linear scales have been found to have appropriate for assessment of mood and wellbeing as a screening device, and found to be useful clinically (42–46). Post-surveys included additional queries regarding the benefits of specific elements of the intervention and overall program satisfaction, including expectations, overall evaluation, and agreement with the perceived benefits of team sessions, goals, and online activities.
Intervention
Healthy Team Healthy U™ is a series of 12-session health promotion programs with sessions focusing on specific healthy lifestyle behavior changes through a sequence team-based learning modules. The program integrates health behaviors and activities that target healthy nutrition, PA, safety, stress reduction, mood improvement, and sleep quality and quantity, combined with skill acquisition, goal setting, and team member support and feedback. Each session was structured with the following framework: (1) a team meeting addressing specified health knowledge, behavioral skills, and norms, (2) goal setting with (3) monitoring and feedback. All sessions have learning objectives. The scope and sequence of the learning activities were designed to build on previous meetings for each topic or introduce a new health topic.
A booster 12-session curriculum (Level-2) was added to further enhance health behaviors. Level-2 had unique content that built upon the initial intervention and was designed to sustain engagement and enhance health behaviors and strategies. Employees participating in the Level-1 program were eligible to engage in Level-2 the following academic year.
Our prior team-based intervention paradigm was combined with a digital platform with advanced activity tracking and monitoring and social networking functionality. Online assets included exercise and cooking videos created specifically for the interventions, educational gamified activities, and dedicated social feeds. A point system assisted accountability, motivation, and peer support. All session materials could be accessed on the platform using a computer, electronic tablet, or smartphone.
Level-1 participants received a digital pedometer as an activity tracker. Participants in Level-2 received or had access to resistance bands for strength training.
Statistical Analysis
Three datasets are used to assess effects of the intervention: (1) the pre- and post-surveys and/or biometrics (BMI and blood pressure) for the initial (Level-1) program; (2) the pre- and post-surveys and/or biometrics for the booster (Level-2); and (3) the longitudinal analysis of those employees who completed all four questionnaires or biometric assessments. The longitudinal analysis assists in understanding the durability of the initial intervention, e.g., whether employees reverted to their prior lifestyle behaviors and/or biometrics during the 1-year span between participation in the initial and booster intervention. The analysis also helps assess whether the booster further improved health behaviors and outcomes produced by the initial intervention.
Results for each dataset were analyzed with repeated measure ANOVAs. The main intervention and the booster were each provided during consecutive years. The data from both years were combined for analysis. The analysis includes the determination of effect size, used to help determine the magnitude of the program’s impact on outcomes, without respect to sample size (47, 48). Calculation of effect size is especially useful when the measurements are in a Likert style agreement scale, as used in our pre- and post-assessments (48).
To assist in assessing whether there was a selection bias among employees volunteering for post intervention measurements, we compared employees who completed the initial assessments only to those employees who completed both pre and follow-up measurements. To assess whether the longitudinal population was an accurate representation of the participant population, we compared the longitudinal sample with those who completed the pre- and post- of the initial intervention.
Results
Participants and Data Collection
During the 2011–2012 and 2012–2013 academic years, 3,780 employees participated in Level-1. Overall, 2,817 (74%) of the total number of participants completed the voluntary pre-intervention questionnaire, and of those 986 (35%) completed post-surveys. During this period, 829 employees (22% of the total) had a pre-intervention biometric assessment, and of those, and 473 participants completed pre and post BMI assessments and 466 participants had pre and post blood pressure determinations. Table 1 shows the number of employees completing the surveys and biometrics of the Level-1 program during the first 2 years.
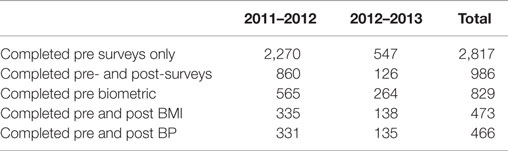
Table 1. Number of participants in the initial (HTHU 1.0) intervention.
As shown in Table 2, among Level-2 participants, 867 employees (46% of the total) completed the voluntary pre-intervention health survey, with 212 of those completing both pre- and post-surveys. During this period, 470 Level-2 participants (25% of the total) had a pre-intervention biometric measurement, and of those, 214 employees had both pre- and post-weight measurements and 213 had both pre and post blood pressure assessments.
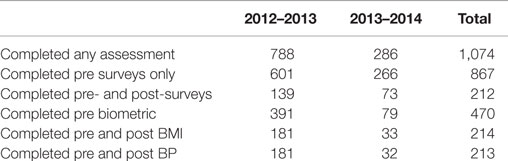
Table 2. Number of participants in booster (HTHU 2.0) intervention.
The longitudinal sample consisted of those participants identified as completing either all four surveys or all four biometric assessments. Among those in the longitudinal analysis, 68 participants completed all 4 height and weight assessments, 71 completed all blood pressure measurements, and 88 participants completed all 4 questionnaires.
Measures
Pre-intervention baseline characteristics of employees engaged in HTHU are provided in Table 3. It includes all participants who completed only the initial surveys and/or biometrics, as compared to participants completing pre- and post-surveys and/or biometrics. Among those two participant groups, there were no differences for mean age, weight, BMI, systolic and diastolic blood pressure measures, self-report of fruit and vegetable intake, or daily PA. There was a statistically significant difference in perceived stress (p = 0.02) among those who completed only the initial measurements, although the mean difference was just 0.16 on a 7-point scale of agreement.
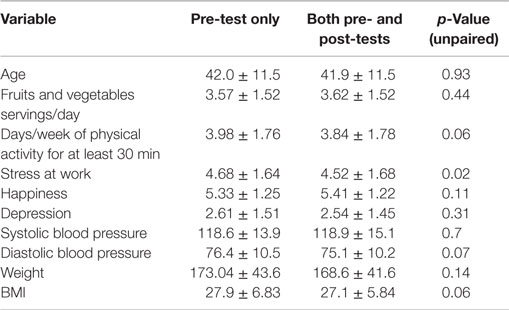
Table 3. Comparison among those who completed only pre-test and those who completed both pre- and post-tests in HTHU 1.0 program (mean ± SD).
Among participants assessed for Level-2, no statistically significant differences were found between those who completed only the pre-assessment surveys and/or biometrics prior to the booster intervention and participants completing both the pre- and post-surveys and biometric assessments (Table 4). The employee samples were similar with respect to age, mean systolic and diastolic blood pressure, weight and BMI, self-reported daily intake of fruits and vegetables, and number of days/week of ≥30 min PA, stress, depression, and happiness.
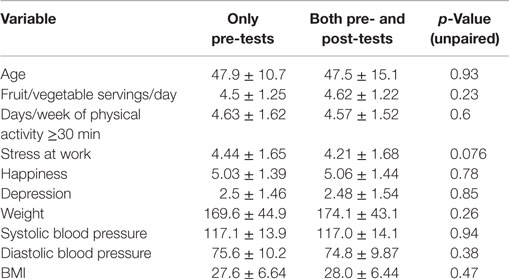
Table 4. Comparisons of employees with pre-test only and employees with both pre- and post-tests in the booster (HTHU 2.0) program (mean ± SD).
Among those in the longitudinal analysis, no differences were found for age, BMI, blood pressure, daily PA, or daily fruit and vegetable intake when compared to participants prior to the initial (Level-1) intervention who completed both pre and post measurements.
Program Outcomes: Initial Wellness Intervention
Table 5 shows outcome assessments that include both the proximal (health behaviors of diet and PA) the distal outcomes of biometrics and self-report of mood, stress levels, and healthy behaviors before and after the initial intervention (Level-1). Health outcomes for participants at the conclusion of the initial intervention include significant reductions in mean systolic and diastolic blood pressure among participants, with greatest decrements among employees with pre-hypertension (−4.7/−2.7) and hypertension (−13.1/−5.6) (all p < 0.0001), significant reductions in body weight and BMI for all employees assessed (p < 0.0001), with greatest change among those initially in the overweight (BMI = 25–29.9) (p < 0.0001) and obese (BMI ≥30) (p < 0.002) categories.
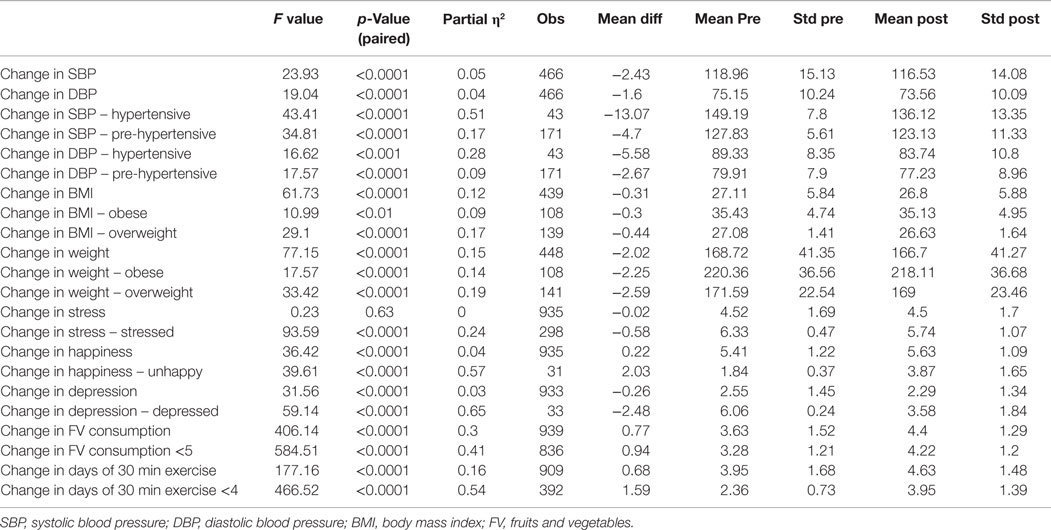
Table 5. Initial year (1.0) wellness program outcomes.
Other favorable self-reported distal outcomes include an increase in perceived happiness among all participants, including an increase among those initially reporting unhappiness (both p < 0.0001), and reduction in overall feelings of depression among employees, with greatest improvement among those initially reporting feeling depressed (both p < 0.0001). Stress reduction was found among those with higher self-reported work stress (p < 0.0001). Although a small, yet statistically significant increase in stress occurred among those with initial low stress after the program (p < 0.0001), these lower stressed employees remained within the low stress category after the intervention. Employees indicated improved happiness after the intervention, including those who self-reported unhappiness prior to the program (both p < 0.0001).
Self-report of daily intake of fruits and vegetables increased 22% (p < 0.0001), despite a slight regression to the mean among those already eating five or more servings each day. Daily PA increased 18.7% (p < 0.0001), which was driven by the increase among those who started with <4 days of PA each week.
Table 6 shows survey results regarding perception of health, days of moderately vigorous and vigorous PA, strength training, self-efficacy, perception of peer influence, engagement in health behaviors, and assessments of wellbeing before and after the initial intervention. Improvements include knowledge of how to balance diet and exercise and confidence in ability to strength train (both p < 0.0001). Employees reported enhanced overall health, including health within the past 3 months (both p < 0.0001). Average days/week of strength training increased 48%, while moderately intense PA increased 25% and intense exercise increased 24% (all p < 0.0001). In addition, employees reported being encouraged to be physically active by co-workers (p < 0.0068) and exercised more with fellow employees (p < 0.0001).
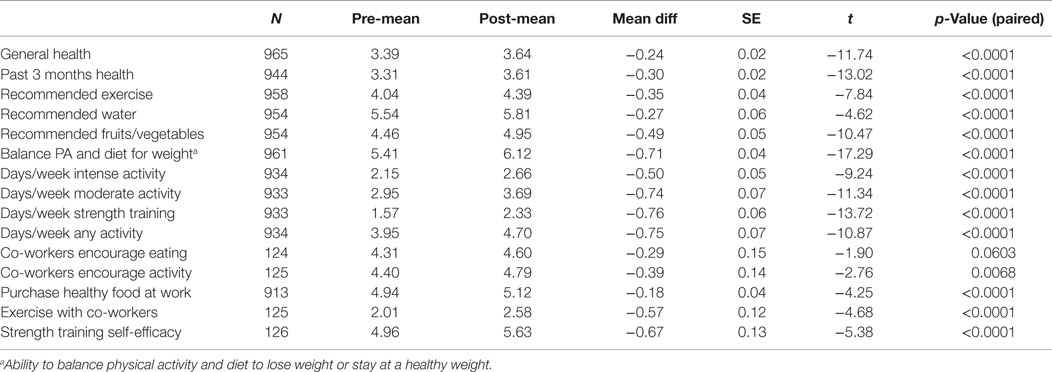
Table 6. Health, diet, exercise, and co-worker influence before and after initial (HTHU 1.0) program.
Booster Program and Outcomes
Table 7 shows proximal outcomes of health behaviors, and distal outcomes of biometrics and self-report of mood and stress, before and after the booster intervention (Level-2). Among employees with pre-hypertension, there was a 5.3 mmHg reduction in systolic blood pressure (p < 0.0001) and a 2.9 mmHg lowering of diastolic blood pressure (p < 0.05). Among employees with hypertension, systolic blood pressure decreased 9.0 mmHg (p < 0.01) and a 3.3 mmHg reduction in diastolic blood pressure (p < 0.05). Weight was significantly reduced among the overweight (p < 0.05) and obese (p < 0.01) employees, with a significant BMI reduction in BMI observed among obese participants (p < 0.01).
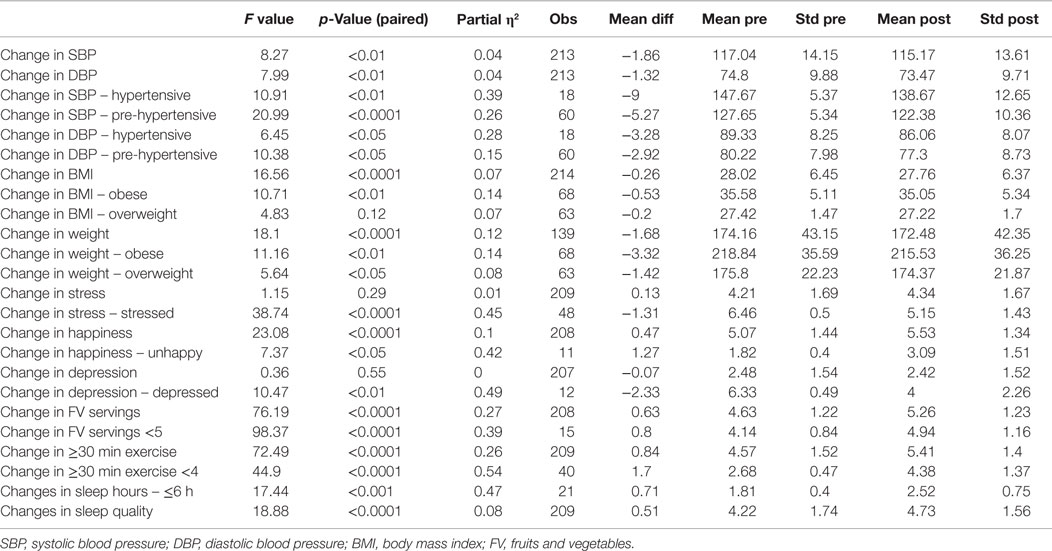
Table 7. Booster year (2.0) outcome results.
Self-report surveys revealed positive distal outcomes, including a reduction in feelings of stress among those who indicated that they had worksite stress prior to the booster program (p < 0.0001). Similar to initial intervention findings, those with lower stress scores had a mean increase in stressful feelings after the intervention (p < 0.0001). However, the low-stressed employee change within the 1–7 Likert agreement scale was only 0.6, and the resultant mean change remained within the low-stressed level. Improvement in perceived happiness occurred among all employees (p < 0.0001), including those initially unhappy prior to the intervention (p < 0.02). The index of self-reported depression was reduced overall (p < 0.0001) and among those reporting initial depression (p < 0.01). Dietary self-reports revealed a significant increase in daily servings of vegetables and fruits (p < 0.0001), with an average intake exceeding the minimum of five servings/day the program recommended. There was also a significant increase in daily PA of ≥30 min or more (p < 0.0001). Because the booster program added a sleep intervention, we assessed self-report of sleep outcomes. Sleep quality improved, overall (p < 0.0001) and although sleep did not increase among all respondents, those reporting <6 h of sleep prior to the booster significantly increased sleep duration (p < 0.001).
Table 8 reveals survey results regarding self-efficacy, perception of peer influence, health behaviors, and wellbeing before and after the HTHU booster program. Participants reported improved perception of their overall health and specifically, their health during the past 3 months (both p < 0.0001). Days/week of being engaged in strength training increased 21.8% (p < 0.0001) after the booster. PA increased, with a 17.2% increase in moderately intense and 21.2% rise in intense PA (all p < 0.0001). Along with these improvements, participants had greater agreement that co-workers encouraged them to be more active and have healthier eating habits (both p < 0.0001) and employees were more engaged in PA with co-workers (p < 0.0001).
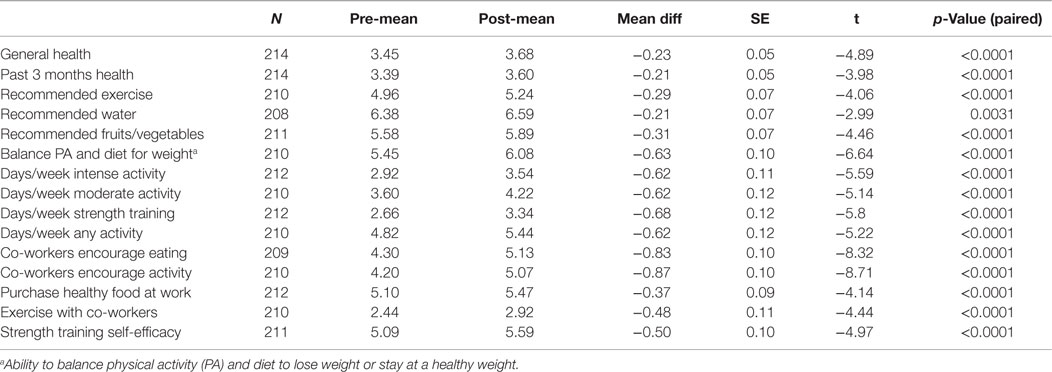
Table 8. Health, diet, exercise and co-worker influence before and after booster (HTHU 2.0) program.
Longitudinal Analysis
Weight reduction was found among all employees (Figure 1), with sustained loss during the time period after completion of the initial Level-1 intervention and prior to participating in the booster the following academic year. Further weight loss was achieved after the booster, with a mean total decrease after both interventions of 2.36 kg. Greater weight loss and a similar pattern of sustained loss between interventions were found among the obese and overweight employees (N = 40). Among employees who were initially obese (N = 22), there was an overall 4.58 kg reduction in weight (Figure 2). The weight reductions after the initial intervention persisted, without returning to baseline weight between the interventions, with further weight reductions following the booster. Likewise, Figure 3 shows the weight change among employees in the overweight category (N = 18). Those initially overweight had weight loss that persisted between interventions with a further reduction in weight at the conclusion of the booster. There was insufficient data to assess blood pressure among the hypertensive and pre-hypertensive subjects among this group.
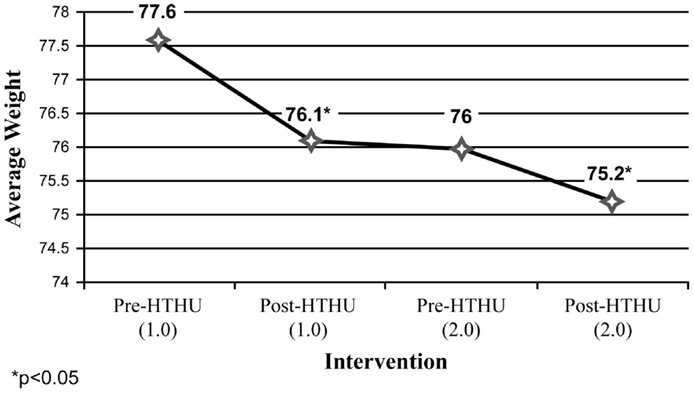
Figure 1. Weight loss (kilogram) (all employees).
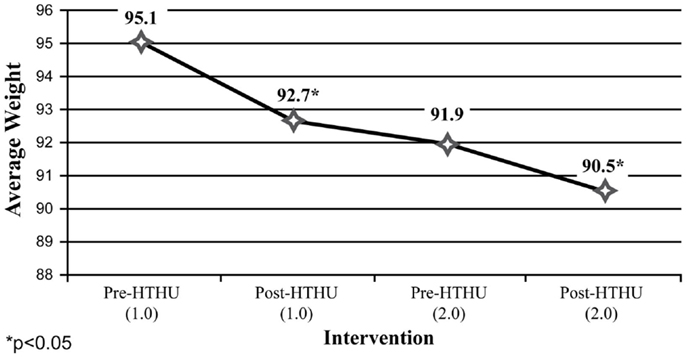
Figure 2. Weight loss (kilogram) (employees ≥30 BMI).
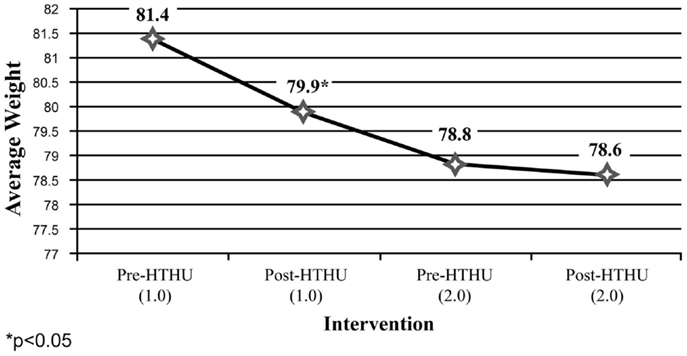
Figure 3. Weight loss (kilogram) (employees 25 < 30 BMI).
Among the self-report measures, participants indicated a 21% increase of daily fruit and vegetable intake after Level-1, which was sustained leading up to the booster intervention (Figure 4). After the booster, participants reported an additional 19.7% average daily increase in fruit and vegetable intake. Daily PA of 30 min among participants increased 27% after the initial intervention. This increase was sustained during the intervening year, and rose 14.95% to an average 5.4 days of PA/week (Figure 5). In addition, a reduction of perceived stress level among employees was observed after the initial wellness program, declining further during the year, prior to the booster intervention. There were insufficient numbers of employees with depression who completed all surveys for analysis.
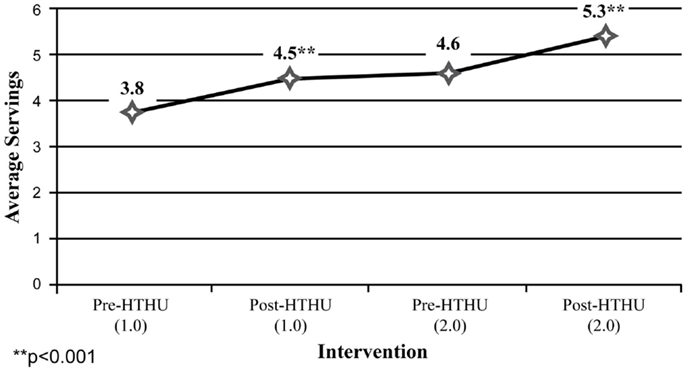
Figure 4. Fruits and vegetables servings (all employees).
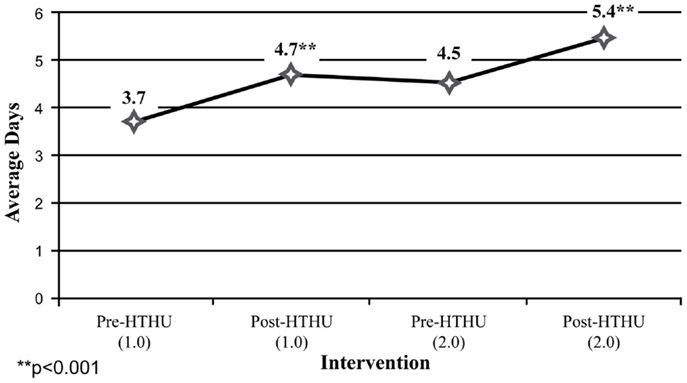
Figure 5. Days/week of ≥30 min physical activity.
Employee Satisfaction
Employee assessments of HTHU Level-1 and Level-2 are shown in Tables 9 and 10, respectively. The responses were measured by employees indicating level of agreement to a statement about program components using a scale from 1 (strongly disagree) to 7 (strongly agree). The overall assessment of the program was made using a 1 (not helpful) to 5 (very helpful) scale of agreement. Among all participants, 98% reported they would recommend HTHU to their co-workers. The highest regarded elements of the programs were nearly identical after Level-1 and Level-2 and included the team sessions, online activities, use of the pedometer and the multi-week step challenge, goal setting, and use of the Wellness Guide, a multi-chapter resource providing more in-depth information of each health topic. No program feature had a neutral or negative rating.
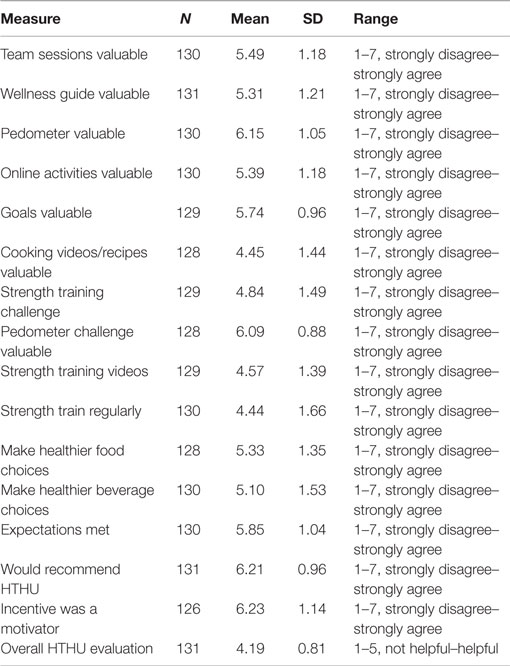
Table 9. Employee evaluation of initial intervention (HTHU 1.0) program.
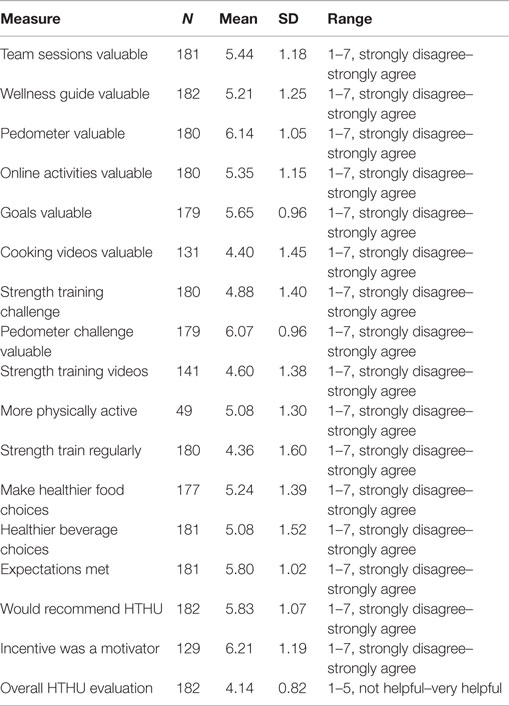
Table 10. Employee Evaluation of booster (HTHU 2.0) program.
Discussion
Healthy Team Healthy U is the translation to a diverse workplace setting of health promotion interventions previously assessed in randomized clinical trials among distinct populations including athletes, fire fighters, law enforcement employees, and other groups (25–37). The results of this prospective cohort study support the transferability and sustained positive impact on health behaviors and outcomes of a research tested, team-based intervention paradigm combined with a digital platform. The intervention improved biometric indices of blood pressure, body weight, BMI, diet, PA frequency and intensity, fruit and vegetable intake, mood, stress levels, and sleep quality and quantity among a diverse employee population. Employee participants had similarities with the biometrics and self-report health behaviors of typical of U.S. employees with regard to BMI, blood pressure, daily PA, and fruit and vegetable intake (49–52).
The theoretical underpinnings highlight how the program may create health behavior change. The team sessions, knowledge acquisition, review, and feedback of weekly health goals and web-based social communication capabilities among team members between each session, provided employees with direct and vicarious modeling featured in the Theory of Social Learning (40). These activities foster healthy normative beliefs and behaviors. The Theory of Reasoned Action, which postulates that attitudes influence intentions, which are theorized precursor of behaviors, were paramount in structuring the curriculum and web-based intervention (38). Sessions imparted how health behaviors influenced each employee’s physical and emotional health. The team-based intervention used in this and our prior research-tested model appears to have reflected improved employee cohesion with task oriented social support, as employees reported their co-workers encouraged them to be more active, have healthier eating habits and employees had greater engagement in PA together (27, 29).
Goals were designed to practice healthy behaviors that could mitigate unhealthy risks, creating a positive attitude, and intention toward the particular health behavior. Although clinically significant health outcomes are the desired effect, this can take weeks or months to occur. Real time activity tracking of personal and team progress delivered immediate feedback to the participant, which could influence short-term positive feedback. This tangible, instantaneous outcome may have generated the social reward underlying both theories of Social Learning and Reasoned Action.
In addition to the health benefits of health promotion strategies that focus on PA and diet, wellness strategies concentrating on mood, stress, and sleep may be critical to reducing medical costs and improving work productivity (15–17, 53–55). Workplace stress is common, costly, and highly related to presenteeism, lost workdays, and a higher use of health care services (15, 53). Among employees with depression, there are numerous indirect costs and loss of productivity, with more than one of every three with depression developing a short-term disability during a given year (54). Reduced sleep duration, especially <6 h within a 24-h period, is related to obesity, metabolic syndrome, and type 2 diabetes (55–58). We found reductions in self-reported depression, lower stress scores among those indicating heightened stress prior to the intervention, and improvement in happiness. We also found improved quality of sleep overall, and increased sleep duration among those with lower sleep hours (≤6) after the booster intervention.
Both the initial and booster intervention significantly reduced body weight, with greatest losses among obese and overweight employees. Obese participants had a 4.8% reduction in body weight assessed with the longitudinal analysis at 1 year follow-up. Among employees in the obese category, the 4.58-kg mean body weight reduction was similar or better than the weight loss reported with popular commercial weight loss and research-based programs and those using coaching or counseling, despite HTHU not being a specific weight reduction intervention (59–62).
The positive blood pressure and weight loss outcomes were consistent with the self-reported improvements in diet and PA. After the initial intervention, employees’ fruit and vegetable intake increased 22%, and increased an additional 14% after the booster, exceeding the recommended average of a minimum of five servings/day (51). Importantly, this threshold recommended by the Centers for Disease Control may be an optimal level for cardiovascular and cancer prevention and reduction in all-cause mortality (18, 63). Likewise, after the initial and booster program, average daily PA increased to 5.4 days, while strength training increased beyond the United States Department of Health and Human Services recommendations (64).
Among the longitudinal employee sample, both objective and self-reported positive outcomes were sustained during the time between the initial intervention and the booster intervention the following year. Specifically, average weight loss occurring after the initial intervention was maintained among all employees measured, including those in the obese and overweight categories in the time span leading up to the booster intervention the subsequent year. Likewise, increases in daily fruit and vegetable intake and daily PA reported after the initial intervention persisted between the end of Level-1 and the beginning of the Level-2 program. Following the booster, there was a further reduction in weight loss, increased mean fruit and vegetable intake and greater mean daily PA of ≥30 min/day.
Consistent with the intervention paradigm of our prior studies, the intervention paradigm emphasizes increasing participants’ health knowledge and tying goals and challenges to the program curriculum (25–37). The incorporation of learning objectives distinguishes the intervention from other corporate wellness platforms relying primarily on promoting activities alone, without addressing health knowledge or the impact of health behaviors on outcomes. The durability of the outcomes and self-reported behavior during the year between the initial and booster interventions suggest that increasing health knowledge can be a critical factor in improving and sustaining health outcomes, which was a finding in our prior mediation analysis (31–33).
We did not perform the traditional health risk assessments (HRAs) used by many employers prior to either the Level-1 or Level-2 interventions. Our experience with use of HRAs and providing individualized interpretation was not useful as a behavior change intervention, even when accompanied with an itemized explanation and review of results (27, 29). Previous reviews of HRAs have found either no behavior change or minimal positive change, even with individualized feedback (65, 66). Even when HRAs were coupled with comprehensive, multiple individual coaching sessions using motivational interviewing, our prior tested team-based paradigm had more robust outcomes at a significantly lower cost (27, 29, 34). The Centers for Disease Control currently concludes that although HRAs “are widely used in workforce wellness programs … their use is not well understood, scientifically” (67). Furthermore, the Rand report found programs that identify employees with higher risks (e.g., HRAs), including those with hypertension, obesity, and use of tobacco, did not significantly reduce their healthcare costs (8).
Regardless of personal risk factors, the Level-1 and Level-2 interventions resulted in positive outcomes and acceptability among participants, which would lend support to the utility of a health promotion strategy addressing PA, mental health, nutrition, safety, sleep, and other healthy behaviors as components of a single comprehensive wellness offering for employees. This suggests that a broader approach aimed at all employees, may result in a cost-effective wellness strategy for organizations and employers, rather than segregating employees and instituting multiple interventions, each targeting specific health risks (8, 34).
Limitations
Although the design was a prospective cohort analysis, there was no control group. A bias could have existed among employees completing the pre and post measures and those completing the pre-only measurements. Similarly, the longitudinal sample could be different than the initial pre and post sample, which could lead to erroneous conclusions. Also, although the pre- and post-test design can assist in making inferences on the effect of the intervention, causality cannot always be assigned.
Random assignment was not practical, due to the risk of contamination. A true control group not using another wellness initiative was not possible due to employee incentives offered by the employer. Despite these limitations, it did not appear that participants being assessed were different than other participants. Employees completing pre and post assessments were similar to those participants who completed the pre-measures only, with regard to biometrics and health behaviors (Tables 3 and 4). Likewise, employees completing the longitudinal analysis for physical measures and/or surveys were similar to those who completed the pre-assessment only. This suggests there was no differential dropout or selection bias based with regard to either pre-intervention behavior or biometric parameters.
To strengthen the evidence beyond statistical analysis, we have included the determination of effect size, which can help assess the magnitude of the program’s effect, without respect to sample size (47, 48). Effect sizes are in the medium category, providing more confidence in the relationship between the intervention and the observed effects (48). Although self-report assessment in can be influenced by social desirability, there is no reason to believe that this bias would differ across time points. Importantly, the positive outcomes were present for both objective and self-report measures, and across multiple health behaviors. Thus, despite potential drawbacks, the results of the wellness intervention had similar positive outcomes as our prior large randomized, controlled clinical trials (25–37).
Conclusion
This study indicates that a research-tested, team-based, comprehensive health promotion and wellness program combined with a digital platform can be successfully translated to a diverse workplace setting. The positive objective biometric indices and self-reported outcomes among employee participants, indicate that a team-based structured program covering a wide range of health topics also may lead to enhanced employee cohesion, as well as produce medical cost savings as found in our previous intervention research on which this worksite intervention is based (27, 29, 34). In addition, the reduced stress and depression indices may predict future reductions in the prevalence of absenteeism and presenteeism (67–70).
Conflict of Interest Statement
Healthy Team Healthy U is a program distributed by Provata Health, a technology transfer company of the Oregon Health & Science University (OHSU). OHSU and Drs. Linn Goldberg and Kerry Stephen Kuehl have a financial interest from the commercial sale of technologies described in this manuscript. This potential conflict of interest has been reviewed and managed by the OHSU Conflict of Interest in Research Committee.
Acknowledgments
We would like to thank the Health Promotion and Sports Medicine staff assisting in disseminating the program and collecting measurements during the three intervention years.
References
1. Mokdad AH, Marks JS, Stroup DF, Gerberding JL. Actual causes of death in the United States, 2000. JAMA (2004) 291:1238–45. doi: 10.1001/jama.291.10.1238
2. Cifuentes M, Fernald DH, Green LA, Niebauer LJ, Crabtree BF, Strange KC, et al. Prescription for health: changing primary care practice to foster healthy behaviors. Ann Fam Med (2005) 3(Suppl 2):S4–12. doi:10.1370/afm.378
3. Center for Health and Community. San Francisco, CA: University of California (2014). Available from: http://www.chc.ucsf.edu/message.htm
4. The Cost of Chronic Disease and Health Risk Behaviors. Centers for Disease Control and Prevention (2014). Available from: http://www.cdc.gov/chronicdisease/overview/index.htm?s_cid=ostltsdyk_govd_203
5. 2013 Employer Health Benefits Survey. The Henry J Kaiser Family Foundation (2013). Available from: http://kff.org/report-section/2013-summary-of-findings/
6. Prevention Makes Common Sense. U.S. Department of Health & Human Services (2003). Available from: http://aspe.hhs.gov/health/prevention/prevention.pdf
7. Available from: http://www.dol.gov/ebsa/newsroom/fswellnessprogram.html
8. Soeren M, Hangsheng L, Caloyeras JP, Huang CY, Van Busum KR, et al. Workplace Wellness Programs Study. Rand Corporation (2013). p. 1–137. Available from: http://www.dol.gov/ebsa/pdf/workplacewellnessstudyfinal.pdf
9. Finkelstein EA, DiBonaventura MD, Burgess SM, Hale BC. The costs of obesity in the workplace. J Occup Environ Med (2010) 52(10):971–6. doi:10.1097/JOM.0b013e3181f274d2
10. Kleinman N, Abouzaid S, Andersen L, Wang Z, Powers A. Cohort analysis assessing medical and nonmedical cost associated with obesity in the workplace. J Occup Environ Med (2014) 56(2):161–70. doi:10.1097/JOM.0000000000000099
11. Kirkham HS, Clark BL, Bolas CA, Lewis GH, Jackson AS, Fisher D, et al. Which modifiable health risks are associated with changes in productivity costs? Popul Health Manag (2015) 18(1):30–8. doi:10.1089/pop.2014.0033
12. Capriotti T, Kirby LG, Smeltzer SC. Unrecognized high blood pressure. A major public health issue for the workplace. AAOHN J (2000) 48(7):338–43.
13. Stewart WF, Ricci JA, Chee E, Hahn SR, Morganstein D. Cost of lost productive work time among US workers with depression. JAMA (2003) 289(23):3135–44. doi:10.1001/jama.289.23.3135
14. Wang PS, Patrick A, Avorn J, Azocar F, Ludman E, McCulloch J, et al. The costs and benefits of enhanced depression care to employers. Arch Gen Psychiatry (2006) 63(12):1345–53. doi:10.1001/archpsyc.63.12.1345
15. Kalia H. Assessing the economic impact of stress: the modern day hidden epidemic. Metabolism (2002) 51(6 Suppl 1):49–53. doi:10.1053/meta.2002.33193
16. Jackson CL, Redline S, Emmons KM. Sleep as a potential fundamental contributor to disparities in cardiovascular health. Annu Rev Public Health (2015) 36:417–40. doi:10.1146/annurev-publhealth-031914-122838
17. Van Cauter E, Spiegel K, Tasali E, Leproult R. Metabolic consequences of sleep and sleep loss. Sleep Med (2008) 9(Suppl):S23–8. doi:10.1016/S1389-9457(08)70013-3
18. Wang X, Ouyang Y, Liu J, Zhu M, Zhao G, Bao W, et al. Fruit and vegetable consumption and mortality from all causes, cardiovascular disease, and cancer: systematic review and dose-response meta-analysis of prospective cohort studies. BMJ (2014) 349:g4490. doi:10.1136/bmj.g4490
19. Hung H-C, Joshipura KJ, Jiang R, Hu B, Hunger D, Smith-Warner SA, et al. Fruit and vegetable intake and risk of major chronic disease. J Natl Cancer Inst (2004) 96(21):1577–84. doi:10.1093/jnci/djh296
20. Centers for Disease Control and Prevention. Chronic Disease Overview: Costs of Chronic Disease. Centers for Disease Control and Prevention Website. Available from: http://www.cdc.gov/nccdphp/overview.htm
21. Cooper AJ, Forouhi NG, Ye A, Buijsse B, Arriola L, Balkau B, et al. Fruit and vegetable intake and type 2 diabetes: EPIC-InterAct prospective study and meta-analysis. Eur J Clin Nutr (2012) 66(10):1082–92. doi:10.1038/ejcn.2012.85
22. Pomerleau J, Lock K, McKee M. The burden of cardiovascular disease and cancer attributable to low fruit and vegetable intake in the European Union: differences between old and new member states. Public Health Nutr (2006) 9(5):575–83. doi:10.1079/PHN2005910
23. Ekelund U, Ward HA, Norat T, Luan J, May AM, Weiderpass E, et al. Physical activity and all-cause mortality across levels of overall and abdominal adiposity in European men and women: the European prospective investigation into cancer and nutrition study (EPIC). Am J Clin Nutr (2015) 101(3):613–21. doi:10.3945/ajcn.114.100065
24. Murtagh EM, Nichols L, Mohammed MA, Holder R, Nevill AM, Murphy MH. The effect of walking on risk factors for cardiovascular disease: an updated systematic review and meta-analysis of randomised control trials. Prev Med (2015) 72:34–43. doi:10.1016/j.ypmed.2014.12.041
25. Goldberg L, Elliot DL, Clarke G, MacKinnon DP, Moe E, Zoref L, et al. Effects of a multidimensional anabolic steroid prevention intervention. The adolescents training and learning to avoid steroids (ATLAS) program. JAMA (1996) 276:1555–62. doi:10.1001/jama.276.19.1555
26. Elliot DL, Moe EL, Goldberg L, DeFrancesco CA, Durham MB, Hix-Small H. Definition and outcome of a curriculum to prevent disordered eating and body-shaping drug use. J Sch Health (2006) 76(2):67–73. doi:10.1111/j.1746-1561.2006.00070.x
27. Elliot DL, Goldberg L, Kuehl KS, Moe EL, Breger RK, Pickering MA. The PHLAME (promoting healthy lifestyles: alternative models’ effects) firefighter study: outcomes of two models of behavior change. J Occup Environ Med (2007) 49(2):204–13. doi:10.1097/JOM.0b013e3180329a8d
28. Goldberg L, MacKinnon DP, Elliot DL, Moe EL, Clarke G, Cheong J. The adolescents training and learning to avoid steroids program: preventing drug use and promoting health behaviors. Arch Pediatr Adolesc Med (2000) 154(4):332–8. doi:10.1001/archpedi.154.4.332
29. Elliot DL, Goldberg L, Duncan TE, Kuehl KS, Moe EL, Breger RK, et al. The PHLAME firefighters’ study: feasibility and findings. Am J Health Behav (2004) 28(1):13–23. doi:10.5993/AJHB.28.1.2
30. Kuehl KS, Elliot DL, Goldberg L, MacKinnon DP, Vila BJ, Smith J, et al. The safety and health improvement: enhancing law enforcement departments study: feasibility and findings. Front Public Health (2014) 2:38. doi:10.3389/fpubh.2014.00038
31. MacKinnon DP, Elliot DL, Thommes F, Kuehl KS, Moe EL, Goldberg L. Long-term effects of a worksite health promotion program for firefighters. Am J Health Behav (2010) 34(6):695–706. doi:10.5993/AJHB.34.6.6
32. Ranby KW, MacKinnon DP, Fairchild AJ, Elliot DL, Kuehl KS, Goldberg L. The PHLAME (promoting healthy lifestyles: alternative models’ effects) firefighter study: testing mediating mechanisms. J Occup Health Psychol (2011) 16(4):501–13. doi:10.1037/a0023002
33. Elliot DL, Goldberg L, Moe EL, DeFrancesco CA, Durham MB, McGinnis W, et al. Long-term outcomes of the ATHENA (athletes targeting healthy exercise & nutrition alternatives) program for female high school athletes. J Alcohol Drug Educ (2008) 52(2):73–92. doi:10.1037/a0023002
34. Kuehl KS, Elliot DL, Goldberg L, Moe EL, Perrier E, Smith J. Economic benefit of the PHLAME wellness programme on firefighter injury. Occup Med (Lond) (2013) 63(3):203–9. doi:10.1093/occmed/kqs232
35. MacKinnon DP, Goldberg L, Clarke GN, Elliot DL, Cheong J, Lapin A, et al. Mediating mechanisms in a program to reduce intentions to use anabolic steroids and improve exercise self-efficacy and dietary behavior. Prev Sci (2001) 2(1):15–28. doi:10.1023/A:1010082828000
36. Ranby KW, Aiken LS, MacKinnon DP, Elliot DL, Moe EL, McGinnis W, et al. A mediation analysis of the ATHENA intervention for female athletes: prevention of athletic-enhancing substance use and unhealthy weight loss behaviors. J Pediatr Psychol (2009) 34(10):1069–83. doi:10.1093/jpepsy/jsp025
37. Elliot DL, MacKinnon DP, Mabry L, Kisbu-Sakarya Y, Defrancesco CA, Coxe SJ, et al. Worksite wellness program implementation: a model of translational effectiveness. Transl Behav Med (2012) 2(2):228–35. doi:10.1007/s13142-012-0121-z
38. Fishbein M, Ajzen I. Belief, Attitude, Intention and Behavior: An Introduction to Theory and Research. Reading, MA: Addison-Wesley (1975).
39. Ajzen I. The theory of planned behavior. Organ Behav Hum Decis Processes (1991) 50(2):179–211. doi:10.1016/0749-5978(91)90020-T
41. Available from: www.strobe-statement.org
42. Diener E, Emmons RA, Larsen RJ, Griffin S. The satisfaction with life scale. J Pers Assess (1985) 49(1):71–5. doi:10.1207/s15327752jpa4901_13
43. Hegel MT, Collins ED, Kearing S, Gillock KL, Moore CP, Ahles TA. Sensitivity and specificity of the distress thermometer for depression in newly diagnosed breast cancer patients. Psychooncology (2008) 1796:556–60. doi:10.1002/pon.1289
44. Stavraka C, Ford A, Ghaem-Maghami S, Crook T, Agarwal R, Gabra H, et al. A study of symptoms described by ovarian cancer survivors. Gynecol Oncol (2012) 125(1):59–64. doi:10.1016/j.ygyno.2011.12.421
45. Trask PC, Paterson A, Riba M, Brines B, Griffith K, Parker P, et al. Assessment of psychological distress in prospective bone marrow transplant patients. Bone Marrow Transplant (2002) 29:917–25. doi:10.1038/sj.bmt.1703557
46. Zwahlen D, Hagenbuch N, Carley MI, Recklitis CJ, Buchi S. Screening cancer patient’s families with the distress thermometer (DT): a validation study. Psychooncology (2008) 17(10):959–66. doi:10.1002/pon.1320
47. Cohen J. Things i have learned (so far). Am Psychol (1990) 45:1304–12. doi:10.1037/0003-066X.45.12.1304
48. Sullivan GM, Feinn R. Using effect size-or why the P value is not enough. J Grad Med Educ (2012) 4(3):279–82. doi:10.4300/JGME-D-12-00156.1
49. Luckhaupt SE, Cohen MA, Li J, Calvert GM. Prevalence of obesity among U.S. workers and associations with occupational factors. Am J Prev Med (2014) 46(3):237–48. doi:10.1016/j.amepre.2013.11.002
50. Wright JD, Hughes JP, Ostchega Y, Yoon SS, Nwankwo T. Mean systolic and diastolic blood pressure in adults aged 18 and over in the United States, 2001–2008. Natl Health Stat Report (2011) 35:1–22,24.
51. Centers for Disease Control and Prevention (CDC). State-specific trends in fruit and vegetable consumption among adults – United States, 2000–2009. MMWR Morb Mortal Wkly Rep (2010) 59(35):1125–30.
52. Centers for Disease Control and Prevention (CDC). Adult participation in aerobic and muscle-strengthening physical activities – United States, 2011. MMWR Morb Mortal Wkly Rep (2013) 62(17):326–30.
53. Callen BL, Lindley LC, Niederhauser VP. Health risk factors associated with presenteeism in the workplace. J Occup Environ Med (2013) 55(11):1312–7. doi:10.1097/JOM.0b013e3182a200f4
54. Goldberg RJ, Steury S. Depression in the workplace: costs and barriers to treatment. Psychiatr Serv (2001) 52(12):1639–43. doi:10.1176/appi.ps.52.12.1639
55. Chaput JP, Despres JP, Bouchard C, Tremblay A. The association between short sleep duration and weight gain is dependent on disinhibited eating behavior in adults. Sleep (2011) 34(10):1291–7. doi:10.5665/SLEEP.1264
56. Wu Y, Zhai L, Zhang D. Sleep duration and obesity among adults: a meta-analysis of prospective studies. Sleep Med (2014) 15(12):1456–62. doi:10.1016/j.sleep.2014.07.018
57. Gangwisch JE, Heymsfield SB, Boden-Albala B, Buijs RM, Kreier F, Pickering TG, et al. Sleep duration as a risk factor for diabetes incidence in a large U.S. sample. Sleep (2007) 30(12):1667–73.
58. Wolk R, Somers VK. Sleep and the metabolic syndrome. Exp Physiol (2007) 92(1):67–78. doi:10.1113/expphysiol.2006.033787
59. The Diabetes Prevention Program (DPP) Research Group. Reduction in the incidence of type 2 diabetes with lifestyle intervention or metformin. N Engl J Med (2002) 346:393–403. doi:10.1056/NEJMoa012512
60. Wilson MG, DeJoy DM, Vandenberg R, Padilla H, Davis M. Fuel your life: a translation of the diabetes prevention program to worksites. Am J Health Promot (2015). doi:10.4278/ajhp.130411-QUAN-169
61. Attallah R, Filion KB, Wakil SM, Genest J, Joseph L, Poirer P, et al. Long-term effects of 4 popular diets on weight loss and cardiovascular risk factors: a systemic review of randomized control trials. Circ Cardiovasc Qual Outcomes (2014) 7(6):815–27. doi:10.1161/CIRCOUTCOMES.113.000723
62. Gudzune KA, Doshi RS, Mehta AK, Chaudhry ZW, Jacobs DK, Vakil RM, et al. Efficacy of commercial weight-loss programs. Ann Intern Med (2015) 162:501–12. doi:10.7326/M14-2238
63. Oyebode O, Gordon-Dseagu V, Walker A, Mindell JS. Fruit and vegetable consumption and all-cause, cancer and CVD mortality: analysis of health survey for England data. J Epidemiol Community Health (2014) 68(9):856–62. doi:10.1136/jech-2013-203500
64. Centers for Disease Control and Prevention. How much Physical Activity do Adults Need? Centers for Disease Control and Prevention (2015). Available from: http://www.cdc.gov/physicalactivity/everyone/guidelines/adults.html
65. Anderson D, Staufacker M. The impact of worksite-based health risk appraisal on health-related outcomes: a review of the literature. Am J Health Promot (1996) 10(6):499–508. doi:10.4278/0890-1171-10.6.499
66. Kreuter MW, Strecher VJ. Do tailored behavior change messages enhance the effectiveness of health risk appraisal? Results from a randomized trial. Health Educ Res (1996) 11(1):97–105. doi:10.1093/her/11.1.97
67. Centers for Disease Control and Prevention. Healthier Worksite Initiative. Centers for Disease Control and Prevention (2015). Available from: http://www.cdc.gov/nccdphp/dnpao/hwi/programdesign/health_risk_appraisals.htm
68. Gosselin E, Lemyre L, Cornell W. Presenteeism and absenteeism: differentiated understanding of related phenomena. J Occup Health Psychol (2013) 18(1):75–86. doi:10.1037/a0030932
69. Sanderson K, Tilse E, Nicholson J, Oldenberg B, Graves N. Which presenteeism measures are more sensitive to depression and anxiety. J Affect Disord (2007) 101(1–3):65–74. doi:10.1016/j.jad.2006.10.024
Keywords: health promotion, wellness, employee health, occupational health, physical activity, diet, body mass index, blood pressure
Citation: Goldberg L, Lockwood C, Garg B and Kuehl KS (2015) Healthy Team Healthy U: a prospective validation of an evidence-based worksite health promotion and wellness platform. Front. Public Health 3:188. doi: 10.3389/fpubh.2015.00188
Received: 03 June 2015; Accepted: 17 July 2015;
Published: 04 August 2015
Edited by:
Will R. Ross, Washington University School of Medicine, USAReviewed by:
Nilesh Chandrakant Gawde, Tata Institute of Social Sciences, IndiaQi-qiang He, Wuhan University, China
Copyright: © 2015 Goldberg, Lockwood, Garg and Kuehl. This is an open-access article distributed under the terms of the Creative Commons Attribution License (CC BY). The use, distribution or reproduction in other forums is permitted, provided the original author(s) or licensor are credited and that the original publication in this journal is cited, in accordance with accepted academic practice. No use, distribution or reproduction is permitted which does not comply with these terms.
*Correspondence: Linn Goldberg, Department of Medicine, Division of Health Promotion and Sports Medicine, Oregon Health & Science University, 3181 SW Sam Jackson Park Road (CR110), Portland, OR 97239, USA,Z29sZGJlcmxAb2hzdS5lZHU=