 Jana A. Hirsch1*
 Katie A. Meyer2
 Marc Peterson1*Daniel A. Rodriguez3Yan Song3
 Ke Peng3Jun Huh3
 Penny Gordon-Larsen2
- 1Carolina Population Center, University of North Carolina at Chapel Hill, Chapel Hill, NC, USA
- 2Department of Nutrition, University of North Carolina at Chapel Hill, Chapel Hill, NC, USA
- 3Department of City and Regional Planning, University of North Carolina at Chapel Hill, Chapel Hill, NC, USA
Background: Neighborhood transportation infrastructure and public recreational facilities are theorized to improve the activity, weight, and cardiometabolic profiles of individuals living in close proximity to these resources. However, owing to data limitations, there has not been adequate study of the influence of timing and placement of new infrastructure on health over time.
Methods: This protocol details methods of the four cities study to perform retrospective field audits in order to capitalize on existing longitudinal health data from the coronary artery risk development in young adults (CARDIA) study. We developed and verified measures of recreation facilities (trails, parks) and transportation infrastructure (bus, light rail, bicycle parking, bicycle paths) in Birmingham, AL; Chicago, IL; Minneapolis, MN; and Oakland, CA (USA). We identify introductions, renovations, and closures between 1985 and 2010 to develop measures of facility and infrastructure change. Ultimately, these data were linked to CARDIA sites’ respondents’ geographic locations over the 25-year study period to examine associations with health behaviors and outcomes.
Results: Data available for retrospective audits was inconsistent by city, primarily due to record-keeping differences. We found large increases in bicycle infrastructure, with the exception of Birmingham, AL, USA. Excluding the addition of a new rail line in Minneapolis, MN, USA, few changes occurred in bus service, rail, and parks.
Conclusion: Our method represents innovation toward the collection of retrospective neighborhood data for use in longitudinal analyses. The data produced give insight into the way neighborhood infrastructure has changed over time and the potential relationship between these changes and health behaviors.
Background
A large body of literature suggests that some neighborhood characteristics can influence cardiovascular health (1–4). Neighborhoods that offer access to safe and accessible recreational facilities and transportation infrastructure are theorized to improve the diet, physical activity, weight, and cardiometabolic profiles of individuals living in close proximity to these resources (5–7). Observational studies to identify the specific factors and pathways linking neighborhood environments to cardiometabolic risk factors, however, have been largely cross-sectional and have produced mixed results (8–23). The major limitations of this current body of research are selection bias and reverse causation, largely due to the faulty assumption that neighborhood resources are placed independent of all other factors and that no selective migration occurs to take advantage of these resources (24–26).
There have been dramatic changes in the US physical activity and infrastructure environments during the past few decades (27–29). Studying changes in neighborhoods over time with respect to health behaviors and outcomes could improve our understanding of how changes in environments may shape changes in behaviors, thus providing insight into the potential for community investments in infrastructure and recreational facilities. Yet, minimal longitudinal evidence exists (30–45), much of it focusing on changes due to residential relocations (33, 44, 45) rather than environmental changes around stable residents. Although policies and changes to the built environment could be evaluated as “natural” or “quasi” experiments, a recent review found only 18 studies evaluating policy or change impacts on nutrition/diet, 17 on physical activity, and 3 on body mass index, with a wide variety in the quality of the study designs (46). The largest issue is the lack of high quality, longitudinal data, and methods to study retrospective data on neighborhood infrastructure changes that could be linked to existing longitudinal cohorts of health behaviors and outcomes. This leaves fundamental gaps in our ability to study the influence of timing and placement of new infrastructure on activity behaviors, obesity, and cardiometabolic risk over time.
To this end, we created a methodology to collect, verify, and process data on dynamic infrastructure changes and quantify associations between infrastructure and health behaviors and outcomes in four US cities over a 25-year period, which we linked to high quality, longitudinal clinic data from the coronary artery risk development in young adults (CARDIA) study from 1985–1986 to 2010–2011. Specifically, we generated data to allow the development of a model to investigate how the timing and placement of changes in recreation facilities and transportation infrastructure influence: (a) individual-level physical activity, (b) patterns of weight maintenance and gain, and (c) cardiometabolic risk measures over 25 years, controlling for the purposive placement of recreation facilities and transportation infrastructure and for the selective migration of individuals to locate near such resources.
In order to accomplish this larger research goal, we developed and verified measures to capture introductions, renovations, and closures representing changes in (1) recreation facilities (e.g., trails and parks) and (2) transportation infrastructure (e.g., light rail, bike parking, and bike paths) in the NIH-funded CARDIA four cities study (R01-HL114091). We performed retrospective field audits to enhance our assessment of above mentioned facility and infrastructure data in the four original CARDIA field sites over the period from 1985–1986 to 2010–2011. In this paper, we present our protocol to perform these field audits, as well as verify and process the data collected.
Methods/Design
A flow chart of the overall process used for retrospective field audits can be found in Figure 1.
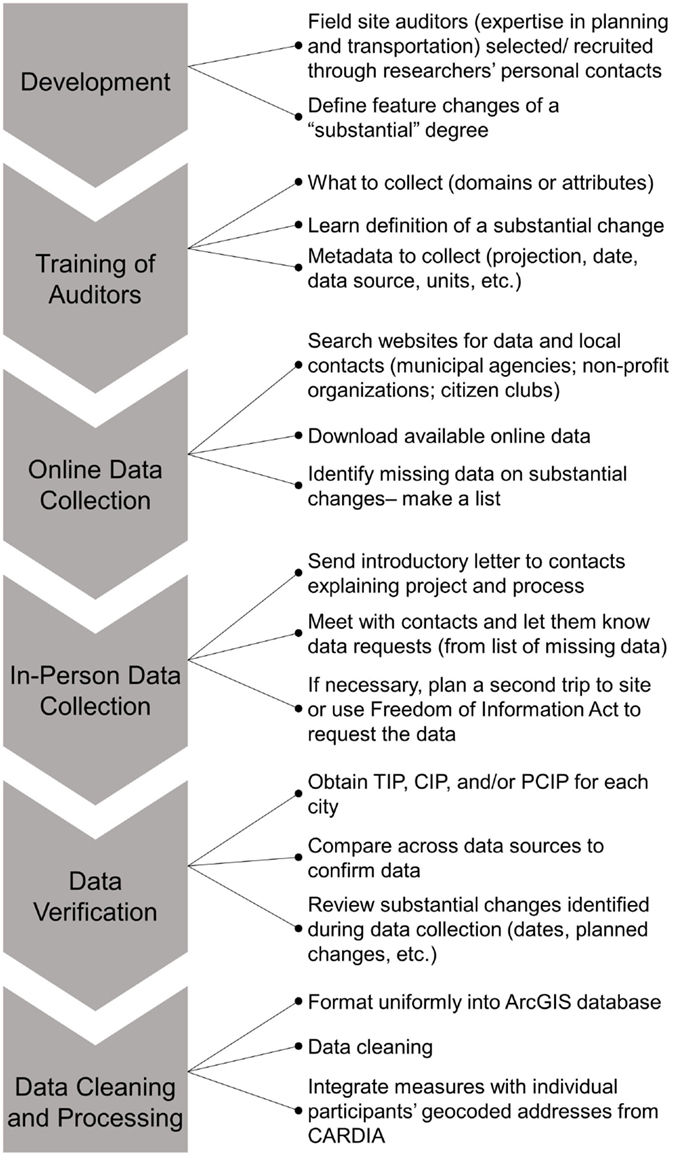
Figure 1. Flow chart of the overall process used for retrospective field audits.
CARDIA Study
The four cities study is an ancillary study of the CARDIA study, a prospective cohort study initiated to investigate life-style and other factors that influence the evolution of coronary heart disease risk factors during young adulthood (47). CARDIA includes 5,115 participants, aged 18–30 years, who were recruited and examined in four urban areas: Birmingham, AL; Chicago, IL; Minneapolis, MN; and Oakland, CA (USA) (48) in 1985–1986 with 8 waves of data collection until 2010–2011. The four cities in our sample are emblematic of different types of US cities and represent three distinct geographic regions (South, Midwest, and West). Study data were collected under protocols approved by Institutional Review Boards at each study center and UNC at Chapel Hill.
Neighborhood Definition and Coverage
In studies using geographic information system (GIS)-derived environment variables, neighborhood definitions can be generally classified into administrative boundaries [e.g., counties (49), Metropolitan Statistical Areas (50), zip codes, census tract (51), or block groups (1, 52, 53)] and buffers [e.g., Euclidian (34, 43) or street network (54, 55) distances around a point of interest like a residence or employment site]. Although these boundaries are readily and inexpensively available, they are somewhat arbitrary and may not correspond with what the population itself may consider as a neighborhood. By contrast, there are also conceptually defined neighborhoods, often used by local planners, such as the community areas created by the Social Science Research Committee at University of Chicago that has divided the City of Chicago into 77 well defined and consistent community areas (56). Analogous data are available from city planning departments for the other three cities (Birmingham: 99; Minneapolis/St. Paul 81/17; Oakland: 57 neighborhoods). In this project, we used administrative neighborhoods, Euclidean, and network buffer-based neighborhoods, as well as conceptually defined neighborhoods from the Regional Planning Commission of Greater Birmingham (Birmingham) and Zillow (Chicago, Minneapolis, and Oakland). Thus, the four cities database allows for a variety of neighborhood geographies for flexibility and tailoring relative to specific research questions. All neighborhood measures were based around the place of residence of participants.
The nominal geographic areas covered in the data collection effort were constrained to the official administrative boundaries of each of the four cities. The enclave city of Piedmont was included with the Oakland, CA, USA site, and the Norridge and Harwood Heights enclaves were included with the Chicago, IL, USA site. The particular geographic coverage of the different feature types varies to some degree, however, and some features also extend beyond each city boundary. Coverage maps of the areal extent per feature type are provided in Figures S1–S5 in Supplementary Material. Although approximately 25% of the CARDIA sample has moved outside of the four cities over the past 25 years, the four cities sample was restricted to the core four cities due to the resource intensity of the data collection process.
Field Audit Team and Training
Field site auditors (n = 5; one for Oakland, Minneapolis, and Birmingham and two at UNC who collected data in Chicago and coordinated the other field auditors) were recruited through personal contacts of the researchers and selected based on experience and professional training in city/regional planning and/or transportation engineering as well as familiarity with and connections in each of the four cities. The field auditors were instructed to collect data on introductions, renovations, and closures representing changes in recreation facilities (e.g., trails and parks) and transportation infrastructure (e.g., light rail, bike parking, and bike paths) over the period from 1985–1986 to 2010–2011. In January, 2012, UNC investigators and team members hosted an in-person orientation and training for all of the four cities field auditors. The protocol was developed by the four cities study investigators and reflected state-of-the-art in built environment knowledge and methods at the time (literature, experience of investigators). Training included a background to study and study objectives, descriptions of data features sought, instruction on data sources, and study guidelines on data standards and organization, application of GIS software for data management, as well as contingencies for possible challenges in the field. During active data collection, there was a weekly conference call with all field auditors and four cities’ investigators to discuss progress, address challenges, and share successful approaches for data collection, with ongoing daily support for auditors to ensure that data collection protocols were implemented with fidelity and to aid in data collection efforts. The protocol document was amended to reflect changes in protocol as a result of field experience.
Field Audit Data Collection Protocol
The four cities protocol outlined three main elements of data collection: (1) data to collect, (2) methodology for data collection, and (3) organization of data into a consistent study format. Features identified for data collection efforts included on-street bicycle lanes, off-road paved trails for bicycles or pedestrian use, bicycle parking, parks, rail stations, and routes, and city bus routes (Table 1). Field audit data collection began in January 2012 and lasted through August 2012.
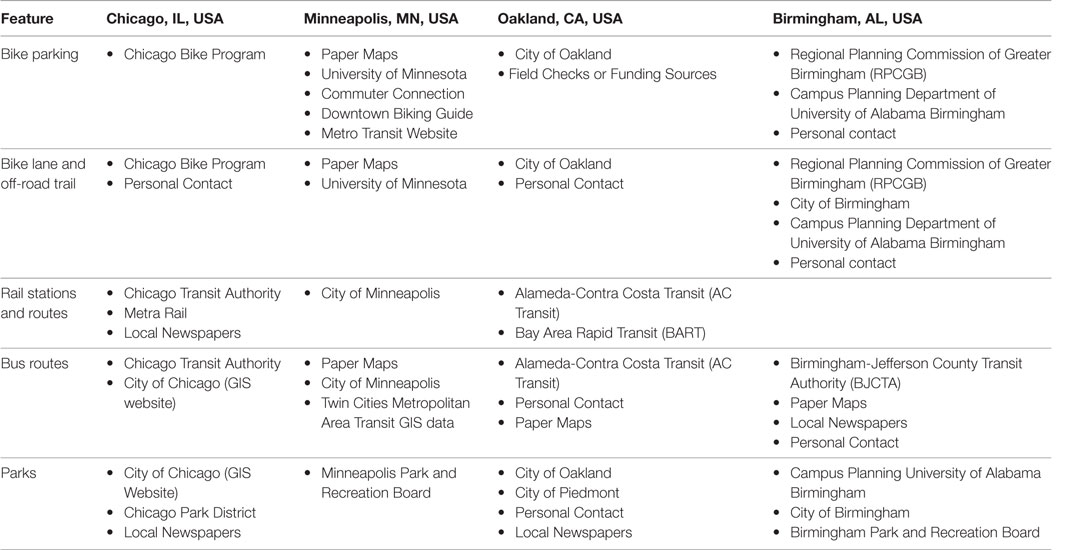
Table 1. Sources of information for the four cities study field audit.
Auditors first met with field representatives from local organizations, such as city planners and transportation engineers, to locate appropriate data. Auditors were instructed to collect data on the current status of each feature (e.g., bike lanes) and on feature changes of a substantial degree (e.g., changes in bike lanes) over the 25-year study period. For four cities definitions of feature changes of a substantial degree, see Table 2. Note that definitions of substantial changes vary by domain. Substantial changes in features were recorded, including data on the timing, location, and nature of change (e.g., number and length). A conservative approach was taken wherein all data on changes were collected with review by the study PIs and team to evaluate whether changes were indeed of a substantial degree.
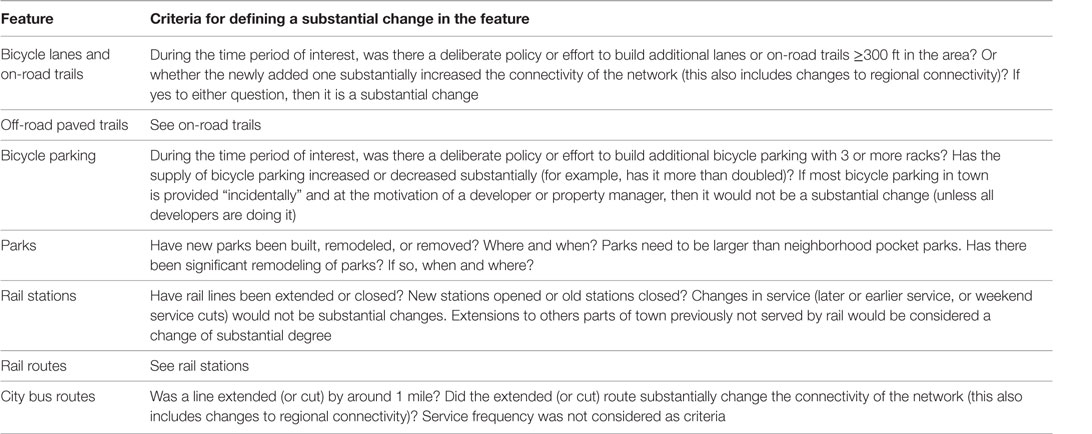
Table 2. Guidelines for determining whether a built environment feature changed to a substantial degree over the 25-year study period.
For each substantial change in a built environment feature, auditors were instructed to provide a GIS layer and data elements for an associated attribute table. GIS layers included standard metadata for each feature, including the projection, original data source and date, and units of scale (see Table 3). The attribute table design was specified in the data collection protocol to ensure compliance with the study’s coding convention. Each feature ID number began with an indicator for the city (2 = Birmingham, 3 = Chicago, 4 = Minneapolis, and 5 = Oakland), followed by a feature code (1–7 for, respectively, bicycle parking, bicycle lanes/on-road trails, rail stations, rail routes, city bus routes, parks, and off-road paved trails), followed by a 5-digit code indicating the specific feature (starting with 00001). For example, park #1 in Birmingham had a code of 2600001; bike lane #131 in Minneapolis had code 4200131. To the extent possible, we relied on written documentation about feature changes, such as city planning reports, physical maps, and GIS databases with changes in built environment over time. Local experts – individuals in the field with knowledge of the area and feature changes, such as city planning employees or members of advocacy organizations – were a key source of information when no written documentation existed. Auditors provided a qualitative indicator of the certainty of temporal estimate. Given the 25-year timespan of historic data collection, exact feature change dates could not always be confirmed, and auditors were asked to indicate whether time/date information was solid or based on an educated recollection of historic information. For all features, data fields comprised the dates of feature installations/openings/additions, remodeling, and closings, along with a dichotomous (0/1) temporal indicator of date certainty. Additional attributes varied by feature type (e.g., route extensions for trails and lanes, facility changes within parks, and numbers of bike racks at bike parking locations).
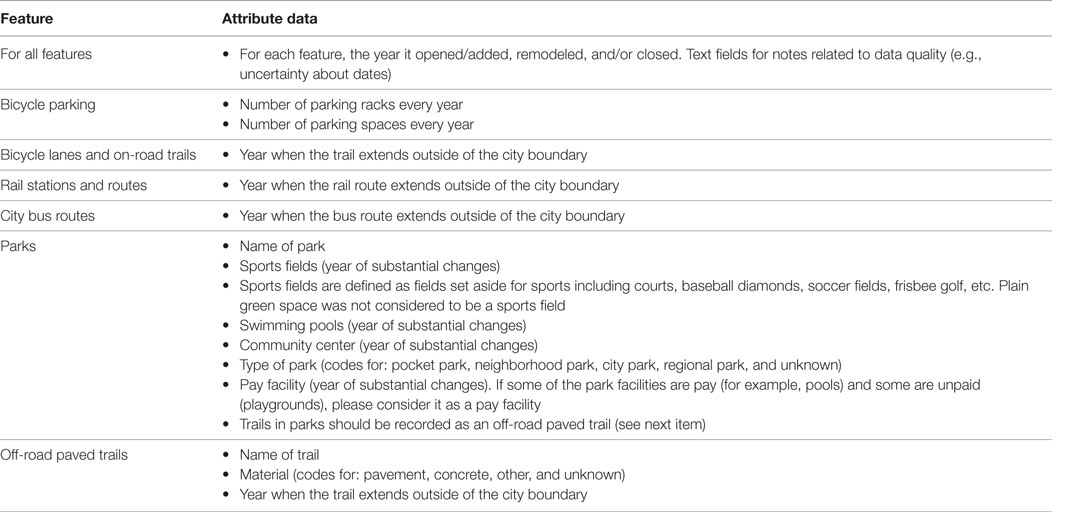
Table 3. Attribute data collected for each feature change of a substantial degree.
Field Audit Data Verification with CIP, TIP, and PCIP
An independent set of team members was selected based on experience and professional training in city/regional planning and/or transportation engineering to verify and expand on the on-the-ground audit. We approached the verification process of the field audit data using transportation improvement program (TIP) plans, capital improvement plans (CIP), and park capital improvement program (PCIP) plans for each of the cities obtained by contacting the city public works, metropolitan planning organization, and/or parks departments for each city. These plans helped to provide verification, including dates or timetable of investment, size or cost of investment, specific features modified during the investment, and programmed changes in features. CIPs and PCIPs provided data on recreational investments via short-range investment plans, usually 4–6 years, which identified capital projects and equipment purchases, a timetable and identified financing options, and a link between a municipality, school district, parks and recreation department and/or other local government entity, and a comprehensive and strategic plan and the entity’s annual budget (e.g., http://web.archive.org/web/20120308142650/http:/www.metrocouncil.org/parks/CIP.pdf). The TIPs provided data on programmed changes for bike lanes, bike racks, off-road trails, and rail stations. TIPs are public documents, required by Federal Law, that summarize the proposed transportation investments for the following 5–7 years, categorized by type and source of funds. TIPs were updated annually in the 1990s and every 2 years post 1998. Although estimated completion dates are given for projects in the plan, it should be noted that the TIP is not a CIP. Unlike CIPs, TIPs represent an agency’s intent to construct or implement a specific project and the anticipated flow of federal funds and matching state or local contributions (57). In cases where CIP and TIP documents were not available, CIP and TIP documents from the year prior were used as appropriate. For example, Minneapolis did not have a 1988 CIP, but the 1987 CIP had information on projects for parks from 1988, thus providing verification details. In this case, 1987 CIP document is used to verify 1988 projects for parks. It is important to note that not all projects would be registered in TIP, CIP, or PCIPs. Those projects may be programmed and funded through other mechanisms, such as regular operating budgets, school budgets, and bond proceeds. For this reason, the verification was considered exploratory, in the sense that it provided information about the policy landscape in each location but limited the possibility of conducting a formal validation.
Several rules were applied for the verification process as follows: the project completion year was defined as the change/open year. If the completion year was unavailable, then the commencement year was used as the change/open year. Updates were restricted to projects valued at $1,000 or more and projects that affect physical accessibility to the feature. Thus, projects such as fencing or lighting in parks were not included. We also calculated the annual investment amount for the four cities based on CIPs and TIPs, using different approaches based on data available for each city. For Chicago, Minneapolis, and Oakland, annual investment amounts were calculated as the aggregate investment for each project. For Birmingham, the annual investment amount was obtained from the yearly total investment amount table provided in the TIP and CIP documents.
For bicycle lanes and off-road trails, a brief examination of the files and consultation with local planners enabled the research team to identify these features using different types/names (e.g., greenway, rail-trail way, and multi-use trails) and make decisions regarding whether the specific feature served as bike or off-road trails. Then, the researcher used Google Maps to locate the lanes based on the description of the start and the end points of the change in the GIS field audit file. For parks, researchers identified the park name, project description (e.g., opening, addition, modeling and closing of sports field, swimming pool, or community center) and the year of the change from the CIPs or PCIPs file. If a feature already existed in the GIS field audit file, the verifier checked to see if the change noted in the CIPs or TIPs had been recorded. Changes were recorded if they were not present in the GIS field audit file. All of the cities experienced changes in their bicycle lanes and off-road trails and all excluding Chicago also saw additions of new lanes and trails. Chicago and Oakland made additions to their parks, and all cities excluding Birmingham made changes to their parks. Only Chicago and Minneapolis experienced a change in rail network during the time period studied.
Data Cleaning and Processing
All data were cleaned and harmonized across all four cities by the verification team using ArcGIS (ESRI, Redlands, CA, USA). Once delivered to study team personnel at UNC, the field audit data were verified and further standardized across all four cities. This data harmonization process and preliminary data analysis occasionally revealed the need for additional data corrections. For example, the recreational trail and bike lane data were modified to address topological inconsistencies, such as unintended small gaps along linear segments. Finalized geospatial datasets were subsequently processed in ArcGIS by a spatial technician from the Spatial Analysis Unit of the Carolina Population Center at UNC to aggregate measures to higher geographic levels (e.g., neighborhoods, tract, and zip code) and integrate measures with CARDIA participant data from the clinic visits at each exam.
Neighborhood features were compiled for each geographic level and every year (Table S1 in Supplementary Material) using a set of fixed neighborhood boundaries to isolate changes in features from simple boundary changes. Features and resources within 23-m (75-ft, determined by average road width) of a neighborhood were attributed to that neighborhood. Along a boundary shared between two neighborhoods, features within 23-m of each boundary were included in the data measures for both to reflect amenities that could be easily accessed by each neighborhood. This is because a bike lane, for example, serves both neighborhoods even if a street is between the neighborhood and the bike lane.
Estimates of features and resources were linked to each individual CARDIA participant’s geocoded address at every exam year. The geocoded residential location of a respondent is available for as many as six time points: circa 1985–1986, 1992–1993, 1995–1996, 2000–2001, 2005–2006, and 2010–2011 (corresponding to CARDIA exam years 0, 7, 10, 15, 20, and 25, respectively). For any exam period, a respondent’s location may be within the four cities, outside the four cities, or unknown (e.g., absent from the study). Field audit data measures were assigned to individual respondents for each year that they lived in the four cities. Multi-year spans of audit data were assigned to each participant location by calculating the mid-point years between CARDIA exams and assuming that the participant remained in the same residence during that time (preceding inter-exam midpoint to succeeding inter-exam midpoint). Since 75% of participants remain in these cities, we have a rich longitudinal dataset of these individuals.
The proximity and accessibility of audited transportation infrastructure and recreational facilities relative to each participant’s residential location were measured in multiple ways, as appropriate for each feature type (Table S1 in Supplementary Material). Distance to the nearest available feature was calculated in both Euclidean and network distance. Where relevant, other measures represent features within 250-m, 500-m, 1-km, 3-km, 5-km, and 8.05-km Euclidean and network buffers around the respondent’s geocoded residential location. For parks, we also calculated an inverse-distance weighted accessibility index to all parks in each city. Where a participant’s buffer extended beyond the boundaries of data, an indicator of the area within the city boundaries was created for use in analyses.
Results
Not all CIP, TIP, and PCIP documents were available at all periods (see Table 4). Birmingham was especially challenging to gather data from, with no TIP until 1993 and no CIP or PCIP. In general, rail, trail, and park data were easier to gather from these documents than bicycle data.
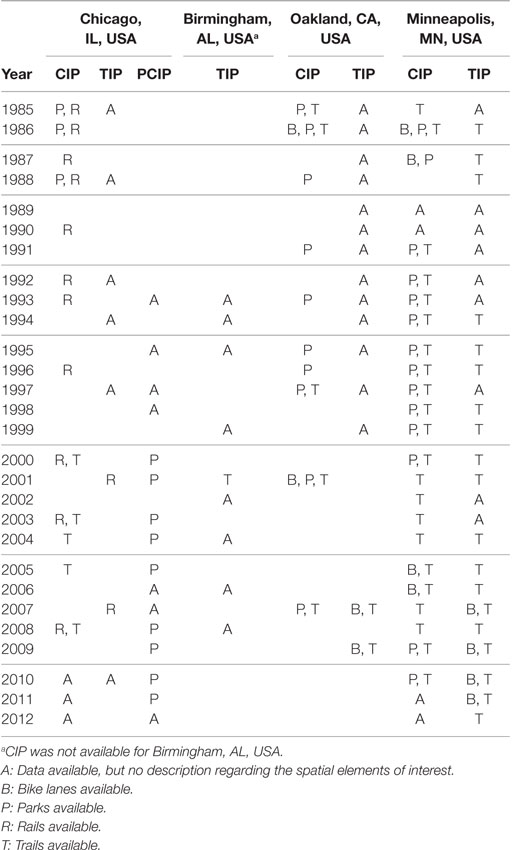
Table 4. Availability of CIP, PCIP, and TIP by year for verification of spatial elements and feature tables.
Bicycle parking, lanes, and recreation trails all increased dramatically between 1985 and 2011. Most notably, bicycle parking increased in Chicago, IL and Oakland, CA (USA) starting in 2000 (Figure 2). Similarly, tremendous growth occurred in bicycle lanes and recreational trails in all cities except Birmingham, AL, USA starting in the mid 1990s and continuing until the end of the retrospective audit (Figure 3). Minneapolis, MN, USA experienced the largest increase, followed by Chicago, IL, USA, and then by Oakland, CA, USA. During the duration of the retrospective audit, minimal changes occurred in bus service, rail lines and stations, and parks (Figures S6–S9 in Supplementary Material). However, bus service increased slightly in Birmingham, AL and Minneapolis, MN (USA). In addition, while Minneapolis, MN and Birmingham, AL (USA) did not have rail lines for the earlier part of the study, Minneapolis, MN, USA started a rail line in 2004 with 10 stations (adding 1 more station post-completion).
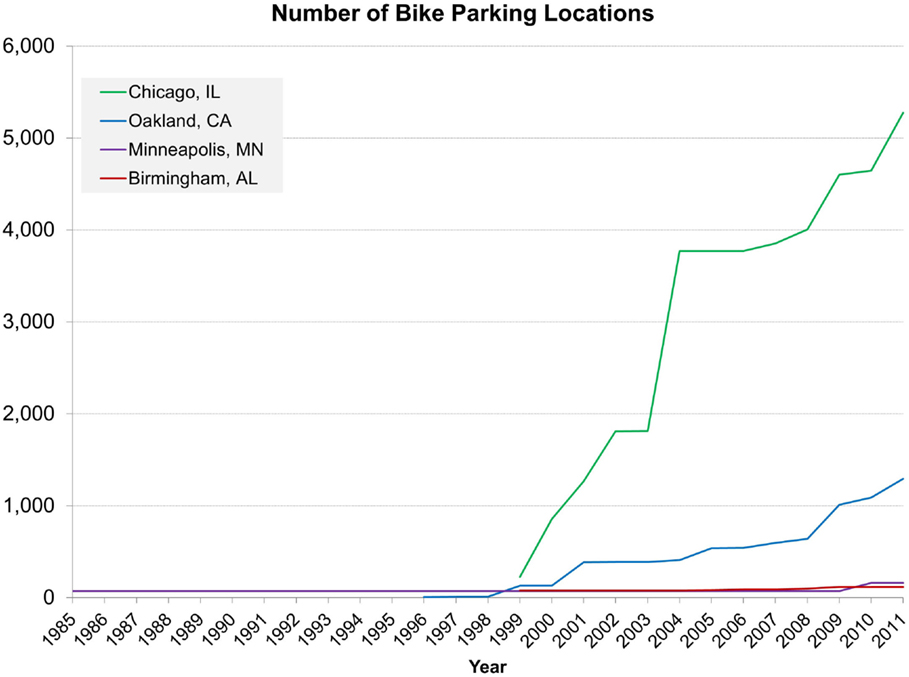
Figure 2. Change in number of bicycle parking locations between 1985 and 2011 by city in the CARDIA four cities field audit. Green represents Chicago, IL, USA; blue represents Oakland, CA, USA; purple represents Minneapolis, MN, USA; red represents Birmingham, AL, USA.
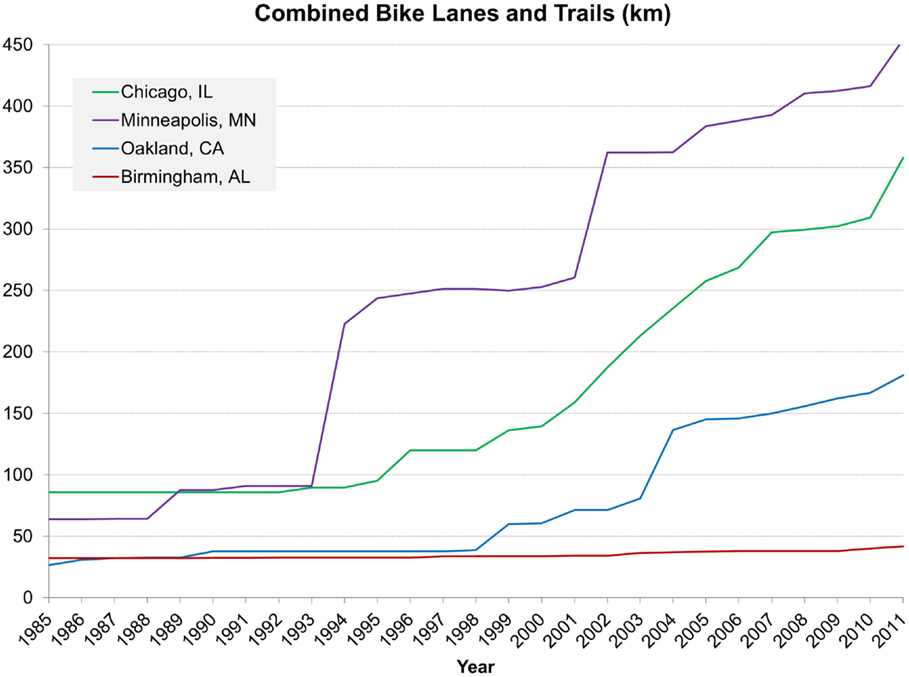
Figure 3. Change in distance of bicycle lanes and recreational trails (kilometers) between 1985 and 2011 by city in the CARDIA four cities field audit. Green represents Chicago, IL, USA; blue represents Oakland, CA, USA; purple represents Minneapolis, MN, USA; red represents Birmingham, AL, USA.
Discussion
This protocol details methods to collect, verify, and process historic data on the built environment in the field audit component of the CARDIA four cities study. We developed and verified retrospective field audits in four cities [Birmingham, AL; Chicago, IL; Minneapolis, MN; and Oakland, CA (USA)] to capture introductions, renovations, and closures representing changes in recreation facilities (e.g., trails and parks) and transportation infrastructure (e.g., bus, light rail, bike parking, and bike paths). These derived data were then linked to CARDIA sites’ respondents’ geographic locations over the 25-year study period to examine associations with health behaviors and outcomes. Our methodology can be used as a model for other studies seeking to generate detailed data on historical changes in built environment features over a long period of time.
Several practical and operational issues arose during these retrospective audits. One of the primary practical issues surrounded the level of detail for data collection, which required balance between parsimony and level of detail. The first major issue was determining what changes in features represented a substantial change. For example, we discussed situations regarding extensions of bus routes for specified distances to determine a cut point that would represent a substantial change in bus service for a given location. Similarly, we discussed whether a specified number of new bicycle parking spaces would be considered a change of a substantial degree. The guidelines specified in this paper demonstrate our balance between parsimony and sufficient data to capture changes in features. Although we present our guidelines for determining substantial change, some decisions required case-by-case attention given differences in detailed reporting of changes from various sources across cities. Additionally, this data collection was limited by a focus on infrastructure features (i.e., bicycle, trail, park, and transit). Thus, this protocol does not outline methods for capturing larger-scale built environment characteristics (e.g., density and land use mix).
Generally, cities are not collecting data for research, and it is the responsibility of researchers to forge partnerships that enable archiving of data for longitudinal and historic research. There was substantial variability in historic data and documentation by city. Some attributes were particularly challenging to document. Bicycle parking was one such feature due to the nature of reporting by local city governments, which was more focused on status quo rather than changes. In some cases, local officials and municipal employees overwrote or deleted data that they deemed “old” and replaced data with updated information. Additionally, verification was unequal across cities due to differences in availability of CIPs, TIPs, and PCIPs. This limitation might result in differential percentages of data verified by city or more accurate data for one city over another. Another contributing factor was unevenness in willingness to provide access to data. This is likely due to differences in the allocation of resources devoted to these issues or the internal structure of departments within cities. It is critical for researchers to create partnerships with local governments in order to archive data for future research.
Our choice to include auditors and verifiers with intimate knowledge of the cities was critical for decision-making around apparent inconsistencies in the data. While some auditors had knowledge of, and documented information about, specific people or sources of information, others had to rely solely on the information gleaned from the retrospective audit. For example, in several of our cities, we had names and information for key contacts, whereas in others, we only had the primary data source for each data element. Local, non-institutional community organizations also played a key role. For example, in Birmingham, we were able to meet a citizen who had collected all transit maps. Creating partnerships with local groups can also represent a bi-directional endeavor that can increase communication between researchers and communities; in Oakland, CA, USA, we worked with a group of city planners who were interested in seeing results and aggregated information after completion of data collection for their own purposes. Thus, there was clear benefit of our data collection for these local organizations.
Despite these complexities, our method provides a novel and valuable direction in the collection of retrospective neighborhood data for use in longitudinal analyses. Although the data produced have limitations that would not exist with prospectively collected data, they give insight into the way neighborhoods have changed over time. Our ability to link these data to the CARDIA clinical exam data allows researchers the potential for studies assessing the relationship between built environment changes and health behaviors. Additionally, the process of performing these field audits builds a network of informants within research cities that can help fuel new research questions, built evidence around appropriate model specifications, interpret research findings, and ultimately bridge the gap between research and cities to translate findings back into meaningful neighborhood policies. Given the importance of these data for research and the valuable direct application to resource allocation, future work should strive to build relationships with local governments around data collection and management.
Conclusion
This methodology details the innovative process of performing retrospective field audits of built environment data. Although the data produced have limitations that would not exist with prospectively collected data, they give insight into the way neighborhoods have changed over time. Specifically, we found large increases in bicycle infrastructure. Our methodology can be used as a model for other studies seeking to generate detailed data on historical changes in built environment features over a long period of time. Measures from this data compilation process can be combined with existing longitudinal cohort studies to examine critical questions of neighborhood resources’ influence on health behaviors and health outcomes.
Author Notes
JH is a postdoctoral fellow in the Carolina Population Center at the University of North Carolina at Chapel Hill. She holds a PhD in Epidemiologic Science from the University of Michigan, a Master in Environmental Studies, and a Bachelor of Arts in Environmental Studies, Health and Societies and Nutrition from the University of Pennsylvania. KM is a Research Assistant Professor in the Nutrition Department at the University of North Carolina at Chapel Hill. She holds a ScD in Epidemiology from Harvard University, a Master of Public Health in Epidemiology from the University of Minnesota, and a Bachelor of Arts in Art History from Macalester College. MP is a Research Associate and Senior Spatial Analyst at the Carolina Population Center. He has a Master of Arts in Geography and Bachelor of Arts in Earth Science, both from the University of Northern Iowa. He has 15 years of geospatial and satellite remote sensing analytic and modeling experience. DR is a Distinguished Professor of Sustainable Community Design in the Department of City and Regional Planning, an Adjunct Professor in the Department of Epidemiology, and the Director of the Center for Sustainable Community Design within the Institute for the Environment at the University of North Carolina at Chapel Hill. He holds a PhD in Urban Planning from the University of Michigan, a Master of Science in Transportation from the Massachusetts Institute of Technology, and a Bachelor of Science from Fordham University. YS is a professor in the Department of City and Regional Planning at the University of North Carolina at Chapel Hill. She holds a PhD in City and Regional Planning from the University of Illinois at Urbana-Champaign. KP is a doctoral student in the Department of City and Regional Planning at the University of North Carolina at Chapel Hill. She holds a Master of City and Regional Planning from the University of North Carolina at Chapel Hill, a Master of Science in Architecture Design and Theory from Shenzhen University, and a Bachelor of Arts in Architecture Design and Theory from Hunan University. JH is a doctoral student in the Department of City and Regional Planning at the University of North Carolina at Chapel Hill. He holds a Bachelor of Science and Master of Science in Civil and Environmental Engineering from Sung Kyun Kwan University and a Master of City and Regional Planning from the University of North Carolina at Chapel Hill. PG-L is a Professor in the Department of Nutrition and the Carolina Population Center at the University of North Carolina at Chapel Hill. She holds a PhD and Master of Arts in Physical Anthropology from the University of Pennsylvania and a Bachelor of Arts in Anthropology and Experimental Psychology from Tulane University.
Author Contributions
JH and KM drafted the study protocol manuscript. All authors reviewed and contributed to the final draft. PG-L, DR, MP, and YS were involved in data generation and analysis. JH, KP, and MP were involved in GIS processing. PG-L secured funding to perform the ancillary study.
Conflict of Interest Statement
The authors declare that the research was conducted in the absence of any commercial or financial relationships that could be construed as a potential conflict of interest.
Acknowledgments
The authors would like to acknowledge the help of local personal contacts without whom much of the retrospective field audit would not have been possible: Kelly Cha, Sheila Chaffin, Robbie Fearn, Butch Ferrell, Md. Shah Imran, Mark Lightner, Thomas Maxwell, Laurie Mitchell, Stephen Newhouse, Wytangy Peak, Stanley Robinson, Anna Schafer, Doug Shidell, David Smith, Michael Ward, Solomon Wilson, and Michael Ziyambi. This work was funded by the National Heart, Lung, and Blood Institute (NHLBI) R01-HL114091. The Coronary Artery Risk Development in Young Adults Study (CARDIA) is conducted and supported by the NHLBI in collaboration with the University of Alabama at Birmingham (HHSN268201300025C and HHSN268201300026C), Northwestern University (HHSN268201300027C), University of Minnesota (HHSN268201300028C), Kaiser Foundation Research Institute (HHSN268201300029C), and Johns Hopkins University School of Medicine (HHSN268200900041C). CARDIA is also partially supported by the Intramural Research Program of the National Institute on Aging (NIA) and an intra-agency agreement between NIA and NHLBI (AG0005). For general support, the authors are grateful to the Carolina Population Center, University of North Carolina at Chapel Hill [grant P2C-HD050924 from the Eunice Kennedy Shriver National Institute of Child Health and Human Development (NICHD)], the Nutrition Obesity Research Center (NORC), University of North Carolina [grant P30-DK56350 from the National Institute for Diabetes and Digestive and Kidney Diseases (NIDDK)], and the UNC Center for Environmental Health and Susceptibility (CEHS), University of North Carolina [grant P30-ES010126 from the National Institute of Environmental Health Sciences (NIEHS)]. This research also received support from the Population Research Training grant (T32-HD007168) awarded to the Carolina Population Center by NICHD. This manuscript has been reviewed by CARDIA for scientific content. NIH had no role in the design or conduct of the study; collection, management, analysis, or interpretation of the data; or preparation, review, or approval of the manuscript.
Supplementary Material
The Supplementary Material for this article can be found online at http://journal.frontiersin.org/article/10.3389/fpubh.2016.00065
Abbreviations
CARDIA, coronary artery risk development in young adults; CIP, capital improvement plan; GIS, geographic information systems; PCIP, park capital improvement program; TIP, transportation improvement plan; UNC, University of North Carolina.
References
1. Diez Roux AV, Merkin SS, Arnett D, Chambless L, Massing M, Nieto FJ, et al. Neighborhood of residence and incidence of coronary heart disease. N Engl J Med (2001) 345(2):99–106. doi:10.1056/NEJM200107123450205
2. Chaix B. Geographic life environments and coronary heart disease: a literature review, theoretical contributions, methodological updates, and a research agenda. Annu Rev Public Health (2009) 30:81–105. doi:10.1146/annurev.publhealth.031308.100158
3. Leal C, Chaix B. The influence of geographic life environments on cardiometabolic risk factors: a systematic review, a methodological assessment and a research agenda. Obes Rev (2011) 12(3):217–30. doi:10.1111/j.1467-789X.2010.00726.x
4. Pickett KE, Pearl M. Multilevel analyses of neighbourhood socioeconomic context and health outcomes: a critical review. J Epidemiol Community Health (2001) 55(2):111–22. doi:10.1136/jech.55.2.111
5. Northridge ME, Freeman L. Urban planning and health equity. J Urban Health (2011) 88(3):582–97. doi:10.1007/s11524-011-9558-5
6. Northridge ME, Sclar ED, Biswas P. Sorting out the connections between the built environment and health: a conceptual framework for navigating pathways and planning healthy cities. J Urban Health (2003) 80(4):556–68. doi:10.1093/jurban/jtg064
7. Schulz A, Northridge ME. Social determinants of health: implications for environmental health promotion. Health Educ Behav (2004) 31(4):455–71. doi:10.1177/1090198104265598
8. Saelens BE, Handy SL. Built environment correlates of walking: a review. Med Sci Sports Exerc (2008) 40(7 Suppl):S550. doi:10.1249/MSS.0b013e31817c67a4
9. Bauman A, Bull F. Environmental Correlates of Physical Activity and Walking in Adults and Children: A Review of Reviews. London: National Institute of Clinical and Health Excellence (2007).
10. Ding D, Gebel K. Built environment, physical activity, and obesity: what have we learned from reviewing the literature? Health Place (2012) 18(1):100–5. doi:10.1016/j.healthplace.2011.08.021
11. Ding D, Sallis JF, Kerr J, Lee S, Rosenberg DE. Neighborhood environment and physical activity among youth: a review. Am J Prev Med (2011) 41(4):442–55. doi:10.1016/j.amepre.2011.06.036
12. Durand CP, Andalib M, Dunton GF, Wolch J, Pentz MA. A systematic review of built environment factors related to physical activity and obesity risk: implications for smart growth urban planning. Obes Rev (2011) 12(5):e173–82. doi:10.1111/j.1467-789X.2010.00826.x
13. Feng J, Glass TA, Curriero FC, Stewart WF, Schwartz BS. The built environment and obesity: a systematic review of the epidemiologic evidence. Health Place (2010) 16(2):175. doi:10.1016/j.healthplace.2009.09.008
14. Ferdinand AO, Sen B, Rahurkar S, Engler S, Menachemi N. The relationship between built environments and physical activity: a systematic review. Am J Public Health (2012) 102(10):e7–13. doi:10.2105/AJPH.2012.300740
15. Gebel K, Bauman AE, Petticrew M. The physical environment and physical activity: a critical appraisal of review articles. Am J Prev Med (2007) 32(5):361–369.e363. doi:10.1016/j.amepre.2007.01.020
16. Giles-Corti B, Timperio A, Bull F, Pikora T. Understanding physical activity environmental correlates: increased specificity for ecological models. Exerc Sport Sci Rev (2005) 33(4):175–81. doi:10.1097/00003677-200510000-00005
17. Giskes K, Van Lenthe F, Avendano-Pabon M, Brug J. A systematic review of environmental factors and obesogenic dietary intakes among adults: are we getting closer to understanding obesogenic environments? Obes Rev (2011) 12(5):e95–106. doi:10.1111/j.1467-789X.2010.00769.x
18. Heath GW, Brownson RC, Kruger J, Miles R, Powell KE, Ramsey LT. The effectiveness of urban design and land use and transport policies and practices to increase physical activity: a systematic review. J Phys Act Health (2006) 3(Suppl 1):S55–76.
19. Lovasi GS, Grady S, Rundle A. Steps forward: review and recommendations for research on walkability, physical activity and cardiovascular health. Public Health Rev (2012) 33(2):484–506.
20. Van Cauwenberg J, De Bourdeaudhuij I, De Meester F, Van Dyck D, Salmon J, Clarys P, et al. Relationship between the physical environment and physical activity in older adults: a systematic review. Health Place (2011) 17(2):458–69. doi:10.1016/j.healthplace.2010.11.010
21. Van Holle V, Deforche B, Van Cauwenberg J, Goubert L, Maes L, Van de Weghe N, et al. Relationship between the physical environment and different domains of physical activity in European adults: a systematic review. BMC Public Health (2012) 12(1):807. doi:10.1186/1471-2458-12-807
22. Wendel-Vos W, Droomers M, Kremers S, Brug J, Van Lenthe F. Potential environmental determinants of physical activity in adults: a systematic review. Obes Rev (2007) 8(5):425–40. doi:10.1111/j.1467-789X.2007.00370.x
23. Yen IH, Michael YL, Perdue L. Neighborhood environment in studies of health of older adults: a systematic review. Am J Prev Med (2009) 37(5):455–63. doi:10.1016/j.amepre.2009.06.022
24. Boone-Heinonen J, Guilkey DK, Evenson KR, Gordon-Larsen P. Residential self-selection bias in the estimation of built environment effects on physical activity between adolescence and young adulthood. Int J Behav Nutr Phys Act (2010) 7(70):1–11. doi:10.1186/1479-5868-7-70
25. Boone-Heinonen J, Gordon-Larsen P, Guilkey DK, Jacobs DR, Popkin BM. Environment and physical activity dynamics: the role of residential self-selection. Psychol Sport Exerc (2011) 12(1):54–60. doi:10.1016/j.psychsport.2009.09.003
26. Mokhtarian PL, Cao X. Examining the impacts of residential self-selection on travel behavior: a focus on methodologies. Transp Res Part B Methodol (2008) 42(3):204–28. doi:10.1016/j.trb.2007.07.006
27. Nechyba TJ, Walsh RP. Urban sprawl. J Econ Perspect (2004) 18(4):177–200. doi:10.1257/0895330042632681
28. Kruger J, Ham SA, Kohl HW III. Trends in leisure-time physical inactivity by age, sex, and race/ethnicity-United States, 1994-2004. MMWR (2005) 54(39):991–4.
29. Cervero R. Road expansion, urban growth, and induced travel: a path analysis. J Am Plann Assoc (2003) 69(2):145–63. doi:10.1080/01944360308976303
30. Bell JF, Wilson JS, Liu GC. Neighborhood greenness and 2-year changes in body mass index of children and youth. Am J Prev Med (2008) 35(6):547–53. doi:10.1016/j.amepre.2008.07.006
31. Berry T, Spence J, Blanchard C, Cutumisu N, Edwards J, Nykiforuk C. Changes in BMI over 6 years: the role of demographic and neighborhood characteristics. Int J Obes (2010) 34(8):1275–83. doi:10.1038/ijo.2010.36
32. Cao X, Mokhtarian PL, Handy SL. Do changes in neighborhood characteristics lead to changes in travel behavior? A structural equations modeling approach. Transportation (2007) 34(5):535–56. doi:10.1007/s11116-007-9132-x
33. Hirsch JA, Diez Roux AV, Moore KA, Evenson KR, Rodriguez DA. Change in walking and body mass index following residential relocation: the multi-ethnic study of atherosclerosis. Am J Public Health (2014) 104(3):e49–56. doi:10.2105/AJPH.2013.301773
34. Hirsch JA, Moore KA, Clarke PJ, Rodriguez DA, Evenson KR, Brines SJ, et al. Changes in the built environment and changes in the amount of walking over time: longitudinal results from the multi-ethnic study of atherosclerosis. Am J Epidemiol (2014) 180(8):799–809. doi:10.1093/aje/kwu218
35. Humpel N, Marshall AL, Leslie E, Bauman A, Owen N. Changes in neighborhood walking are related to changes in perceptions of environmental attributes. Ann Behav Med (2004) 27(1):60–7. doi:10.1207/s15324796abm2701_8
36. Li F, Fisher J, Brownson RC. A multilevel analysis of change in neighborhood walking activity in older adults. J Aging Phys Act (2005) 13(2):145.
37. Li F, Harmer P, Cardinal BJ, Bosworth M, Johnson-Shelton D, Moore JM, et al. Built environment and 1-year change in weight and waist circumference in middle-aged and older adults Portland neighborhood environment and health study. Am J Epidemiol (2009) 169(4):401–8. doi:10.1093/aje/kwn398
38. Li F, Harmer P, Cardinal BJ, Vongjaturapat N. Built environment and changes in blood pressure in middle aged and older adults. Prev Med (2009) 48(3):237–41. doi:10.1016/j.ypmed.2009.01.005
39. Michael YL, Gold R, Perrin N, Hillier T. Built environment and change in body mass index in older women. Health Place (2013) 22:7–10. doi:10.1016/j.healthplace.2013.02.001
40. Michael YL, Nagel C, Gold R, Hillier TA. Does change in the neighborhood environment prevent obesity in older women? Soc Sci Med (2014) 102:129–37. doi:10.1016/j.socscimed.2013.11.047
41. Michael YL, Perdue LA, Orwoll ES, Stefanick ML, Marshall LM; Osteoporotic Fractures in Men Study Group. Physical activity resources and changes in walking in a cohort of older men. Am J Public Health (2010) 100(4):654–60. doi:10.2105/AJPH.2009.172031
42. Mumford KG, Contant CK, Weissman J, Wolf J, Glanz K. Changes in physical activity and travel behaviors in residents of a mixed-use development. Am J Prev Med (2011) 41(5):504–7. doi:10.1016/j.amepre.2011.07.016
43. Ranchod YK, Diez Roux AV, Evenson KR, Sánchez BN, Moore K. Longitudinal associations between neighborhood recreational facilities and change in recreational physical activity in the multi-ethnic study of atherosclerosis, 2000-2007. Am J Epidemiol (2014) 179(3):335–43. doi:10.1093/aje/kwt263
44. Beenackers MA, Foster S, Kamphuis C, Titze S, Divitini M, Knuiman M, et al. Taking up cycling after residential relocation: built environment factors. Am J Prev Med (2012) 42(6):610–5. doi:10.1016/j.amepre.2012.02.021
45. Giles-Corti B, Bull F, Knuiman M, McCormack G, Van Niel K, Timperio A, et al. The influence of urban design on neighbourhood walking following residential relocation: longitudinal results from the RESIDE study. Soc Sci Med (2013) 77:20–30. doi:10.1016/j.socscimed.2012.10.016
46. Mayne S, Auchincloss A, Michael Y. Impact of policy and built environment changes on obesity-related outcomes: a systematic review of naturally occurring experiments. Obes Rev (2015) 16(5):362–75. doi:10.1111/obr.12269
47. Friedman GD, Cutter GR, Donahue RP, Hughes GH, Hulley SB, Jacobs DR, et al. CARDIA: study design, recruitment, and some characteristics of the examined subjects. J Clin Epidemiol (1988) 41(11):1105–16. doi:10.1016/0895-4356(88)90080-7
48. Hughes GH, Cutter G, Donahue R, Friedman GD, Hulley S, Hunkeler E, et al. Recruitment in the coronary artery disease risk development in young adults (CARDIA) study. Control Clin Trials (1987) 8(4):68–73. doi:10.1016/0197-2456(87)90008-0
49. Ewing R, Brownson RC, Berrigan D. Relationship between urban sprawl and weight of United States youth. Am J Prev Med (2006) 31(6):464–74. doi:10.1016/j.amepre.2006.08.020
50. Kelly-Schwartz AC, Stockard J, Doyle S, Schlossberg M. Is sprawl unhealthy? A multilevel analysis of the relationship of metropolitan sprawl to the health of individuals. J Plann Educ Res (2004) 24(2):184–96. doi:10.1177/0739456X04267713
51. Subramanian S, Chen JT, Rehkopf DH, Waterman PD, Krieger N. Racial disparities in context: a multilevel analysis of neighborhood variations in poverty and excess mortality among black populations in Massachusetts. Am J Public Health (2005) 95(2):260–5. doi:10.2105/AJPH.2003.034132
52. Rundle A, Diez Roux AV, Freeman LM, Miller D, Neckerman KM, Weiss CC. The urban built environment and obesity in New York City: a multilevel analysis. Am J Health Promot (2007) 21(4s):326–34. doi:10.4278/0890-1171-21.4s.326
53. Gordon-Larsen P, Nelson MC, Page P, Popkin BM. Inequality in the built environment underlies key health disparities in physical activity and obesity. Pediatrics (2006) 117(2):417–24. doi:10.1542/peds.2005-0058
54. King WC, Belle SH, Brach JS, Simkin-Silverman LR, Soska T, Kriska AM. Objective measures of neighborhood environment and physical activity in older women. Am J Prev Med (2005) 28(5):461–9. doi:10.1016/j.amepre.2005.02.001
55. Frank LD, Schmid TL, Sallis JF, Chapman J, Saelens BE. Linking objectively measured physical activity with objectively measured urban form: findings from SMARTRAQ. Am J Prev Med (2005) 28(2):117–25. doi:10.1016/j.amepre.2004.11.001
56. City of Chicago. Geographic Information Systems. (2012). Available from: http://www.cityofchicago.org/city/en/depts/doit/dataset/boundaries_-_communityareas.html
57. CLRP. The Six-Year Transportation Improvement Program. (2007). Available from: http://www.mwcog.org/clrp/projects/tip/
Keywords: community design, field audit, transportation, infrastructure, parks, GIS, longitudinal, methods
Citation: Hirsch JA, Meyer KA, Peterson M, Rodriguez DA, Song Y, Peng K, Huh J and Gordon-Larsen P (2016) Obtaining Longitudinal Built Environment Data Retrospectively across 25 years in Four US Cities. Front. Public Health 4:65. doi: 10.3389/fpubh.2016.00065
Received: 24 December 2015; Accepted: 27 March 2016;
Published: 19 April 2016
Edited by:
Dan J. Graham, Colorado State University, USAReviewed by:
Jay E. Maddock, Texas A&M University, USAJordan Carlson, Children’s Mercy Hospital, USA
Copyright: © 2016 Hirsch, Meyer, Peterson, Rodriguez, Song, Peng, Huh and Gordon-Larsen. This is an open-access article distributed under the terms of the Creative Commons Attribution License (CC BY). The use, distribution or reproduction in other forums is permitted, provided the original author(s) or licensor are credited and that the original publication in this journal is cited, in accordance with accepted academic practice. No use, distribution or reproduction is permitted which does not comply with these terms.
*Correspondence: Jana A. Hirsch, aGlqYW5hQGxpdmUudW5jLmVkdQ==;
Marc Peterson, bWFyYy5wZXRlcnNvbkB1bmMuZWR1