 Matthias Dreher
 Sascha W. Hoffmann1,2†
 Perikles Simon
- 1Department of Sports Medicine, Disease Prevention and Rehabilitation, Institute of Sports Science, Johannes Gutenberg University Mainz, Mainz, Germany
- 2Department of Sports Medicine/Sports Physiology, University of Bayreuth, Bayreuth, Germany
The etiology of overweight and obesity is a mixture of genetic determinants, environmental factors, and health behaviors. Especially intra- and interpersonal inactive behaviors, here termed convenience, seems to play an important role. The objective was to develop and validate the Convenience Behavior Questionnaire (CBQ) to assess convenience-related items and their association with overweight and obesity in a large population. A sample of 1233 subjects aged 18–82 years from six population groups took part in a self-administered questionnaire. Test-retest reliability was estimated and the independent association between convenience-related items and overweight and obesity was investigated. Principal component analysis revealed three factors (avoidance behaviors, social interaction behaviors and domestic environmental factors) which explained 43.4% of the variance contributing to the CBQ. Cronbach's α ranged from 0.80–0.89. Test-retest reliability using intra-class correlation was acceptable ≥ 0.70. Forward stepwise logistic regression analysis, including gender, education level, age and TV viewing on weekends showed a positive relation of convenience behavior and overweight (OR: 1.40; 95% CI: 1.01–1.96; P = 0.048), while physical activity status was not significantly associated with overweight (OR: 1.09; 95% CI: 0.77–1.54; P = 0.629). The CBQ seems to be a reliable tool which considers non-traditional behaviors related to overweight development. Interestingly our findings revealed a better relationship between convenience-related behavior with overweight and obesity than the habitual physical activity score.
Introduction
The etiology of overweight and obesity has been attributed to a complex mixture of genetic determinants (1–3), environmental factors (4–6) and unfavorable health behaviors (7–10). These unhealthy behaviors are often described as the presence of sedentary behaviors such as insufficient physical activity, high screen time activity, or risk factors like excessive caloric intake, reduced sleep and smoking (7–15). An astounding 30% of EU citizens stated in 2013 that they are never or seldom physically active more than once a week (16). Furthermore, it may be possible that people meet current physical activity guidelines, but also engage several hours per day in sedentary behaviors and are therefore not physically active (17). This finding supports the relative importance of physical inactivity, sedentary behaviors, energy balance and dietary patterns of the obesity epidemic and its accompanying diseases (18–23).
A large amount of literature reports that certain personality traits are related to lifestyles which promote health (24–26). In particular, people who scored higher on extraversion, conscientiousness, and openness to experience were more likely to engage in a variety of activity types of behavior (27, 28), while overweight and obese individuals scored lower on conscientiousness and openness to experience (29, 30).
However, Jokela et al. emphasized that only conscientiousness reflecting high self-control, orderliness, and adherence to social norms, may be a robust, broad-level personality trait associated with reduced obesity risk (31). This would imply that specific intra- and interpersonal inactive behaviors, here termed convenience, could be factors associated with being overweight and with obesity independent from a physically active lifestyle. Also, it should be taken into account that several of the convenience behaviors could be passive, while others would be done with deliberate intent and obvious volition (32).
Some personality traits also imply a relevant association for avoidance behaviors, social behaviors or behaviors related to the domestic environment with obesity and being overweight. The knowledge from the theoretical considerations indicates that avoidance behavior is i.e., a self-protective coping strategy and creates barriers to a healthy lifestyle and a healthy body weight (33–36). The individual social context (i.e., social networks, new media usage, social support) influences health behaviors and behavior changes which may lead to negative changes in eating behavior, physical activity, and body weight (37–41). Within a domestic environment (i.e., housework, having less cooking skills, doing fewer chores or convenience orientation toward ready meal preparation) has an influence on weight and therefore, on the overweight status (42–44).
These factors are not yet considered systematically in a uniform evaluation tool and seem to be underinvestigated or not deemed relevant in the current public health debate. To the best of our knowledge, we present the first study which investigates the possibility to assess items reflecting convenience behavior in a broader sense by using a score value derived from a standardized questionnaire. For this purpose, we derived health behavior connected questions from the dimensions “avoidance,” “social,” and “domestic” and set them into relation of the domains of “work,” “leisure-time,” “domestic and family” which are shown to a have a overweight and obesity relation.
These domains were chosen to achieve congruence in structure and evaluation to the Habitual Physical Activity Questionnaire (HPAQ) of Baecke et al. which differentiates between physical activity at work, physical activity during leisure time and sports during leisure time (45).
The development of an appropriate, valid and reliable assessment tool in the field of overweight prevention is necessary to better understand if the convenience behavior in daily life is truly independent of the known influencing factors such as habitual physical activity (HPA). The present study (a) investigates the construct validity of a self-administered questionnaire about convenience-related behavior, to establish meaningful indices of convenience, (b) estimates the test-retest reliability, and (c) investigates the independent association between convenience-related items and overweight and obesity status in a large adult population.
Materials and Methods
Development of the Convenience Behavior Questionnaire (CBQ)
The aim of the questionnaire is to measure terms of convenience behaviors in three domains analogous to the HPAQ of Baecke et al. (45) in terms of physical activity. The HPAQ is easy to administer and a short, practical assessment tool to extrapolate a general more long-lasting physical activity level (45). The HPAQ has furthermore been evaluated and validated in previous research studies (46) as well as with obese individuals (47, 48).
The knowledge from the theoretical considerations, that avoidance behavior (33–36), social related behaviors (37–41) and daily behaviors around the domestic environment (42–44) seem to influence weight and therefore, the overweight status, sets scientific foundation for the questionnaire development. In total 24 items pertaining to the domains of work environment, during leisure-time, in private life and in the domestic environment were derived and connected, to the three behavior dimensions.
The developmental process included: Initial questionnaire development, refinements based on focus group responses, refinements based on responses from researchers, pilot test using a small sample of faculty staff at a public university, and validation using a heterogeneous study sample. A five-point Likert-scale was used to determine the level of agreement with the questions by answering “fully agree” to “do not agree.”
Population and Procedure
In order to analyze the pattern of factors, we decided to distribute our questionnaire to a collective that was supposedly rather heterogeneous regarding the potential convenience.
Since we could not yet estimate any differences between groups or variances in the sub-items of the questionnaire, a concrete calculation for the estimation of case numbers was not possible. Therefore, we decided to restrict ourselves to a size of the collective that is in the typical range for studies that intend to implement a novel survey instrument, such as the Baecke Score (45).
The sample of participants consists of different population groups with a large number of occupations, different daily behaviors, activity patterns, educational- and socioeconomic backgrounds to provide a widespread but possibly representative sample (49, 50). The following six population groups were selected: Kindergarten teachers and primary school teachers, bus drivers, members of church choirs, and parents of school children and parents of kindergartners.
Kindergarten teachers and primary school teachers were selected because kindergarten teachers seem to have an increased prevalence of being overweight and obese than other job types in Germany (51). Due to an increased risk of childhood overweight between the ages of 5–8 years old (52), primary school teachers were included, because they are important role models for physical activity (53). The parents of school children and parents of kindergartners were recruited due to the diversified range of occupations without a preselection and the highest influence on children's health behaviors besides kindergarten teachers (54). Additionally, two extreme groups were included to extend the data collection. Bus drivers have a low physical activity level and a limited decision space during work time. A long tenure as a driver may lead to sedentary behavior, lack of exercise, and unhealthy diet which increases the risk of obesity (55). Morris and Raffle already showed in 1954 that bus drivers have a higher risk for coronary heart disease compared to conductors and discussed the role of physical activity (56). Church choir members have been described as dedicated and loyal people with a regular commitment to attend rehearsal which motivates them to avoid physical inactivity and provides a sense of balance to other pressures in life (57).
All individuals were informed in advance about the aims of the study by email and further methods of recruitment had to be used to generate a high response rate within the described population groups. Parents of school children and kindergartners as well as primary school teachers were informed during informative meetings in the respective school or kindergarten. The bus drivers were informed and questioned prior to additional staff meetings and members of church choirs were visited and informed during their weekly choir practice. After participants had completed the questionnaire, they were pleased to drop the filled-in questionnaire into a box to ensure responder anonymity. Participants were asked about age, gender, height, weight, education level, screen time activity, HPAQ, and the 24 questions to develop the CBQ.
The BMI of the participants was calculated from self-reported height and weight and classified into underweight (BMI < 18.5 kg/m2), normal weight (BMI = 18.5–24.9 kg/m2), overweight (BMI = 25.0–29.9 kg/m2), and obese (BMI ≥ 30.0 kg/m2) (58).
Education level was used as a proxy for the individual socioeconomic status and was categorized into three levels: Low educational level (no education, to have an apprenticeship or secondary modern school), middle educational level (vocational- and technical school or secondary school), high educational level (university degree or technical college degree) (59).
Screen time activity was assessed by questions about the duration of television (TV) viewing, digital versatile disc (DVD) viewing and the duration of computer use including internet use, using a five-point Likert-scale (1 = never, 2 = ~30 min per day, 3 = 1–2 h per day, 4 = 3–4 h per day, 5 = more than 4 h per day) (60). Additionally, it has differed between screen time activity on weekdays and weekends.
For a test-retest study, parents of 5.5–6 year-old (n = 139) pre-school children were pleased to give their written consent to participate in an epidemiological longitudinal study. Approximately 10 months after the first examination 23 persons of the sub-sample gave their consent to participate again.
Statistical Analysis
The results section consists of two parts. The first part describes the basic descriptive characteristics, body mass index, screen time activities and physical activity scores of the participants. The second part focuses on the development of the convenience score by identifying meaningful dimensions of convenience behaviors. A frequent approach to determine relevant variables from questionnaires is based on statistical exploratory methods.
One method which is predominantly used in the context of physical activity behavior and dietary patterns as well as in the research field of diagnostics of depression is principal component analysis (PCA) to provide evidence of a stable factor structure (45, 61, 62). PCA aims to classify variable information into a few factors by analyzing the covariance structure.
Items with factor loadings > 0.4 were considered as significantly contributing to a factor. A good correspondence between valid and sampling factor structure occurs when factor stability is ≥ 0.9 (63). Factor stability was applied also following the recommendations of Guadagnoli and Velicer (63). Analysis of eigenvalues in the screen plot and the commonly applied eigenvalue criterion (> 1.0) were used to determine the number of factors remaining for the final CBQ-scale (64).
Cronbach's α was used to evaluate internal consistency (65, 66). Cronbach's α is considered to be acceptable for values > 0.6 (67). The test-retest reliability of the factors was assessed using intra-class correlation (ICC). ICC estimates above 0.75 were considered as good reliability scores, estimates between 0.50 and 0.75 as moderate reliability scores, and estimates below 0.50 as poor reliability scores, respectively (68).
Kruskal-Wallis-ANOVA and one-way ANOVA with post hoc test (Bonferroni) were used to evaluate differences in the convenience-related items from the six population groups: A: Kindergarten teachers; B: Bus drivers; C: Members of church choirs; D: Parents of school children; D: Primary school teachers; F: Parents of kindergartners.
Initial χ2 analyses prove significant relation of the covariates and the CBQ, whereas additional forward stepwise logistic regression analysis was used to create the questionnaire (model) and prove the association between overweight and obesity and the CBQ, age, gender, education level, screen time activity and habitual physical activity. Continuous variables were transferred to categorical variables by median split. χ2 tests with contingency tables were employed to test if the items of the HPAQ and CBQ were statistically independent of one another.
The Alpha-Level was set a priori at P ≤ 0.05. Statistical analyses were calculated with SPSS PASW 22 Statistics (IBM Corp., Somers, NY) and JMP 8.0 (SAS, Cary, NC).
Results
Demographics
Table 1 summarizes the basic characteristics of the 1233 participants. Participants were from different socio-economic status (low-, middle-, and high educational level).
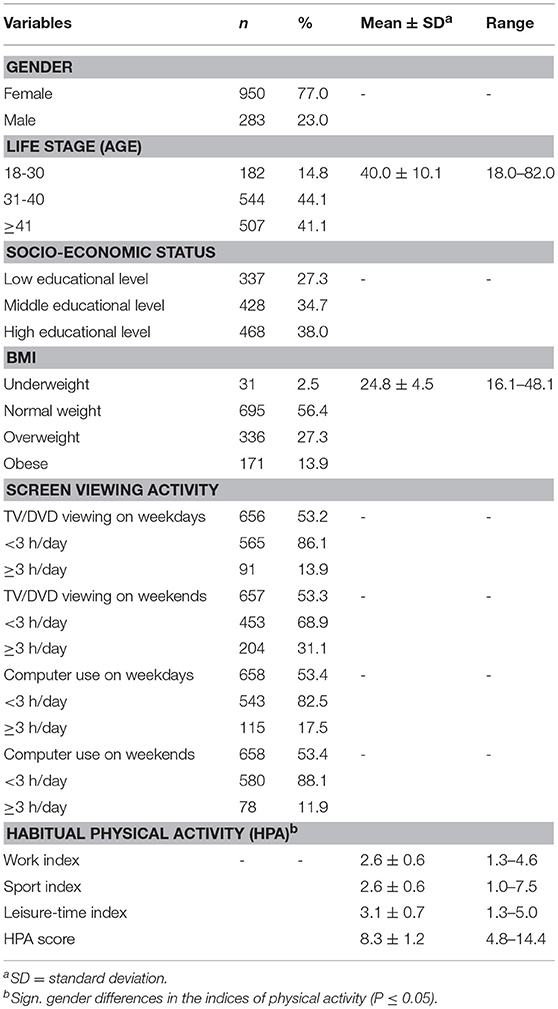
Table 1. Demographic characteristics of the 1233 participants of the Convenience Behavior Questionnaire (CBQ; n = 1233).
The majority of all participants were primarily women (77.0%). The sample age ranged from 18–82 years (Mean ± SD; 40.0 ± 10.1). BMI ranged from 16.1–48.1 (24.8 ± 4.5). A normal BMI was stated for 56.4% (695) of the study population, followed by 336 (27.3%) overweight participants. A BMI > 30.0 was classified as obese which pertains to 171 persons (13.9%). A small fraction of 31 participants (2.5%) were underweight.
The mean score of HPAQ (8.3 ± 1.2) and the three partitioned sub-index Work index (Mean 2.6 SD ± 0.6), Sport index (Mean 2.6 SD ± 0.6) and Leisure-time index (Mean 3.1 SD ± 0.7) were analogous with the values in the original publication (45).
Principal Component Analysis
Using principal component analysis and varimax-rotation as the extraction method, scree-plots revealed three factors that accounted for 43.4% of the variance. Kaiser-Meyer-Olkin criterion was acceptable (0.771) and factor stability was excellent (0.991). The varimax-rotated three-factor solution extracted items which had similar loadings on the same factor and could be combined into one factor. Answers regarding the same questions in the working context and in the leisure time context were significantly correlated with each other. Spearman rank correlation coefficients for all factors were between (r = 0.501–0.628; P < 0.01). Items that describe social interaction behavior and avoidance behavior during working time did not contribute as significantly to explain the variance of the convenience index, as the respective items during leisure time. Therefore, only the leisure time items remained in the final index, since they were more relevant for explaining the variance. Finally, nine of the original 24 items were excluded.
Table 2 shows the factor-loading matrix of the 15 remaining items from the final extraction method. Data on males and females were pooled because of similar patterns in the gender-specific analysis.
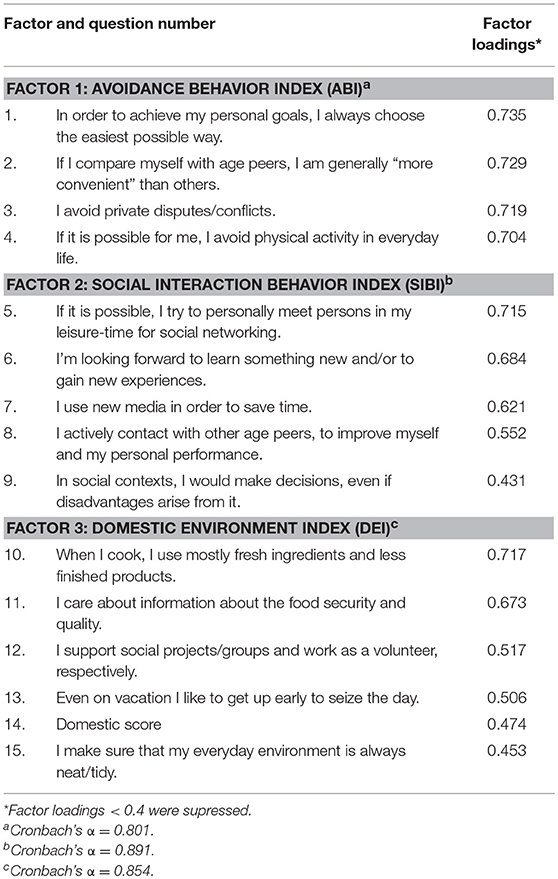
Table 2. Factor-loading matrix and Cronbach's α of the items about convenience-related behavior (n = 1233).
The first factor of the 3-factor-solution consisted of four items with high loadings and accounted for 20.0% of the variance in the explained model (eigenvalue = 3.0). Because these items were referring to avoidance behaviors, this factor was named “Avoidance Behavior Index” (ABI).
The second factor consisted of five items and accounted for 14.8% of the variance (eigenvalue = 2.2). This factor is indicative of daily behavior patterns during social interaction context which is based on individual initiative and was labeled “Social Interaction Behavior Index” (SIBI).
The third factor consisted of six items and accounted for 8.6% of the variance in the explained model (eigenvalue = 1.3). This factor is indicative of daily behavior patterns in the domestic environment and named “Domestic Environment Index” (DEI).
Assessment of Internal Consistency and Reliability
Internal consistency for the CBQ was assessed by Cronbach's α. All outcomes were acceptable (i.e., ≥ 0.7) as follows: ABI (α = 0.801), SIBI (α = 0.891), and DEI (α = 0.854) (Table 2). The participants of the test-retest study (n = 23), and the test-retest reliability for the ABI (ICC = 0.75) and the SIBI (ICC = 0.65) were good and moderate, whereas the DEI (ICC = 0.53) and the total Convenience Behavior Index (CBI, ICC = 0.62) provide moderate test-retest reliability (68), respectively. Noteworthy, all items related to a non-convenient dimension, like most questions in the dimension of the DEI and the SIBI were recoded into the opposite dimension.
Table 3 presents the mean scores of convenience-related items in males and females. Total CBI score (male mean 9.8 SD ± 1.1; female mean 10.5 SD ± 1.1) as well as the ABI, SIBI, and DEI, mean scores were significantly higher in females than in males. Each factor was computed to derive a total score between 1 and 5. The lower the score in the CBI, the more likely the participants had daily convenience-related behavior patterns.
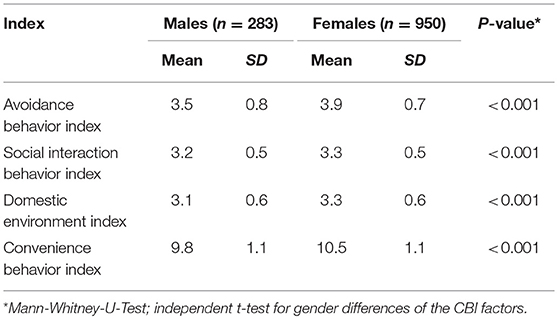
Table 3. Mean scores of convenience-related behavior indices in males and females (n = 1233).
The descriptive characteristics of convenience-related items between different clusters in males and females are described in Table 4. Highest ABI for females was found in the primary school teachers (Mean 4.1 SD ± 0.5) while the lowest score was found in church choirs (Mean 3.4 SD ± 0.8). Focusing on female SIBI the bus drivers showed the highest score (Mean 3.7 SD ± 0.6) and lowest for mothers of school children (Mean 3.2 SD ± 0.5). Female DEI related convenience was as well highest in bus drivers (Mean 3.7 SD ± 0.9) and lowest in kindergarten teachers (Mean 3.2 SD ± 0.5).
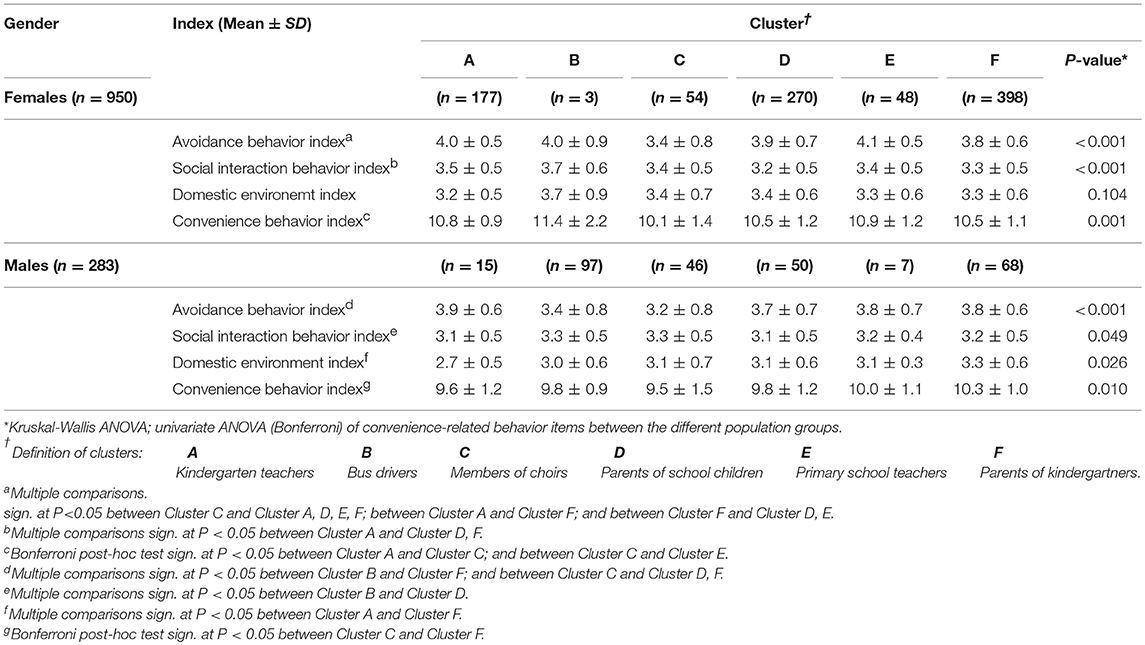
Table 4. Descriptive characteristics of convenience-related items between different clusters† in males and females (n = 1233).
Male kindergarten teachers (Mean 3.9 SD ± 0.6) had the highest ABI, whereas in consistence with the females the male church choir members had the lowest score for ABI (Mean 3.2 SD ± 0.8). Just a very low difference was found in SIBI score. The group of male kindergarten teachers (Mean 3.1 SD ± 0.5) and fathers of school children (Mean 3.1 SD ± 0.5) showed lowest SIBI scores, whereas highest scores were shown in bus drivers (Mean 3.3 SD ± 0.5) and church choir members (Mean 3.3 SD ± 0.5). Fathers of kindergarten children show the highest value (Mean 3.3 SD ± 0.6) in the DEI and accompanied with females, the lowest score was found in kindergarten teachers (Mean 2.7 SD ± 0.5). Female (Mean 10.1 SD ± 1.4) and male (Mean 9.5 SD ± 1.5) members of church choirs had the lowest mean scores on the total CBI score, whereas the highest values were found in female bus drivers (Mean 11.4 SD ± 2.2) and the multiple jobs containing a group of male parents of kindergarten children (Mean 10.3 SD ± 1.0).
Analysis of Variance (ANOVA)
The results of Kruskal-Wallis ANOVA and one-way ANOVA with post-hoc comparisons (Bonferroni) were listed in Table 4. Significant gender differences between convenience-related scores and the six different population groups were considered except for mean scores of the DEI between the different population groups in males.
Variables Associated With Overweight and Obesity
χ2 analyses indicated that gender, education level, age, population group, TV viewing on weekends, CBI score and ABI were significantly related to being overweight and obesity status (data not shown), whereas TV viewing on weekdays, SIBI (OR: 0.91; 95% CI: 0.73–1.15; P = 0.452); DEI (OR: 0.84; 95% CI: 0.67–1.06; P = 0.148) and the HPA score (OR: 1.09; 95% CI: 0.77–1.54; P = 0.629) were found to have no significant association with overweight and obesity status.
Subsequently, a forward stepwise logistic regression was performed to determine variables which are suited to predict overweight and obesity. Omnibus tests showed model significance at P < 0.001. Estimated odds ratio (OR) with the 95% confidence interval (CI) is shown in Table 5. Female individuals were less likely to be overweight or obese as compared with male participants (OR: 0.44; 95% CI: 0.27–0.71). Participants with low educational level were 3.01 times (95% CI: 1.94–4.67) more likely to be overweight or obese than participants with a high educational level. A positive prediction was found for individuals watching TV on weekends equal or more than 3 h per day as well. There is a 1.57-fold increased risk (95% CI: 1.09–1.96) to be overweight or obese compared to individuals watching TV less than 3 h per day. The total CBQ did not remain in the model when analyzed with ABI. In addition, ABI showed an association between being overweight and obesity status. Participants with a low ABI score and therefore a higher daily convenience behaviors were 1.40 (95% CI: 1.01–1.96) times more likely to be overweight or obese as compared with active participants in the high scoring group (4.00–5.00).
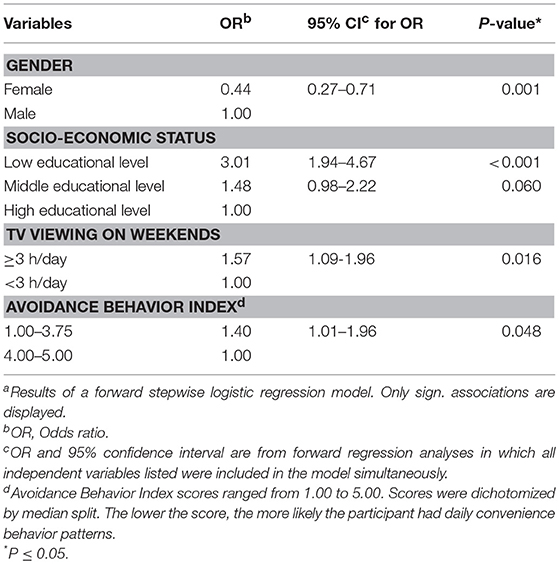
Table 5. Relations between demographic characteristicsa and the Avoidance Behavior Index (ABI) predicting overweight and obesity (n = 1233).
The final Convenience Behavior Questionnaire (CBQ) calculation guideline of the remaining 15 questions, including the three different sub-scores (Avoidance Behavior Index (ABI), Social Interaction Behavior Index (SIBI) and Domestic Index (DEI) are shown in Table 6.
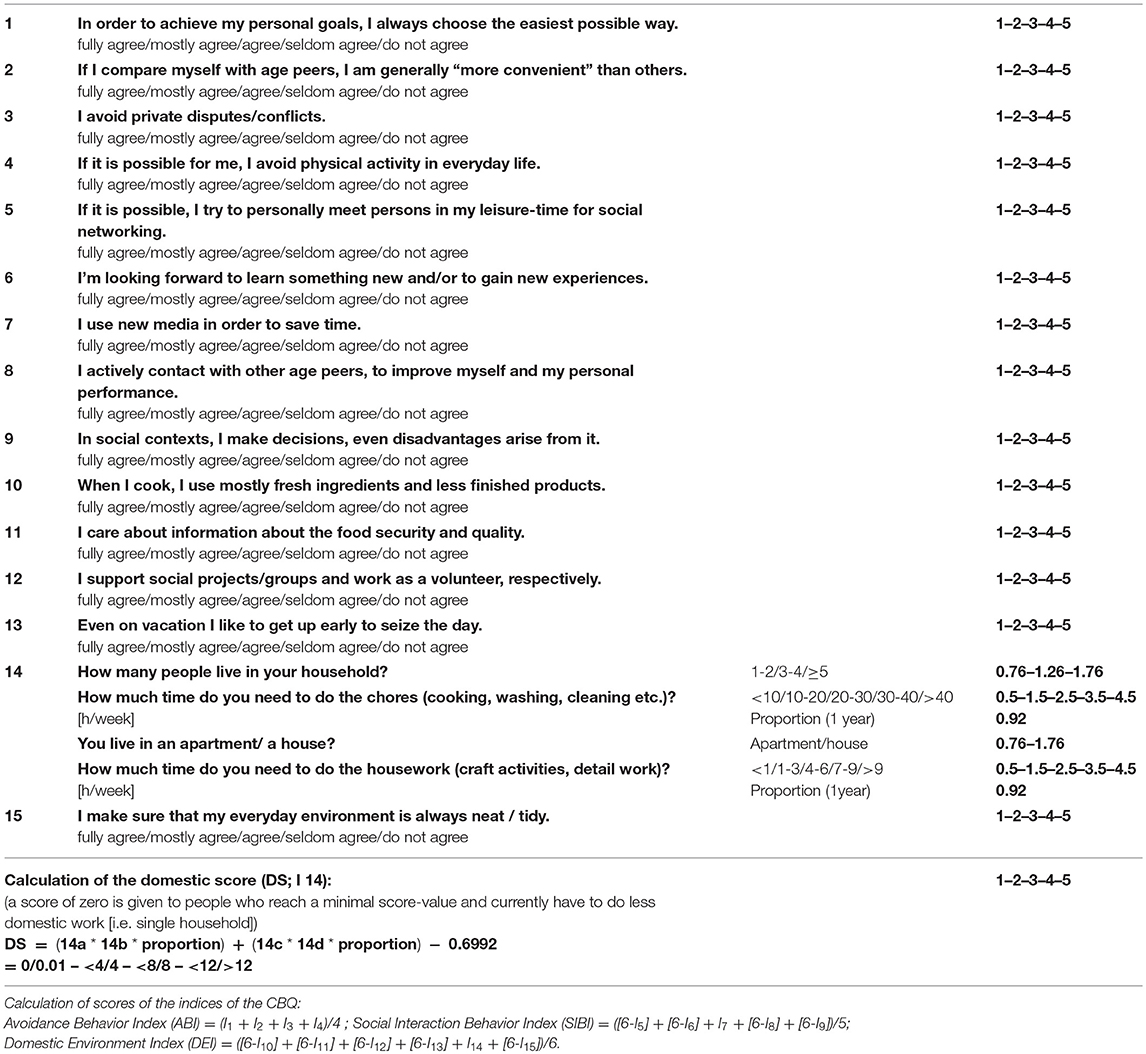
Table 6. Questions, codes, and method of calculation of indices of the Convenience Behavior Questionnaire (CBQ).
Discussion
This research was a first attempt to develop and test a brief and short questionnaire for measuring convenience behaviors and to examine its relationship with overweight and obesity in adults. The study offers a model which considers non-traditional behavioral factors which are involved in the obesity etiology. Different factors were summarized into three subcategories in the final CBQ and revealed patterns of daily convenience: Avoidance Behavior, Social Interaction Behavior, and behavior in the Domestic Environment.
Four questions (items 1–4) identified avoidance behaviors to reduce inconvenient circumstances in the personal environment, including questions about avoiding “disputes/conflicts” or “the intention to be physically active,” as well as the self-assessment about being convenient comparing to other same age peers. Additionally, items 1–4 had the highest loadings in the PCA and resulted in 20.0% of the explained variance. The results of the logistic regression analysis presume that the ABI is an independent predictor of overweight status in adults. These findings are in accordance with results from Latner who examined avoidance behaviors in obese weight-loss participants. Latner indicated in women, that greater avoidance behaviors were associated with lower success at achieving personal weight-loss goals (69). Morrison et al. reported that avoidance behaviors, as an idiom of distress, were more present in overweight and obese adolescent boys (36).
Individuals who reported that they tend to not finish tasks or give up easily may more often persist in efforts to regulating addictive eating behaviors which might lead to higher BMI values (70). Therefore, a further explanation approach is that ABI could possibly explain the recently observed indirect association between low levels of task persistence (lack of perseverance) and BMI as a function of food addiction symptoms (25, 70). In addition, BMI and waist circumference were significantly increased in individuals who were less dutiful (30).
The five questions inquiring on social interaction behaviors integrated items about the willingness for social interaction and being proactive to “personally meet persons in real life for social networking” or “the intrinsic motivation to gain new experiences” as well as the knowledge about making “decisions, even disadvantages arise from it” and the “use of new media.” Males have significantly lower score values in the SIBI compared to females. We observed no statistically significant association between social interaction behaviors and overweight and obesity.
The study participants were average in weight rather than overweight if they show convenience in maintaining their social contexts (i.e., social environment or social network). The social related behaviors which were observed in our study are consistent with research findings of Patel and Schlundt, who pointed out that eating in a social context is an independent risk factor of increased food intake (71). Results from the study of Hetherington et al. show that eating with friends and acquaintances or while TV viewing stimulated greater food intake than when eating alone or with strangers (72). Koehly et al. suggests that social relationships may contribute to the development of obesity through the interaction of behavioral and environmental factors and furthermore, a social network approach can strengthen health prevention interventions already in adolescence (38). Lindsay et al. reported, that the feelings of isolation and the lack of help from friends or family are important changes affecting their lives and limited their ability to consume healthy meals (39). Different studies provide evidence that openness to experience significantly contributes to social function throughout life (28). Time-saving opportunities of new media use were already shown in 2002 by Alreck and Settle. New media use like online shopping seems to be more time saving than traditional modes of shopping. Furthermore, a positive relation was found for hours worked outside the home, with online shopping and general new activity (i.e., online banking) (73). It can be suggested that the time saved by new media use is useful for social interaction behaviors.
In summary, social networks may play an important role in overweight and obesity development with positive or even negative effects (41). Already it younger age, individual social contexts appear to influence health and therefore may be important in treatment and prevention programs for being overweight and obese (74).
Questions 10–15 inquire about the domestic environment i.e., supporting “social projects/groups,” “behaviors on vacation,” questions about “food security and quality” and the use of “mostly fresh ingredients and less convenience.” In accordance to literature, a domestic environment score was calculated from a combination of how many people live in the household, the home environments (apartment or house) the amount of time per week doing the chores, cooking, washing, etc. and the housework (craft activities etc.) (42, 43). For the method of calculation see Table 6.
No significant association between items of the DEI and the risk of being overweight or obese was found. A reason might be that overweight individuals may self-report domestic tasks more intensely than their normal weight counterparts (44). The results of the DEI are as well in accordance with Powell et al. who showed the importance of family, friend and peer structures of weight development in the way of social contagion and the feeling of a sense of belonging and social support. This goes ahead with social engagement in groups and projects (41). Kouvonen et al. showed for older adults who participated in social activities a healthier BMI than for non-participants (75). Individuals who stated higher “food insecurity” seem to have higher overweight and obesity prevalence rates than individuals with a food security focus (76). Furthermore, it can be suggested that convenience food consumption is associated with being overweight or obesity and additionally, overweight people have less cooking skills than their normal weight counterparts, especially in men living alone (43).
Focusing on gender-specific aspects, it is shown that males tend to have more daily convenience behaviors than females and the total CBQ-Score seems to be reliable and is able to detect convenience behaviors in different population groups, independent of their physical activity level. Biswas et al. stated a prolonged sedentary time has an independent association with diseases like i.e., cardiovascular diseases, type 2 diabetes mellitus and cancer which is contributed by overweight and obesity regardless of physical activity (23). But physical inactivity itself, i.e., in term of “too much sitting” seems also linked to being overweight and obese (77, 78), even there are studies which found no relationship between sedentary time and weight outcomes (79). Interestingly, the ABI is a better independent predictor of overweight and obesity status than the well-established factor physical activity when measured with the HPAQ (45), and the HPA-Score did not remain in the final regression model. In contrast, Cheng and Furnham, found a significant and independent association between physical exercise and adult obesity (29). Therefore, it can be suggested that convenience behaviors play an important role in the development of overweight and that they have to be further pursued. In agreement with González et al. it can be concluded that being physically active is not enough and there is as well a need to avoid sedentary behavior (80).
Three component factor structures explained 43.4% of variance. This is comparable to the results of other validation studies. Both the present Cronbach's Alpha and the three-factor intern-reliability had an acceptable value (66, 81, 82).
Limitations of the study includes the use of self-reported weight and height to calculate BMI. The distribution of overweight and obese BMI groups in our sample is a little lower in comperance to the national and international data (83, 84). Participants tend to underestimate their body weight and to overestimate their body height, in particular the overweight and obese subjects (85). Thus, calculations of BMI may be biased and lead to misinterpretation of the found associations in this study between the convenience behavior and overweight and obesity status. Further studies should include direct measurements of weight and height. Additionally, other elements of the CBQ or the comparative questionnaire are subjective: i.e., screen time, physical activity. Although we observed a stable factor structure for the SIBI and the DEI, we found no significant association with overweight and obesity status. Underreporting of body weight and over-reporting of height could be one explanation. Therefore, additional or alternative questions may have to be developed for the SIBI and DEI to be appropriately used as well as a higher sample size has to be employed (especially in males) to address how socio-demographic variables affect the association between the convenience behavior and being overweight. It was attempted to include different population groups with different daily behavior patterns regarding work, leisure-time, and physical activity into the questionnaire. However, the considerations were based on a study with a suboptimal sample size and gender distribution. The majority of respondents were women with the exception of the “bus drivers.” In the group “parents from kindergartners and parents of school children,” men and women had an equal choice to answer the questionnaire, but mostly women responded to the questionnaire. Furthermore study recruitment strategies may have influenced the study outcomes because study participation was voluntary, and thus may probably lead to the fact that particular individuals with specific behavior patterns did not participate.
Conclusion
The CBQ is a viable and reliable self-administered questionnaire to identify dimensions of convenience behaviors related to overweight and obesity. The factors of the CBQ have good to moderate test-retest reliability, and acceptable internal consistency. Further evaluation and validation are needed in longitudinal studies and additional populations. Beyond the established physical (in)activity and sedentary behaviors, the CBQ is a new and independent measurement tool of overweight and obesity status in adulthood. Interestingly, avoidance behavior shows a better relationship to overweight status than the physical activity status when measured with the HPAQ. In accordance with theoretical considerations and results of other studies, this issue raises the question whether convenience behavior has an effect on overweight and obesity status or has a moderation function. We therefore suggest researchers use the CBQ as additional measures in epidemiological studies for determining factors of overweight and obesity.
Ethics Statement
The study was approved by the Institutional Review Board (IRB) of the city of Mainz which is responsible for evaluating the task of epidemiological research with personal data from participating subjects under ethical and legal aspects. Finally, the study was approved by the data protection commissioner according to the State Data Protection Act of Rhineland Palatinate which is required for study performance. The participants gave their written consent to participate in the survey. To increase the level of anonymity of the survey the collection of personal data was reduced to a minimum.
Author Contributions
MD was involved in data analysis and wrote the final manuscript. SH was involved in study design, data collection, data analysis and drafted the manuscript. CB and DH were involved in study design, data collection, and data analysis. PS is the principal investigator of this study, contributed to the study design and was also involved in statistical data analysis and writing the manuscript.
Conflict of Interest Statement
The authors declare that the research was conducted in the absence of any commercial or financial relationships that could be construed as a potential conflict of interest.
References
1. Walley AJ, Asher JE, Froguel P. The genetic contribution to non-syndromic human obesity. Nat Rev Genet. (2009) 10:431–42. doi: 10.1038/nrg2594
2. Wells JC. An evolutionary perspective on the trans-generational basis of obesity. Ann Hum Biol. (2011) 38:400–9. doi: 10.3109/03014460.2011.580781
3. Llewellyn CH, Trzaskowski M, van Jaarsveld CH, Plomin R, Wardle J. Satiety mechanisms in genetic risk of obesity. JAMA Pediatr. (2014) 168:338–44. doi: 10.1001/jamapediatrics.2013.4944
4. Pratt CA, Lemon SC, Fernandez ID, Goetzel R, Beresford SA, French SA, et al. Design characteristics of worksite environmental interventions for obesity prevention. Obesity. (2007) 15:2171–80. doi: 10.1038/oby.2007.258
5. Swinburn BA, Sacks G, Hall KD, McPherson K, Finegood DT, Moodie ML, et al. The global obesity pandemic: shaped by global drivers and local environments. Lancet. (2011) 378:804–14. doi: 10.1016/S0140-6736(11)60813-1
6. Keegan TH, Hurley S, Goldberg D, Nelson DO, Reynolds P, Bernstein L, et al. The association between neighborhood characteristics and body size and physical activity in the California teachers study cohort. Am J Public Health. (2012) 102:689–97. doi: 10.2105/AJPH.2011.300150
7. Lustig RH. Childhood obesity: behavioral aberration or biochemical drive? reinterpreting the first law of thermodynamics. Nat Clin Pract Endocrinol Metab. (2006) 2:447–58. doi: 10.1038/ncpendmet0220
8. Yun S, Zhu BP, Black W, Brownson RC. A comparison of national estimates of obesity prevalence from the behavioral risk factor surveillance system and the national health and nutrition examination survey. Int J Obes. (2006) 30:164–70. doi: 10.1038/sj.ijo.0803125
9. Chau JY, Merom D, Grunseit A, Rissel C, Bauman AE, van der Ploeg HP. Temporal trends in non-occupational sedentary behaviours from Australian Time Use Surveys 1992:1997 and 2006. Int J Behav Nutr Phys Act. (2012) 9:76. doi: 10.1186/1479-5868-9-76
10. Dobson M, Choi B, Schnall PL, Wigger E, Garcia-Rivas J, Israel L, et al. Exploring occupational and health behavioral causes of firefighter obesity: a qualitative study. Am J Industr Med. (2013) 56:776–90. doi: 10.1002/ajim.22151
11. Hu FB, Li TY, Colditz GA, Willett WC, Manson JE. Television watching and other sedentary behaviors in relation to risk of obesity and type 2 diabetes mellitus in women. JAMA. (2003) 289:1785–91. doi: 10.1001/jama.289.14.1785
12. Eisenmann JC, Bartee RT, Smith DT, Welk GJ, Fu Q. Combined influence of physical activity and television viewing on the risk of overweight in US youth. Int J Obes. (2008) 32:613–8. doi: 10.1038/sj.ijo.0803800
13. Cena H, Fonte ML, Turconi G. Relationship between smoking and metabolic syndrome. Nutr Rev. (2011) 69:745–53. doi: 10.1111/j.1753-4887.2011.00446.x
14. Ford ES, Li C, Wheaton AG, Chapman DP, Perry GS, Croft JB. Sleep duration and body mass index and waist circumference among U.S. adults. Obesity. (2014) 22:598–607. doi: 10.1002/oby.20558
15. Elder BL, Ammar EM, Pile D. Sleep duration, activity levels, and measures of obesity in adults. Public Health Nurs. (2016) 33:200–5. doi: 10.1111/phn.12230
16. European Commission. Sport and physical activity. Special Eurobarometer. (2014) 412:135. doi: 10.2766/73002
17. Tremblay MS, Colley RC, Saunders TJ, Healy GN, Owen N. Physiological and health implications of a sedentary lifestyle. Appl Physiol Nutr Metab. (2010) 35:725–40. doi: 10.1139/H10-079
18. Ravussin E, Danforth EJ. Beyond sloth-physical activity and weight gain. Science. (1999) 283:184–5. doi: 10.1126/science.283.5399.184
19. Goris AH, Westerterp KR. Physical activity, fat intake and body fat. Physiol Behav. (2008) 94:164–8. doi: 10.1016/j.physbeh.2007.11.009
20. Thorp AA, Owen N, Neuhaus M, Dunstan DW. Sedentary behaviors and subsequent health outcomes in adults a systematic review of longitudinal studies, 1996-2011. Am J Prev Med. (2011) 41:207–15. doi: 10.1016/j.amepre.2011.05.004
21. Wells JC, Siervo M. Obesity and energy balance: is the tail wagging the dog? Eur J Clin Nutr. (2011) 65:1173–89. doi: 10.1038/ejcn.2011.132
22. Knight JA. Physical inactivity: associated diseases and disorders. Ann Clin Lab Sci. (2012) 42:320–37.
23. Biswas A, Oh PI, Faulkner GE, Bajaj RR, Silver MA, Mitchell MS, et al. Sedentary time and its association with risk for disease incidence, mortality, and hospitalization in adults: a systematic review and meta-analysis. Ann Intern Med. (2015) 162:123–32. doi: 10.7326/M14-1651
24. Ozer DJ, Benet-Martinez V. Personality and the prediction of consequential outcomes. Ann Rev Psychol. (2006) 57:401–21. doi: 10.1146/annurev.psych.57.102904.190127
25. Kern ML, Friedman HS. Do conscientious individuals live longer? A quantitative review. Health Psychol. (2008) 27:505–12. doi: 10.1037/0278-6133.27.5.505
26. Terracciano A, Schrack JA, Sutin AR, Chan W, Simonsick EM, Ferrucci L. Personality, metabolic rate and aerobic capacity. PLoS ONE. (2013) 8:e54746. doi: 10.1371/journal.pone.0054746
27. Rhodes RE, Smith NE. Personality correlates of physical activity: a review and meta-analysis. Br J Sports Med. (2006) 40:958–65. doi: 10.1136/bjsm.2006.028860
28. Stephan Y, Boiche J, Canada B, Terracciano A. Association of personality with physical, social, and mental activities across the lifespan: findings from US and French samples. Br J Psychol. (2014) 105:564–80. doi: 10.1111/bjop.12056
29. Cheng H, Furnham A. Personality traits, education, physical exercise, and childhood neurological function as independent predictors of adult obesity. PLoS ONE. (2013) 8:e79586. doi: 10.1371/journal.pone.0079586
30. Shim U, Kim HN, Roh SJ, Cho NH, Shin C, Ryu S, et al. Personality traits and body mass index in a Korean population. PLoS ONE. (2014) 9:e90516. doi: 10.1371/journal.pone.0090516
31. Jokela M, Hintsanen M, Hakulinen C, Batty GD, Nabi H, Singh-Manoux A, et al. Association of personality with the development and persistence of obesity: a meta-analysis based on individual-participant data. Obesity Rev. (2013) 14:315–23. doi: 10.1111/obr.12007
32. King NA, Caudwell P, Hopkins M, Byrne NM, Colley R, Hills AP, et al. Metabolic and behavioral compensatory responses to exercise interventions: barriers to weight loss. Obesity. (2007) 15:1373–83. doi: 10.1038/oby.2007.164
33. Murtagh J, Dixey R, Rudolf M. A qualitative investigation into the levers and barriers to weight loss in children: opinions of obese children. Arch Dis Childh. (2006) 91:920–3. doi: 10.1136/adc.2005.085712
34. Thomas HM, Irwin JD. What is a healthy body weight? Perspectives of overweight youth. Can J Diet Pract Res. (2009) 70:110–6. doi: 10.1111/j.1365-277X.2004.00562.x
35. Amiri P, Ghofranipour F, Ahmadi F, Hosseinpanah F, Montazeri A, Jalali-Farahani S, et al. Barriers to a healthy lifestyle among obese adolescents: a qualitative study from Iran. Int J Public Health. (2011) 56:181–9. doi: 10.1007/s00038-010-0119-6
36. Morrison ZJ, Gregory DM, Thibodeau S. It's not just about the french fry: avoidance as an idiom of distress among overweight and obese adolescent boys. Am J Men Health. (2011) 5:517–23. doi: 10.1177/1557988311415092
37. Sallis JF, Owen N. Ecological models of health behavior. In: Glanz K, Rimer, BK, Lewis, FM, editors. Health Behavior and Health Education: Theory, Research, and Practice. San Francisco, CA: Jossey-Bass (2002). p. 462–84.
38. Koehly LM, Loscalzo A. Adolescent obesity and social networks. Prevent Chron Dis. (2009) 6:A99. Available online at: http://www.cdc.gov/pcd/issues/2009/jul/08_0265.htm
39. Lindsay AC, Sussner KM, Greaney ML, Peterson KE. Influence of social context on eating, physical activity, and sedentary behaviors of Latina mothers and their preschool-age children. Health Educ Behav. (2009) 36:81–96. doi: 10.1177/1090198107308375
40. Vandewater EA, Denis LM. Media, social networking, and pediatric obesity. Pediatr Clin North Am. (2011) 58:1509–19. doi: 10.1016/j.pcl.2011.09.012
41. Powell K, Wilcox J, Clonan A, Bissell P, Preston L, Peacock M, et al. The role of social networks in the development of overweight and obesity among adults: a scoping review. BMC Public Health. (2015) 15:996. doi: 10.1186/s12889-015-2314-0
42. Candel M. Consumers' convenience orientation towards meal preparation: conceptualization and measurement. Appetite. (2001) 36:15–28. doi: 10.1006/appe.2000.0364
43. Van der Horst K, Brunner TA, Siegrist M. Ready-meal consumption: associations with weight status and cooking skills. Public Health Nutr. (2011) 14:239–45. doi: 10.1017/S1368980010002624
44. Murphy MH, Donnelly P, Breslin G, Shibli S, Nevill AM. Does doing housework keep you healthy? The contribution of domestic physical activity to meeting current recommendations for health. BMC Public Health. (2013) 13:966. doi: 10.1186/1471-2458-13-966
45. Baecke JA, Burema J, Frijters JER. A short questionnaire for the measurement of habitual physical activity in epidemiological studies. Am J Clin Nutr. (1982) 36:936–42. doi: 10.1093/ajcn/36.5.936
46. Philippaerts RM, Westerterp KR, Lefevre J. Doubly labelled water validation of three physical activity questionnaires. Int J Sports Med. (1999) 20:284–9. doi: 10.1055/s-2007-971132
47. Westerterp KR. Assessment of physical activity level in relation to obesity: current evidence and research issues. Med Sci Sports Exerc. (1999) 31:S522–5.
48. Tehard B, Saris WH, Astrup A, Martinez JA, Taylor MA, Barbe P, et al. Comparison of two physical activity questionnaires in obese subjects: the NUGENOB study. Med Sci Sports Exerc. (2005) 37:1535–41. doi: 10.1249/01.mss.0000177464.68521.3b
49. Holtermann A, Jorgensen MB, Gram B, Christensen JR, Faber A, Overgaard K, et al. Worksite interventions for preventing physical deterioration among employees in job-groups with high physical work demands: background, design and conceptual model of FINALE. BMC Public Health. (2010) 10:120. doi: 10.1186/1471-2458-10-120
50. Lemon SC, Pratt CA. Worksite environmental interventions for obesity control: an overview. J Occup Environ Med. (2010) 52 Suppl 1:S1–3. doi: 10.1097/JOM.0b013e3181c8527e
51. Hoffmann SW, Tug S, Simon P. Obesity prevalence and unfavorable health risk behaviors among German kindergarten teachers: Cross-sectional results of the Kindergarten Teacher Health Study (KTHS). BMC Public Health. (2013) 13:927. doi: 10.1186/1471-2458-13-927
52. Hoffmann SW, Ulrich R, Simon P. Refined analysis of the critical age ranges of childhood overweight: implications for primary prevention. Obesity. (2012) 20:2151–4. doi: 10.1038/oby.2012.172
53. Donnelly JE, Greene JL, Gibson CA, Smith BK, Washburn RA, Sullivan DK, et al. Physical Activity Across the Curriculum (PAAC): a randomized controlled trial to promote physical activity and diminish overweight and obesity in elementary school children. Prev Med. (2009) 49:336–41. doi: 10.1016/j.ypmed.2009.07.022
54. Hoffmann SW, Tug S, Simon P. Child-caregivers' body weight and habitual physical activity status is associated with overweight in kindergartners. BMC Public Health. (2014) 14:822. doi: 10.1186/1471-2458-14-822
55. Rosso GL, Perotto M, Feola M, Bruno G, Caramella M. Investigating obesity among professional drivers: the high risk professional driver study. Am J Ind Med. (2015) 58:212–9. doi: 10.1002/ajim.22400
56. Morris JN, Raffle PA. Coronary heart disease in transport workers; a progress report. Br J Ind Med. (1954) 11:260–4. doi: 10.1136/oem.11.4.260
57. Clift S, Hancox G, Morrision I, Hess B, Kreutz G, Stewart D. Choral singing and psychological wellbeing. J Appl Arts Health. (2010) 1:19–34. doi: 10.1386/jaah.1.1.19/1
58. WHO. Obesity: preventing and managing the global epidemic. World Health Organ Tech Rep Ser. (2000) 894:1–253.
59. Sacerdote C, Ricceri F, Rolandsson O, Baldi I, Chirlaque MD, Feskens E, et al. Lower educational level is a predictor of incident type 2 diabetes in European countries: the EPIC-InterAct study. Int J Epidemiol. (2012) 41:1162–73. doi: 10.1093/ije/dys091
60. Lampert T, Sygusch R, Schlack R. Use of electronic media in adolescence. Results of the German Health Interview and Examination Survey for Children and Adolescents (KiGGS). Bundesgesundheitsblatt Gesundheitsforschung, Gesundheitsschutz. (2007) 50:643–52. doi: 10.1007/s00103-007-0225-7
61. Carpenter JS, Andrykowski MA, Wilson J, Hall LA, Rayens MK, Sachs B, et al. Psychometrics for two short forms of the center for epidemiologic studies-depression scale. Issues Ment Health Nurs. (1998) 19:481–94. doi: 10.1080/016128498248917
62. Schulze MB, Hoffmann K, Kroke A, Boeing H. An approach to construct simplified measures of dietary patterns from exploratory factor analysis. Br J Nutr. (2003) 89:409–19. doi: 10.1079/BJN2002778
63. Guadagnoli E, Velicer WF. Relation of sample size to the stability of component patterns. Psychol Bull. (1988) 103:265–75. doi: 10.1037/0033-2909.103.2.265
64. Kaiser HF. The application of electronic-computers to factor-analysis. Educ Psychol Meas. (1960) 20:141–51.
65. Cronbach LJ. Coefficient alpha and the internal structure of tests. Psychometrika. (1951) 16:619–28. doi: 10.1007/BF02310555
66. Bland JM, Altman DG. Statistics notes: Cronbach's alpha. BMJ. (1997) 314:572. doi: 10.1136/bmj.314.7080.572
67. DeVellis RF. Scale Development: Theory and Applications. Thousand Oaks, CA; London: Sage (2003).
68. Portney LG, Watkins MP. (eds.). Foundations of Clinical Research: Applications to Practice. Upper Scale River, NJ: Pearson/Prentice Hall (2009).
69. Latner JD. Body checking and avoidance among behavioral weight-loss participants. Body Image. (2008) 5:91–8. doi: 10.1016/j.bodyim.2007.08.001
70. Murphy CM, Stojek MK, Mackillop J. Interrelationships among impulsive personality traits, food addiction, and Body Mass Index. Appetite. (2014) 73:45–50. doi: 10.1016/j.appet.2013.10.008
71. Patel KA, Schlundt DG. Impact of moods and social context on eating behavior. Appetite. (2001) 36:111–8. doi: 10.1006/appe.2000.0385
72. Hetherington MM, Anderson AS, Norton GN, Newson L. Situational effects on meal intake: a comparison of eating alone and eating with others. Physiol Behav. (2006) 88:498–505. doi: 10.1016/j.physbeh.2006.04.025
73. Alreck PL, Settle RB. The hurried consumer: Time-saving perceptions of Internet and catalogue shopping. J Database Market Custom Strat Manage. (2002) 10:25–35. doi: 10.1057/palgrave.jdm.3240091
74. Salvy SJ, Coelho JS, Kieffer E, Epstein LH. Effects of social contexts on overweight and normal-weight children's food intake. Physiol Behav. (2007) 92:840–6. doi: 10.1016/j.physbeh.2007.06.014
75. Kouvonen A, Swift JA, Stafford M, Cox T, Vahtera J, Vaananen A, et al. Social participation and maintaining recommended waist circumference: prospective evidence from the English Longitudinal Study of Aging. J Aging Health. (2012) 24:250–68. doi: 10.1177/0898264311421960
76. Walker RE, Kawachi I. Use of concept mapping to explore the influence of food security on food buying practices. J Acad Nutr Diet. (2012) 112:711–7. doi: 10.1016/j.jand.2011.12.020
77. Church TS, Thomas DM, Tudor-Locke C, Katzmarzyk PT, Earnest CP, Rodarte RQ, et al. Trends over 5 decades in U.S. occupation-related physical activity and their associations with obesity. PLoS ONE. (2011) 6:e19657. doi: 10.1371/journal.pone.0019657
78. Dunstan DW, Howard B, Healy GN, Owen N. Too much sitting–a health hazard. Diabetes Res Clin Pract. (2012) 97:368–76. doi: 10.1016/j.diabres.2012.05.020
79. Van Dyck D, Cerin E, De Bourdeaudhuij I, Hinckson E, Reis RS, Davey R, et al. International study of objectively measured physical activity and sedentary time with body mass index and obesity: IPEN adult study. Int J Obes. (2015) 39:199–207. doi: 10.1038/ijo.2014.115
80. Gonzalez K, Fuentes J, Marquez JL. Physical inactivity, sedentary behavior and chronic diseases. Korean J Fam Med. (2017) 38:111–5. doi: 10.4082/kjfm.2017.38.3.111
83. Mensink GB, Schienkiewitz A, Haftenberger M, Lampert T, Ziese T, Scheidt-Nave C. Overweight and obesity in Germany: results of the German Health Interview and Examination Survey for Adults (DEGS1). Bundesgesundheitsblatt Gesundheitsforschung Gesundheitsschutz. (2013) 56:786–94. doi: 10.1007/s00103-012-1656-3
84. Ogden CL, Carroll MD, Kit BK, Flegal KM. Prevalence of childhood and adult obesity in the United States, 2011-2012. JAMA. (2014) 311:806–14. doi: 10.1001/jama.2014.732
Keywords: convenience behaviors, sedentary behaviors, inactivity, physical activity, overweight, obesity, questionnaire
Citation: Dreher M, Hoffmann SW, Brendel C, Heser D and Simon P (2019) Convenience Behavior and Being Overweight in Adults: Development and Validation of the Convenience Behavior Questionnaire. Front. Public Health 7:20. doi: 10.3389/fpubh.2019.00020
Received: 29 June 2018; Accepted: 24 January 2019;
Published: 13 March 2019.
Edited by:
Reina Villareal, Baylor College of Medicine, United StatesReviewed by:
José Luis Márquez, Universidad de Santiago de Chile, ChileLina E. Aguirre, New Mexico VA Health Care System, United States
Copyright © 2019 Dreher, Hoffmann, Brendel, Heser and Simon. This is an open-access article distributed under the terms of the Creative Commons Attribution License (CC BY). The use, distribution or reproduction in other forums is permitted, provided the original author(s) and the copyright owner(s) are credited and that the original publication in this journal is cited, in accordance with accepted academic practice. No use, distribution or reproduction is permitted which does not comply with these terms.
*Correspondence: Perikles Simon, c2ltb25wZUB1bmktbWFpbnouZGU=
†These authors shared first authorship