 Triwibowo Ambar Garjito1,2,3*
 Muhammad Choirul Hidajat1
 Revi Rosavika Kinansi1
 Riyani Setyaningsih1
 Yusnita Mirna Anggraeni1
 Mujiyanto1
 Wiwik Trapsilowati1
 Jastal4
 Ristiyanto1Tri Baskoro Tunggul Satoto5
 Laurent Gavotte6
 Sylvie Manguin2,3
 Roger Frutos2,7,8
- 1Institute for Vector and Reservoir Control Research and Development, National Institute of Health Research Development (NIHRD), MoH, Salatiga, Indonesia
- 2Université de Montpellier, Montpellier, France
- 3HydroSciences Montpellier (HSM), Institut de Recherche pour le Développement (IRD), CNRS, Université de Montpellier, Montpellier, France
- 4Health Research and Development Unit Banjarnegara, National Institute of Health Research Development (NIHRD), MoH, Banjarnegara, Indonesia
- 5Department of Parasitology, Faculty of Medicine, Public Health and Nursing, Gadjah Mada University, Yogyakarta, Indonesia
- 6ISEM, Université de Montpellier, Montpellier, France
- 7CIRAD, Intertryp, Montpellier, France
- 8IES, Université de Montpellier-CNRS, Montpellier, France
Dengue is present in 128 countries worldwide and is still expanding. There is currently no treatment or universally approved vaccine available. Therefore, prevention and control of mosquito vectors remain the most efficient ways of managing the risk of dengue outbreaks. The Stegomyia indices have been developed as quantitative indicators of the risk of dengue outbreaks. However, conflictual data are circulating about their reliability. We report in this article the first extensive study on Stegomyia indices, covering 78 locations of differing environmental and socio-economic conditions, climate, and population density across Indonesia, from West Sumatra to Papua. A total of 65,876 mosquito larvae and pupae were collected for the study. A correlation was found between incidence and human population density. No correlation was found between the incidence of dengue and the Stegomyia indices.
Introduction
Dengue is one of the most widespread mosquito-borne arbovirus disease worldwide. Dengue viruses are present in 128 countries worldwide with major public health, social and economic consequences (1–7). Dengue is a complex disease with a wide spectrum of clinical symptoms, ranging from asymptomatic to fatal, which is often unrecognized or misdiagnosed and confused with other fever-causing tropical diseases (8). The World Health Organization (WHO) estimates that about 390 million dengue infections occur annually, with 96 million clinical manifestation and 500,000 hospitalization (9). At least 2.5% of these hospitalizations result in death and almost half of the global world population is at risk of dengue infection (9). Southeast Asia is the most impacted region and displays the highest incidence of dengue worldwide with all four dengue serotypes circulating in most countries (1, 10).
Indonesia displays the highest dengue burden in Southeast Asia (11). First described in Jakarta and Surabaya in 1968, dengue expanded in all provinces and has become a major national health priority. The incidence of dengue has increased significantly over the past 47 years from 0.05/100,000 in 1968 to 50.75/100,000 in 2015 (12, 13). Indonesia is a hyperendemic country with all four dengue virus serotypes (DENV1 to DENV4) circulating. In 2015, the dengue endemic areas included 412 districts/municipalities out of a total of 497 (82.9%). Dengue is spreading in all human dwellings from large urban areas to small rural villages (11–15).
Dengue viruses (DENV) are mainly transmitted to humans by two species of Aedes mosquitoes, i.e., Aedes aegypti and Aedes albopictus. Ae. aegypti is the main dengue vector, highly anthropophilic, and well-adapted to urban life. It feeds mostly at daytime with a multiple host blood meal-seeking behavior, but can also bite at night depending on light conditions. Ae. aegypti breeds in a variety of artificial habitats with clear stagnant water (16). The secondary vector, Ae. albopictus, also known as Tiger mosquito, bites at daytime too but hosts also include animals such as amphibians, reptiles, birds and mammals. Ae. albopictus breeds in a wide variety of artificial and natural habitats such as tires, bamboo stumps, tree holes, etc. (17). In Indonesia, large-scale migrations from rural to urban areas over the past three decades have created slum settlements with inadequate water and sanitation facilities and poor waste management, leading to the emergence of many new breeding sites for both Ae. aegypti and Ae. albopictus (13, 14). The Indonesian climate with favorable tropical rainfall, temperature and humidity also facilitates the development of additional Aedes breeding sites (16). This situation has strongly increased the risk of dengue transmission in suburban areas.
The risk of dengue transmission is influenced by various factors, including trade of goods and human mobility, population density, urbanization, climate, presence of invasive populations of Aedes vectors and pathogens, virus evolution, density of competent vectors, and ineffective vector control strategies (18, 19). While an efficient vaccine is still under research, entomological surveillance and vector control remain the only ways to prevent and control dengue transmission (19–21). Therefore, WHO recommends a routine vector surveillance to provide a quantifiable measurement of dengue vector fluctuations and their geographical distribution for assessing the risk of outbreaks and to determine vector control interventions (2, 22). These indicators have been based on the traditional Stegomyia indices (HI, House Index; CI, Container Index; BI, Breteau Index) (23) to which a national Free Larva Index (FLI) was added in Indonesia. These larval and pupal indices remain the most used parameters to measure vector infestation since the capture of adult mosquitoes is labor-intensive and requires access to private premises (19, 24).
Initially, the Stegomyia indices were proposed to prevent and predict the risk of yellow fever transmission and critical thresholds have never been determined for dengue transmission (22, 25). A House Index (HI) threshold of 1% or less, or a Breteau Index (BI) threshold of five or less have been considered to prevent dengue transmission because of similarities in the epidemiology of dengue and yellow fever viruses (18, 26, 27). Furthermore, the Pan American Health Organization (PAHO) has divided the risk factors for dengue transmission into three levels: low (HI<0.1%), medium (0.1%<HI<5%), and high (HI>5%) (28). However, the reliability and sensitivity of the Stegomyia indices have been questioned (2, 19, 25, 29–31).
Until now, although several studies have been published on the reliability of the Stegomyia indices, no comprehensive analyses have yet been conducted. Articles were either reviews covering a broad range of regions and cases or technical articles providing quantitative data but limited to specific areas (2, 19, 25, 27, 28, 32–46). We therefore developed this study to analyze the relationship between Stegomyia indices and actual dengue situations over a very large zone covering 78 sampling sites throughout Indonesia from Sumatra to Papua corresponding to different locations (urban/rural) and ecosystems (coastal/non-coastal). We report here a complete analysis on the two main vectors, Ae. aegypti and Ae. albopictus.
Materials and Methods
Study Area
The study was conducted in 78 locations corresponding to 78 districts/municipalities in 26 dengue-endemic provinces in Indonesia (Figure 1, Table 2). These provinces were: Aceh, Riau, Riau Islands, West Sumatra, Jambi, Bangka Belitung, Lampung, Banten, West Java, Yogyakarta, Central Java, East Java, West Kalimantan, South Kalimantan, Central Kalimantan, East Kalimantan, Southeast Sulawesi, South Sulawesi, North Sulawesi, Central Sulawesi, Bali, West Nusa Tenggara, East Nusa Tenggara, Maluku, North Maluku, and West Papua. The mosquito collection was implemented as part of the “Rikhus Vektora” project in July–August 2016 in 48 districts/cities, the WHO project SEINO 1611945 in September–October 2016 in 12 additional city locations, and finally in 18 locations in May–July 2017 as part of the Rikhus Vektora project (Figure 1).
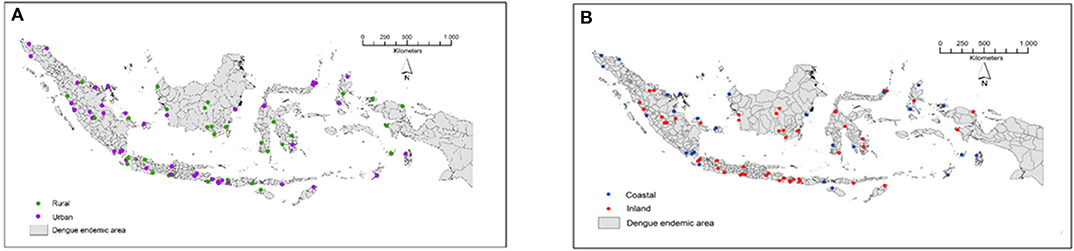
Figure 1. Map of the sampling sites in Indonesia. (A) Locations of urban and rural sampling sites. (B) Locations of coastal and inland sampling sites. These maps are original artworks created by the authors from a blank map background of the Republic of Indonesia displaying the district limits. This map background was provided by the Indonesian Geospatial Information Agency under agreement to use it in publication signed with IVRCRD-NIHRD.
Study Design
The sampling plan was built using entomological data, dengue cases, socio-demographic and spatial data. Collections were undertaken at three time periods, July-August 2016 in 48 locations, September-October 2016 in 12 additional locations, and in May-July 2017 in 18 locations. These sampling periods correspond to rainy seasons in the respective locations. Each sampling periods was determined after the actual start of the rainy season and was initiated at least 1 month after the beginning of the rainy season. At least 100 households were taken at random in each sampling location to assess the presence of Aedes breeding sites. Three separate assessments were conducted at the same time. Ae. aegypti larvae and pupae, Ae. albopictus larvae and pupae, and Ae. aegypti + Ae. albopictus larvae and pupae were separately recorded in each sampling location. The Stegomyia indices were calculated for each sampling location for the three categories using the following formulas (23, 47, 48):
Container Index (CI): number of infected containers × 100/total number of containers
House Index (HI): number of infected houses × 100/total number of houses
Breteau Index (BI): number of positive containers/number of houses explored × 100
These indices were completed by a legal Indonesian index, the Free Larva Index (FLI) calculated according to the following formula:
FLI: number of houses without larva × 100/total number houses
The Free Larva Index (FLI) is the reverse of the House Index (HI) making these two indices strongly negatively correlated.
Entomological Data Collection
Artificial and natural water-holding containers, which were potential Aedes breeding sites, were sampled using standardized sampling methods (23, 47–49). All pupae and larvae from positive containers were collected in separate small ziplock plastic bags. Afterwards, all samples were transported to field laboratories and counted. Due to difficulties to identify species at the larval and pupal stages, all larvae and pupae from each container were transferred to separate individual adult cages. Collected Aedes larvae and pupae were placed in rearing jars filled with 150 mL of freshwater and were covered with fine gauze. All larvae were fed with fish food (TetraBits, Germany). Larvae and pupae were reared until the emergence of adults for species identification.
Sociodemographic Data Collection
The incidence, number of new dengue cases per total population for the time of the study, was considered for each community health center. Sampling locations were discriminated according to their status; i.e., urban or rural, as defined by the Ministry of Health, Republic of Indonesia, and according to the ecosystem, i.e., coastal or inland. Urban areas were defined as areas without major agricultural activity and displaying concentrations of centralized government services, social services, and economic activities. Rural areas were defined as areas having major agricultural activity, including the management of natural resources and displaying local government services, social services, and economic activities. The official discrimination between urban and rural areas is based on facilities, services, and equipment offered and not on a population density threshold. Coastal areas were terrestrial environments under marine influence whereas inland areas were far enough from the seashore to no longer be under marine influence. The number of dengue cases was taken from the national health data profile for district/city level in the time of study. The density of population (Table 1) in the zone of action of the health centers at the time of study were taken from the centralized database of health centers from the Ministry of Health, Republic of Indonesia.
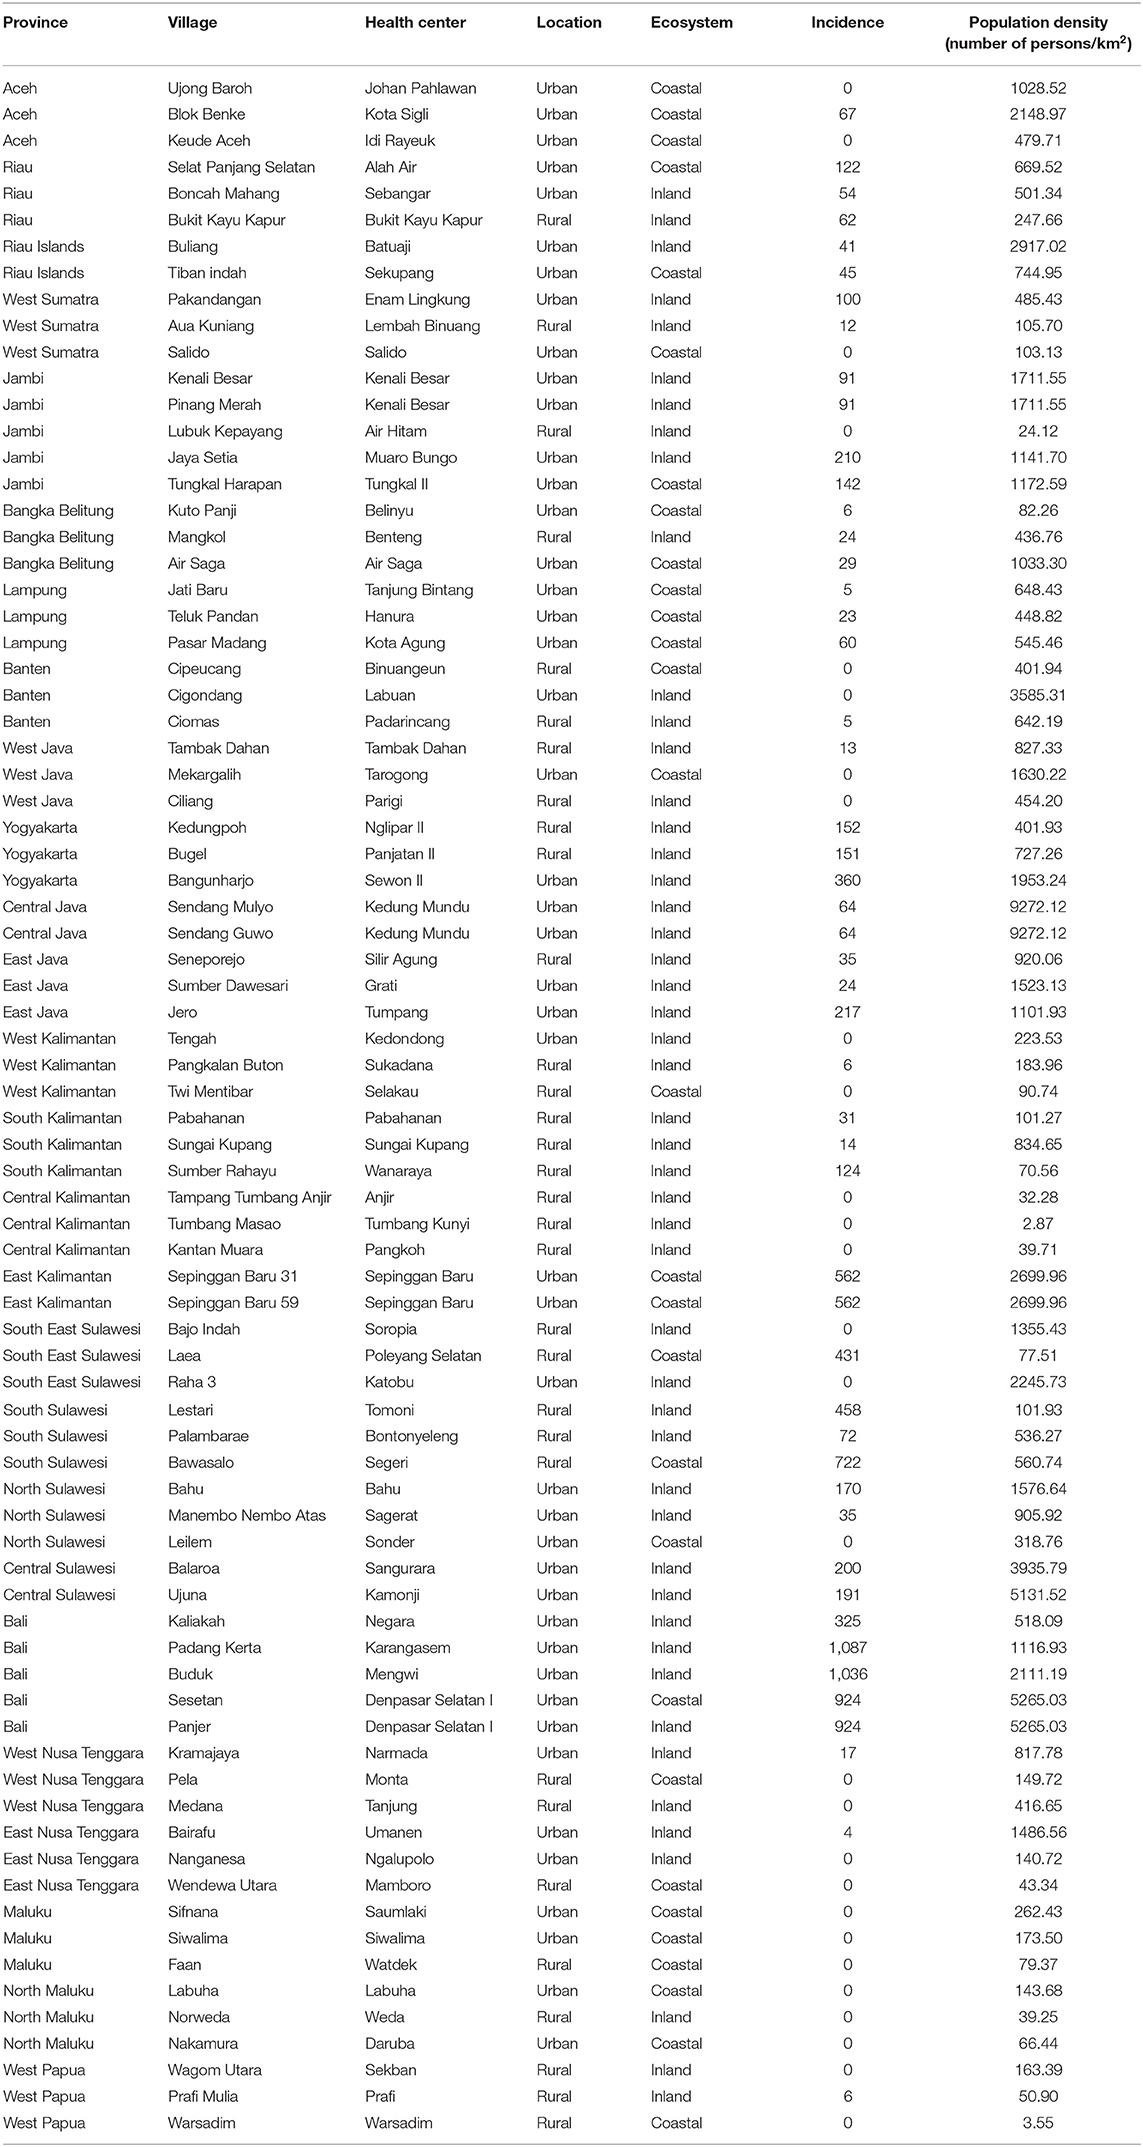
Table 1. Population density in the sampling sites.
Data Analysis
A principal component analysis (PCA) was conducted using the incidence, the human population density and the four Stegomyia indices (HI, BI, CI, and FLI). The PCA analysis was performed on the totality of the 50 sampling locations where dengue cases have been reported by health centers. Three sets of analyses were performed separately for Ae. aegypti, Ae. albopictus and for the sum of Ae. aegypti and Ae. albopictus mosquitoes. The normality of the data distribution was assessed using the Kolmogorov-Smirnov normality test (50). Potential correlations between incidence and each index, and between incidence and average human densities were assessed using the Kendall τ (tau) coefficient test for rank correlation (51). This statistical test determines whether there is an ordinal association between two measured parameters. Under the null hypothesis of independence of the two datasets tested, the Kendall tau (τ) coefficient is expected to be equal to 0. Thus, a p > 0.05 indicates an acceptance of the null hypothesis and therefore an absence of correlation between the two datasets. The Kendall τ (tau) coefficient test for rank correlation was performed for all sites (78 sites), and only for sites were dengue cases have been recorded (50 sites). The influence of locations and ecosystems on incidence and mosquito densities was tested by Kruskal-Wallis test followed by a Siegel and Castellan post-hoc test for the datasets not displaying a normal distribution, and by ANOVA followed by a Bonferroni post-hoc test for datasets characterized by a normal distribution. All analyses were performed using Statistica v10.
Results
Sampling and Data Collection
Mosquitoes were collected in a total of 78 locations out of which 46 were classified as urban and 32 as rural (Figure 1, Table 2). A total of 65,876 mosquito larvae (including 55,389 Ae. aegypti and 10,487 Ae. albopictus), were collected in the 78 sampling sites (Table 2). With the exception of Warsadim in West Papua where only Ae. malayanensis was found, either Ae. aegypti or Ae. albopictus or both were found in all other sampling sites. Apart from Warsadim, only one site, did not host any Ae. aegypti, i.e., Bugel in the Province of Yogyakarta, whereas 26 sites were free of Ae. albopictus. The combination of Ae. aegypti and Ae. albopictus was found in 50 sampling sites (Table 2). Out of the 78 health centers analyzed, 28 did not display any case of dengue during the time of the study (Table 2). For the 50 locations displaying dengue cases, the incidence ranged from 4 in Bairafu (East Nusa Tenggara) to 1,087 in Padang Kerta (Bali) (Table 2).
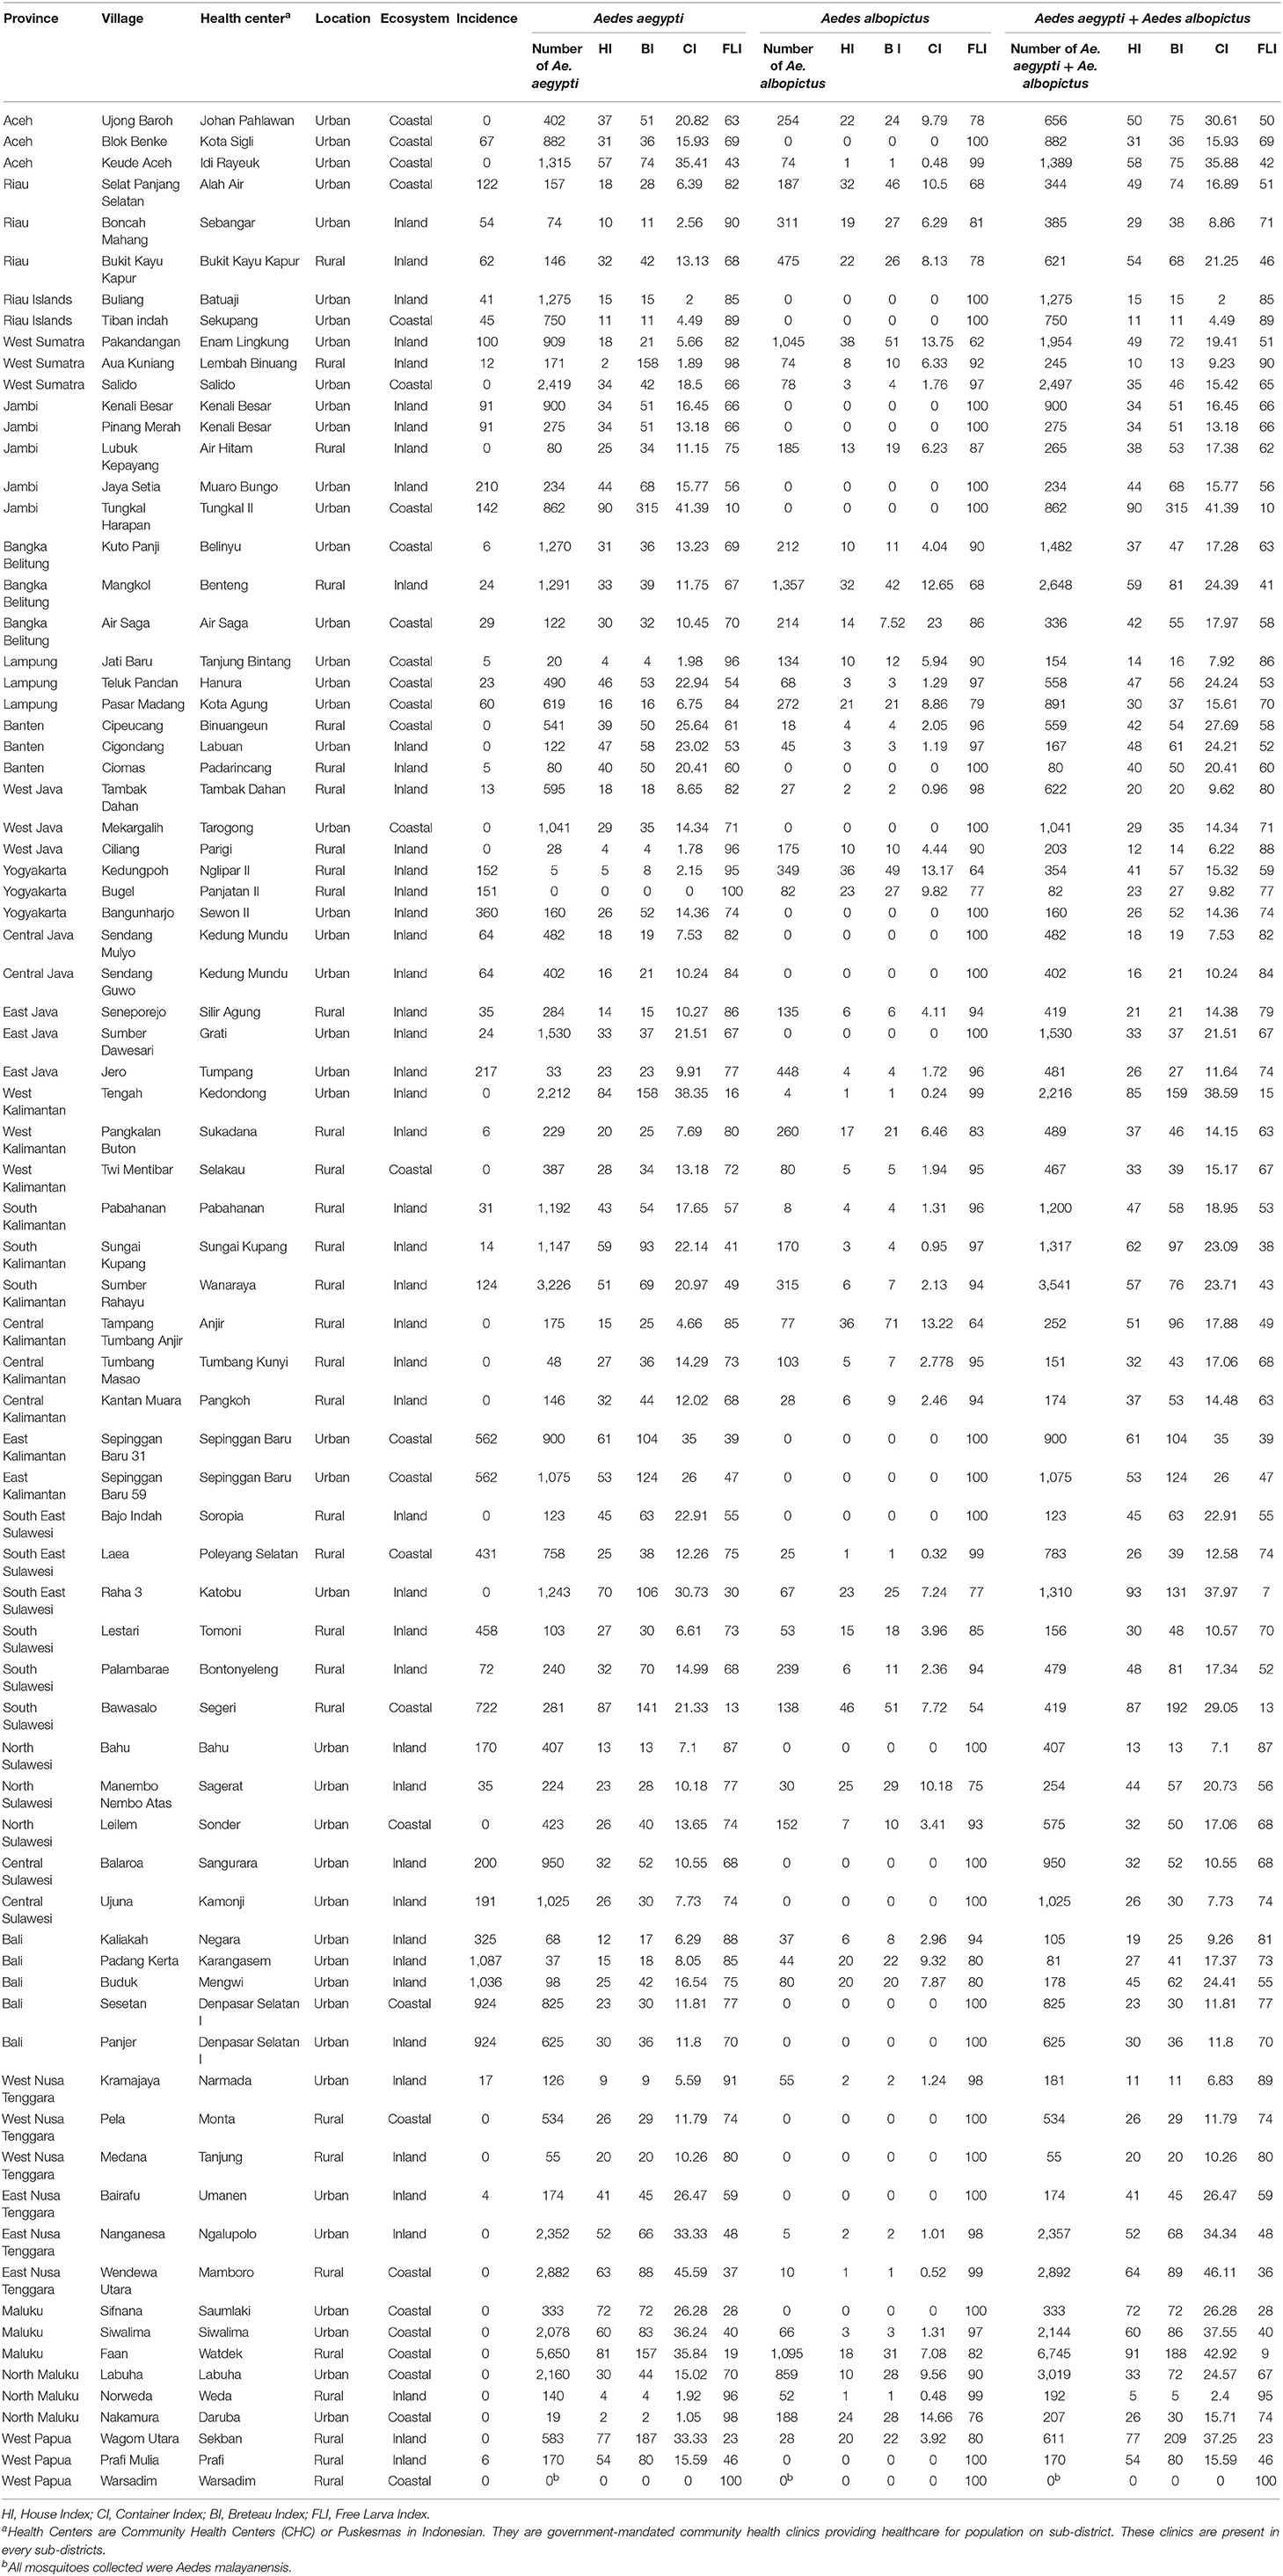
Table 2. Entomological indices from Aedes larvae and pupae survey at 78 sampling sites in Indonesia.
Data Normality
The D-statistic from Kolmogorov-Smirnov normality test for dengue incidence indicates that the data do not follow a normal distribution (p = 0.002; Figure 2). Similarly, the number of mosquito larvae caught does not follow a normal distribution for Ae. aegypti (p = 0.0492), as well as for Ae. albopictus (p = 0.0023). The sum of all Ae. aegypti and Ae. albopictus larvae was the only dataset following a normal distribution (p = 0.0751).
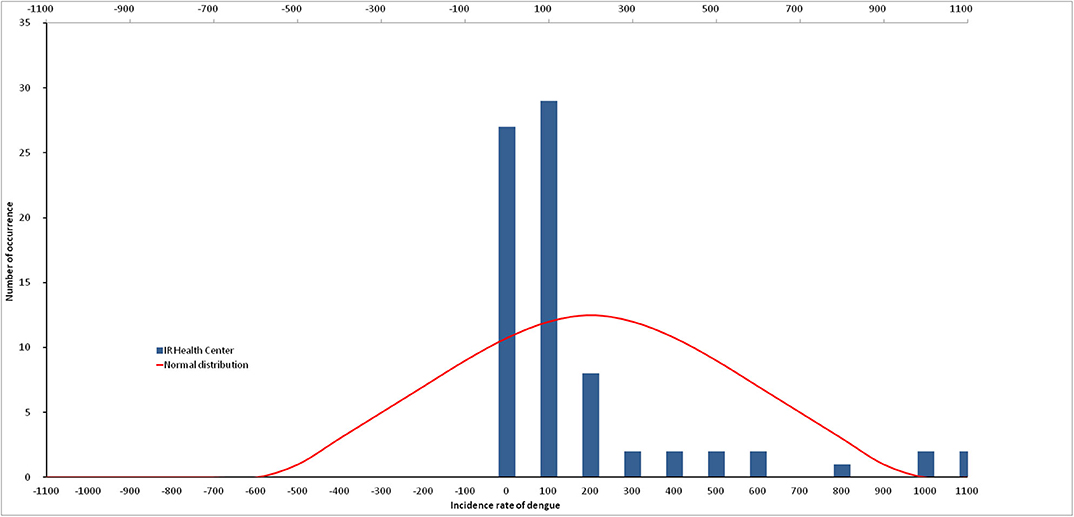
Figure 2. Non-normal distribution of dengue incidence.
Correlation Between Dengue Infection Rates and Human Density
The PCA analysis indicated a clear correlation between dengue incidence and the human population density registered for each location (Figure 3). This correlation was confirmed by the Kendall rank correlation coefficients test (τ = 0.242; p = 0.0125), indicating that the dengue incidence increased along with the human population density.
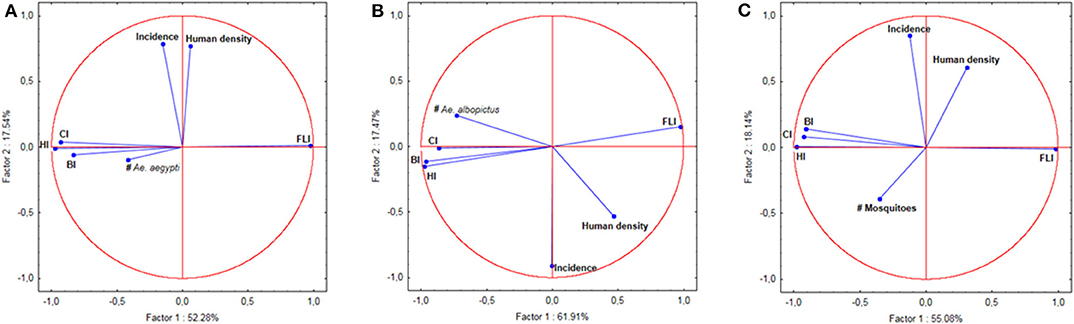
Figure 3. Principal Component Analysis (PCA) of indices, number of mosquitoes, human population density, and incidence of dengue. (A) PCA for Ae. aegypti. (B) PCA for Ae. albopictus. (C) PCA for Ae. aegypti and Ae. albopictus together.
Correlation Between Dengue Infection Rates and Larvae Indices
Tests on the value of the coefficient τ (Kendall rank correlation coefficients test) for the incidence of each sampling location vs. each of the indices at the same location were systematically higher than the limit p-value of 0.05 indicating that the test was significant. Only places clinical dengue cases have been recorded were considered in the analysis. The null hypothesis of independence of the data was therefore accepted indicating that there was no correlation between the incidences, any of the indices (CI, HI, BI and FLI) and the number of mosquitoes in all of the 50 epidemic locations analyzed (Table 3). This lack of correlation was observed for Ae. aegypti alone, for Ae. albopictus alone and for the sum of Ae. aegypti and Ae. albopictus (Table 3). The Principal Component Analysis (PCA) displayed a very high level of explanation for the datasets tested (Figure 3). For Ae. aegypti alone, the PCA explained 69.82% of the data spread (axis 1: 52.28% and axis 2: 17.54%) (Figure 3A). For Ae. albopictus alone, the PCA explained 79.38% of the data spread (axis 1: 61.91% and axis 2: 17.47%) (Figure 3B). For both species, i.e., Ae. aegypti and Ae. albopictus considered together, the level of explanation of the data spread given by the PCA analysis was 73.22% (axis 1: 55.08% and axis 2: 18.14%) (Figure 3C). For each PCA, the same observations can be made, namely: (i) a strong autocorrelation of the different indices with each other, (ii) a correlation between the indices and the total number of mosquitoes, (iii) a correlation between dengue incidence and average human density, and finally (iv) a complete lack of correlation between dengue incidence in a study site and the Stegomyia indices shown by the orthogonal position observed in all PCA analyses between indices and incidence.
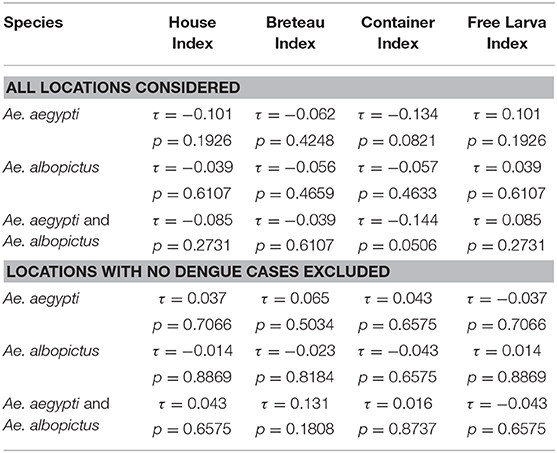
Table 3. Tau (τ) and p-values obtained for incidence and entomological indices by Kendall rank correlation coefficients test.
Influence of Locations and Ecosystems
The incidence was not significantly correlated with the different environments considered: urban vs. rural (Figure 1A) and coastal vs. inland (Figure 1B) (Kruskal-Wallis: H = 7.72; p = 0.0523). Mosquito distributions were significantly different (tested by Kruskal-Wallis non-parametric statistical test) for each type of environment for both Ae. aegypti (H = 8.43; p = 0.038) and Ae. albopictus (H = 7.96; p = 0.0468). Differences (Siegel and Castellan post-hoc test) were marginal and only appeared between urban/inland and urban/coastal for Ae. aegypti (p = 0.037) and between rural/inland and rural/coastal for Ae. albopictus (p = 0.0404). For the combination of both species, which is the only dataset in this work following a normal distribution, the ANOVA test indicated no difference between environments (F = 2.045; p = 0.1149).
Discussion
Following to the use of Stegomyia indices to predict the risk of dengue outbreaks several articles in the literature questioned their efficiency (19, 28, 45, 46). A systematic review on the application of the Stegomyia indices to predict dengue outbreaks was conducted (2). Out of all the articles reviewed 15 were ranked as “weak studies” and no clear conclusion could be reached (2). Out of 13 articles directly dealing with the relationship between Stegomyia indices and dengue infection, 4 concluded on a correlation, 4 concluded on a lack of correlation, and 5 reported inconclusive discussions (2). More recent articles published on the subject also provided various conclusions. One article concluded on the lack of correlation (45), the second concluded on a correlation (46), and the last two were inconclusive, depending on the type of analysis performed (19, 29).
The work reported here brings explanations on the diverging conclusions reached by the previous studies. The first point to consider is that all the works previously reported on this topic were focused on a single place or a limited area. No studies were performed over a very large geographic area encompassing different local climates and environmental conditions. Therefore, each study was strongly influenced by local geographic and climatic conditions but also specific urbanization and socio-economic conditions, which could have biased the data. Furthermore, these previous studies were all independent investigations with variations in sampling schemes and methodologies, making difficult a comparative analysis. Our study is based on a very large cross-section of locations of various sizes, with different urban environments throughout all of Indonesia. The geographic coverage of this work and the integration of a large set of data into a single analysis made data smoothing possible as well as elimination of variations due to specific environments or socio-economic conditions.
Data analysis in all previous studies utilized parametric statistics. However, as reported in this work, the data considered do not follow a normal, Gaussian distribution. Since parametric statistics are not well-suited for non-normal datasets, this could well-explain the contradictory conclusions previously reported. Consequently, we applied non-parametric methods to correct for bias. The dengue vectors are anthropophilic mosquitoes (52) and therefore the distribution of breeding sites is influenced by human societal aspects (53). The real drivers behind the distribution of Aedes breeding sites are demography, urbanization, and socio-economic level. This is supported by the correlation observed between the density of human populations and the incidence of dengue. These societal, sociological, and economical aspects do not follow a normal distribution and therefore the distribution of mosquitoes, thus the entomological indices, as well as the incidence of dengue do not either. Consequently, our application of non-parametric statistical analysis of the data, which to our knowledge was not done in any previous studies (2, 19, 25, 28, 30, 32–46), provides a very robust statistical conclusion strengthened by the size of the study and the multiplicity of sites and conditions.
We conclude that there is no correlation between the incidence of dengue and any of the Stegomyia indices. The very high level of explanation provided by the PCAs is a consequence of both the nature of the data studied and the absence of correlation between incidence and indices. Indeed, the first axis (abscissa on the graphs) explains the dispersion of the indices, which are necessarily correlated since they represent different elements of the mosquito population density in a study area. The second axis (ordered on the graphs) explains the dispersion of the incidence data. The lack of correlation between the two types of data is clearly represented by the orthogonality of the vectors of the various indices with respect to dengue incidence. None of the datasets influences the position of the other. Therefore, the data dispersion occurs in each set only, which considerably increases the explanation of the axes. This total lack of correlation is observed for both Ae. aegypti and Ae. albopictus, which eliminates any possibility of species-related interaction. This is also expected since the main drivers are linked to societal aspects and both species are anthropophilic (53).
The Stegomyia indices are not relevant descriptors for assessing the risk of dengue outbreak. They are not related to the vector competence. These indices are simply demographic descriptors. The higher the population, the higher the value of the descriptor. However, the main reason for this discrepancy is that they are targeting the wrong level of biological significance. The Stegomyia indices are targeting the species level, which is a good compromise between a reasonable work investment for collecting data and a systematic level accurate enough to avoid dispersion of data. Furthermore, the species is the widely recognized level of classification for the identification of living organisms. However, a species is an intellectual construction and is not biologically relevant. The relevant level of discrimination with respect to biological functions, and therefore vector competence, is the population or subspecies (54–56). A species should be regarded as a metapopulation or the combination of crossfertile genetically distinct populations displaying differing phenotypic traits (57). The vector competence of Aedes and other mosquitoes was shown to be related to specific populations (16, 56, 58–60) and not to the species per se. Targeting the species level with demographic descriptors can thus be misleading, hence the contradictory results obtained when assessing the efficiency of Stegomyia indices for predicting dengue outbreaks. A very high demography of a poorly vectoring population will lead to actions of prevention in the absence of risk of outbreak, whereas a low demography of a very good vectoring population would lead to a lack of action in the presence of a high risk of outbreak.
If not related to the Stegomyia indices, the dengue incidence is instead statistically related to the human population density. This is not really surprising since Aedes mosquitoes fly an average of 250 meters around their breeding site. Considering this short distance of flight, there is more chance for an infected mosquito to find a blood meal within flying distance in densely populated area than in a dispersed habitat. Other approaches than the Stegomyia indices, based on societal and urbanistic parameters should then be considered. The “One house/One inspector” approach recently implemented in Indonesia by the Ministry of Health is an interesting and sound alternative to the Stegomyia indices based on the monitoring and elimination of breeding sites at the household level (61). The philosophy of intervention developed in Indonesia is the prevention of dengue transmission through community participation. The approach implemented is the 3M approach, i.e., covering water containers (Menutup), cleaning water containers (Menguras), and burying discarded containers (Mengubur). The implementation is under the responsibility of families in each household. At least one person in each household is in charge of monitoring Aedes larvae in all water storage. However, to efficiently implement surveillance and risk analysis, people must be given reliable indices. It would therefore be important to communicate on the lack of reliability of the Stegomyia indices and to support the development of novel, more reliable, sociology-related markers, and actions taking into account the correlation between human population density and dengue incidence such as urbanism, type of housing, or socioeconomic level.
Data Availability Statement
All datasets generated for this study are included in the article.
Author Contributions
TG participated in all part of the work. MH, R, RS, YA, and TS contributed to the conception and design of the study, and participated to the field work. J organized the field work. R, M, and WT did the field work and built the database. LG did the statistical analyses. SM did the supervision and corrections. RF did the analyses, supervision, and writing. All authors contributed to the article and approved the submitted version.
Funding
This study was conducted by using a large dataset established as part of the Rikhus Vektora project on disease vectors and reservoirs in 2016–2017 and as part of the WHO project SEINO 1611945 in 2016. Both projects were conducted under the supervision and coordination of the Institute for Vector and Reservoir Control Research and Development, National Institute of Health Research and Development, Ministry of Health, Republic of Indonesia. TG, RF, SM, and TS were supported in part by the Nusantara projects Zika & Co. and SOCIAL.
Conflict of Interest
The authors declare that the research was conducted in the absence of any commercial or financial relationships that could be construed as a potential conflict of interest.
References
1. WHO. Global Strategy for Dengue Prevention and Control 2012–2020. Geneva: World Health Organization (2012). Available online at: https://www.who.int/denguecontrol/9789241504034/en/
2. Bowman LR, Runge-Ranzinger S, McCall PJ. Assessing the relationship between vector indices and dengue transmission: a systematic review of the evidence. PLoS Negl Trop Dis. (2014) 8:e2848. doi: 10.1371/journal.pntd.0002848
3. Shepard DS, Undurraga E, Halasa Y. Economic and disease burden of dengue in Southeast Asia. PLoS Negl Trop Dis. (2013) 7:e2055. doi: 10.1371/journal.pntd.0002055
4. Ausvetplan. Disease Strategy Japanese Encephalitis. Agriculture and Resource Management Council of Australia and New Zealand (1998). p. 1–41. Available online at: http://www.international-food-safety.com/pdf/ausvet-japanese.pdf
5. Castro MC, Wilson ME, Bloom DE. Disease and economic burdens of dengue. Lancet Infect Dis. (2017) 17:e70–8. doi: 10.1016/S1473-3099(16)30545-X
6. de Almeida Silva Teixeira L, dos Santos Nogueira FP, Nascentes GAN. Prospective study of patients with persistent symptoms of dengue in Brazil. Rev Inst Med Trop São Paulo. (2017) 59:1–9. doi: 10.1590/s1678-9946201759065
7. Martelli CMT, Nascimento NE, Suaya JA, Siqueira JB, Souza WV, Turchi MD, et al. Quality of life among adults with confirmed dengue in Brazil. Am J Trop Med Hyg. (2011) 85:732–8. doi: 10.4269/ajtmh.2011.11-0067
8. Murray NE, Quam MB, Wilder-Smith A. Epidemiology of dengue: past, present and future prospects. Clin Epidemiol. (2013) 5:299–309. doi: 10.2147/CLEP.S34440
9. Bhatt S, Gething PW, Brady OJ, Messina JP, Farlow AW, Moyes CL, et al. The global distribution and burden of dengue. Nature. (2013) 496:504–7. doi: 10.1038/nature12060
10. Undurraga EA, Halasa YA, Shepard DS. Use of expansion factors to estimate the burden of dengue in Southeast Asia: a systematic analysis. PLoS Negl Trop Dis. (2013) 7:e2056. doi: 10.1371/journal.pntd.0002056
11. Prayitno A, Taurel AF, Nealon J, Satari HI, Karyanti MR, Sekartini R, et al. Dengue seroprevalence and force of primary infection in a representative population of urban dwelling Indonesian children. PLoS Negl Trop Dis. (2017) 11:e0005621. doi: 10.1371/journal.pntd.0005621
12. Harapan H, Michie A, Mudatsir M, Sasmono RT, Imrie A. Epidemiology of dengue hemorrhagic fever in Indonesia: analysis of five decades data from the national disease surveillance. BMC Res Notes. (2019) 12:350. doi: 10.1186/s13104-019-4379-9
13. MoH Indonesia. Dengue Haemorrhagic Fever in Indonesia. Jakarta: Data and information center, Ministry of Health Indonesia (2016).
14. Kustriastuti R, Sutomo S. Evolution of dengue prevention and control programme in Indonesia DF/DHF disease burden. Dengue Bull. (2005) 29:1–7.
15. Tam CC, O'Driscoll M, Taurel AF, Nealon J, Hadinegoro SR. Geographic variation in dengue seroprevalence and force of infection in the urban paediatric population of Indonesia. PLoS Negl Trop Dis. (2018) 12:e0006932. doi: 10.1371/journal.pntd.0006932
16. Powell JR, Tabachnick WJ. History of domestication and spread of Aedes aegypti-a review. Mem Inst Oswaldo Cruz. (2013) 108:11–7. doi: 10.1590/0074-0276130395
17. Higa Y. Dengue vectors and their spatial distribution. Trop Med Health. (2011) 39:17–27. doi: 10.2149/tmh.2011-S04
18. Kuno G. Review of the factors modulating dengue transmission. Epidemiol Rev. (1995) 17:321–35. doi: 10.1093/oxfordjournals.epirev.a036196
19. Chang FS, Tseng YT, Hsu PS, Chen CD, Lian I Bin, Chao DY. Re-assess vector indices threshold as an early warning tool for predicting dengue epidemic in a dengue non-endemic country. PLoS Negl Trop Dis. (2015) 9:1–20. doi: 10.1371/journal.pntd.0004043
20. Wilder-Smith A, Ooi EE, Vasudevan SG, Gubler DJ. Update on dengue: epidemiology, virus evolution, antiviral drugs, and vaccine development. Curr Infect Dis Rep. (2010) 12:157–64. doi: 10.1007/s11908-010-0102-7
21. Parra MCP, Fávaro EA, Dibo MR, Mondini A, Eiras ÁE, Kroon EG, et al. Using adult Aedes aegypti females to predict areas at risk for dengue transmission: a spatial case-control study. Acta Trop. (2018) 182:43–53. doi: 10.1016/j.actatropica.2018.02.018
22. World Health Organization. Dengue: Guidelines for Diagnosis, Treatment, Prevention and Control (2009). Available online at: https://apps.who.int/iris/handle/10665/44188
23. MoH Indonesia. Guidelines for Dengue Haemorrhagic Fever Control Program in Indonesia (in Bahasa Indonesia). Directorate general disease prevention and control, MoH Indonesia (2015).
24. Focks D. A review of entomological sampling methods and indicators for dengue vectors. Dengue Bull. (2003) 28:208389.
25. Barbosa GL, Donalísio MR, Stephan C, Lourenço RW, Andrade VR, Arduino M de B, et al. Spatial distribution of the risk of dengue and the entomological indicators in Sumaré, State of São Paulo, Brazil. PLoS Negl Trop Dis. (2014) 8:e287 doi: 10.1371/journal.pntd.0002873
26. Sanchez L, Vanlerberghe V, Alfonso L, Marquetti MDC, Guzman MG, Bisset J, et al. Aedes aegypti larval indices and risk for dengue epidemics. Emerg Infect Dis. (2006) 12:800–806. doi: 10.3201/eid1205.050866
27. Tun-Lin W, Kay BH, Barnes A, Forsyth S. Critical examination of Aedes aegypti indices: correlations with abundance. Am J Trop Med Hyg. (1996) 540:543–7. doi: 10.4269/ajtmh.1996.54.543
28. Pan American Health Organization. Dengue and Dengue Hemorrhagic Fever in the Americas: Guidelines for Prevention and Control. Washington, DC: PAHO Scientific Publication No. 548. (1994).
29. Cromwell EA, Stoddard ST, Barker CM, Van Rie A, Messer WB, Meshnick SR, et al. The relationship between entomological indicators of Aedes aegypti abundance and dengue virus infection. PLoS Negl Trop Dis. (2017) 11:1–22. doi: 10.1371/journal.pntd.0005429
30. Pontes RJ, Freeman J, Oliveira-Lima JW, Hodgson JC, Spielman A. Vector densities that potentiate dengue outbreaks in a Brazilian city. Am J Trop Med Hyg. (2000) 62:378–83. doi: 10.4269/ajtmh.2000.62.378
31. Chadee DD. Dengue cases and Aedes aegypti indices in Trinidad, West Indies. Acta Trop. (2009) 112:174–80. doi: 10.1016/j.actatropica.2009.07.017
32. Basso C, Caffera RM, Da Rosa EG, Lairihoy R, González C, Norbis W, et al. Mosquito-producing containers, spatia distribution, and relationship between Aedes aegypti population indices on the southern boundary of its distribution in South America (Salto, Uruguay). Am J Trop Med Hyg. (2012) 87:1083–8. doi: 10.4269/ajtmh.2012.12-0328
33. Sulaiman S, Pawanchee ZA, Arifin Z, Wahab A. Relationship between Breteau and house indices and cases of dengue/dengue hemorrhagic fever in Kuala Lumpur, Malaysia. J Am Mosq Control Assoc. (1996) 12:494–6.
34. Katyal R, Kumar K, Gill KS, Sharma RS. Impact of intervention measures on DF/DHF cases and Aedes aegypti indices in Delhi, India: an update, 2001. Dengue Bull. (2003) 27:163–7.
35. Chadee DD, Williams FL, Kitron UD. Impact of vector control on a dengue fever outbreak in Trinidad, West Indies, in 1998. Trop Med Int Health. (2005) 10:748–54. doi: 10.1111/j.1365-3156.2005.01449.x
36. Romero-Vivas CM, Falconar AK. Investigation of relationships between Aedes aegypti egg, larvae, pupae, and adult density indices where their main breeding sites were located indoors. J Am Mosq Control Assoc. (2005) 21:15–22. doi: 10.2987/8756-971X(2005)21[15:IORBAA]2.0.CO;2
37. Corrêa PRL, França E, Bogutchi TF. Aedes aegypti infestation and occurrence of dengue in the city of Belo Horizonte, Brazil. Revista de Saude Publica. (2005) 39:33–40. doi: 10.1590/S0034-89102005000100005
38. Sanchez L, Cortinas J, Pelaez O, Gutierrez H, Concepción D, Van Der Stuyft, et al. Breteau index threshold levels indicating risk for dengue transmission in areas with low Aedes infestation. Trop Med Int Health. (2010) 15:173–5. doi: 10.1111/j.1365-3156.2009.02437.x
39. Chaikoolvatana A, Singhasivanon P, Haddawy P. Utilization of a geographical information system for surveillance of Aedes aegypti and dengue haemorrhagic fever in north-eastern Thailand. Dengue Bull. (2007) 31:75–82.
40. Gürtler RE, Garelli FM, Coto HD. Effects of a five-year citywide intervention program to control Aedes aegypti and prevent dengue outbreaks in northern Argentina. PLoS Negl Trop Dis. (2009) 3:e427. doi: 10.1371/journal.pntd.0000427
41. Honório NA, Nogueira RMR, Codeço CT, Carvalho MS, Cruz OG, Magalhães Mde A, et al. Spatial evaluation and modeling of dengue seroprevalence and vector density in Rio de Janeiro, Brazil. PLoS Negl Trop Dis. (2009) 3:e545. doi: 10.1371/journal.pntd.0000545
42. Lin CH, Wen TH. Using geographically weighted regression (GWR) to explore spatial varying relationships of immature mosquitoes and human densities with the incidence of dengue. Int J Environ Res Public Health. (2011) 8:2798–815. doi: 10.3390/ijerph8072798
43. Arboleda S, Jaramillo ON, Peterson AT. Spatial and temporal dynamics of Aedes aegypti larval sites in Bello, Colombia. J Vector Ecol. (2012) 37:37–48. doi: 10.1111/j.1948-7134.2012.00198.x
44. Pham HV, Doan HT, Phan TT, Minh NN. Ecological factors associated with dengue fever in a central highlands province, Vietnam. BMC Infect Dis. (2011) 11:172. doi: 10.1186/1471-2334-11-172
45. Wijayanti SP, Sunaryo S, Suprihatin S, McFarlane M, Rainey SM, Dietrich I, et al. Dengue in Java, Indonesia: relevance of mosquito indices as risk predictors. PLoS Negl Trop Dis. (2016) 10:e0004500. doi: 10.1371/journal.pntd.0004500
46. Agha SB, Tchouassi DP, Bastos AD, Sang R. Assessment of risk of dengue and yellow fever virus transmission in three major Kenyan cities based on Stegomyia indices. PLoS Negl Trop Dis. (2017) 11:e0005858. doi: 10.1371/journal.pntd.0005858
47. World Health Organization. Comprehensive Guidelines for Prevention and Control of Dengue and Dengue Haemorrhagic Fever. Revised an. World Health Organization, Regional Office for South-East Asia (2011). Available online at: http://origin.searo.who.int/entity/vector_borne_tropical_diseases/documents/SEAROTPS60/en/
48. World Health Organization. Entomological Surveillance for Aedes spp. in the Context of Zika virus. (2016). 1–10. Available online at: https://apps.who.int/iris/handle/10665/204894
49. IVRCRD. Manual on mosquitoes field sampling methods. In: Bahasa Indonesia. 3rd ed. Salatiga: National Institute of Helath Research and Development MoH Indonesia (2017).
50. Razali NM, Wah YB. Power comparisons of shapiro-wilk, kolmogorov-smirnov, lilliefors and anderson-darling tests. J Stat Model Analyt. (2011) 2:21–33.
51. Sen PK. Estimates of the regression coefficient based on Kendall's tau. J Am Stat Assoc. (1968) 63:1379–89. doi: 10.1080/01621459.1968.10480934
52. Scott TW, Takken W. Feeding strategies of anthropophilic mosquitoes result in increased risk of pathogen transmission. Trends Parasitol. (2012) 28:114–21. doi: 10.1016/j.pt.2012.01.001
53. Brown JE, Evans BR, Zheng W, Obas V, Barrera-Martinez L, Egizi A, et al. Human impacts have shaped historical and recent evolution in Aedes aegypti, the dengue and yellow fever mosquito. Evolution. (2014) 68:514–25. doi: 10.1111/evo.12281
54. Tabachnick WJ, Powell JR. A world-wide survey of genetic variation in the yellow fever mosquito, Aedes aegypti. Genet Res. (1979) 34:215–29. doi: 10.1017/S0016672300019467
55. Tabachnick WJ, Wallis G, Aitken TH, Miller BR, Amato GT, Lorenz L, et al. Oral infection of Aedes aegypti with yellow fever virus: geographic variation and genetic considerations. Am J Trop Med Hyg. (1985) 34:1219–24. doi: 10.4269/ajtmh.1985.34.1219
56. Black WC IV, Bennett KE, Gorrochótegui-Escalante N, Barillas-Mury CV, Fernández-Salas I, de Lourdes Muñoz, et al. Flavivirus susceptibility in Aedes aegypti. Arch Med Res. (2002) 33:379–88. doi: 10.1016/S0188-4409(02)00373-9
57. Hanski I, Gilpin M. Metapopulation dynamics: brief history and conceptual domain. Biol J Linnean Soc. (1991) 42:3–16. doi: 10.1111/j.1095-8312.1991.tb00548.x
58. Bennett KE, Olson KE, de Lourdes Muñoz M, Fernandez-Salas I, Farfan-Ale JA, Higgs S, et al. Variation in vector competence for dengue 2 virus among 24 collections of Aedes aegypti from Mexico and the United States. Am J Trop Med Hyg. (2002) 67:85–92. doi: 10.4269/ajtmh.2002.67.85
59. Ocampo CB, Wesson DM. Population dynamics of Aedes aegypti from a dengue hyperendemic urban setting in Colombia. Am J Trop Med Hyg. (2004) 71:506–13. doi: 10.4269/ajtmh.2004.71.506
Keywords: Stegomyia indices, dengue, incidence, mosquito-borne disease, Aedes aegypti, Aedes albopictus
Citation: Garjito TA, Hidajat MC, Kinansi RR, Setyaningsih R, Anggraeni YM, Mujiyanto, Trapsilowati W, Jastal, Ristiyanto, Satoto TBT, Gavotte L, Manguin S and Frutos R (2020) Stegomyia Indices and Risk of Dengue Transmission: A Lack of Correlation. Front. Public Health 8:328. doi: 10.3389/fpubh.2020.00328
Received: 27 January 2020; Accepted: 15 June 2020;
Published: 24 July 2020.
Edited by:
Sunil Dhiman, Defence Research & Development Establishment (DRDE), IndiaReviewed by:
Sarita Kumar, University of Delhi, IndiaBasile Kamgang, Centre for Research in Infectious Diseases (CRID), Cameroon
Kshitij Chandel, Forensic Science Laboratory, Kolkata, India
Copyright © 2020 Garjito, Hidajat, Kinansi, Setyaningsih, Anggraeni, Mujiyanto, Trapsilowati, Jastal, Ristiyanto, Satoto, Gavotte, Manguin and Frutos. This is an open-access article distributed under the terms of the Creative Commons Attribution License (CC BY). The use, distribution or reproduction in other forums is permitted, provided the original author(s) and the copyright owner(s) are credited and that the original publication in this journal is cited, in accordance with accepted academic practice. No use, distribution or reproduction is permitted which does not comply with these terms.
*Correspondence: Triwibowo Ambar Garjito, dHJpd2lib3dvQGxpdGJhbmcua2Vta2VzLmdvLmlk