 Jeremy G. Grant
 Linda S. Siegel2†
 Amedeo D'Angiulli
- 1Department of Neuroscience, Carleton University, Ottawa, ON, Canada
- 2Department of Educational and Counselling Psychology, and Special Education, The University of British Columbia, Vancouver, BC, Canada
We bridge two analogous concepts of comorbidity, dyslexia-dyscalculia and reading-mathematical disabilities, in neuroscience and education, respectively. We assessed the cognitive profiles of 360 individuals (mean age 25.79 ± 13.65) with disability in reading alone (RD group), mathematics alone (MD group) and both (comorbidity: MDRD group), with tests widely used in both psychoeducational and neuropsychological batteries. As expected, the MDRD group exhibited reading deficits like those shown by the RD group. The former group also exhibited deficits in quantitative reasoning like those shown by the MD group. However, other deficits related to verbal working memory and semantic memory were exclusive to the MDRD group. These findings were independent of gender, age, or socioeconomic and demographic factors. Through a systematic exhaustive review of clinical neuroimaging literature, we mapped the resulting cognitive profiles to correspondingly plausible neuroanatomical substrates of dyslexia and dyscalculia. In our resulting “probing” model, the complex set of domain-specific and domain-general impairments shown in the comorbidity of reading and mathematical disabilities are hypothesized as being related to atypical development of the left angular gyrus. The present neuroeducational approach bridges a long-standing transdisciplinary divide and contributes a step further toward improved early prediction, teaching and interventions for children and adults with combined reading and math disabilities.
Introduction
The classification, diagnosis, and treatment of learning disabilities are important topics of research in both psychoeducational and neuroscience literature. Researchers in these two fields often measure similar constructs but use differing approaches to work with individuals with learning disabilities. Consequently, each field has produced different concepts and theories over time, leading to a sort of disconnect between the identification of learning disabilities in educational settings and the identification of learning disabilities based on neuroscientific evidence, respectively. Furthermore, the identification and development of comorbid learning disabilities, while a prevalent topic in psychoeducational literature, remains relatively understudied in neuroscience; a testable model of the neuroanatomical substrates of comorbidity is greatly needed. We developed a novel neuroeducational approach to bridge the corresponding concepts on learning disabilities in the two disciplinary fields.
Learning Disabilities
Learning disabilities are a type of neurodevelopmental disorders that impede the acquisition, retention, or application of verbal or non-verbal information, affecting a person's ability to use specific cognitive skills (1, 2). The most prevalent learning disability is reading disability, a specific difficulty in learning to read, interpret, and manipulate written words, also known as dyslexia. The second most prevalent is mathematical disability, a specific difficulty in learning arithmetic and performing mental calculations, also known as dyscalculia (3, 4).
Current research on comorbid math and reading disabilities and their developmental origins is far from exhaustive. As recently as 2007, a systematic review of the U.S. Department of Education's Educational Research Information Center (ERIC) database revealed that the number of published studies on reading disability outnumbered the number of studies on math disability by a ratio of 14 to 1 (5). This disparity in knowledge translates into disproportionate diagnoses and asymmetric interventions for individuals with comorbid math and reading disabilities. Therefore, defining a robust neuroeducational model of dyslexia-dyscalculia comorbidity is a priority for the early identification and treatment of learning disabilities (6–8).
The Psychoeducational Approach to Identifying Learning Disabilities
The psychoeducational evaluation is the traditional method of classifying and identifying learning disabilities. The goal of the evaluation is to examine the student's performance on standardized tests of general academic achievement (9), and will determine if the student qualifies for special education or remedial training (10). A psychoeducational assessment typically consists in obtaining an IQ score and selected domain-specific standardized tests—psychometric measures that directly assess abilities in reading, writing, or arithmetic (8, 11).
In this approach, the IQ-achievement discrepancy criterion provides the framework for identifying an unexpected difficulty with learning. To be classified as having a learning disability, the discrepancy model requires that there is a significant discrepancy (usually 1.5 standard deviations) between the person's academic ability or potential (defined by the IQ score) and academic achievement (as defined by their scores on a general reading or math test). This model rests on the questionable assumption that intelligence tests are not confounded by more basic processes for which domain-specific psychoeducational tests provide independent measures (12), and regrettably exclude the possibility of identifying learning disabilities in people with intellectual disabilities (13).
Notably, a study by Tanaka et al. (14) reported evidence based on brain activity demonstrating the diagnostic inappropriateness of the IQ discrepancy criterion. Replicating previous findings based on psychoeducational tests (15) they showed that brain activity and structures associated with reading difficulties in individuals with intact general intellectual ability and in individuals with lower intellectual ability show very similar profiles. The latter supports the recent removal of the IQ discrepancy from the definition of specific learning difficulties in the DSM-V.
The Neuropsychological Approach to Identifying Learning Disabilities
Compared to psychoeducational evaluations, neuropsychological assessments are greater in the depth of their assessment. They are more fine-tuned to examine specific cognitive deficits (such a phonological processing deficits) that underlie learning disabilities. A neuropsychological assessment is performed by licensed clinical neuropsychologists who combine elements of brain anatomy, cognitive neuroscience, and neurodevelopment to infer the neurological correlates of differences in specific cognitive abilities (7).
Secondly, neuropsychological assessments are greater in the breadth of the assessment. In contrast to a psychoeducational evaluation (which typically consists of an IQ score and a few standardized tests), a full neuropsychological assessment includes a structured clinical interview with the client (and interviews with the client's family and/or significant others, if possible), a review of the client's relevant medical records, and the administration of tests that measure domain-general functions such as selective attention, sensory perception, fine motor skills, visuospatial reasoning, and working memory (7). All the available information will be used to make a specific diagnosis of the client's learning disability, instead of relying on psychometric measures alone.
Third, the interpretation of test scores from a neuropsychological assessment is guided by different principles than in a psychoeducational evaluation. Instead of applying the IQ-discrepancy model as in the psychoeducational approach, clinical neuropsychologists define the severity of a learning disability by introducing a cut-off threshold on the tail end of a distribution of academic achievement (9). While cut-off points are useful for providing a post-assessment diagnosis, given the limits of current causal models, they do not precisely reflect the neurobiological basis of a learning disability (13, 16); they rather emphasize normativity and address pragmatic issues related to early intervention.
The identification of math and reading disabilities is a predominant topic in neuroeducation—an emerging field at the intersection of neuropsychology, neuroscience, and psychoeducational research (17–19). The goals of neuroeducation are to develop curricula and teaching methods that are based on a scientific understanding of neural mechanisms of learning (20, 21). In line with this paradigm, the central theme of the present paper is linking in the most direct way possible corresponding constructs in education and neuroscience. The aim is to improve prediction of the biological and psychological factors that yield poor academic outcomes seen in individuals with learning disabilities. By examining the cognitive profiles of individuals with dyslexia and dyscalculia and mapping the observed deficits to their neuroanatomical correlates from existing research, the neuroeducational model proposed in the current research provides educators and neuroscience researchers with a working framework for designing effective teaching and interventions specific to individuals with comorbid learning disabilities.
The Neuropsychology of Dyslexia
Approximately 10% of North American children experience developmental dyslexia (22, 23), a disorder characterized by difficulties with reading fluency that are not better explained by visual or cognitive impairments, psychosocial challenges, or poor language instruction. Observable symptoms include inaccurate or effortful reading, poor spelling ability, and the avoidance of leisure or work-related activities that involve reading (22, 24).
The Cognitive Profile of Reading Disability and Dyslexia
There are several overlapping theories about dysfunctional cognitive processes that impair reading fluency in developmental dyslexia (25), however three theories have garnered widespread support in current research literature: the phonological deficit theory, double-deficit theory and the visual deficit theory.
The phonological deficit theory is the most widely-promoted and well-established theory in dyslexia research (26, 27). This theory proposes that the core impairment in dyslexia is a deficit in phonological processing—a pervasive difficulty with forming associations between phoneme combinations and the correct corresponding sounds, known as grapheme–phoneme correspondence (28, 29). Deficits in phonological processing can be identified early in development (30, 31) and persist into adulthood (32, 33). Dyslexic children exhibit marked difficulties in manipulating pseudowords (non-sensical words made up of valid phonemes in a particular language), and display poor reading fluency when asked to read written words, but not when the words are read to them by another individual (6, 23). In addition, specific training to improve phonological processing leads to significant improvements in reading ability (34, 35).
The double-deficit theory of dyslexia builds on the notions presented in the phonological deficit theory. In addition to impaired phonological processing, this theory suggests dyslexia is characterized by a deficit in rapid automatized naming (RAN). RAN is the measure of how quickly an individual can recognize and name aloud a series of familiar objects, pictures, colors, or symbols, or letters (36). While recent studies have suggested that poor RAN performance may reflect impaired functional connectivity between brain structures that control visual processing and speech, poor RAN performance in sight-word reading can indicate phonological deficits in individuals with dyslexia and are more likely to underlie the difficulties in recognizing words (37, 38).
The visual deficit theory states that reading disabilities arise due to atypical development of the visual system, whereby there is disruption in the processing of visual information from letters and words in written text. Some neuropsychological studies have shown that individuals with reading disabilities exhibit impaired temporal processing, atypical eye movement regulation, and more frequent visual scanning errors in comparison to normal readers (39). While below-average performance on visual attention tasks in preschool has been shown to predict reading disability (40), it is unclear whether a visual system deficit is a root cause or a result of long-term reading disabilities (41), and seems to contradict recent findings of heightened visuospatial reasoning in dyslexic adults (42–44).
The Neuroanatomical Correlates of Dyslexia
Converging evidence from functional neuroimaging studies has pinpointed three neuroanatomical regions in the left hemisphere which primarily facilitate the multimodal processing of written words: the left inferior frontal gyrus, the fusiform gyrus, and temporoparietal parietal junction (displayed in Figures 1A,B). The inferior frontal gyrus contains Broca's area, a region that is well-known in neuropsychological literature for its mediating role in speech production, but less recognized for its role in processing phoneme sequences and phonological segmentation (46–48). The fusiform gyrus (also known as the occipitotemporal gyrus) contains the Visual Word Form area, which enables humans to distinguish between the symbols that form letters and numbers, and symbols that are otherwise arbitrary shapes (49, 50). The temporoparietal junction (a group of structures including the angular gyrus, supramarginal gyrus, and the superior temporal gyrus) facilitates semantic processing and is also involved in the analysis of phoneme sequences (16, 51, 52).
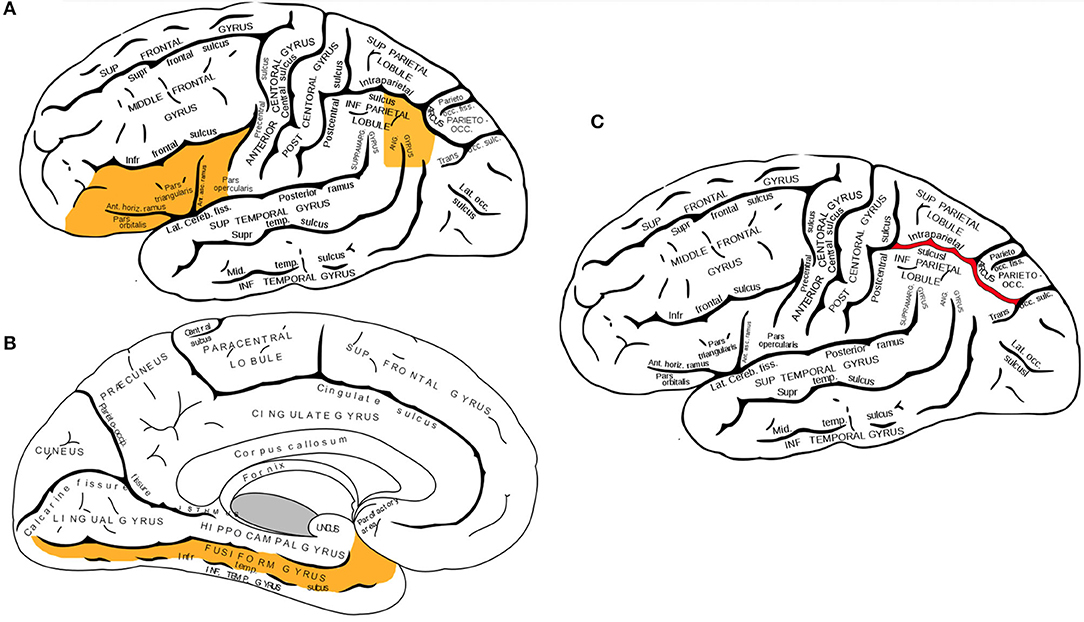
Figure 1. (A,B) Three neuroanatomical structures of the left hemisphere language processing network. (A) The left inferior frontal gyrus and the left angular gyrus are highlighted in this lateral view of the cerebral cortex. (B) Sagittal view of the cerebral cortex shows the left fusiform gyrus. (C) Lateral view of the left intraparietal sulcus. While activation of several brain regions correlates with various aspects of mathematical cognition, intraparietal sulcus (IPS) is the primary activation site during tasks that test numerical magnitude processing (see text). Brain diagrams were adapted from (45). Anatomy of the Human Body. Retrieved from https://www.bartleby.com/107/189.html.
Dyslexia is associated with atypical development of the left hemisphere language network. Compared to age-matched controls, individuals with dyslexia show atypical physiological activity and white-matter connectivity in several frontal, parietal, and temporal structures in their dominant hemisphere (23, 26, 53). Studies that used functional neuroimaging to examine the neural correlates of phonological decoding consistently found that individuals with dyslexia typically exhibit lower cerebral blood oxygenation at the posterior regions of their language network—usually the left fusiform gyrus and the structures of the left temporoparietal junction (6, 16). Meta-analyses of neuroimaging studies that compared functional brain abnormalities between individuals with dyslexia have identified a variety of other brain regions that exhibit atypical activity during reading tasks. A meta-analysis of 28 studies identified hypoactivation of the left inferior frontal gyrus, left fusiform gyrus, left temporoparietal cortex, left occipitotemporal cortex, left precuneus, left frontal operculum, left precentral gyrus, and right superior temporal gyrus, as well as hyperactivation in the left anterior insula (54). Two other meta-analyses identified atypical hypoactivity in bilateral superior temporal gyri, left middle and left inferior temporal gyri, left precuneus, left thalamus, right postcentral gyrus, and the right fusiform gyrus during reading tasks (55, 56).
The Neuropsychology of Dyscalculia
Developmental dyscalculia is characterized by difficulties in processing numerical information and performing basic mathematical operations, impeding the acquisition of age-appropriate mathematical skills (24, 57). It is estimated that dyscalculia affects 3–6% of the world population (58, 59), but dyscalculia is considerably unrepresented in research literature on learning disabilities [5, (57)]. Anywhere from 17 to 66% of individuals with dyscalculia also fit the diagnostic criteria for dyslexia (60, 61). Indeed, students with a math disability are just over two times more likely to also have a reading disability than those without a math disability (62).
The Cognitive Profile of Mathematical Disability and Dyscalculia
Dyscalculia is characterized by impaired non-symbolic and symbolic numerical processing, the ability to quickly estimate and manipulate numerical magnitudes and quickly perform mental operations without writing out procedures (63) or relying on verbally-based strategies such as counting (64, 65). The most popular view of mathematical cognition, and consequently of math disabilities [i.e., Triple Code Model; (66, 67)], entail that all development of symbolic number skills derive (through alternative format re-coding), and are ultimately grounded on the innate endowed ability of “number sense.” Accordingly, humans would form mental representations of numerical quantities using a mental number line, an imaginary line of numbers ordered in an ascending series. Thus, an individual would estimate the place any number or quantity on the number line and perform operations using their approximation of the number—a cognitive function known as numerical magnitude processing or the approximate number system (ANS). The acuity of a person's ANS is often measured using numerical magnitude comparison tasks with non-symbolic quantities (e.g., a group of dots) as opposed to symbolic Arabic digits (e.g., the number 9). In a non-symbolic numerical comparison task, the individual is asked to approximate the correct place for non-symbolic quantity (without counting each item one-by-one) on a visually presented number line. A greater degree of error in ANS has been identified as the core deficit underlying developmental dyscalculia (68, 69). In comparison to typically-developing controls, children with dyscalculia demonstrate lower accuracy in approximating the number of non-symbolic items in a group, and lower accuracy in determining which group of items is greater in magnitude (70, 71). ANS is assumed to rely heavily on spatial representations of numbers (72, 73); individuals with dyscalculia often perform poorly on neuropsychological tests of visuospatial ability (74).
However, a survey of the spectrum of quantity cognition for animals and humans (75) shows that number sense can directly account only for a fraction of the acquired skills, mainly involving approximate small (subitizing for numerosities 1–4) and large quantity assessment and comparison. Oral and written language account for most of the learning spectrum [see Figure 2 in (75)]. On this background, the “primacy” of the number sense has been most recently challenged, since the bulk of multidisciplinary existing evidence demonstrates that the alleged mapping between number sense and symbolic, more complex notions are not as direct as postulated (for example in the most influential Triple Code Model). A review of current neuroscience and behavioral evidence (76) suggests that several alternative possible and plausible routes of normal and atypical non-symbolic to symbolic correlations could occur which provide a better empirical account of math achievement than direct effects of number sense.
One perspective alternative to ANS contends that numerical ability is grounded on representing, understanding, and manipulating symbol-symbol associations (SSA). That is, small numerical symbols are initially mapped on a precise representation (e.g., the subitizing range) which, supported by increasing counting and linguistic competency, eventually leads to an independent and exact symbolic system based on order relations between symbols (77). Most magnitude estimation and comparison effects found in studies confirming ANS can be equally explained and modeled in terms of the SSA, and there is also sufficient evidence of distinct brain mechanisms associated to symbolic and non-symbolic numerical processing (78). Further, recent meta-analyses show that symbolic numerical processing tasks are a strong predictor of arithmetic and have consistently been found to be deficient in dyscalculia [see, for instance (79)]. Critically, representatives of this alternative view of numerical cognition differentiate between a non-symbolic deficit and an access deficit in dyscalculia, which reflects intact ANS, but deficient access to number semantics from numerical symbols (65).
At the same time, a wealth of evidence in research and practice shows that during formal schooling children with dyscalculia experience learning challenges in symbolic and linguistic-based quantitative reasoning related to academic mathematics such as arithmetic, not only numerical skills. These difficulties include learning and remembering exact number words and concepts, and applying skills in: addition/subtraction, multiplication and fraction strategies, commutation and percentages, using place value, as well as geometry, time, measurement, and word problems (80). Without discounting the important role that basic numerical processing might play, the scope of the present work is more narrowly focused on the latter higher-level symbolic and linguistically-based quantitative abilities as they are more directly linked with achievement in educational settings (64).
The Neuroanatomical Correlates of Dyscalculia
The current literature of brain imaging studies reveals that the brain recruits a wide variety of interconnected regions during mathematical tasks, including prefrontal, posterior parietal, occipito-temporal, and hippocampal areas (81). Neuroimaging studies on individuals with dyscalculia have identified two parietal regions associated with the manipulation of numerical quantities: the bilateral intraparietal sulci and the left angular gyrus. Multiple functional neuroimaging studies have shown that the right and left intraparietal sulci (shown in Figure 1C) become activated during calculation tasks that involve numerical magnitude processing (69, 82, 83). In contrast, the angular gyrus becomes activated during the retrieval of arithmetic facts from long-term memory, such as when finding the solutions to simple multiplications (84, 85).
While the neuroanatomical evidence of atypical brain function in developmental dyscalculia is not quite exhaustive, several functional neuroimaging studies have reported atypical activation patterns at the intraparietal sulci. Compared to age-matched controls, children with dyscalculia exhibit reduced activation at the right intraparietal sulcus when performing non-symbolic numerical comparison tasks [for example (86)]. In addition, applying TMS to the right intraparietal sulcus can severely impede performance on numerical magnitude tasks, artificially producing deficits that are equivalent to those observed in adults with dyscalculia [for example (87, 88)].
An Overview of Cognitive Profiles of Comorbid Math and Reading Disabilities
A body of work has focused on the cognitive profiles of individuals with comorbid math and reading disabilities, establishing a design (here dubbed as the “four-groups design”) which has become pivotal in this research area. Specifically, Willburger et al. (89) examined cognitive performance in children with reading disability alone (RD), mathematical disability alone (MD), or with comorbidity of both disabilities (MDRD) as compared to typically developing and/or achieving children (TD and/or TA). MDRD children exhibited additive deficits in rapid automatized naming; this suggested that the deficits associated with comorbidity are additive and not qualitatively different from the deficits in the single disabilities. Later, this team (90) examined how domain-specific processes (e.g., symbolic and non-symbolic numerical processing, phonological processing) and domain-general processes (e.g., working memory, computations) contribute to comorbidity. MDRD children exhibited domain-specific deficits in phonological processing and numerical magnitude processing, performing at the same level as individuals with RD or MD. Unexpectedly, both the latter groups demonstrated better short-term working memory than the MDRD and the TD group, hinting that some domain-general processes may contribute to comorbidity.
Furthermore, Moll et al. (91) showed how three domain-general processes—namely processing speed, temporal processing, and verbal memory—can correlate differentially with reading and mathematical performance and are also associated with inattentive behavior. Both RD and MD children exhibited deficits in verbal memory. However, after controlling for parent-reported difficulties with inattention, deficits in verbal processing became associated with reading ability alone, whereas slowed temporal processing and visuospatial memory deficits were associated with mathematical ability alone. The authors concluded that deficits in processing speed, temporal processing, and verbal memory reflect variations in subclinical attention difficulties, and that reading and mathematical disabilities may thus be the outcome of multiple impaired cognitive systems rather than individual domain-specific processes. Relatedly, Wilson et al. (74) demonstrated that MDRD adults exhibited additive deficits in rapid naming and working memory, equivalent to the sum of the deficits exhibited by adults with the single disabilities. These authors concluded that additive domain-general deficits were likely correlates (not the underlying cause or the eventual consequence) of comorbidity.
More recent studies have shown that some processes traditionally considered as domain-specific may play an important role in comorbidity. Slot et al. (92) showed that children's rapid automatized naming and phonological awareness were associated with reading performance, whereas number sense and visuospatial working memory were associated with mathematical performance. However, phonological awareness was also predictive of mathematical performance, suggesting that a shared deficit in phonological processing may underlie both RD and MD. Similarly, Raddatz et al. (93) found that MD children showed deficits in various non-verbal and verbal tasks related to number processing, whereas RD children showed deficits in verbal tasks.
In contrast to this literature, neuroscience studies have rarely adopted the four-groups design. Improving on this limitation, the following study was designed to start filling some gaps in clarifying the nature of domain-specific and domain-general deficits of reading-math comorbidity with reference to the currently known neural underpinnings of dyslexia and dyscalculia.
The Present Study: Research Questions, Design and Hypotheses
The primary objective of this study was to outline a neuroeducational model of dyslexia-dyscalculia comorbidity—a framework for understanding the psychoeducational and neuropsychological characteristics of individuals with comorbid math and reading disabilities that can be tested for validity in future research. The neuroeducational model proposed here is [as defined by (94)] a preliminary theory or set of hypotheses to synthesize current knowledge and then guide and refine evidence-based practice in education, public health and the allied fields. It should not by any means be interpreted as proof of established knowledge or theory. We fully expect this “probing” model to be tested and re-tested and in this process modified, refined, or even falsified based on future research. This model was established in three phases. In the first phase—using a psychoeducational approach—we examined the performance of individuals with math and reading disabilities on a series of psychoeducational tests and drew conclusions about the specific cognitive deficits they exhibited. In the second phase—using a neuropsychological approach—we performed a systematic review of existing clinical studies on the neuroanatomical correlates of dyslexia and dyscalculia; then, we identified the involvement of key neuroanatomical structures displaying abnormal function. In the third phase, we mapped the deficits as measured by psychoeducational tests to their most plausible neuroanatomical correlates obtained in the systematic review, creating a neuroeducational model of comorbidity that unites the broad psychoeducational definitions of math and reading disabilities with neuropsychological evidence of the biological characteristics of dyslexia and dyscalculia. This series of operations allowed us to build correspondence between the diagnostic tools used to identify learning disabilities in psychoeducational context and the neurodevelopmental theories of dyslexia and dyscalculia in the neuropsychological literature.
To determine the cognitive profile of comorbid dyslexia-dyscalculia, performances were measured from a sample population with math disability, reading disability, and dual math, and reading disability via a comprehensive battery of psychoeducational tests. The statistical analyses of their psychoeducational outcomes were used to (i) determine if there were any measurable cognitive deficits that were unique (in nature or in magnitude) to the participants with comorbid reading-math comorbidity; (ii) determine if the cognitive deficits were domain-specific (within the realm of reading or numerical cognition) or domain-general (working memory and/or executive functions outside the realm of reading or numerical cognition) in nature; (iii) determine the nature of the relationship between math and reading deficits in the comorbid group. Two sets of hypotheses were assessed:
First set of hypotheses: It was hypothesized that the deficits in the comorbid participants would either be additive (where the approximate sum of the deficits in the reading-disabled participants and the math-disabled participants is measured), synergistic (an over-additivity caused by an interaction between math and reading deficits), or antagonistic (an under-additivity caused by an interaction between math and reading deficits). The nature of the relationship between math and reading disabilities was determined using the same 2 × 2 factorial design previously used in the four-groups design literature (74, 90). A significant interaction between the math disability and reading disability indicates a synergistic over-additivity or an antagonistic under-additivity in the mean scores of a particular test, and lack thereof indicates an additive effect.
Second set of hypotheses: it was hypothesized that the comorbid participants in this study would exhibit: (1) impaired reading fluency and phonological processing equivalent to those shown by individuals with reading disability alone, (2) impaired quantitative reasoning skills equivalent to those shown by participants with mathematical disability alone, and (3) deficits in working memory equivalent to those shown by individuals with reading disability alone. Consequently, it was also hypothesized that, consistent with the proposed neuroeducational approach, it should be possible to derive a mapping of correspondence between the pattern found in the psychoeducational findings and known neuroanatomical correlates in the clinical neuroimaging literature, which can be empirically tested with further neuroimaging studies.
Materials and Methods
Psychoeducational Tests
Tests of Achievement for Identifying Math and Reading Disabilities
Wide Range Achievement Test 3rd edition (WRAT3) arithmetic subscale
The WRAT3 Arithmetic subscale is a test of written arithmetic problems, which included number addition, subtraction, multiplication, and problems involving fractions and decimals.
Wide Range Achievement Test 3rd edition (WRAT3) reading subscale
The Reading subscale is a single word reading test, where participants were asked to read aloud a series of increasingly difficult words.
Testing Phonological Processing
Rosner Auditory Analysis Test
The Rosner Auditory Analysis test is the first of two Phoneme Deletion tasks included in this study. Participants were instructed to repeat a list of 40 common English words. Next, the test administrator asked the participant to repeat each word without pronouncing a specific phoneme, thereby “deleting” the first, last or embedded phoneme from the word and pronouncing the word fragment(s) that remained.
Pseudowords Phoneme Deletion task
In this second Phoneme Deletion task, participants were instructed to listen to 30 pseudowords and then repeat it by “deleting” a specific phoneme.
Woodcock Reading Mastery Tests-Revised (WRMT-R) Word Attack subtest
The Word Attack subtest examines a participant's phoneme-grapheme awareness without relying on a verbal demonstration by the test administrator (95). Participants were instructed to read a list of 45 pseudowords. The level of difficulty gradually increased throughout the test; the number of syllables in each pseudoword increased intermittently from 1 syllable to 4 or 5 syllables by the end of the list.
Testing Quantitative Reasoning
KeyMath revised, interpreting data subtest
Participants completed the Interpreting Data subtest of the revised KeyMath Assessment (KeyMath-R) (96). Participants were tasked with solving a written mathematical problem (i.e., “Kareem can read sixty pages in two and one–half hours. How many pages can he read in 1 hour?”).
Testing Intellectual Functioning
All participants, aged 17 and over, completed three subtests of the Wechsler Adult Intelligence Scale (WAIS-R) (97). Participants aged 6 to 16 completed three analogous subtests from the Wechsler Intelligence Scale for Children (WISC-III) (98).
WAIS-R/WISC-III vocabulary subtest
The Vocabulary subtest measures a person's semantic memory retrieval. Participants performing the WAIS-R were asked to orally define a series of 30 vocabulary words, gradually increasing in difficulty. Participants performing the WISC-III were asked to name pictures representing each word.
WAIS-R/WISC-III Block Design subtest
In the Block Design subtest, participants were asked to re-create a model or a picture of a design using up to nine red and white blocks within a time limit. This test was included as a measure of visuospatial reasoning.
WAIS-R/WISC-III Digit Span subtest
The Digit Span subtest examines verbal working memory. Participants were presented orally with a series of single-digit numbers. In the first half of the trials, they were required to orally repeat the presented numbers in the same order they heard (forward digit span); in the second half of the trials, they were to repeat the presented numbers in the reverse order (backward digit span).
Procedure
Participants were tested individually for a 3 h session (including two 10 min breaks). Each testing session began with the administration of the Vocabulary, Block Design, and Digit Span subtests from the WAIS-R or the WISC for participants aged 6–16. Successively, after the first break, each participant completed the Reading, Spelling, and Arithmetic subscales of the WRAT3. After the second break, each participant completed a series of psychoeducational tests. All participants completed four tests of phonological processing: The Rosner Auditory Analysis task, the Pseudowords Phoneme Deletion task, followed by the Word Attack and Word Identification subtests of the Woodcock Reading Mastery Tests (WRMT-R), the latter being excluded from this analysis. Lastly, participants completed the KeyMath Interpreting Data subtest.
Sampling
The participants in this study were selected from a database resulted from a 10 year prospective cohort research study at the University of British Columbia (UBC). A total of 585 participants ranging from 7 to 77 years of age were recruited from around the Greater Vancouver Area as well as the graduate and undergraduate student population at UBC. They were recruited through a publicly advertised free comprehensive psychoeducational assessment offered as compensation for their participation and in exchange for use and publication of the resulting anonymous group data and findings. This study was approved by the UBC institutional research ethics boards in accordance with the 1964 Declaration of Helsinki ethical standards and in strict adherence of the Tri-Council Policy Statement (https://ethics.gc.ca/eng/policy-politique_tcps2-eptc2_initiatives.html). Participants or their parents/guardians (for children < 12 years of age), signed a consent form; parental/guardian's consent was conditional on children's active assent. Participants or parents/guardians completed a brief questionnaire on demographic and socioeconomic information about themselves or their family.
The testing format varied over the decade of data collection, and over 50 different types of test scores were entered into database. The initial database was reduced so as to only include the participants who completed specific psychometric tests in the same specific format and which therefore provided information about the cognitive profiles of individuals with dyslexia and dyscalculia permitting to test the objectives of this study.
Inclusion criteria for the present study entailed: (1) completion of The WRAT3 Arithmetic subscale and WRAT3 Reading subscale, which served as the main diagnostic indicators; (2) completion of domain-specific tests that examine phonological processing (the reading domain) or quantitative reasoning (the mathematical domain), and domain-general tests that examine executive functions (such as working memory and spatial reasoning). In the mathematical domain, only one test was selected: the Interpreting Data subtest of the revised KeyMath Assessment; (3) completion of three neuropsychological tasks that test domain-general cognitive functions were selected: The Vocabulary, Block Design, and Digit Span subtests of the WAIS-R (for participants ages 17 and older) or the WISC-III (participants ages 16 and younger); and finally (4) Estimated IQ scores [calculated using the sum of the WAIS-R Vocabulary subtest and the WAIS-R Block Design subtest, as in (12)] had to be > 70, which we adopted as the clinical threshold for low IQ (99).
The final analysis included data from 360 participants. The average age of the participants (on the day of testing) in each group are presented in Table 1. A one-way ANOVA followed by Tukey post-hoc multiple comparisons revealed that the average age of the RD group was significantly lower than the average age of the TA group (p = 0.008), the MD group (p = 0.017) and the MDRD group (p = 0.007). A two-way MANCOVA was conducted to examine the effect of age on the scores from all seven psychoeducational tests, with math disability and reading disability as the independent variables and age as a covariate. Using the Bonferroni procedure to correct for multiple ANOVAs (with a significant threshold of p < 0.008), there were no significant interactions between age and math disability, nor between age and reading disability, on the mean scores for any of the psychoeducational tests (Wilks' Lambda = 0.012). Furthermore, a three-way MANOVA was conducted with math disability, reading disability, and age category as independent variables. The participants were divided into two age categories: below age 16 and above age 16. MD × Age Category interaction was not significant (Wilks' Lambda = 0.780) nor was the RD x Age Category interaction Wilks' Lambda = 0.349). As a result, the low average age of the dyslexic did not appear to have a significant effect on the psychoeducational test results as whole.
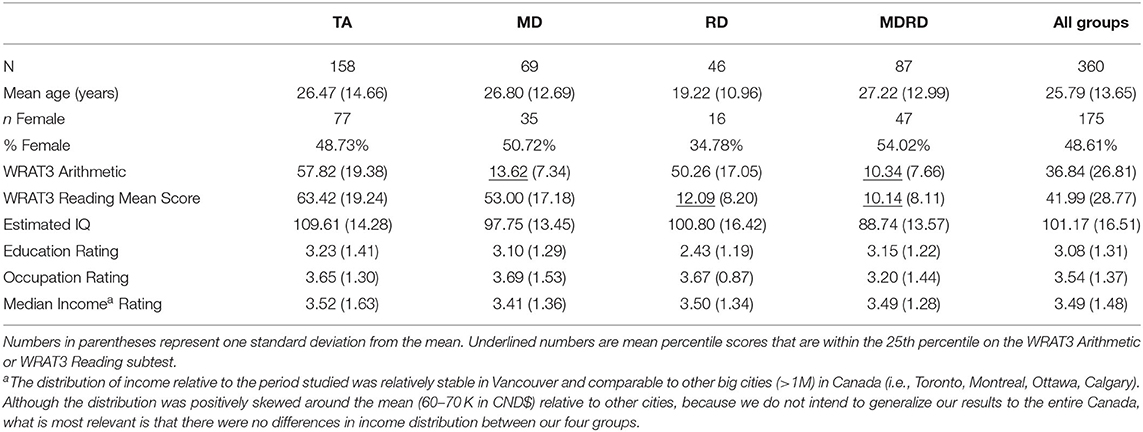
Table 1. Characteristics of the four groups.
Other MANOVA and MANCOVA analysis using a similar approach as the one used to investigate age effects showed no significant sex differences.
Diagnostic Criteria and Subgroups
Using previously established cut-off criteria (15, 100), each participant was assigned to one of four groups: the math disability (MD) group (participants who scored 25th percentile or lower on the WRAT3 Arithmetic subscale), the reading disability (RD) group (25th percentile or lower on the WRAT3 Arithmetic subscale), the comorbid math and reading disability (MDRD) group (25th percentile or lower on both WRAT3 subscales), and the typical achievement (TA) control group (higher than the 25th percentile on both WRAT3 subscales). The mean percentile scores for each group and mean age of the participants (on the day of testing) are reported in Table 1.
Three measures of socioeconomic status (SES)—education, occupation, and median income—were evaluated in the present study (reported in Table 1). To measure SES, we used the Kuppuswamy's socioeconomic ranking scale validated for urban communities (101). Each participant received a numerical rating between 1 and 7 for the highest level of education they had achieved by the day of testing (1 = elementary school certificate or currently enrolled, 2 = middle school certificate, 3 = secondary school diploma, 4 = some college/university or post-secondary diploma, 5 = college/university degree, 6 = graduate degree, 7 = professional degree). Each participant received an individual rating for their occupation status (1 = unemployed, 2 = unskilled worker, 3 = semi-skilled worker, 4 = skilled worker, 5 = clerical, shop-owner, farmer, 6 = semi-profession, 7 = profession). For the participants ages 16 and younger, the highest level of occupation status achieved by either one of their parents was used as a proxy for their own occupation rating. Median household income ratings were generated for each participant by the postal code of the home address that they provided on the day of testing (1 = $50,000 or less, 2 = $50,000–$60,000, 3 = $60,000–$70,000, 4 = $70,000–$80,000, 5 = $80,000–$90,000, 6 = $90,000 or more), based on most temporally proximal Canadian population census data (102). Preliminary one-way ANOVAs and Tukey post-hoc multiple comparisons were conducted to identify any between-group differences in the three SES measures. There were no significant between-group differences in occupation or median income rating. There was only a significant difference in mean education rating between the TA and RD groups (p = 0.007); as previously noted, this is explained by the lower average age of the RD group, when the contrast on mean education rating was run controlling for age this difference was no longer significant.
Statistical Analysis
The analysis involved two separate sets of tests for the first and second set of hypotheses (see section The Present Study: Research Questions, Design and Hypotheses). Relative to the first set of hypotheses, a two-way ANOVA was conducted for each of the seven psychoeducational tests, to assess just the interaction between math disability and reading disability across the four groups. The model followed a 2 × 2 factorial design, where the two between-subject factors were math disability (with two levels, math disability vs. no math disability) and reading disability (also two levels, reading disability vs. no reading disability). We followed the same procedures consolidated in previous studies on individuals with comorbid math and reading disabilities (74, 90) whereby, the interaction term serves as an indicator of the type of relationship between deficits in individuals with MDRD. A significant 2-way interaction between math disability and reading disability would indicate a synergistic or antagonistic relationship between math and reading disability—an over-additivity or under-additivity of deficits in domain-specific or domain-general cognitive processes. Main effects were irrelevant to the objectives of the study and are not considered, to avoid redundancy. Nonetheless, for rigor, they were counted in the correction for Type I error inflation due to multiple testing (see below). To assess the second set of hypotheses, one-way ANOVAs and post-hoc Tukey pairwise comparisons were used to analyze focused between-group differences in performance between TA, RD, MD, and MDRD groups, with each psychoeducational test measurement as dependent variable, and learning disability groups as levels of the independent variable/factor. This followed directly from the second set of hypotheses for this study.
To counteract Type I error inflation, we adopted the standard Bonferroni criterion; effects were deemed significant if p was below 0.00192; this corresponded to the p-value adjustment: 0.05/26 tests, which included all interaction and main effect tests of the two-way ANOVA as well as all one-way ANOVAs. Correspondingly, for the Tukey procedure, the same correction was applied to keep p-values below adjusted 0.05 level.
Systematic Review of the Neuroanatomical Correlates of Dyslexia-Dyscalculia Comorbidity
The protocol for this review followed the guidelines established by the Preferred Reporting Items for systematic Review and Meta-Analysis Protocols (103); a detailed checklist with inclusion/exclusion criteria, search terms, and methods is presented in Table 2.
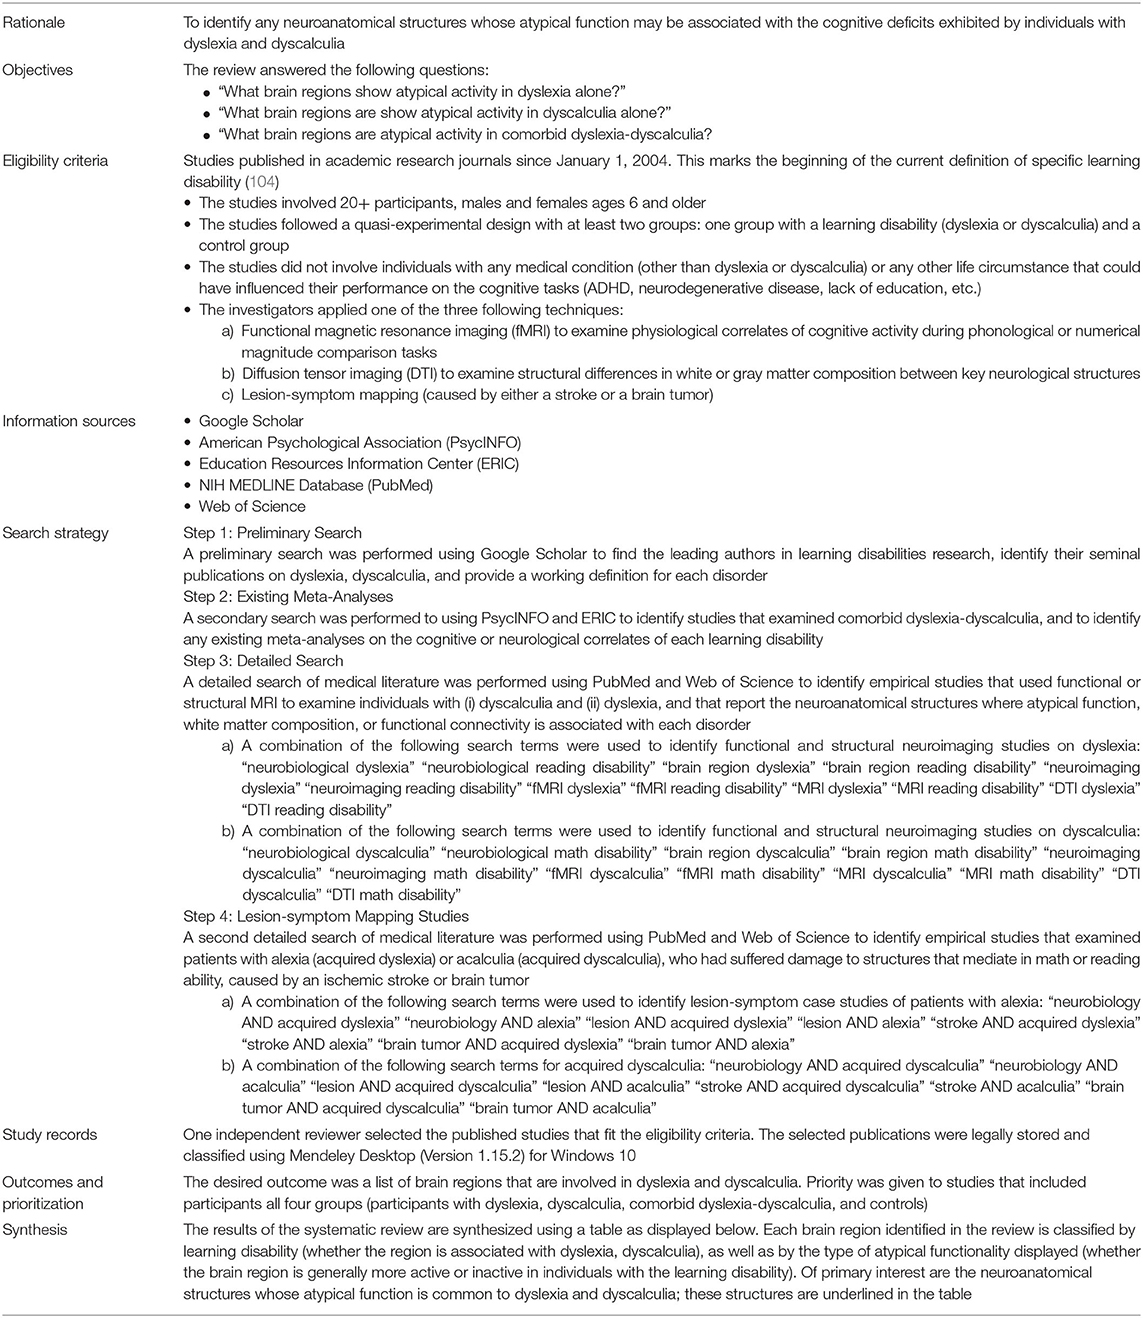
Table 2. PRISMA-P Protocol for Systematic Review (103).
The systematic review was performed in four stages. The first stage was a preliminary search to identify well-cited authors on math and reading disabilities and the avenues for future research using Google Scholar. The second stage of review provided working definitions of dyslexia and dyscalculia using PsycINFO and the Education Resources Information Center (ERIC). The third stage served to identify the neural correlates unique to dyslexia, the neural correlates unique to dyscalculia, and the neural correlates that are shared between the disorders. A detailed search of biomedical literature was performed to examine evidence from four types of studies: (i) functional neuroimaging studies, (ii) structural neuroimaging studies, (iii) functional connectivity studies, and (iv) lesion-symptom mapping studies. This stage of the review was conducted using literature available through the Web of Science and the National Center for Biotechnology Information (PubMed). The fourth and final stage of the review was initially conducted in April 2015 and identified 26 empirical studies met inclusion criteria. This stage of the review was repeated in April 2020 to add updated findings from the literature; 24 additional empirical studies were identified.
The functional neuroimaging studies included compared the brain physiology of people with and without dyslexia during reading tasks or compared the brain physiology of people with and without dyscalculia while they performed mathematical tasks. The structural neuroimaging compared the white and/or gray matter volume in specific neuroanatomic regions among people with dyslexia and/or among people with dyscalculia and normal controls. Similarly, the functional connectivity studies used the same types of comparisons applying MRI tractography in multiple neuroanatomic regions. To support the model with direct evidence, the searches also identified empirical clinical studies that examined patients with alexia (acquired dyslexia) or acalculia following traumatic brain injury.
Results
Tests of Phonological Processing
Mean scores on the tests of phonological processing (Rosner Auditory Analysis: RAA, Pseudowords: PW, Word Attack: WA) are shown in the panels of Figure 2. The results of the two-way ANOVA did not reveal a significant interaction between math disability and reading disability for any of these tasks (all F's < 2.89; p > 0.10, ≤ 0.01). The one-way ANOVA identified a significant effect of learning disability group on the mean scores of the RAA [F(3, 356) = 28.90, MSE = 2448.46, p < 0.0001, ηp2 = 0.196], PW [F(3, 356) = 39.28, MSE = 2067.86, p < 0.0001, ηp2 = 0.25], and WA [F(3, 356) = 49.92, MSE = 4528.74, p < 0.0001, ηp2 = 0.30]. For all three tasks, Tukey post-hoc multiple pairwise comparisons revealed a similar pattern of significant intergroup mean scores differences, showing TA > RD, and TA > MDRD (all p's < 0.01). For all other comparisons, RD = MD = MDRD (For more details see Note in Figure 2).
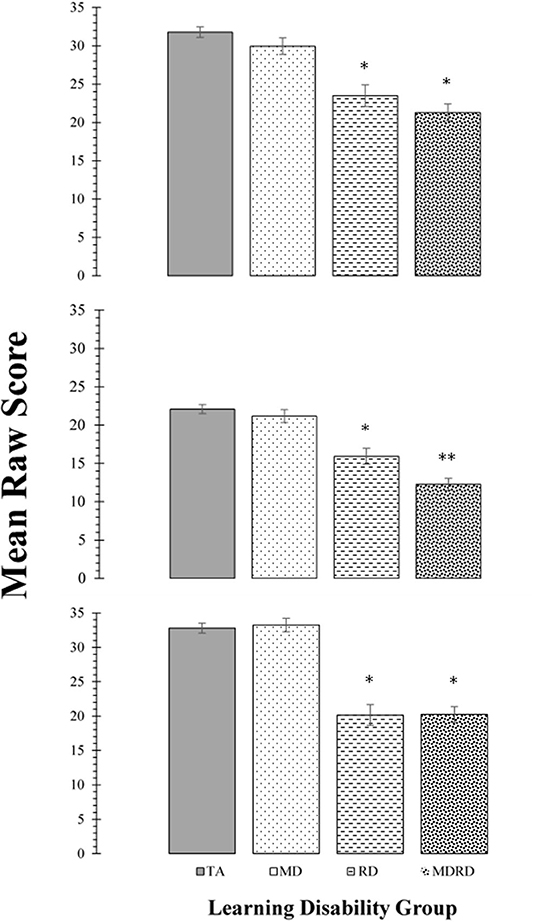
Figure 2. Top Panel: Mean scores for the Rosner Auditory Analysis task. Middle Panel: Mean scores for the Pseudowords Phoneme Deletion task Bottom Panel: Mean scores for the WRMT-R Word Attack subtest. For all panels, bars represent one standard errors. Asterisks summarize the results of post hoc Tukey test comparisons: “*” indicates a significant difference from the typical achievement (TA) control group at p < 0.05; “**” indicates a significant difference from the reading disability (RD) group at p < 0.05. TA > RD (Rosner Auditory Analysis: 8.29 [CI: 4.31 to 12.27]; Pseudowords: 6.15 [CI: 3.02 to 9.29]; Word Attack: 12.65 [CI: 8.53 to 16.76]; all p's < 0.01). TA > MDRD (Rosner Auditory Analysis: 7.30 [CI: 7.30 to 13.64]; Pseudowords: 9.84 [CI: 7.34 to 12.43]; Word Attack: 12.56 [CI: 9.27 to 15.84]; all p's < 0.01). For all other comparisons, RD = MD = MDRD.
The KeyMath Interpreting Data Subtest (Henceforth, KeyMath-ID)
Mean scores and standard errors for the KeyMath-ID are shown in Figure 3. The two-way ANOVA did not reveal a significant interaction between math disability and reading disability (F < 1, p = 0.73, ηp2 = 0.01). The one-way ANOVA identified a significant effect of learning disability group on the level of performance [F(3, 356) = 12.23, MSE = 238.550, p = 0.0001, ηp2 = 0.093]. Tukey comparisons revealed that the mean scores of the TA group were significantly higher than all other disability groups (TA> MD, TA > RD, and TA > MDRD (all p's < 0.05). However, there were no other significant differences among the mean scores of the groups of individuals with disabilities, that is, RD = MD = MDRD (For more details see Note in Figure 3).
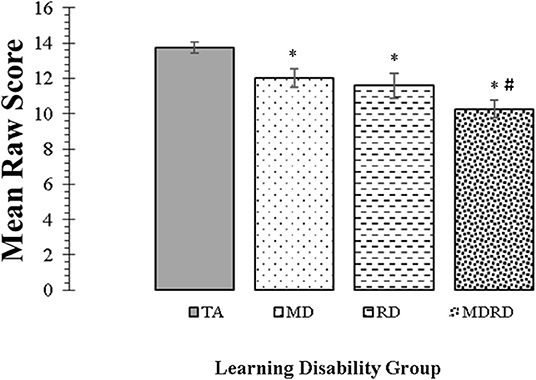
Figure 3. Mean scores for the KeyMath Interpreting Data subtest. Bars represent one standard errors. The symbol “*” indicates a significant difference from the typical achievement (TA) control group at p < 0.05 on post hoc Tukey test. The symbol “#” indicates a marginally significant trend at 0.05 <p < 0.10 on post hoc Tukey test. TA > MD (1.72, [CI: 0.07 to 3.36], p = 0.04). TA > RD (2.16, [CI: 0.25 to 4.07], p = 0.02). TA > MDRD (3.47, [CI: 1.95 to 4.99], p < 0.01). RD = MD. RD = MDRD. # MD > MDRD (1.75, [CI: −0.08 to 3.59], p = 0.068).
Tests of Intellectual Functioning
Mean scores on the tests of intellectual functioning (WAIS-R Vocabulary, Digit Span, and Block Design) are shown in the panels of Figure 4. The two-way ANOVA did not reveal a significant interaction on any of these subtests [F(1, 356) < 1.33, p > 0.25, ηp2 ≤ 0.02]. The one-way ANOVA identified a significant effect of learning disability group on the mean scores of the Vocabulary subtest [F(3, 356) = 50.14, MSE = 383.92, p < 0.0001, ηp2 = 0.30], the Block Design subtest [F(3, 356) = 24.23, MSE = 225.95, p < 0.0001, ηp2 = 0.17], and the Digit Span subtest [F(3, 356) = 37.75, MSE = 240.86, p < 0.0001, ηp2 = 0.24].
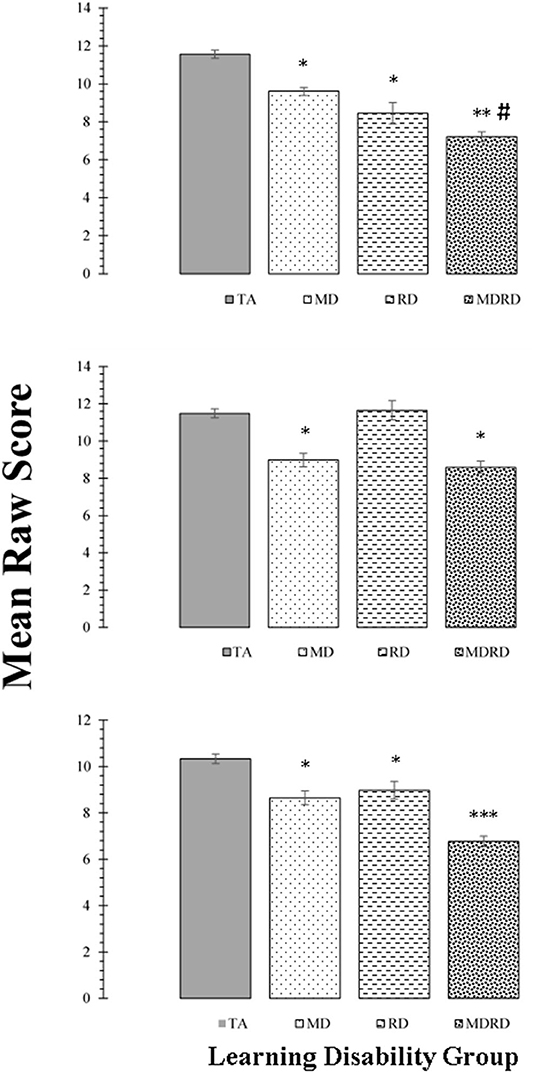
Figure 4. Top Panel: Mean scores for the WAIS-R Vocabulary subtest. Middle Panel: Mean scores for the WAIS-R Block Design subtest. Bottom Panel: Mean scores for the WAIS-R Digit Span subtest. For all panels, bars represent one standard errors. Asterisks summarize the results of post hoc Tukey test comparisons: “*” difference from the typical achievement (TA) control group at p < 0.05; “**” significant difference from the mathematical disability (MD) group at p < 0.05; “***” significant difference from the reading disability (RD) group at p < 0.05. The symbol “#” indicates a marginally significant trend at 0.05 < p < 0.10 on post hoc Tukey test. For the Vocabulary subtest: TA > MD (1.95, [CI: −0.92 to 2.98], p < 0.01); TA > RD (3.10, [CI: 1.90 to 4.30], p < 0.01); TA > MDRD (4.34, [CI: 3.39 to 5.29], p < 0.01). MD > MDRD (2.39, [CI: 2.39 to 3.54], p < 0.01). # RD > MDRD (1.24, [CI: −0.06 to 2.54], p = 0.069). For the Block Design subtest: TA > MD, (2.50, [CI: 1.36 to 3.64], p < 0.01); TA > MDRD (2.89, [CI: 1.84 to 3.94], p < 0.01). For the Digit Span subtest: TA > MD (1.68, [CI: 0.74 to 2.62], p < 0.01); TA > RD (1.36, [CI: 0.26 to 2.45], p = 0.01); TA > MDRD (3.57, [CI: 2.69 to 4.44], p < 0.01). MD > MDRD (1.88, [CI: 0.83 to 2.93], p < 0.01). RD > MDRD (2.21, [CI: 1.02 to 3.40], p < 0.01).
For the Vocabulary subtest, post-hoc tests showed that TA had higher mean scores than all the disability groups (TA > MD, TA > RD, and TA > MDRD (all p's < 0.01). The mean difference between MD and MDRD was also significant (p < 0.01). For the Block Design subtest, only the mean differences TA > MD, and TA > MDRD were significant (p < 0.01).
On the Digit Span subtest, TA had higher mean scores than all the disability groups (TA > MD, TA > RD, and TA > MDRD, all p's < 0.01). MDRD had significantly lower mean scores than MD and RD all p's < 0.01) (For more details see Note in Figure 4).
Systematic Review Report: Mapping Reading and Mathematical Disability Deficits to Neuroanatomical Correlates of Dyslexia and Dyscalculia
Table 3 lists all the studies recognized in the systematic review which identified neuroanatomical correlates of dyslexia and/or dyscalculia. It included studies published since 2004 which used either (a) functional neuroimaging to examine the cerebral blood oxygenation in individuals with dyslexia and dyscalculia, who performed during phonological or numerical magnitude tasks; (b) structural neuroimaging to examine white or gray matter tractography in individuals with dyslexia or dyscalculia; (c) lesion-symptom mapping in individuals who suddenly developed alexia (acquired dyslexia) or acalculia (acquired dyscalculia) after suffering a stroke or recovering from surgery to remove a brain tumor. The neuroanatomical correlates of dyslexia and the neuroanatomical correlates of dyscalculia are summarized in Table 4.
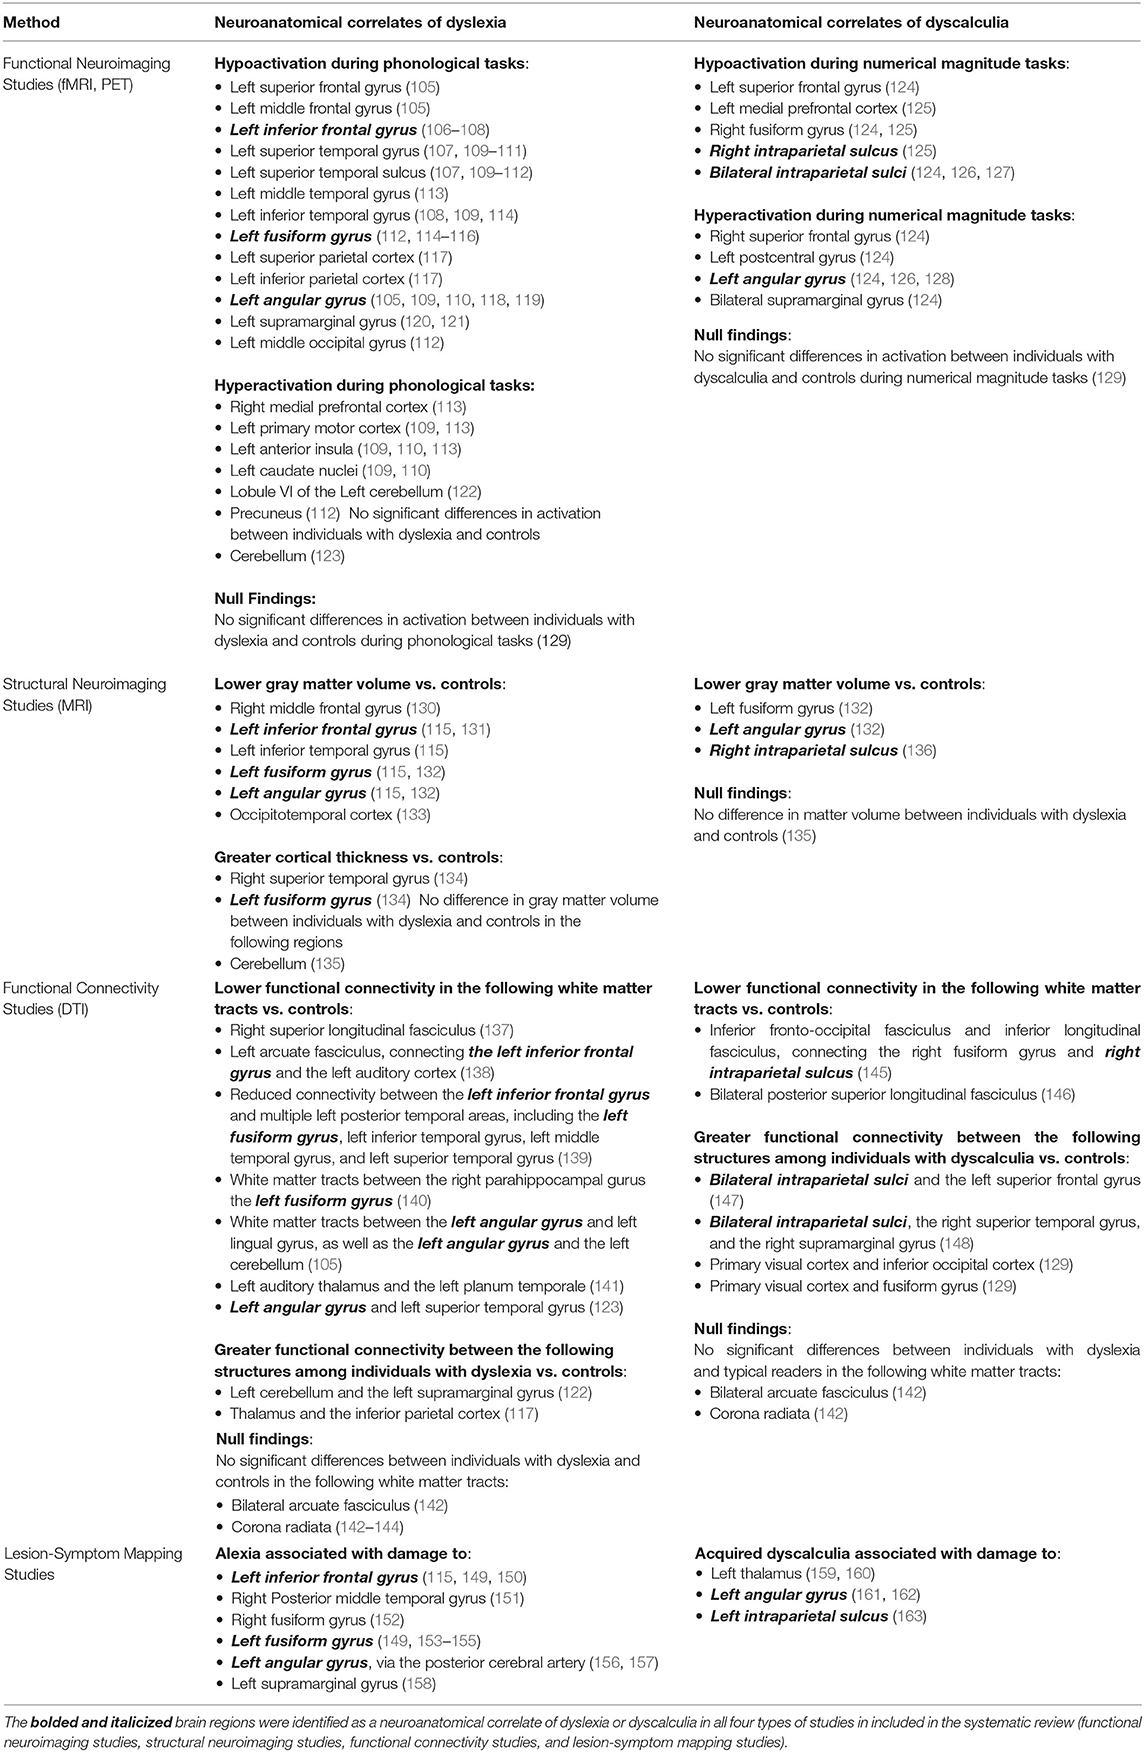
Table 3. Systematic review of the Neuroanatomical correlates of dyslexia and the neuroanatomic correlates of dyscalculia.
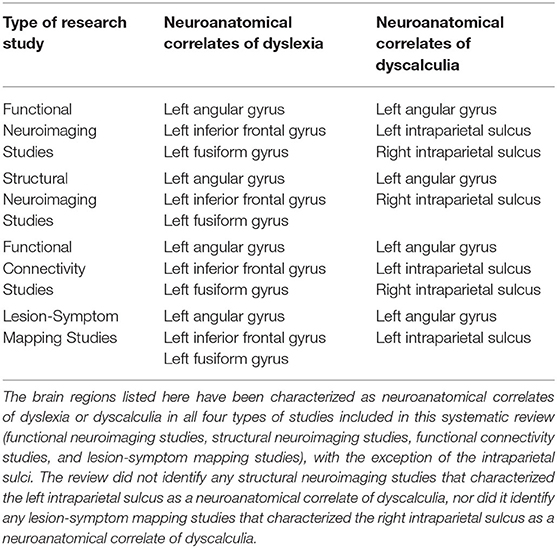
Table 4. Summary of the neuroanatomical correlates of dyslexia and the neuroanatomical correlates dyscalculia.
Neuroanatomical Correlates of Reading Disability Deficits in Dyslexia
The systematic review identified a total of 22 different brain regions whose dysfunction or abnormal development has been associated with impaired reading among individuals with dyslexia and/or alexia. Of those 22 brain regions, only three were identified as neuroanatomical correlates of reading disorders in all four types of research studies surveyed. That is, multiple functional neuroimaging, structural neuroimaging, functional connectivity, and lesion-symptom mapping studies revealed that abnormal activity or development in the left inferior frontal gyrus, the left fusiform gyrus and the left angular gyrus likely contribute to impaired reading.
Individuals with dyslexia exhibit less activation than normal readers at the left inferior frontal gyrus (106–108), left superior temporal gyrus (107, 109–111, 164), left fusiform gyrus (114, 115), and the left angular gyrus (109, 110, 118, 119) when performing the same phonological tasks used to assess in individuals with reading disabilities.
Structural neuroimaging studies have also shown that individuals with dyslexia exhibit reduced gray matter in the left inferior frontal gyrus, fusiform gyrus, and angular gyrus (115). Boets et al. (138) determined that normal readers store phonological representations of words in the left auditory cortex (Brodmann Area 41 and 42), and that a functional connection between the auditory cortex and the left inferior frontal gyrus allows normal readers to access these representations to read more fluently.
Boets and colleagues also used diffusion tensor imaging to show that the left arcuate fasciculus—the bundle of axons that connect the inferior frontal gyrus to the auditory cortex—has significantly lower white matter in individuals with dyslexia than in controls, while the structure of the auditory cortex itself was left intact. The authors suggested that individuals with dyslexia develop below average ready fluency in part due to impaired access to phonological representations of words—even words that they are familiar with, exactly as in individuals with reading disabilities. More recent studies have shown the that individuals with dyslexia exhibit lower functional activation than normal readers in the white matter tracts between the left angular gyrus and left lingual gyrus (105) as well as the tracts between the left angular gyrus and left superior temporal gyrus (123).
Finally, lesions to the left fusiform gyrus can result in alexia (50, 149, 153, 154) or from damage to the left posterior cerebral artery, which supplies blood to the left angular gyrus (156, 157). Lesions to the pars opercularis section (Brodmann area 44) of the left inferior frontal gyrus can cause alexia, primarily in the form of abrupt deficits in decoding pseudowords (115, 149), whereas lesions to the pars triangularis section (Brodmann area 45) are well-known cause in Broca's aphasia (46).
Neuroanatomical Correlates of Mathematical Disability Deficits in Dyscalculia
The systematic review identified a total of 17 different brain regions whose dysfunction or abnormal development has been linked to impaired mathematical cognition among individuals with dyscalculia and/or acalculia. Of these 17 brain regions, converging evidence from multiple sources of evidence suggests that there are only two key neurological structures whose dysfunction may produce distinct and pervasive difficulties with mathematical cognition in individuals with dyscalculia: the left angular gyrus and the bilateral intraparietal sulci.
Atypical hypoactivation at the right intraparietal sulcus and atypical hyperactivation at the left angular gyrus have been associated with specific aspects of impaired mathematical cognition in individuals with dyscalculia. Individuals with dyscalculia exhibit less activation than controls at the bilateral intraparietal sulci (124–127) when performing variants of the non-symbolic magnitude comparison tasks used to assess the quantitative reasoning skills of individuals with mathematical disabilities. They exhibit greater activation than controls at the left angular gyrus when performing these same magnitude comparison tasks (124, 126).
Few structural neuroimaging studies have investigated the neuroanatomical correlates of dyscalculia. There is some evidence, however, that individuals with dyscalculia exhibit lower gray matter volume than controls in the right intraparietal sulcus (136) as well as in the left fusiform gyrus and left angular gyrus (132).
Individuals with dyscalculia show lower functional connectivity than controls between the right intraparietal sulcus and the right fusiform gyrus (145), and between the parahippocampal gyrus and left fusiform gyrus (140). More recent evidence suggests that individuals with dyscalculia show greater functional connectivity than controls between the bilateral intraparietal sulci and the left superior frontal gyrus (147, 148) as well as between the primary visual cortex and the fusiform gyrus (129).
Finally, lesions to the left intraparietal sulcus (163) or to the left angular gyrus (161, 162) can produce symptoms of acquired dyscalculia. Furthermore, direct damage to left angular gyrus from strokes typically results in Gerstmann's syndrome, a disorder characterized by a sudden inability to write (agraphia), an inability to recognize ones' own fingers (finger agnosia), left-right disorientation, and a severe impairment performing mathematical tasks (165).
In summary, the evidence concerning the role of the intraparietal sulci is mixed. The bilateral intraparietal sulci have been reported as correlates of impaired mathematical cognition in multiple functional neuroimaging and functional connectivity studies. However, the right intraparietal sulcus alone has been linked to dyscalculia in structural neuroimaging studies, whereas the left intraparietal sulcus alone has been linked to acalculia in lesion-symptom mapping studies. The left angular gyrus is the only neuroanatomical structure where abnormalities in physiological activation, white matter volume, white matter tractography, and lesions have been consistently identified in individuals with dyscalculia and/or acalculia. Furthermore, the left angular gyrus is the only neuroanatomical structure identified in this systematic review whose dysfunction is also linked to impaired reading in people with dyslexia or alexia.
Discussion
The Cognitive Profiles of Mathematical Disability, Reading Disability, and Comorbid Math and Reading Disability
Table 5 presents a summary of the cognitive profiles of MD, RD, and MDRD participants in this study, organized by their psychoeducational domain. In the reading domain, the RD and MDRD groups demonstrated impaired phonological processing. Similarly, in the math domain, the MD and MDRD groups demonstrated impaired quantitative reasoning on the KeyMath-ID subtest. However, unexpectedly, the RD group also demonstrated a deficit in quantitative reasoning, equal in magnitude to the two math-disabled groups. In the domain-general tests, the MD and RD groups demonstrated impaired verbal semantic memory and working memory; the MD group also demonstrated impaired visuospatial reasoning. Meanwhile, the MDRD group demonstrated additional severe impairments in verbal semantic memory and working memory.
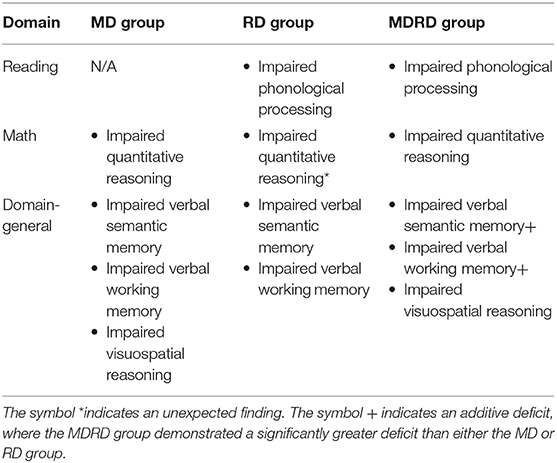
Table 5. The cognitive profiles of the MD, RD, and MDRD participants.
The Additive Hypothesis of Cognitive Deficits in Comorbid Math and Reading Disabilities
The present analysis did not reveal an interaction between reading disability and math disability on any of the tests used. Therefore, the results do not support a synergistic or the antagonistic deficit hypothesis, echoing previous findings from children (90) and adults (74). Instead, these results lend further support to the additive hypothesis of cognitive deficits: comorbid learning disabilities are the sum result of separate, specific, underlying cognitive deficits. Importantly, although cross-sectional, the results are similar in children and adult groups. A remaining issue is to understand the mixed bag of domain-specific or domain-general effects.
Domain-Specific Deficits in Comorbid Mathematical and Reading Disabilities
The contrast patterns determined in the univariate analysis only partially correspond with the domain-specific view of learning disabilities. On the three phonological tests, the RD and the MDRD participants both had lower performance scores than the TA participants, exhibiting a considerable and specific deficit in phonological processing. Meanwhile, the MD participants did not exhibit a phonological deficit. This result follows the well-established predictions from a long history of research in dyslexia; it has been shown for several decades that individuals with reading disabilities alone or comorbid reading-and-math disabilities consistently exhibit deficits in phonological processing, frequently making mistakes in applying phoneme-grapheme correspondence rules (28, 29, 31). It is this specific deficit in phonological processing that underlies poor word recognition, and thereby underlies poor reading fluency (6, 23). Consistent with the domain-specific hypothesis, both individuals with reading disabilities and those with the comorbid condition exhibited distinct impairments in phonological processing, but the impairment in individuals with comorbidity was no more severe than in individuals with single disabilities.
However, the results from the KeyMath-ID are not compatible with the domain-specific view of learning disabilities. Against the prediction of that view (70, 166), in our study individuals with reading disabilities showed significant deficits on tests of quantitative reasoning. The results do not support the additive hypothesis of cognitive deficits either, because the deficit demonstrated by the MDRD group did not equal the sum of the deficits in the MD and RD groups. A plausible account for the pattern of results is that successful completion of the KeyMath-ID relies on higher-level, general-domain skills such as verbal and linguistic reasoning (a conclusion supported by the fact that the KeyMath-ID correlates with tests such as the Kaufman Test of Educational Achievement, the Iowa Tests of Basic Skills, the Measures of Academic Progress test, and Group Math Assessment and Diagnostic Evaluation test).
It must be noted that the KeyMath-ID is not finely tuned enough to measure the very basic (“bottom-up”) mechanisms involved in numerical processing. Rather, it can validly identify shared linguistic, comprehension and reasoning deficits in comorbid mathematical and reading disabilities. We acknowledge the limitation in the completeness of our study, since performance on this subtest may not accurately reflect the role played by latent deficits in non-symbolic and symbolic numerical processing. However, despite these limitations, our findings clearly show all three learning disability groups demonstrated challenges in successfully solving the written word problems included in the KeyMath-ID. Importantly, a partial correlation analysis controlling for age and all demographic variables of our sample reveals a strong correlation with the WRAT-R arithmetic subtest (partial r = 0.78; p < 0.0001), indicating 60% of shared variance with the KeyMath-ID. In addition, cognitive research (167–169) has shown the WRAT arithmetic (which builds up from basic to progressively more complex numerical skills, i.e., from enumeration to pre-algebra) and more in general, arithmetic tasks, indeed tap onto symbolic quantitative skills, partially dependent on symbolic numerical processing [for critical discussion of these relationships, see (75, 78, 79)]. These converging elements therefore indicate, although indirectly, the plausible underlying constraint of number processing on the quantitative reasoning abilities we measured.
Domain-General Deficits in Comorbid Reading and Mathematical Disability
The contrast patterns determined in the univariate analysis of the WAIS-R/WISC-III, Block Design, Vocabulary, Digit Span subtests correspond to a greater extent with the domain-general view of specific learning disabilities. On the Block Design subtest, the MD and MDRD groups both performed far below the typical achievement level, suggesting that individuals with mathematical disabilities experience a pervasive deficit in visuospatial reasoning. When performing a test of visuospatial reasoning such as the Block Design task, the participants make visual approximations about a group of shapes and how they can be rearranged to match a two-dimensional geometric pattern. Such approximations may be negatively influenced by impaired access to the approximate number system—the cognitive mechanism that allows to make estimations about objects and other non-symbolic quantities, and manipulate them in mathematical operations (63). This cognitive system is persistently impaired in individuals with mathematical disabilities (68, 69) and is correlated with impaired perceptual reasoning skills (72). Particularly, neuroimaging studies using the Corsi Blocks task (a test of visuospatial pattern recognition) reported a strong correlation between deficits in visuospatial ability and math disability (73, 170).
In contrast to the MD group, the RD group did not demonstrate a deficit in visuospatial reasoning; remarkably, they scored higher on average than participants in typical achievement range. Individuals with reading disabilities have previously shown to match the performance of non-learning-disability participants on various iterations of this visuospatial reasoning task (44, 90). It has been proposed that reading-disabled individuals may compensate for deficits in phonological processing by relying on visuospatial reasoning to learn, recognize, and articulate words (42, 43). However, while RD individuals have consistently shown faster response times (but not greater accuracy) in identifying impossible figures and manipulate complex shapes with blocks, there is insufficient evidence that they possess an advantage in spatial processing (171).
The most noteworthy findings of the current study were obtained from the WAIS-R Vocabulary and Digit Span subtests. On the Vocabulary subtest, the MD group and the RD group performed at a statistically equivalent level; both groups scored significantly lower on average than the typical achievement range, implying that both groups experienced a specific difficulty in articulating age-appropriate word definitions. This was an unexpected finding for the MD group in particular; individuals with math disabilities are not known to demonstrate difficulty in word recognition, especially when tested with familiar words. The difficulty demonstrated by the RD group was also unexpected, because the Vocabulary subtest does not directly assess phonological processing. The participants did not need to read any of the items (they were read by a test administrator), nor were any of the words considered to be too irregular for their age-appropriate lexicon (the WISC included common words such as “clock,” or “alphabet”). Given that the between-group differences in education rating were insignificant and none of the participants had an estimated IQ within the clinically-critical range, these findings were unexpected.
It was originally hypothesized that individuals with comorbid math and reading disabilities would not exhibit additive deficits on the Vocabulary subtest because it does not exclusively assess domain-specific phonological processing or arithmetic abilities. The MDRD participants performed at an even lower level than both the MD and the RD group. While the mean difference between the RD and MDRD was marginally significant (p = 0.069), the difference in mean scaled scores between the TA and MDRD groups (4.34) was nearly the sum of the difference between the TA and MD groups (1.95) and the difference between the TA and RD groups (3.10), corresponding to the additive hypothesis. In stark contrast, the individual deficits shown by the MD and RD groups and the additive deficits exhibited by the MDRD group suggest that an impairment to some other domain-general cognitive system mediates their ability to articulate definitions of common words.
The groups' performances on the Digit Span subtest followed a similar pattern to the one seen for the Vocabulary subtest. The MD and RD groups performed at a statistically-even level—both groups significantly lower than the typical achievement range—indicating that these participants experienced a specific deficit in verbal working memory. Just as in the Vocabulary subtest, the MDRD group performed at even lower level on average than the single-disability groups. In support of the additive hypothesis, the mean difference in scores between the TA and MDRD groups (3.57) was slightly more than the sum of the difference between the TA and MD groups (1.68) and the difference between the TA and RD groups (1.57); as described in section The Cognitive Profiles of Mathematical Disability, Reading Disability, and Comorbid Math and Reading Disability, this over-additivity was not the result of a significant interaction between math disability and reading disability, and therefore does not fit the synergistic hypothesis. These results suggest that individuals with math disabilities or reading disabilities alone present a specific, persistent impairment to their verbal working memory system, and that this impairment is even more pronounced in individuals with comorbid math and reading disabilities in a manner that is both statistically and clinically significant.
The verbal working memory deficit reported in the RD and MDRD groups was consistent with evidence from previous studies; individuals with reading disabilities consistently demonstrate impaired working memory (33, 81, 172, 173). The deficit demonstrated by the MD group, however, was not expected. Previous investigations about the relationship between impaired mathematical cognition and impaired working memory have yielded mixed results. In some studies, individuals with math disabilities exhibit deficits in working memory only when performing tasks that assess working memory and visuospatial reasoning simultaneously (68, 170); the Block Design subtest we used does not test these constructs simultaneously, because the prompt remains visible to the participant at all times (thereby remaining accessible in the participant's short-term sensory memory).
In other studies, individuals with math disabilities do not exhibit any significant deficits relative to controls when performing forward or backward recall tasks (174); but when wider selection criteria are used to classify participants into control and MD groups (i.e., below the 30th percentile on a standardized arithmetic test), the MD participants lag behind controls on memory span (175, 176). Given this contradicting evidence, we did not expect that the MD participants in the current study would demonstrate a specific working memory impairment; instead, the MD group did demonstrate pervasive difficulties in performing the working memory task.
Furthermore, the MDRD group—who was expected to exhibit a working memory deficit as seen in individuals with dyslexia—performed significantly poorer than both the MD and RD groups. Reminiscent of the pattern seen on the WAIS-R Vocabulary subtest, the difference in mean scaled scores between the TA and MDRD groups (2.21) was approximately even to the combined sum of the difference between the TA and MD groups (1.88) and the difference between the TA and RD groups (0.83). This provides further support to the additive hypothesis. An additive working memory deficit in MDRD participants has been previously reported in adults (74).
In contrast, Landerl et al. (90) reported that children with a math disability or reading disability alone did not exhibit significant deficits in working memory, but those with comorbid math and reading disabilities did—only on the backward-recall trials (and not the forward-recall trials) of the WISC-III Digit Span subtest. They found a significant interaction between math disability and reading disability on the comorbid group's mean scores on the backward Digit Span subtest, a result they interpreted as supporting the synergistic deficit hypothesis, but one that was not replicated in the current study. While it is unlikely that a deficit in working memory is the mechanism that underlies all forms of impaired numerical magnitude processing (67), again, the current results show that such is the case in linguistically-mediated math disability, since two separate, independent impairments to numerical cognition and reading ability contribute to a persistent, severe working memory deficit unique to individuals with comorbid math and reading disabilities.
A Neuroeducational Model of Comorbid Mathematical and Reading Disabilities
The performance of the MDRD participants on the psychoeducational tasks in this study revealed two specific cognitive functions that are more severely impaired in comorbidity than in the single disability (see Bottom Panel of Figure 5). As expected, the MDRD group presented domain-specific deficits equal to those shown by the single-disability groups; their scores were on par with the RD group on two of the three phonological tasks, and also matched the performance of the MD group on the test of quantitative reasoning. More importantly, the MDRD participants exhibited domain-general deficits in verbal semantic memory and verbal working memory. In both the semantic memory task and the verbal working memory task, the magnitude of the MDRD group's deficit was approximately the sum of the separate deficits demonstrated by the MD and RD groups. These findings lend strong support to the additive deficit hypothesis of an independent math disability and an independent reading disability combined to produce a greater deficit in semantic memory and a larger deficit in working memory—deficits that were greater in magnitude than those observed in the participants with a single disability.
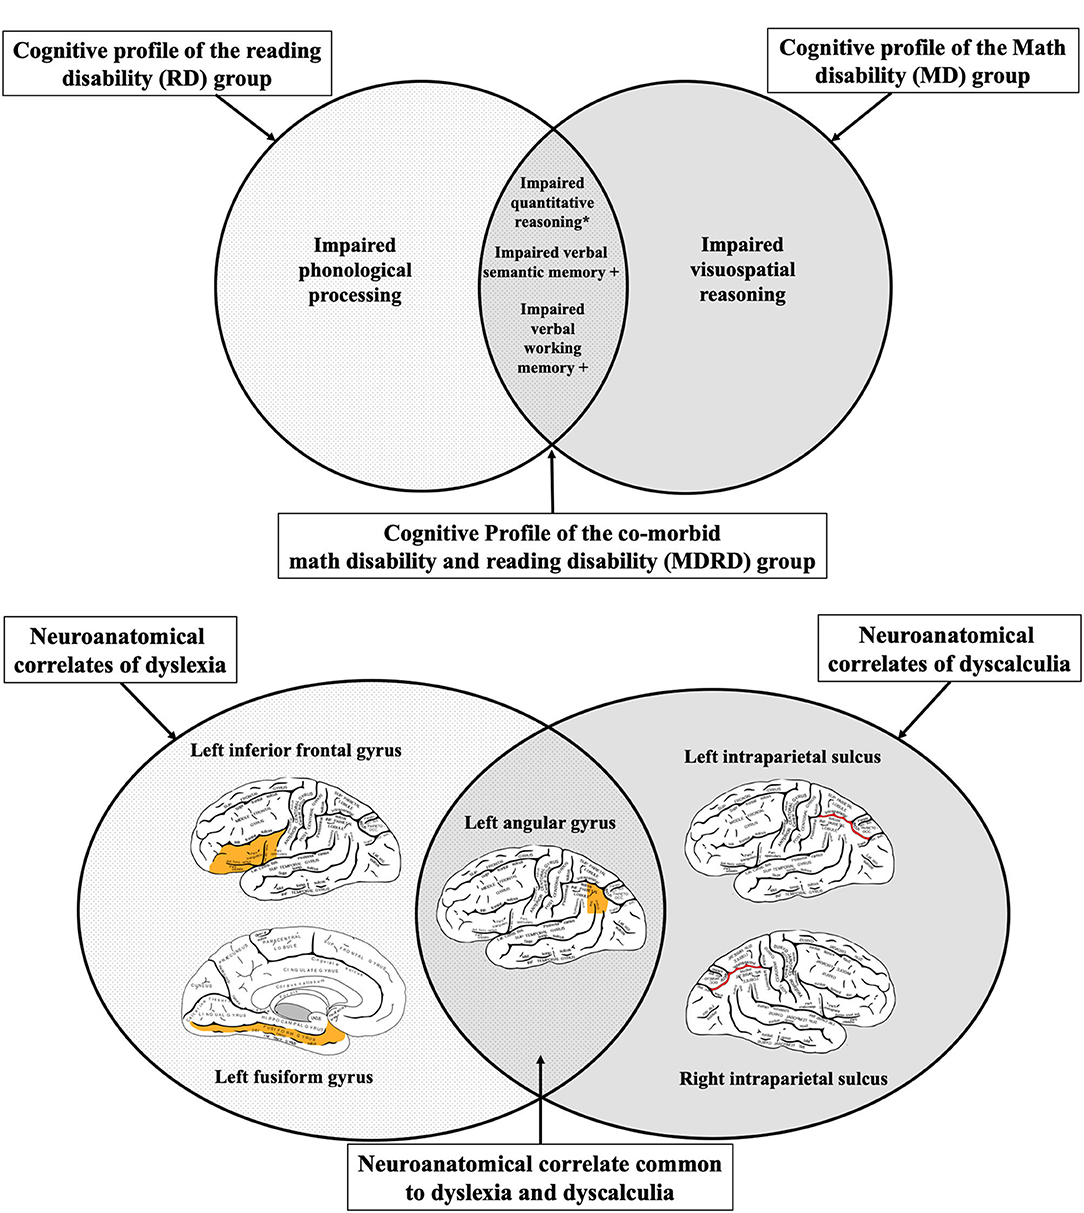
Figure 5. A neuroeducational hypothetical model of dyslexia-dyscalculia comorbidity. Top Panel: The neuroanatomical correlates of dyslexia and dyscalculia as determined by the systematic review. The left angular gyrus—a brain region where atypical physiological function has been reported in both individuals with dyslexia and individuals with dyscalculia. Bottom Panel: The cognitive profiles of individuals with reading disability (RD), math disability (MD), or comorbid math and reading disability (MDRD) in the current sample. The symbol “+” indicates an “additive deficit”, where the MDRD group demonstrated a significantly greater deficit than either the MD or RD group. The symbol “*” indicates an unexpected finding with novel implications for RD and MDRD; see Discussion. Brain diagrams were adapted from (45). Anatomy of the Human Body. Retrieved from https://www.bartleby.com/107/189.html.
The model proposed in Figure 5 suggests that the left angular gyrus may be the key neurological structure that mediates the cognitive deficits uniquely expressed in both math and reading disabilities in both children and adults (see Top Panel of Figure 5). Previous studies have shown that atypical function of the left and angular gyrus is associated with deficits in phonological processing, numerical cognition, and working memory—all of which were exhibited by the MDRD participants in the current study.
Five strands of evidence form the basis for this hypothesis. First, functional neuroimaging studies have consistently identified the left angular gyrus as a pivotal structure in mediating word recognition, word decoding, and reading comprehension in normal readers (110, 177, 178). Individuals with reading exhibit less activation than normal readers at the left angular gyrus during tasks that involve effortful word decoding (such as the Word Attack subtest in this study), and also show decreased activation during semantic processing of visual and auditory words (179–181). In comparison to controls, individuals with dyslexia show atypical hypoactivity at the left angular gyrus while performing phonological tasks (55, 56) as well in individuals with dyscalculia while performing tasks that test the approximate number system (84, 182). Second, lesions to the posterior cerebral artery (the blood supply of the left angular gyrus) produces symptoms of alexia (157), while lesions to the gyrus itself can produce acquired dyscalculia, alongside other symptoms of Gerstmann's syndrome (183).
Third, the left angular gyrus has been shown to mediate the two aspects of memory retrieval: the retrieval of phonetic representations of familiar words (138) and the retrieval of arithmetic facts (85). The latter demonstrates a contrast in the type of calculations which involve differentially the right and left hemisphere; the right intraparietal sulcus is associated with greater activation for processing inexact quantities for calculations involving the approximate number system, while the left angular gyrus and left intraparietal sulcus are involved in retrieving exact quantities for calculations that require a single exact solution. In addition, the left angular gyrus has shown low functional connectivity with the inferior frontal and left fusiform gyri during phonological processing tasks (177, 184).
Fourth, impairments to subcomponents of working memory can be mapped to the disruption frontal-lobe-to-parietal-lobe association fibers, converging on the left angular gyrus. According to Baddeley's model of Working Memory (185), a subcomponent of working memory called the phonological loop facilitates the short-term storage encoding verbal information into long-term memory. In Positron Emission Tomography (PET) studies with normal readers performing pseudowords tasks similar to the psychoeducational tests used here, researchers have shown that the angular gyrus is directly active in facilitating the short-term storage and retrieval of unfamiliar phonemic sequences (173, 186).
Lastly, applying TMS (Transcranial Magnetic Stimulation) to the left angular gyrus has been shown to increase the accuracy of semantic memory when pairing stimuli for classical conditioning (187), but can also cause deficits in visuospatial reasoning (mainly right-left disorientation). This collection of evidence from functional imaging, lesion-symptom analysis, and neuropsychology research provide valuable insight into the unique role of the left angular gyrus in mediating the cognitive deficits shared in math and reading disabilities.
The MDRD participants demonstrated additive domain-general deficits in verbal working memory and verbal semantic memory, which suggests a functional relationship between the verbal, expressive component of these deficits, and the retrieval of symbolic and semantic representations of words from long-term memory. A possible explanation is that a pervasive deficit to the verbal working memory system (specifically the phonological loop subcomponent in Baddeley's model) impairs both the short-term storage of basic verbal information and the retrieval of semantic information from long-term storage. The model shown in the Bottom Panel of Figure 5 proposes that a pervasive deficit in the temporary storage of verbal information is an additional core deficit unique to individuals with comorbid dyslexia-dyscalculia, associated with atypical function of the left angular gyrus.
Conclusions
In summary, converging evidence from neuroimaging and psychoeducational research suggests that impaired phonological, numerical, semantic, and working memory processes may be related to dysfunction of the left angular gyrus in individuals with dyslexia and individuals with dyscalculia. Individuals with dyslexia exhibit atypical hypoactivation at the inferior frontal gyrus when performing the same psychoeducational tests that are used to assess phonological processing deficits in individuals with reading disabilities. Individuals with dyslexia also exhibit atypical hypoactivation at the visual word form area of the left fusiform gyrus (located on the sagittal surface of the temporal lobe) when viewing written words, and consistently demonstrate impaired word recognition. These cognitive profiles are similar to those seen in the present study, where individuals with reading disabilities demonstrated significant deficits on tests of vocabulary and reading fluency. Similarly, individuals with dyscalculia exhibit atypical hypoactivation of the bilateral intraparietal sulci when performing numerical magnitude processing tasks, akin to the psychoeducational tests used to assess the function of the approximate number system in individuals with mathematical disabilities.
Multiple sources of evidence show that individuals with dyslexia and individuals with dyscalculia both exhibit dysfunction of the left angular gyrus. The left angular gyrus is the only neuroanatomical region where abnormalities in physiological activation, white matter volume, and white matter tractography have been reported among individuals with dyslexia and individuals with dyscalculia in functional neuroimaging, structural neuroimaging, and functional connectivity studies. Individuals with dyslexia exhibit atypical hypoactivation at the left angular gyrus when performing word definition recall tasks, demonstrating the same deficits in semantic memory that are seen in individuals with reading disabilities when performing the WAIS-R Vocabulary task. Individuals with dyscalculia exhibit atypical hyperactivation at the left angular gyrus when retrieving arithmetic facts, presenting similar difficulties as individuals with math disabilities when performing psychoeducational tests that assess basic math fluency. Furthermore, the left angular gyrus is the only neuroanatomical region where lesions have been identified in individuals with alexia as well as individuals with acalculia. The individuation of such area as the main overlapping brain structure associated with reading-math comorbidity makes sense anatomically since meta-analytic evidence suggests its role is to specifically associating language with other types of information and could be regarded as a language processing marginal area participating in an “extended Wernicke's area” or “Wernicke's system” (188).
Based on past and present evidence, we conclude that children and adults with comorbid math and reading disabilities demonstrate domain-specific deficits equivalent to single-disability individuals. However, individuals with comorbidity also demonstrate additive domain-general deficits in verbal working memory and verbal semantic memory. According to the evidence gained from the exhaustive review of the literature, the domain-specific reading deficits may correspond to developmental differences in the left inferior frontal and fusiform gyri, and mathematical deficits can be traced to developmental differences in the bilateral intraparietal sulci. The current model proposes that domain-general, additive deficits in semantic memory and verbal working memory—two pervasive impairments that are unique to neuropsychological profile of individuals with comorbid math and reading difficulties—may be the result of atypical development of the left angular gyrus.
Looking ahead, most recent advances in the emerging field of neuroimaging genetics have revealed bilateral interplay between genetic profile and neurological function and sometimes even a trilateral interaction between the latter and neuroanatomy. These studies have primarily focused on dyslexia (189–192), but similar evidence is also emerging for dyscalculia (193–195) and first evidence has appeared for their comorbidity (132). Although exhaustive review is beyond the scope and space of this paper (for very recent reviews see (193, 196), our model and research synthesis is complementary and could be further probed with neuroimaging genetics, specifically, in the pursuit of precise early detection of comorbid reading and math disability well before they emerge in formal educational settings. While genetic profile is insufficient to fully explain a complex condition such as dyslexia-dyscalculia comorbidity, some genetic constellations, or endophenotypes, can clearly help in early diagnosis (197). Because early intervention might be crucial to address this complex severe condition, genetics might be an instrument helping to close or at least narrow the diagnostic gap in the early years of life, before schooling. The present synthesis and model could be a starting point for the timely identification of reliable endophenotypes linked with early development of the angular gyrus and later psychoeducational diagnosis of reading-math disability comorbidity.
Data Availability Statement
The datasets generated for this study are available upon reasonable request in a form being coherent to all institutional, national and international ethical standards (e.g., anonymization), including intellectual property guidelines.
Ethics Statement
The studies involving human participants were reviewed and approved by Research Ethics Board of The University of British Columbia. Written informed consent to participate in this study was provided by the participants' legal guardian/next of kin.
Author Contributions
JG curated database, designed and conducted main analyses, and wrote the basis of the first draft. LS designed and led the prospective cohort study and database, obtained funding, and revised draft. AD'A collected data, helped design the study, helped with database curation and management, helped with data analysis, obtained further funding, oversaw writing of the final manuscript from first to final draft, and edited into final manuscript. All authors contributed to the article and approved the submitted version.
Funding
This research was funded through a NSERC discovery grant to LS and a SSHRC fellowship to AD'A. Parts of this manuscript were developed in partial fulfillment of JG's M.Sc. thesis at the Department of Neuroscience, Carleton University. JG is currently a doctoral candidate in the Department of Psychology at Wayne State University.
Conflict of Interest
The authors declare that the research was conducted in the absence of any commercial or financial relationships that could be construed as a potential conflict of interest.
Acknowledgments
We acknowledge Professors Hymie Anisman, Natalina Salmaso, Patrice Smith, Shawn Hayley and John Logan for valuable comments, and feedback on various preliminary versions of this work.
References
1. Craig MJ, Phillips M. Position Paper to Revise or Not to Revise : What is the DSM? LDAC Definition Learning Disabilities. Ottawa, ON. Learning Disabilities Association of Canada (2015). p. 1–30.
2. Tannock BR, Tannock R. DSM- 5 Changes in Diagnostic Criteria for Specific Learning Disabilities (SLD): What are the Implications? The International Dyslexia Association (2014).
3. Hulme C, Snowling MJ. Developmental Disorders of Language Learning and Cognition. Wiley (2009). Available online at: https://books.google.ca/books?id=vWMmAAAAQBAJ
4. Kail RV, Barnfield A. Children and Their Development, Third Canadian Edition. Pearson Education Canada (2014). Available online at: https://books.google.ca/books?id=zaTonQEACAAJ
5. Gersten R, Clarke B, Mazzocco MMM. Historical and contemporary perspectives on mathematical learning disabilities. In: Berch D, Mazzocco MM, editors. Why Is Math So Hard for Some Children. Baltimore, MD: Brookes Publishers (2007). p. 7–27.
6. Norton ES, Beach SD, De Gabrieli J. Neurobiology of dyslexia. Curr Opin Neurobiol. (2015) 30:73–8. doi: 10.1016/j.conb.2014.09.007
7. Silver CH, Blackburn LB, Arffa S, Barth JT, Bush SS, Koffler SP, et al. The importance of neuropsychological assessment for the evaluation of childhood learning disorders. NAN Policy and Planning Committee. Arch Clin Neuropsychol. (2006) 21:741–4. doi: 10.1016/j.acn.2006.08.006
8. Silver CH, Ruff RM, Iverson GL, Barth JT, Broshek DK, Bush SS, et al. Learning disabilities: the need for neuropsychological evaluation. Arch Clin Neuropsychol. (2008) 23:217–9. doi: 10.1016/j.acn.2007.09.006
9. Branum-Martin L, Fletcher JM, Stuebing KK. Classification and identification of reading and math disabilities: the special case of comorbidity. J Learn Disabil. (2012) 46:490–9. doi: 10.1177/0022219412468767
11. Poland SF, Thurlow ML, Ysseldyke JE, Mirkin PK. Current psychoeducational assessment and decision-making practices as reported by directors of special education. J Sch Psychol. (1983) 20:171–9. doi: 10.1016/0022-4405(82)90046-2
12. Sattler JM, Hoge RD. Assessment of Children: Behavioral, Social, and Clinical Foundations. La Mesa, CA: Publisher Inc. (2006).
13. Siegel LS. Perspectives on dyslexia. Paediatr Child Health. (2006) 11:581–7. doi: 10.1093/pch/11.9.581
14. Tanaka H, Black JM, Hulme C, Stanley LM, Kesler SR, Whitfield-Gabrieli S, et al. The brain basis of the phonological deficit in dyslexia is independent of IQ. Psychol Sci. (2011) 22:1442–51. doi: 10.1177/0956797611419521
15. D'Angiulli A, Siegel LS. Cognitive functioning as measured by the WISC-R: do children with learning disabilities have distinctive patterns of performance? J Learn Disabil. (2003) 36:48–58. doi: 10.1177/00222194030360010601
16. Shaywitz BA. The Neurobiology of Reading and Dyslexia. Focus on Basics. (2001). p. 11–15. Available online at: http://www.readinghorizons.com/research/dyslexia/neurobiology.aspx
17. Anderson M, Della Sala S. Neuroscience in Education: The Good, the Bad and the Ugly. Oxford: Oxford University Press (2012).
18. Ansari D, Coch D. Bridges over troubled waters: education and cognitive neuroscience. Trends Cogn Sci. (2016) 10:146–51. doi: 10.1016/j.tics.2006.02.007
19. Gabrieli JDE. Dyslexia: a new synergy between education and cognitive neuroscience. Science. (2009) 325:280–3. doi: 10.1126/science.1171999
20. Coch D, Ansari D. Thinking about mechanisms is crucial to connecting neuroscience and education. Cortex. (2009) 45:546–7. doi: 10.1016/j.cortex.2008.06.001
21. Howard-Jones P, Holmes W, Demetriou S, Jones C, Tanimoto E, Morgan O, et al. Neuroeducational research in the design and use of a learning technology. Learn Media Technol. (2015) 40:227–46. doi: 10.1080/17439884.2014.943237
22. Dickman GE, Lyon GR, Fletcher J, Shaywitz BA, Shaywitz SE, Fletcher JM, et al. Definition Consensus Project. International Dyslexia Association (2002). Available online at: http://eida.org/definition-consensus-project/
23. Lyon GR, Shaywitz SE, Catts H, Dickman E, Eden G, Fletcher J, et al. Defining dyslexia, comorbidity, teachers 'knowledge of language and reading a definition of dyslexia. Ann Dyslexia. (2003) 53:1–14. doi: 10.1007/s11881-003-0001-9
24. American Psychiatric Association. Diagnostic and Statistical Manual of Mental Disorders. Arlington, TX (2013).
25. Ramus F. Theories of developmental dyslexia: insights from a multiple case study of dyslexic adults. Brain. (2003) 126:841–65. doi: 10.1093/brain/awg076
26. Peterson RL, Pennington BF. Developmental dyslexia. Annu Rev Clin Psychol. (2015) 11:283–307. doi: 10.1146/annurev-clinpsy-032814-112842
27. Vellutino FR, Fletcher JM, Snowling MJ, Scanlon DM. Specific reading disability (dyslexia): what have we learned in the past four decades? J Child Psychol Psychiatry. (2004) 45:2–40. doi: 10.1046/j.0021-9630.2003.00305.x
29. Snowling MJ. Phonemic deficits in developmental dyslexia. Psychol Res. (1981) 43:219–34. doi: 10.1007/BF00309831
30. Felton RH. Early identification of children at risk for reading disabilities. Topics Early Child Spec Educ. (1992) 12:212–29. doi: 10.1177/027112149201200206
31. Ferrer E, Shaywitz BA, Holahan JM, Marchione KE, Michaels R, Shaywitz SE. Achievement gap in reading is present as early as first grade and persists through adolescence. J Pediatr. (2015) 167:1121–25.e2. doi: 10.1016/j.jpeds.2015.07.045
32. Felton RH, Naylor CE, Wood FB. Neuropsychological profile of adult dyslexics. Brain Lang. (1990) 39:485–97. doi: 10.1016/0093-934X(90)90157-C
33. Wilson AM, Lesaux NK. Persistence of phonological processing deficits in college students with dyslexia who have age-appropriate reading skills. J Learn Disabil. (2001) 34:394–400. doi: 10.1177/002221940103400501
34. Alexander AW, Andersen HG, Heilman PC, Voeller KKS, Torgesen JK. Phonological awareness training and remediation of analytic decoding deficits in a group of severe dyslexics. Ann Dyslexia. (1991) 41:193–206. doi: 10.1007/BF02648086
35. Ball EW, Blachman BA. Does phoneme awareness training in kindergarten make a difference in early word recognition and developmental spelling? Read Res Q. (1991) 26:49–66.
36. Wolf M, Bowers PG. The double-deficit hypothesis for the developmental dyslexias. J Educ Psychol. (1999) 91:415–38. doi: 10.1037/0022-0663.91.3.415
37. Nelson JM. Examination of the double-deficit hypothesis with adolescents and young adults with dyslexia. Ann Dyslexia. (2015) 65:159–177. doi: 10.1007/s11881-015-0105-z
38. Vukovic RK, Siegel LS. The double-deficit hypothesis: a comprehensive analysis of the evidence. J Learn Disabil. (2006) 39:25–47. doi: 10.1177/00222194060390010401
39. Eden GF, VanMeter JW, Rumsey JM, Zeffiro TA. The visual deficit theory of developmental dyslexia. Neuroimage. (1996) 4:S108–17. doi: 10.1006/nimg.1996.0061
40. Franceschini S, Gori S, Ruffino M, Pedrolli K, Facoetti A. A causal link between visual spatial attention and reading acquisition. Curr Biol. (2012) 22:814–9. doi: 10.1016/j.cub.2012.03.013
41. Olulade O, Napoliello E, Eden G. Abnormal visual motion processing is not a cause of dyslexia. Neuron. (2013) 79:180–90. doi: 10.1016/j.neuron.2013.05.002
42. Bacon AM, Handley SJ. Reasoning and dyslexia: is visual memory a compensatory resource? Dyslexia. (2014) 20:330–45. doi: 10.1002/dys.1483
43. Schneps MH, Rose LT, Fischer KW. Visual learning and the brain: implications for dyslexia. Mind Brain Educ. (2007) 1:128–39. doi: 10.1111/j.1751-228X.2007.00013.x
44. von Károlyi C, Winner E, Gray W, Sherman GF. Dyslexia linked to talent: global visual-spatial ability. Brain Lang. (2003) 85:427–31. doi: 10.1016/S0093-934X(03)00052-X
45. Gray H. Anatomy of the Human Body. Philadelphia, PA: Lea & Febiger (1918). Avaialble online at: www.bartleby.com/107/
46. Berker EA, Berker AH, Smith A. Translation of Broca's 1865 report. J Am Med Assoc Neurol. (1986) 43:1065–72. doi: 10.1001/archneur.1986.00520100069017
47. Burton MW, Small SL, Blumstein SE. The role of segmentation in phonological processing: an fMRI investigation. J Cogn Neurosci. (1997) 12:679–90. doi: 10.1162/089892900562309
48. Flinker A, Korzeniewska A, Shestyuk AY, Franaszczuk PJ, Dronkers NF, Knight RT, et al. Redefining the role of Broca's area in speech. Proc Natl Acad Sci USA. (2015) 112:2871–5. doi: 10.1073/pnas.1414491112
49. Dehaene S, Cohen L. The unique role of the visual word form area in reading. Trends Cogn Sci. (2016) 15:254–62. doi: 10.1016/j.tics.2011.04.003
50. Roberts DJ, Woollams AM, Kim E, Beeson PM, Rapcsak SZ, Lambon Ralph MA. Efficient visual object and word recognition relies on high spatial frequency coding in the left posterior fusiform gyrus: evidence from a case-series of patients with ventral occipito-temporal cortex damage. Cerebral Cortex. (2013) 23:2568–80. doi: 10.1093/cercor/bhs224
51. Graves WW, Binder JR, Desai RH, Conant LL, Seidenberg MS. Neural correlates of implicit and explicit combinatorial semantic processing. Neuroimage. (2010) 53:638–46. doi: 10.1016/j.neuroimage.2010.06.055
52. Shaywitz SE, Shaywitz BA. Paying attention to reading: the neurobiology of reading and dyslexia. Dev Psychopathol. (2008) 20:1329. doi: 10.1017/S0954579408000631
53. Richlan F. The functional neuroanatomy of developmental dyslexia across languages and writing systems. Front Psychol. (2020) 11:155. doi: 10.3389/fpsyg.2020.00155
54. Martin A, Kronbichler M, Richlan F. Dyslexic brain activation abnormalities in deep and shallow orthographies: a meta-analysis of 28 functional neuroimaging studies. Hum Brain Mapp. (2016) 37:2676–99. doi: 10.1002/hbm.23202
55. Richlan F, Kronbichler M, Wimmer H. Functional abnormalities in the dyslexic brain: a quantitative meta-analysis of neuroimaging studies. Hum Brain Mapp. (2009) 30:3299–308. doi: 10.1002/hbm.20752
56. Turkeltaub PE, Eden GF, Maisog JM, Einbinder ER, Flowers DL, Turkeltaub PE, et al. A meta-analysis of functional neuroimaging studies of dyslexia. Ann N Y Acad Sci. (2008) 1145:237–59. doi: 10.1196/annals.1416.024
57. Price GR, Ansari D. Dyscalculia : characteristics, causes, and treatments. Numeracy Adv Educ Quant Lit. (2013) 6:2. doi: 10.5038/1936-4660.6.1.2
58. Shalev RS, Auerbach J, Manor O, Gross-Tsur V. Developmental dyscalculia: prevalence and prognosis. Eur Child Adolesc Psychiatry. (2000) 9:S58–64. doi: 10.1007/s007870070009
59. Wilson AJ. About Dyscalculia. (2012). Available online at: http://www.aboutdyscalculia.org/dyscalculiamain.html
60. Ashkenazi S, Black J. M, Abrams D. a, Hoeft F., Menon V. (2013). Neurobiological underpinnings of math and reading learning disabilities. J. Learn. Disabil. 46, 549–69. doi: 10.1177/0022219413483174
61. Mann Koepke K, Miller B. At the intersection of math and reading disabilities: introduction to the special issue. J Learn Disabil. (2013) 46:483–9. doi: 10.1177/0022219413498200
62. Wagner RK, Zirps FA, Edwards AA, Wood SG, Joyner RE, Becker BJ, et al. The prevalence of dyslexia: a new approach to its estimation. J Learn Disabil. (2020) 53:354–65. doi: 10.1177/0022219420920377
64. Berch DB, Geary DC, Koepke KM. Introduction: language and culture in mathematical cognitive development. In: Berch D, Geary D, Koepke KM, editors. Language and Culture in Mathematical Cognition. Amsterdam: Elsevier Academic Press (2018). p. 1–29.
65. Rousselle L, Noël M-P. Basic numerical skills in children with mathematics learning disabilities: a comparison of symbolic vs non-symbolic number magnitude processing. Cognition. (2007) 102:361–95. doi: 10.1016/j.cognition.2006.01.005
66. Dehaene S. The Number Sense: How the Mind Creates Mathematics. New York, NY: Oxford University Press (1997). doi: 10.2307/2589308
67. Wilson, A. J., and Dehaene S. Number sense and developmental dyscalculia. In: Fischer W, Dawson G, Coch D, editors. Human Behavior, Learning, and the Developing Brain: Atypical Development. The Guilford Press (2007). p. 212–38.
68. Bugden S, Ansari D. Probing the nature of deficits in the “approximate number system” in children with persistent developmental dyscalculia. Dev Sci. (2015) 19:817–33. doi: 10.1111/desc.12324
69. Butterworth B. Foundational numerical capacities and the origins of dyscalculia. Trends Cogn Sci. (2010) 14:534–41. doi: 10.1016/j.tics.2010.09.007
70. Landerl K, Bevan A, Butterworth B. Developmental dyscalculia and basic numerical capacities: a study of 8-9-year-old students. Cognition. (2004) 93:99–125. doi: 10.1016/j.cognition.2003.11.004
71. Mazzocco MMM, Feigenson L, Halberda J. Impaired acuity of the approximate number system underlies mathematical learning disability (Dyscalculia). Child Dev. (2011) 82:1224–37. doi: 10.1111/j.1467-8624.2011.01608.x
72. Szucs D, Devine A, Soltesz F, Nobes A, Gabriel F. Developmental dyscalculia is related to visuo-spatial memory and inhibition impairment. Cortex. (2013) 49:2674–88. doi: 10.1016/j.cortex.2013.06.007
73. Zago L, Pesenti M, Mellet E, Crivello F, Mazoyer B, Tzourio-Mazoyer N. Neural correlates of simple and complex mental calculation. Neuroimage. (2001) 13:314–27. doi: 10.1006/nimg.2000.0697
74. Wilson AJ, Andrewes SG, Struthers H, Rowe VM, Bogdanovic R, Waldie KE. Dyscalculia and dyslexia in adults: cognitive bases of comorbidity. Learn Individ Differ. (2015) 37:118–32. doi: 10.1016/j.lindif.2014.11.017
75. Núñez RE. Is there really an evolved capacity for number? Trends Cogn Sci. (2017) 21:409–24. doi: 10.1016/j.tics.2017.03.005
76. Wilkey ED, Ansari D. Challenging the neurobiological link between number sense and symbolic numerical abilities. Ann N Y Acad Sci. (2020) 1464:76–98. doi: 10.1111/nyas.14225
77. Carey S. Where our number concepts come from. J Philos. (2009) 106:220–54. doi: 10.5840/jphil2009106418
78. Reynvoet B, Sasanguie D. The symbol grounding problem revisited: a thorough evaluation of the ANS mapping account and the proposal of an alternative account based on symbol-symbol associations. Front Psychol. (2016) 7:1581. doi: 10.3389/fpsyg.2016.01581
79. Schneider M, Beeres K, Coban L, Merz S, Susan Schmidt S, Stricker J, et al. Associations of non-symbolic and symbolic numerical magnitude processing with mathematical competence: a meta-analysis. Dev Sci. (2017) 20:e12372. doi: 10.1111/desc.12372
80. Chinn S, Ashcroft R. Dyscalculia, dyslexia and mathematics. In: Chinn S, Ashcroft RE, editors. Mathematics for Dyslexics and Dyscalculics. West Sussex: John Wiley & Sons, Ltd. (2016). p. 1–22.
81. Peters L, Bulthé J, Daniels N, Op de Beeck H, De Smedt B. Dyscalculia and dyslexia: Different behavioral, yet similar brain activity profiles during arithmetic. Neuroimage Clin. (2018) 18:663–74. doi: 10.1016/j.nicl.2018.03.003
82. Menon V. Arithmetic in the child and adult brain. In: Kadosh RC, Dowker A, editors. The Oxford Handbook of Numerical Cognition. Oxford: Oxford University Press (2015). p. 502–30.
83. Molko N, Cachia A, Rivière D, Mangin JF, Bruandet M, Le Bihan D, et al. Functional and structural alterations of the intraparietal sulcus in a developmental dyscalculia of genetic origin. Neuron. (2003) 40:847–58. doi: 10.1016/S0896-6273(03)00670-6
84. Dehaene S, Piazza M, Pinel P, Cohen L. Three parietal circuits for number processing. Cogn Neuropsychol. (2003) 20:487–506. doi: 10.1080/02643290244000239
85. Grabner RH, Ansari D, Koschutnig K, Reishofer G, Ebner F, Neuper C. To retrieve or to calculate? Left angular gyrus mediates the retrieval of arithmetic facts during problem solving. Neuropsychologia. (2009) 47:604–8. doi: 10.1016/j.neuropsychologia.2008.10.013
86. Price GR, Palmer D, Battista C, Ansari D. Nonsymbolic numerical magnitude comparison: Reliability and validity of different task variants and outcome measures, and their relationship to arithmetic achievement in adults. Acta Psychol. (2012) 140:50–7. doi: 10.1016/j.actpsy.2012.02.008
87. Cappelletti M, Barth H, Fregni F, Spelke ES, Pascual-Leone A. rTMS over the intraparietal sulcus disrupts numerosity processing. Exp Brain Res. (2007) 179:631–42. doi: 10.1007/s00221-006-0820-0
88. Cohen Kadosh R, Cohen Kadosh K, Schuhmann T, Kaas A, Goebel R, Henik A, et al. Virtual dyscalculia induced by parietal-lobe TMS impairs automatic magnitude processing. Curr Biol. (2007) 17:689–93. doi: 10.1016/j.cub.2007.02.056
89. Willburger E, Fussenegger B, Moll K, Wood G, Landerl K. Naming speed in dyslexia and dyscalculia. Learn Individ Differ. (2008) 18:224–36. doi: 10.1016/j.lindif.2008.01.003
90. Landerl K, Fussenegger B, Moll K, Willburger E. Dyslexia and dyscalculia: two learning disorders with different cognitive profiles. J Exp Child Psychol. (2009) 103:309–24. doi: 10.1016/j.jecp.2009.03.006
91. Moll K, Göbel SM, Gooch D, Landerl K, Snowling MJ. Cognitive risk factors for specific learning disorder: processing speed, temporal processing, and working memory. J Learn Disabil. (2014) 49:272–81. doi: 10.1177/0022219414547221
92. Slot EM, van Viersen S, de Bree EH, Kroesbergen EH. Shared and unique risk factors underlying mathematical disability and reading and spelling disability. Front Psychol. (2016) 7:803. doi: 10.3389/fpsyg.2016.00803
93. Raddatz J, Kuhn J-T, Holling H, Moll K, Dobel C. Comorbidity of arithmetic and reading disorder: basic number processing and calculation in children with learning impairments. J Learn Disabil. (2016) 50:298–308. doi: 10.1177/0022219415620899
94. Leplin J. The role of models in theory construction BT - scientific discovery, logic, and rationality. In: Nickles T, editor. Scientific Discovery, Logic, and Rationality Dordrecht: Springer Netherlands (1980). pp. 267–83. doi: 10.1007/978-94-009-8986-3_12
95. Woodcock RW. Woodcock Reading Mastery Tests, Revised. Circle Pines, MN: American Guidance Service (1987).
97. Wechsler D. WAIS-R Manual: Wechsler Adult Intelligence Scale-Revised. New York, NY: Psychological Corporation (1981).
98. Wechsler D. WISC-III: Wechsler Intelligence Scale for Children: Manual. New York, NY: Psychological Corporation (1991)
99. Deb S, Thomas M, Bright C. Mental disorder in adults with intellectual disability. 1: Prevalence of functional psychiatric illness among a community-based population aged between 16 and 64 years. J Intel Disab. Res. (2001) 45:495–505. doi: 10.1046/j.1365-2788.2001.00374.x
100. D'Angiulli A, Siegel LS, Maggi S. Literacy instruction, SES, and word-reading achievement in english-language learners and children with english as a first language: a longitudinal study. Learn Disab Res Pract. (2004) 19:202–13. doi: 10.1111/j.1540-5826.2004.00106
101. Bairwa M, Rajput M, Sachdeva S. Modified Kuppuswamy's socioeconomic scale: social researcher should include updated income criteria, 2012. Indian J Commun Med. (2013) 38:185–6. doi: 10.4103/0970-0218.116358
102. Cain P. Income by Postal Code: Mapping Canada's Richest and Poorest Neighbourhoods. Global News (2013). Available online at: http://globalnews.ca/news/370804/income-by-postal-code/
103. Moher D, Shamseer L, Clarke M, Ghersi D, Liberati A, Petticrew M, et al. Preferred reporting items for systematic review and meta-analysis protocols (PRISMA-P) 2015 statement. Syst Rev. (2015) 4:1. doi: 10.1186/2046-4053-4-1
104. Turnbull H, Huerta N, Stowe M. The Individuals With Disabilities Education Act as Amended in 2004. Boston, MA: Pearson Education, Inc. (2004).
105. Yang Y, Yang YH, Li J, Xu M, Bi H-Y. An audiovisual integration deficit underlies reading failure in nontransparent writing systems: an fMRI study of Chinese children with dyslexia. J Neurolinguistics. (2020) 54:100884. doi: 10.1016/j.jneuroling.2019.100884
106. Booth JR, Bebko G, Burman DD, Bitan T. Children with reading disorder show modality independent brain abnormalities during semantic tasks. Neuropsychologia. (2007) 45:775–83. doi: 10.1016/j.neuropsychologia.2006.08.015
107. Brambati SM, Termine C, Ruffino M, Danna M, Lanzi G, Stella G, et al. Neuropsychological deficits and neural dysfunction in familial dyslexia. Brain Res. (2006) 1113:174–85. doi: 10.1016/j.brainres.2006.06.099
108. Cao F, Bitan T, Chou T-L, Burman DD, Booth JR. Deficient orthographic and phonological representations in children with dyslexia revealed by brain activation patterns. J Child Psychol Psychiatry. (2006) 47:1041–50. doi: 10.1111/j.1469-7610.2006.01684.x
109. Kronbichler M, Hutzler F, Staffen W, Mair A, Ladurner G, Wimmer H. Evidence for a dysfunction of left posterior reading areas in German dyslexic readers. Neuropsychologia. (2006) 44:1822–32. doi: 10.1016/j.neuropsychologia.2006.03.010
110. Meyler A, Keller TA, Cherkassky VL, Lee D, Hoeft F, Whitfield-Gabrieli S, et al. Brain activation during sentence comprehension among good and poor readers. Cerebral Cortex. (2007) 17:2780–7. doi: 10.1093/cercor/bhm006
111. Ye Z, Rüsseler J, Gerth I, Münte TF. Audiovisual speech integration in the superior temporal region is dysfunctional in dyslexia. Neuroscience. (2017) 356:1–10. doi: 10.1016/j.neuroscience.2017.05.017
112. Rüsseler J, Ye Z, Gerth I, Szycik GR, Münte TF. Audio-visual speech perception in adult readers with dyslexia: an fMRI study. Brain Imaging Behav. (2018) 12:357–68. doi: 10.1007/s11682-017-9694-y
113. Grunling C, Ligges M, Huonker R, Klingert M, Mentzel H-J, Rzanny R, et al. Dyslexia: the possible benefit of multimodal integration of fMRI- and EEG-data. J Neural Trans. (2004) 111:951–69. doi: 10.1007/s00702-004-0117-z
114. McCrory EJ, Mechelli A, Frith U, Price CJ. More than words: a common neural basis for reading and naming deficits in developmental dyslexia? Brain. (2005) 128(Pt 2):261–7. doi: 10.1093/brain/awh340
115. Kronbichler M, Wimmer H, Staffen W, Hutzler F, Mair A, Ladurner G. Developmental dyslexia: gray matter abnormalities in the occipitotemporal cortex. Hum Brain Mapp. (2008) 29:613–25. doi: 10.1002/hbm.20425
116. Langer N, Benjamin C, Minas J, Gaab N. The neural correlates of reading fluency deficits in children. Cerebral Cortex. (2015) 25:1441–53. doi: 10.1093/cercor/bht330
117. Paz-Alonso PM, Oliver M, Lerma-Usabiaga G, Caballero-Gaudes C, Quiñones I, Suárez-Coalla P, et al. Neural correlates of phonological, orthographic and semantic reading processing in dyslexia. Neuroimage Clin. (2018) 20:433–47. doi: 10.1016/j.nicl.2018.08.018
118. Hoeft F, Hernandez A, McMillon G, Taylor-Hill H, Martindale JL, Meyler A, et al. Neural basis of dyslexia: a comparison between dyslexic and nondyslexic children equated for reading ability. J Neurosci. (2006) 26:10700–8. doi: 10.1523/JNEUROSCI.4931-05.2006
119. Schulz E, Maurer U, van der Mark S, Bucher K, Brem S, Martin E, et al. Impaired semantic processing during sentence reading in children with dyslexia: combined fMRI and ERP evidence. Neuroimage. (2008) 41:153–68. doi: 10.1016/j.neuroimage.2008.02.012
120. Francisco AA, Takashima A, McQueen JM, van den Bunt M, Jesse A, Groen MA. Adult dyslexic readers benefit less from visual input during audiovisual speech processing: fMRI evidence. Neuropsychologia. (2018) 117:454–71. doi: 10.1016/j.neuropsychologia.2018.07.009
121. Hancock R, Gabrieli JDE, Hoeft F. Shared temporoparietal dysfunction in dyslexia and typical readers with discrepantly high IQ. Trends Neurosci Educ. (2016) 5:173–7. doi: 10.1016/j.tine.2016.10.001
122. Feng X, Li L, Zhang M, Yang X, Tian M, Xie W, et al. Dyslexic children show atypical cerebellar activation and cerebro-cerebellar functional connectivity in orthographic and phonological processing. Cerebellum. (2017) 16:496–507. doi: 10.1007/s12311-016-0829-2
123. Ashburn SM, Flowers DL, Napoliello EM, Eden GF. Cerebellar function in children with and without dyslexia during single word processing. Hum Brain Mapp. (2020) 41:120–38. doi: 10.1002/hbm.24792
124. Kaufmann L, Vogel SE, Starke M, Kremser C, Schocke M, Wood G. Developmental dyscalculia: compensatory mechanisms in left intraparietal regions in response to nonsymbolic magnitudes. Behav Brain Funct. (2009) 5:1–6. doi: 10.1186/1744-9081-5-35
125. Price GR, Holloway I, Rasanen P, Vesterinen M, Ansari D. Impaired parietal magnitude processing in developmental dyscalculia. Curr Biol. (2007) 17:1042–3. doi: 10.1016/j.cub.2007.10.013
126. Kucian K, Loenneker T, Dietrich T, Dosch M, Martin E, von Aster M. Impaired neural networks for approximate calculation in dyscalculic children: a functional MRI study. Behav Brain Funct. (2006) 2:31. doi: 10.1186/1744-9081-2-31
127. Mussolin C, De Volder A, Grandin CC, Schlogel X, Nassogne M-CM-C, Noel M-P, et al. Neural correlates of symbolic number comparison in developmental dyscalculia. J Cogn Neurosci. (2010) 22:860–74. doi: 10.1162/jocn.2009.21237
128. Dinkel PJ, Willmes K, Krinzinger H, Konrad K, Koten JW Jr. Diagnosing developmental dyscalculia on the basis of reliable single case FMRI methods: promises and limitations. PLoS ONE. (2013) 8:e83722. doi: 10.1371/journal.pone.0083722
129. Bulthé J, Prinsen J, Vanderauwera J, Duyck S, Daniels N, Gillebert CR, et al. Multi-method brain imaging reveals impaired representations of number as well as altered connectivity in adults with dyscalculia. Neuroimage. (2019) 190:289–302. doi: 10.1016/j.neuroimage.2018.06.012
130. Krafnick AJ, Flowers DL, Luetje MM, Napoliello EM, Eden GF, Carolina N. An investigation into the origin of anatomical differences in dyslexia. J Neurosci. (2014) 34:901–8. doi: 10.1523/JNEUROSCI.2092-13.2013
131. Richards TL, Grabowski TJ, Boord P, Yagle K, Askren M, Mestre Z, et al. Contrasting brain patterns of writing-related DTI parameters, fMRI connectivity, and DTI–fMRI connectivity correlations in children with and without dysgraphia or dyslexia. Neuroimage Clin. (2015) 8:408–21. doi: 10.1016/j.nicl.2015.03.018
132. Ulfarsson MO, Walters GB, Gustafsson O, Steinberg S, Silva A, Doyle OM, et al. 15q11.2 CNV affects cognitive, structural and functional correlates of dyslexia and dyscalculia. Transl Psychiatry. (2017) 7:e1109. doi: 10.1038/tp.2017.77
133. Adrián-Ventura J, Soriano-Ferrer M, Fuentes-Claramonte P, Morte-Soriano M, Parcet MA, Ávila C. Grey matter reduction in the occipitotemporal cortex in Spanish children with dyslexia: A voxel-based morphometry study. J Neurolinguistics. (2020) 53:100873. doi: 10.1016/j.jneuroling.2019.100873
134. Ma Y, Koyama MS, Milham MP, Castellanos FX, Quinn BT, Pardoe H, et al. Cortical thickness abnormalities associated with dyslexia, independent of remediation status. Neuroimage Clin. (2014) 7:177–86. doi: 10.1016/j.nicl.2014.11.005
135. van Oers, C. A. M. M., Goldberg N, Fiorin G, van den Heuvel MP, Kappelle LJ, et al. No evidence for cerebellar abnormality in adults with developmental dyslexia. Exp Brain Res. (2018) 236:2991–3001. doi: 10.1007/s00221-018-5351-y
136. Rotzer S, Kucian K, Martin E, Aster M, Von Klaver P, Loenneker T. Optimized voxel-based morphometry in children with developmental dyscalculia. Neuroimage. (2008) 39:417–22. doi: 10.1016/j.neuroimage.2007.08.045
137. Zhao J. Altered hemispheric lateralization of white matter pathways in developmental dyslexia: evidence from spherical deconvolution tractography. Cortex. (2016) 76:51–62. doi: 10.1016/j.cortex.2015.12.004
138. Boets B, Op de Beeck HP, Vandermosten M, Scott SK, Gillebert CR, Mantini D, et al. Intact but less accessible phonetic representations in adults with dyslexia. Science. (2013) 342:1251–4. doi: 10.1126/science.1244333
139. Schurz M, Wimmer H, Richlan F, Ludersdorfer P, Klackl J, Kronbichler M. Resting-state and task-based functional brain connectivity in developmental dyslexia. Cerebral Cortex. (2015) 25:3502–14. doi: 10.1093/cercor/bhu184
140. Skeide MA, Evans TM, Mei EZ, Abrams DA, Menon V. Neural signatures of co-occurring reading and mathematical difficulties. Dev Sci. (2018) 21:e12680. doi: 10.1111/desc.12680
141. Tschentscher N, Ruisinger A, Blank H, Díaz B, von Kriegstein K. Reduced structural connectivity between left auditory thalamus and the motion-sensitive planum temporale in developmental dyslexia. J Neurosci. (2019) 39:1720–32. doi: 10.1523/JNEUROSCI.1435-18.2018
142. Moreau D, Wilson AJ, McKay NS, Nihill K, Waldie KE. No evidence for systematic white matter correlates of dyslexia and dyscalculia. Neuroimage Clin. (2018) 18:356–66. doi: 10.1016/j.nicl.2018.02.004
143. Vandermosten M, Boets B, Poelmans H, Sunaert S, Wouters J, Ghesquière P. A tractography study in dyslexia: neuroanatomic correlates of orthographic, phonological and speech processing. Brain. (2012) 135:935–48. doi: 10.1093/brain/awr363
144. Yeatman JD, Dougherty RF, Rykhlevskaia E, Sherbondy AJ, Deutsch GK, Wandell BA, et al. Anatomical properties of the arcuate fasciculus predict phonological and reading skills in children. J Cogn Neurosci. (2011) 23:3304–17. doi: 10.1162/jocn_a_00061
145. Rykhlevskaia E, Uddin LQ, Kondos L, Menon V. Neuroanatomical correlates of developmental dyscalculia: combined evidence from morphometry and tractography. Front Hum Neurosci. (2009) 3:51. doi: 10.3389/neuro.09.051.2009
146. Kucian K, Ashkenazi SS, Hänggi J, Rotzer S, Jäncke L, Martin E, et al. Developmental dyscalculia: a dysconnection syndrome? Brain Struct Funct. (2014) 219:1721–33. doi: 10.1007/s00429-013-0597-4
147. Baars MA, Nije Bijvank M, Tonnaer GH, Jolles J. Self-report measures of executive functioning are a determinant of academic performance in first-year students at a university of applied sciences. Front Psychol. (2015) 6:1131. doi: 10.3389/fpsyg.2015.01131
148. Jolles D, Ashkenazi S, Kochalka J, Evans T, Richardson J, Rosenberg-Lee M, et al. Parietal hyper-connectivity, aberrant brain organization, and circuit-based biomarkers in children with mathematical disabilities. Dev Sci. (2016) 19:613–31. doi: 10.1111/desc.12399
149. Ripamonti E, Aggujaro S, Molteni F, Zonca G, Frustaci M, Luzzatti C. The anatomical foundations of acquired reading disorders: a neuropsychological verification of the dual-route model of reading. Brain Lang. (2014) 134:44–67. doi: 10.1016/j.bandl.2014.04.001
150. Shinoura N, Onodera T, Kurokawa K, Tsukada M, Yamada R, Tabei Y, et al. Damage to the upper portion of area 19 and the deep white matter in the left inferior parietal lobe, including the superior longitudinal fasciculus, results in alexia with agraphia. Eur Neurol. (2010) 64:224–9. doi: 10.1159/000318175
151. Binder JR, Pillay SB, Humphries CJ, Gross WL, Graves WW, Book DS. Surface errors without semantic impairment in acquired dyslexia: a voxel-based lesion-symptom mapping study. Brain. (2016) 139(Pt. 5):1517–26. doi: 10.1093/brain/aww029
152. Lesniak M, Soluch P, Stepien U, Czepiel W, Seniow J. Pure alexia after damage to the right fusiform gyrus in a right-handed male. Neurol Neurochir Pol. (2014) 48:373–7. doi: 10.1016/j.pjnns.2014.09.003
153. Leff AP, Spitsyna G, Plant GT, Wise RJS. Structural anatomy of pure and hemianopic alexia. J Neurol Neurosurg Psychiatr. (2006) 77:1004–7. doi: 10.1136/jnnp.2005.086983
154. Turkeltaub PE, Goldberg EM, Postman-Caucheteux WA, Palovcak M, Quinn C, Cantor C, et al. Alexia due to ischemic stroke of the visual word form area. Neurocase. (2014) 20:230–5. doi: 10.1080/13554794.2013.770873
155. Michel F. [Alexia without agraphia: an exemplary deficit, cherished by neuropsychologists]. Rev Neurol. (2008) 164:S73–6. doi: 10.1016/S0035-3787(08)73294-6
156. Maeshima S, Osawa A, Sujino K, Fukuoka T, Deguchi I, Tanahashi N. Pure alexia caused by separate lesions of the splenium and optic radiation. J Neurol. (2011) 258:223–6. doi: 10.1007/s00415-010-5723-0
157. Sharma B, Handa R, Prakash S, Nagpal K, Bhana I, Gupta PK, et al. Posterior cerebral artery stroke presenting as alexia without agraphia. Am J Emerg Med. (2014) 32:1553.e3–4. doi: 10.1016/j.ajem.2014.04.046
158. Aguilar OM, Kerry SJ, Crinion JT, Callaghan MF, Woodhead ZVJ, Leff AP. Dorsal and ventral visual stream contributions to preserved reading ability in patients with central alexia. Cortex. (2018) 106:200–12. doi: 10.1016/j.cortex.2018.06.003
159. Jensen MB. The accountant who lost arithmetic: a case report of acalculia with a left thalamic lesion. J Med Cases. (2010) 1, 92–3. doi: 10.4021/jmc61w
160. Osawa A, Maeshima S. Gerstmann's syndrome in a patient with left thalamic hemorrhage. Neurology Asia. (2009) 14:161–4.
161. Bhattacharyya S, Cai X, Klein JP. Dyscalculia, dysgraphia, and left-right confusion from a left posterior peri-insular infarct. Behav Neurol. (2014) 2014:823591. doi: 10.1155/2014/823591
162. Ripellino P, Terazzi E, Mittino D, Cantello R. Clinical presentation of left angular gyrus ischaemic lesion: finger agnosia, acalculia, agraphia, left–right disorientation and episodic autoscopia. BMJ Case Rep. (2013) 2013:bcr2013009332. doi: 10.1136/bcr-2013-009332
163. Mendez MF, Moheb N, Desarzant RE, Teng EH. The progressive acalculia presentation of parietal variant Alzheimer's disease. J Alzheimer's Dis. (2018) 63:941–8. doi: 10.3233/JAD-180024
164. Glezer LS, Jiang X, Luetje MM, Napoliello EM, Kim J, Riesenhuber M, et al. An fMRI-adaptation study of phonological and orthographic selectivity to written words in adults with poor reading skills. Brain Lang. (2019) 191:1–8. doi: 10.1016/j.bandl.2019.01.002
165. Zukic S, Mrkonjic Z, Sinanovic O, Vidovic M, Kojic B. Gerstmann's syndrome in acute stroke patients. Acta Inform Med. (2012) 20:242–3. doi: 10.5455/aim.2012.20.242-243
166. Shalev RS. Developmental dyscalculia. J Child Neurol. (2004) 19:765–71. doi: 10.1177/08830738040190100601
167. Chen Q, Li J. Association between individual differences in non-symbolic number acuity and math performance: a meta-analysis. Acta Psychol. (2014) 148:163–72. doi: 10.1016/j.actpsy.2014.01.016
168. Gómez-Velázquez FR, Berumen G, González-Garrido AA. Comparisons of numerical magnitudes in children with different levels of mathematical achievement. An ERP study. Brain Res. (2015) 1627:189–200. doi: 10.1016/j.brainres.2015.09.009
169. Price GR, Fuchs LS. The mediating relation between symbolic and nonsymbolic foundations of math competence. PLoS ONE. (2016) 11:e0148981. doi: 10.1371/journal.pone.0148981
170. Kyttälä M, Lehto JE. Some factors underlying mathematical performance: the role of visuospatial working memoryand non-verbal intelligence. Eur J Psychol Educ. (2008) 23:1–19. doi: 10.1007/BF03173141
171. Gilger JW, Allen K, Castillo A. Brain and cognition reading disability and enhanced dynamic spatial reasoning : a review of the literature q. Brain Cogn. (2016) 105:55–65. doi: 10.1016/j.bandc.2016.03.005
172. Swanson HL, Howard CB, Sáez L. Do different components of working memory underlie different subgroups of reading disabilities? J Learn Disabil. (2006) 39:252–69. doi: 10.1177/00222194060390030501
173. Vasic N, Lohr C, Steinbrink C, Martin C, Wolf RC. Neural correlates of working memory performance in adolescents and young adults with dyslexia. Neuropsychologia. (2008) 46:640–8. doi: 10.1016/j.neuropsychologia.2007.09.002
174. Mammarella IC, Hill F, Devine A, Caviola S, Szucs D. Math anxiety and developmental dyscalculia: a study on working memory processes. J Clin Exp Neuropsychol. (2015) 37:878–87. doi: 10.1080/13803395.2015.1066759
175. Geary DC, Hoard MK, Hamson CO. Numerical and arithmetical cognition: patterns of functions and deficits in children at risk for a mathematical disability. J Exp Child Psychol. (1999) 74:213–39. doi: 10.1006/jecp.1999.2515
176. Passolunghi MC, Siegel LS. Working memory and access to numerical information in children with disability in mathematics. J Exp Child Psychol. (2004) 88:348–67. doi: 10.1016/j.jecp.2004.04.002
177. Horwitz B, Rumsey JM, Donohue BC. Functional connectivity of the angular gyrus in normal reading and dyslexia. Proc Natl Acad Sci USA. (1998) 95:8939–44.
178. Pugh KR, Mencl WE, Shaywitz BA, Shaywitz SE, Fulbright RK, Constable RT, et al. The Angular gyrus in developmental dyslexia: task-specific differences in functional connectivity within posterior cortex. Psychol. Sci. (2000) 11:51–6. doi: 10.1111/1467-9280.00214
179. Binder JR, Desai RH, Graves WW, Conant LL. Where is the semantic system? A critical review and meta-analysis of 120 functional neuroimaging studies. Cereb Cortex. (2009) 19:2767–96. doi: 10.1093/cercor/bhp055
180. Démonet JF, Chollet F, Ramsay S, Cardebat D, Nespoulous J-L, Wise R, et al. The anatomy of phonological and semantic processing in normal subjects. Brain. (1992) 115:1753–68. doi: 10.1093/brain/115.6.1753
181. Vandenberghe R, Price C, Wise R, Josephs O, Frackowiak RSJ. Functional anatomy of a common semantic system for words and pictures. Nature. (1996) 383:254–6. doi: 10.1038/383254a0
182. Price GA. Numerical magnitude representation in developmental dyscalculia: behavioural and brain imaging studies. In: Kartinenen J, Olsbo P, Tynkkynen, M-L, editors. Jyväskylä Studies in Education, Psychology and Social Research. Jyväskylä: University of Jyväskylä (2008).
183. Nagaratnam N, Phan TA, Barnett C, Ibrahim N. Angular gyrus syndrome mimicking depressive pseudodementia. J Psychiatry Neurosci. (2002) 27:364–8.
184. Pugh KR, Einar Mencl W, Jenner AR, Katz L, Frost SJ, Lee Ren J, et al. Functional neuroimaging studies of reading and reading disability (developmental dyslexia). Mental Retard Dev Disabil Res Rev. (2000) 6:207–13. doi: 10.1002/1098-2779(2000)6:3 <207::AID-MRDD8>3.0.CO;2-P
185. Baddeley AD, Hitch G. Working memory. Psychol Learn Motivat. (1974) 8:47–89. doi: 10.1016/S0079-7421(08)60452-1
186. Jonides J, Schumacher EH, Smith EE, Koeppe RA, Awh E, Reuter-Lorenz PA, et al. The role of parietal cortex in verbal working memory 298. J Neurosci. (1998) 18:5026–34. doi: 10.1523/JNEUROSCI.18-13-05026.1998
187. Davey J, Cornelissen PL, Thompson HE, Sonkusare S, Hallam G, Smallwood J, et al. Automatic and controlled semantic retrieval: TMS reveals distinct contributions of posterior middle temporal gyrus and angular gyrus. J Neurosci. (2015) 35:15230–9. doi: 10.1523/JNEUROSCI.4705-14.2015
188. Ardila A, Bernal B, Rosselli M. How localized are language brain areas? A review of brodmann areas involvement in oral language. Arch Clin Neuropsychol. (2015) 31:112–22. doi: 10.1093/arclin/acv081
189. Kraft I, Cafiero R, Schaadt G, Brauer J, Neef NE, Müller B, et al. Cortical differences in preliterate children at familiar risk of dyslexia are similar to those observed in dyslexic readers. Brain. (2015) 138:e378. doi: 10.1093/brain/awv036
190. Kraft I, Schreiber J, Cafiero R, Metere R, Schaadt G, Brauer J, et al. Predicting early signs of dyslexia at a preliterate age by combining behavioral assessment with structural MRI. Neuroimage. (2016) 143:378–86. doi: 10.1016/j.neuroimage.2016.09.004
191. Neef NE, Müller B, Liebig J, Schaadt G, Grigutsch M, Gunter TC, et al. Dyslexia risk gene relates to representation of sound in the auditory brainstem. Dev Cogn Neurosci. (2017) 24:63–71. doi: 10.1016/j.dcn.2017.01.008
192. Skeide MA, Kirsten H, Kraft I, Schaadt G, Müller B, Neef N, et al. Genetic dyslexia risk variant is related to neural connectivity patterns underlying phonological awareness in children. Neuroimage. (2015) 118:414–21. doi: 10.1016/j.neuroimage.2015.06.024
193. Carvalho MRS, Haase VG. Genetics of dyscalculia 1. In: Fritz A, Haase VG, Räsänen P, editors. Search of Genes BT - International Handbook of Mathematical Learning Difficulties: From the Laboratory to the Classroom. Cham: Springer International Publishing (2019). pp. 329–43.
194. Kuhl U, Neef NE, Kraft I, Schaadt G, Dörr L, Brauer J, et al. The emergence of dyslexia in the developing brain. Neuroimage. (2020) 211:116633. doi: 10.1016/j.neuroimage.2020.116633
195. Skeide MA, Kraft I, Müller B, Schaadt G, Neef NE, Brauer J, et al. NRSN1 associated grey matter volume of the visual word form area reveals dyslexia before school. Brain. (2016) 139:2792–803. doi: 10.1093/brain/aww153
196. Landi N, Perdue MV. Neuroimaging genetics studies of specific reading disability and developmental language disorder: a review. Lang Linguist Compass. (2019) 13:e12349. doi: 10.1111/lnc3.12349
Keywords: reading and mathematical disability, comorbidity, dyslexia, dyscalculia, psychoeducational testing, neuroimaging, developmental learning disabilities
Citation: Grant JG, Siegel LS and D'Angiulli A (2020) From Schools to Scans: A Neuroeducational Approach to Comorbid Math and Reading Disabilities. Front. Public Health 8:469. doi: 10.3389/fpubh.2020.00469
Received: 09 November 2019; Accepted: 24 July 2020;
Published: 22 October 2020.
Edited by:
Frederick Robert Carrick, University of Central Florida College of Medicine, United StatesReviewed by:
Johannes Boltze, University of Warwick, United KingdomKarin Landerl, University of Graz, Austria
Copyright © 2020 Grant, Siegel and D'Angiulli. This is an open-access article distributed under the terms of the Creative Commons Attribution License (CC BY). The use, distribution or reproduction in other forums is permitted, provided the original author(s) and the copyright owner(s) are credited and that the original publication in this journal is cited, in accordance with accepted academic practice. No use, distribution or reproduction is permitted which does not comply with these terms.
*Correspondence: Amedeo D'Angiulli, YW1lZGVvLmRhbmdpdWxsaUBjYXJsZXRvbi5jYQ==
†These authors share senior authorship