 Masashi Kiguchi1*
 Stephanie Sutoko1
 Hirokazu Atsumori1
 Ayako Nishimura1
 Akiko Obata1
 Tsukasa Funane1
 Hiromitsu Nakagawa2
 Masashi Egi2
 Hiroyuki Kuriyama3
- 1Center for Exploratory Research, Hitachi, Ltd., Kokubunji, Japan
- 2Center for Technology Innovation, Hitachi, Ltd., Kokubunji, Japan
- 3Global Center for Social Innovation, Hitachi, Ltd., Kokubunji, Japan
We have developed a system with multimodality that monitors objective biomarkers for screening the mental distress in the office. A field study using a prototype of the system was performed over four months with 39 volunteers. We obtained PC operation patterns using a PC logger, sleeping time and activity levels using a wrist-band-type activity tracker, and brain activity and behavior data during a working memory task using optical topography. We also administered two standard questionnaires: the Brief Job Stress Questionnaire (BJS) and the Kessler 6 scale (K6). Supervised machine learning and cross validation were performed. The objective variables were mental scores obtained from the questionnaires and the explanatory variables were the biomarkers obtained from the modalities. Multiple linear regression models for mental scores were comprehensively searched and the optimum models were selected from 2,619,785 candidates. Each mental score estimated with each optimum model was well correlated with each mental score obtained with the questionnaire (correlation coefficient = 0.6–0.8) within a 24% of estimation error. Mental scores obtained by means of questionnaires have been in general use in mental health care for a while, so our multimodality system is potentially useful for mental healthcare due to the quantitative agreement on the mental scores estimated with biomarkers and the mental scores obtained with questionnaires.
Introduction
Mental disorders are of significant concern in terms of not only public health but also economic development and social welfare (1). Depression affects over 120 million people and causes long absences from work and increased risk of suicide. Organization for Economic Co-operation and Development (OECD) reported that mild-to-moderate mental disorders affect around 20% of the working-age population in the average OECD country and predominantly include highly treatable disorders such as anxiety and depression. Although treating depression in primary care is feasible and very cost-effective, studies have shown that 56.3% of patients do not get sufficient care (2). Furthermore, U.S. workers suffering from depression cost employers an additional 31 billion dollars each year in lost productive time (3). A key management issue facing enterprises today is ensuring that they prevent depression, support the return to work, and prevent recurrence. Many companies have services for managing employees' mental condition, such as the employee assistance program (EAP)1. Because the mental distress is a risk factor of depression, early detection of risk factors could be exploited for prevention purposes. Therefore, the accurate and low-cost monitoring of mental condition is required for screening distress in office.
Information and Communication Technology (ICT) and Internet of Things (IoT) have the potential to provide a low-cost condition monitoring system with high accuracy for mental healthcare. Especially, the mental distress levels observed using questionnaires are widely used for screening. A variety of devices for monitoring mental stress have already been developed (4). We previously developed a PC logger, a wrist-band type activity tracker, and a wearable optical topography as a non-invasive brain activity sensor. These have been independently used in several studies on mental healthcare application. The fractal dimensions obtained from the PC logger data are expected to be related with mood states (5). The usage of the wrist-band type activity tracker for judgments of reinstatement reduced the ratio of re-leave (6). The brain activity measured by optical topography during working memory tasks was affected by mood state (7–9). The optical topography measurement was applied to return-to-work trainees in remission of mental disorders with depressive symptoms (10). In this paper, we introduce a multimodality data acquisition system we developed to combine these devices for monitoring multilateral conditions of mental health. The combination of behavioral and brain measurements is a novel approach.
Method
Multimodality Measurements
The equipment and data acquisition system used in this study are shown in Figure 1. The PC logger is our original software developed for the Windows OS. It was installed on each participant's PC and hooked key- and mouse-events with time stamps as a background process. In order to avoid an information security risk, the kind of tapped key, i.e., alphabet key, number key, or special key, was recorded instead of key characters. Mouse button click and mouse movement distance were recorded as well. A cumulative distribution of the key/mouse events frequently showed power of event intervals. These power exponents are related to the total number of event and operator mood states. Using the key/mouse data recorded over the course of a day, a fractal dimension was obtained as a slope of fitted line for cumulative distribution vs. time-interval graph. Because the fractal dimension also depends on the workload in a day, the key/mouse index dkey/mouse for the day was obtained as a deviation from the fractal dimension stemming from workload (5).
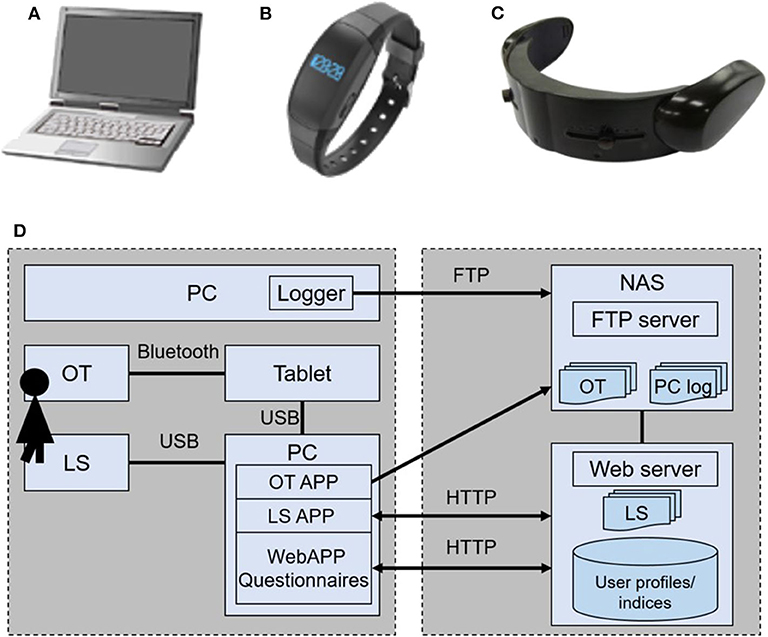
Figure 1. Devices used for monitoring mental conditons: (A) PC logger, (B) Life Scope (LS), and (C) HOT-1000 optical topography (OT). (D) The data acquisition and database system.
The wrist-band type activity tracker, Life Scope (LS, Hitachi, Ltd.), is equipped with a triaxial accelerator. All raw signals of the accelerator are stored in its own memory. A variety of features were calculated using the raw data in the server (11). Among them, we used steps, activity strength in metabolic equivalents (METs), and sleeping hours for the analysis.
Optical topography (OT) is a tool for measuring cerebral blood volume change associated with brain activity on the basis of Near-infrared spectroscopy (NIRS). Two regions on the forehead were covered by a handy and wireless model, HOT-1000 (Hitachi High-technologies Corporation). The headset was connected through Bluetooth with a tablet PC that provided a task for activating brain function, acquired data, and displayed the results. The brain activity during a working memory (WM) task (namely, a delayed matching task; see Figure 2), was observed by OT for estimating mood states (10). Increases of oxygenated hemoglobin during spatial and verbal working memory tasks at the left and right sides of the forehead were measured. The response time to answer and the rate of correct answers were also recorded.
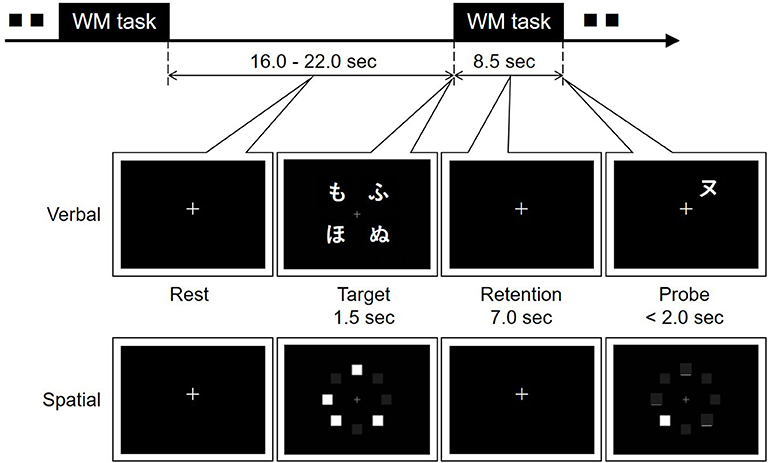
Figure 2. Verbal and spatial delayed matching tasks for optical topography measurement. Four Japanese characters (hiragana) or four squares were displayed for 1.5 s on a tablet PC as a target in the verbal or spatial working memory task, respectively. After memory retention for 7.0 s, another Japanese character (katakana) or one square was shown as a probe. In the verbal task, participants were asked to click the circle button or the cross button displayed on the tablet PC when the probe character had the same pronunciation as one of the target characters or when it did not. In the spatial task, the agreement of the position between the probe and one of the targets was answered in the same way.
Each item of time-series data obtained by the PC logger, wrist-band type activity tracker, and optical topography was stored in the time-series analysis database through the local network. The query object graph analysis method was used to enable analysis sharing among analysts by preventing duplicate processing and data explosion (12).
Questionnaires
The Kessler psychological distress scale (K6) (13) and a part of the Brief Job Stress Questionnaire (BJS) (14)2 were used for obtaining mental scores. The K6 score is the standard questionnaire for screening the mental distress. When the K6 score is lower, the condition is better. The cutoff is 5. BJS consists of 52 questions concerning job, health, and people surrounding the respondent. As the situations concerning job and people did not frequently change during the field test, 29 questions concerning health were used for determining subjective mental scores of lassitude, irritation, fatigue, anxiety, depression, and physical stress. All mental scores of BJS were converted into values from 1 to 5 in accordance with the manual3. When the mental score is higher, the condition is better. A total value of mental scores lower than 12 is regarded as stressful.
Trial in Office
Thirty-nine healthy volunteers (32 males, 7 females, 43.7 ± 8.9 years old) with no history of mental disorders participated in the measurement over four months. Neither measured data nor information were fed back to participants so as to avoid any effects on the trial. The data from the volunteers were obtained according to the regulations set forth by the internal review board at the Central Research Laboratory, Hitachi, Ltd., following receipt of their written informed consent.
The PC loggers were installed on all PCs used by participants in the office. The keyboard and mouse operations were recorded the entire time PCs were running. All logs were combined for each participant according to the timestamp. The key index and the mouse index were calculated using data from one day and averaged over one week.
The participants were asked to wear the LS wristband all day except when bathing. Data from the LS was sent to the server through a local area network once a week. The values of steps, METs, and sleeping hours were obtained as averages of one week.
Once a week at the same time, the OT measurements were performed and the questionnaires were administered. While the dates and times for each participant were set in principle, they were nevertheless flexible in order to ensure that enough data were gathered.
Analysis
A linear multiple regression model was obtained for each mental score using multimodality indices, as
with target variable yo, explanatory variable xj, regression coefficients cj, square error ε2, the number of explanatory variables m, and the number of data N. Target variables were scores of lassitude, irritation, fatigue, anxiety, depression, physical stress, total, and K6. The obtained multimodality indices are listed in Table 1. In order to check the possibility of prediction, each index was observed one week and two weeks before the score sheet was tallied. In total, 51 explanatory variables were obtained.
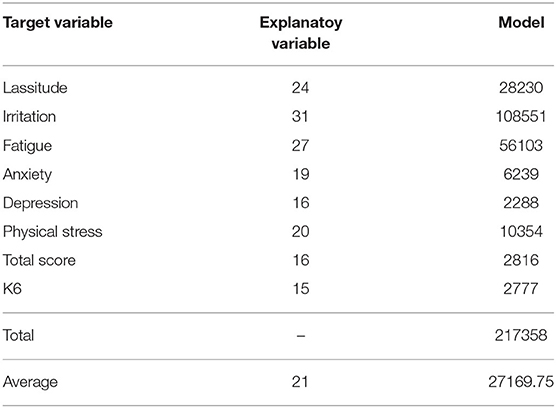
Table 1. The number of explanatory variable and model for each target variable.
Here, we investigated three cases of m = 3, 4, and 5. The total combinations of choosing 3, 4, and 5 indices out of 51 indices equal to 2,619,785 for one mental score. More than twenty million cases of calculation were required for eight mental scores. In order to reduce the number of calculations, each explanatory variable that had a correlation coefficient with each target variable of <0.1 was rejected as a target variable. Also, combinations of the same index for a different week were not permitted. As a result, the number of combinations was reduced to one-hundredth.
The number of the explanatory variables may be different across participants because the measurement schedules did not match the participants' ones (e.g., business trips, days off). When the temporally shifted explanatory variables (i.e., one, two weeks in prior to the measured target variables) were used in regression models, the temporal data of the target variables consequently decreased. Therefore, missing some temporal data inevitably occurred; only data having the complete temporal information were included in the regression analysis. Neither data normalization nor further elimination were performed because there was no observed improvement (data not shown).
The three-fold cross validation was performed to select each optimum model for each target variable. The fold number was determined to ensure that a sufficient amount of data was included in each subset. The subsets were created based on the participant-wise approach to validate participant dependency on models. No data measured from a participant at different measurement times were assigned in different subsets; models with the minimum participant-dependent effect were selected. In order to avoid dropping the models with a larger correlation coefficient r and slightly larger ε2 than the model with minimum ε2, we define an evaluation index V for selecting candidates of the optimum model as follows:
where < r>, < ε2>, σr, and are mean values and standard deviations of r and ε2, respectively. Both r and ε2 were standardized to equally contribute to V. The optimum model for each mental score whose ε2 was the smallest among ten candidate models identified using V was chosen.
Results and Discussion
Table 1 shows the valid target variables and the numbers of models for each target variable obtained after the reduction described above. The numbers of significant explanatory variables (xsig) and regression models were varied across the target variables. The total number of models was 217,358, which means we were able to reduce the computation cost by 1/1000 compared to the initial one.
The explanatory variables are shown in Table 2. The postfix, “_n” means that the explanatory variable was obtained n weeks before the measurement of target variables. For example, Ped_2 is the mean value of steps in a week obtained two weeks in prior to the measurement of mental scores. The number of data (N; the complete temporal data) ranged from about 30 to 70.
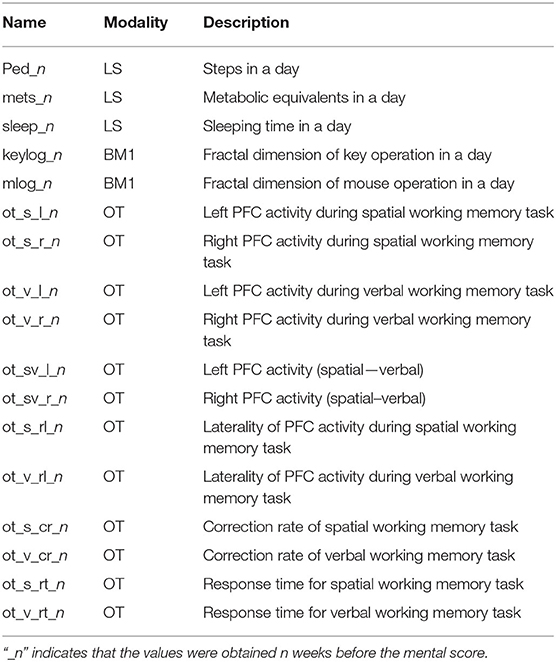
Table 2. Explanatory variables.
Figure 3 shows the relationship between mental scores and values estimated using each optimum model shown in Table 3. The best combination of explanatory variables was selected for each target variable. For example, the best model for depression is described as below.
No explanatory variables taken one week before the measurement of depression score was used in the above model.
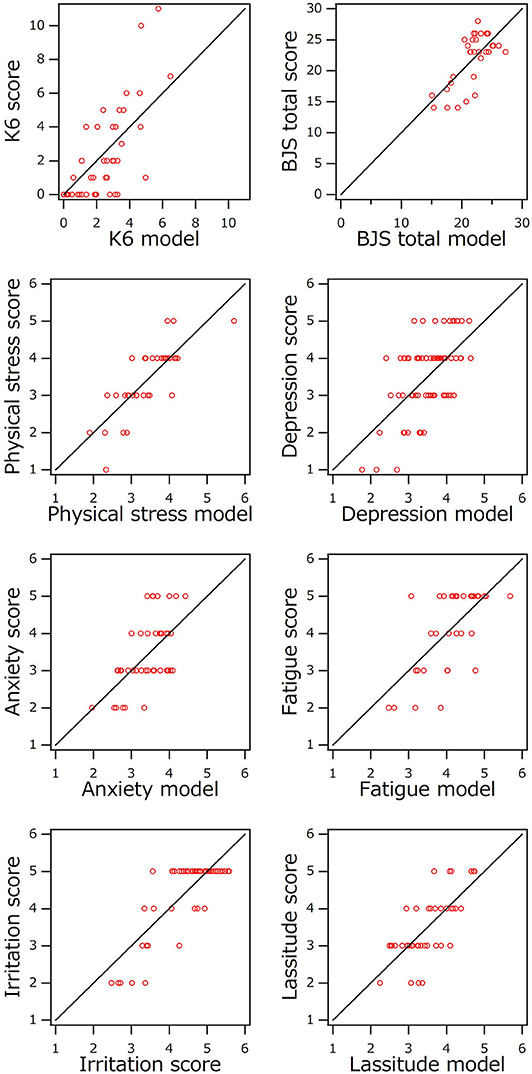
Figure 3. Comparison of mental scores and values estimated using optimized multivariate linear regression model.
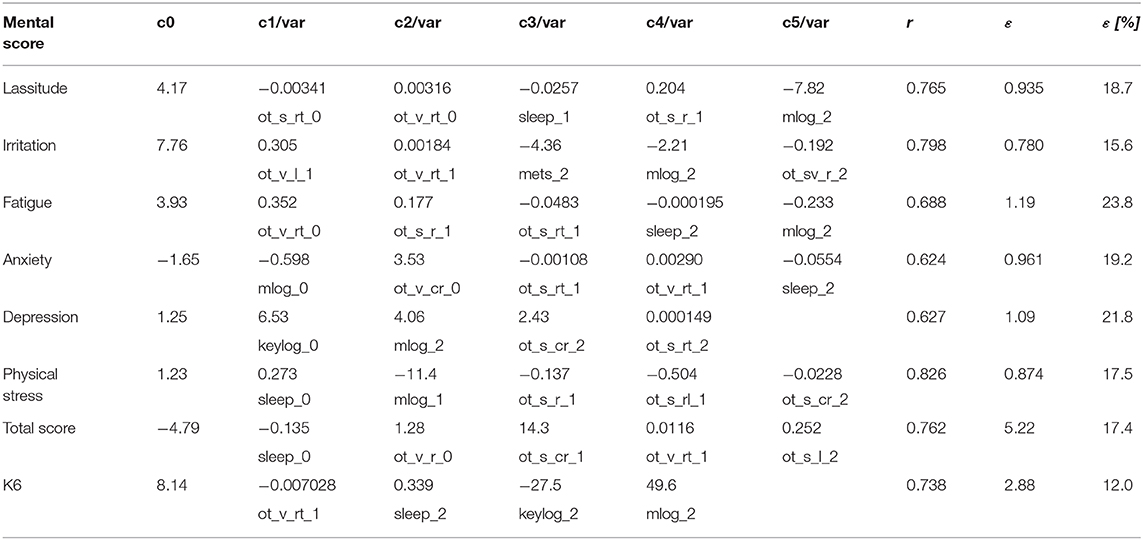
Table 3. Optimum model for each mental score with correlation coefficient r, estimation error ε, and percentage of ε to full score.
According to Table 3, the correlation coefficients were 0.6 for depression and anxiety and 0.7–0.8 for others. Each error ε for each mental score, lassitude, irritation, fatigue, anxiety, depression, or physical stress was about 1, which is almost the same as the minimum scale of score. The errors for total score and K6 were 5.2 and 2.9, and the full scores for total score and K6 were 30 and 24, respectively. Each error was within 24% of each full score. Considering the accuracy of the subjective score sheet, these errors seem acceptable for practical use.
The coefficients of variation (CVs) of mean squared errors across participants for the target variables were around one (Figure 4). When CV is one, the standard deviation is equal to the mean value. The effect of participant dependency on models was remarkable, although it had been tried to be controlled through the participant-wise cross validation. Other participant features, such as gender and age, were not controlled in this study due to the small number of data. Case analysis potentially improves the robustness of model. Increasing the number of participants data possibly provide the models with much smaller participant dependency.
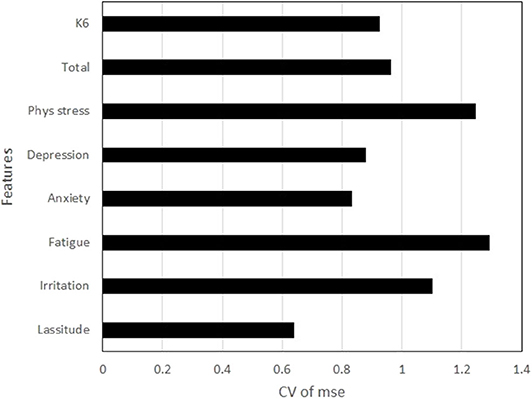
Figure 4. Coefficients of variation of mean squared errors (mse) across participants for the target variables.
We should point out here that the optimum model for K6 consisted of explanatory variables measured one or two weeks before the mental score. As such, these multimodality measurements predicted the mental condition before participants made a subjective complaint. Because K6 is used for screening mental distress, the system shows potential as an early screening technique.
Major participants were healthy volunteers. Neither clinical diagnosis nor intervention were performed according to the results obtained in this study. Therefore, the effectiveness of this system for screening and preventing mental distress has not been confirmed yet. This system remains to be investigated further. Even though the current results were preliminary, this system showed a promising function to replace the conventional mental health care services based on manual questionnaire sheets.
Conclusion
We developed a monitoring system for mental condition involving the PC logger, the activity tracker, and Optical Topography (OT). We collected the biometric data from thirty-nine healthy volunteers in office for more than four months. The multivariate linear models for mental scores of BJS and K6 were obtained by using the supervised machine learning and the cross-validation. Those models included several variables from the collected biometric data such as the fractal dimensions of PC operation obtained from the PC log, steps, METs, and sleeping time from the activity tracking log, brain activities, laterality, correction rates and response time during working memory tasks from the brain activity and performance log. Each mental score estimated by each model was well agreed with each score of questionnaire. Especially, K6 score was estimated by using the biometric data collected from one or two weeks before. The system is potentially useful for the mental healthcare including the prevention.
Data Availability Statement
The datasets generated for this study will not be made publicly available. It was not included in the ethics approval to submit the datasets.
Ethics Statement
The studies involving human participants were reviewed and approved by the internal review board of Central Research Laboratory, Hitachi, Ltd. The patients/participants provided their written informed consent to participate in this study.
Author Contributions
MK conceived the concept and led the project. SS and MK analyzed the data. HA, AN, and AO performed the field trial and the data preprocessing. HN developed the platform and database. ME and HK developed the PC logger and the activity tracker and analyzed each data, respectively. MK, HA, and TF developed the wearable OT. All authors contributed to the article and approved the submitted version.
Funding
The authors declare that this study received funding from the research fund contributed by Hitachi Group companies. The funder had no role in the study design, data collection and analysis, decision to publish, or preparation of the manuscript.
Conflict of Interest
All authors were employed by company Hitachi, Ltd.
Acknowledgments
The authors gratefully thank Drs. Keiro Muro and Takeshi Tanaka at the Center for Technology Innovation, Hitachi, Ltd. for their significant contributions to developing the data-acquisition and database system.
Footnotes
1. ^Web Page of International Employee Assistance Professionals Association (EAPA). Available online at: https://www.eapassn.org/FAQs
2. ^The Brief Job Stress Questionnaire English version. Available online at: https://www.mhlw.go.jp/bunya/roudoukijun/anzeneisei12/dl/160621-1.pdf
3. ^Available online at: http://www.tmu-ph.ac/topics/pdf/sotenkansan.pdf (in Japanese).
References
3. Stewart W, Ricci JA, Chee E, Hahn SR, Morganstein D. Cost of lost productive work time among US workers with depression. JAMA. (2003) 289:3135–45. doi: 10.1001/jama.289.23.3135
4. Kamišalić A, Fister I Jr, Turkanović M, Karakatič S. Sensors and functionalities of non-invasive wrist-wearable devices: a review. Sensors. (2018) 18:E1714. doi: 10.3390/s18061714
5. Egi M, Ishikawa H. Scale-free dynamics of human behavior in personal computer operations. In: 10th International Conference on Management of Digital EcoSystems. Tokyo (2018).
6. Hayashi T. A study on estimation method of business performance using wristband type Life monitor. In: the 70th National Industrial Safety and Health Convention 2011. Tokyo (2011).
7. Aoki R, Sato H, Katura T, Utsugi K, Koizumi H, Matsuda R, et al. Relationship of negative mood with prefrontal cortex activity during working memory tasks: an optical topography study. Neurosci Res. (2011) 70:189–96. doi: 10.1016/j.neures.2011.02.011
8. Sato H, Aoki R, Katura T, Matsuda R, Koizumi H. Correlation of within-individual fluctuation of depressed mood with prefrontal cortex activity during verbal working memory task: optical topography study. J Biomed Opt. (2011) 16:126007. doi: 10.1117/1.3662448
9. Sato H, Dresler T, Florian B, Andreas HJ, Ann-Christine E. Replication of the correlation between natural mood states and working memory-related prefrontal activity measured by near-infrared spectroscopy in a German sample. Front Hum Neurosci. (2014) 8:37. doi: 10.3389/fnhum.2014.00037
10. Atsumori H, Obata A, Sato H, Funane T, Yamaguchi R, Kiguchi M. Prefrontal cortex activation of return-to-work trainees in remission of mental disorders with depressive symptoms compared to that of healthy controls. J Biomed Optics. (2019) 24:056008. doi: 10.1117/1.JBO.24.5.056008
11. Sasaki S, Ukawa S, Okada E, Wenjing Z, Kishi T, Sakamoto A, Tamakoshi A. Comparison of a new wrist-worn accelerometer with a commonly used triaxial accelerometer under free-living conditions. BMC Res Notes. (2018) 11:746. doi: 10.1186/s13104-018-3849-9
12. Nakagawa H, Muro K. Analysis sharing method by managing provenance of query. In: IEEE Systems Conference 2017. Montreal, QC (2017).
13. Kessler RC, Andrews G, Colpe LJ, Hiripi E, Mroczek DK, Normand SLT, et al. Short screening scales to monitor population prevalences and trends in non-specific psychological distress. Psycol Med. 32:959–76. doi: 10.1017/s0033291702006074
Keywords: multimodality, multivariate linear regression, PC logger, activity tracker, near-infrared spectroscopy (fNIRS)
Citation: Kiguchi M, Sutoko S, Atsumori H, Nishimura A, Obata A, Funane T, Nakagawa H, Egi M and Kuriyama H (2020) Mental Condition Monitoring Based on Multimodality Biometry. Front. Public Health 8:479431. doi: 10.3389/fpubh.2020.479431
Received: 19 June 2019; Accepted: 01 September 2020;
Published: 22 October 2020.
Edited by:
Berthold Langguth, University of Regensburg, GermanyReviewed by:
Mitsunori Ogihara, University of Miami, United StatesFranziska C. Weber, University of Regensburg, Germany
Copyright © 2020 Kiguchi, Sutoko, Atsumori, Nishimura, Obata, Funane, Nakagawa, Egi and Kuriyama. This is an open-access article distributed under the terms of the Creative Commons Attribution License (CC BY). The use, distribution or reproduction in other forums is permitted, provided the original author(s) and the copyright owner(s) are credited and that the original publication in this journal is cited, in accordance with accepted academic practice. No use, distribution or reproduction is permitted which does not comply with these terms.
*Correspondence: Masashi Kiguchi, bWFzYXNoaS5raWd1Y2hpLnB5QGhpdGFjaGkuY29t