 Zhi-Guang Li
 Hua Wei*
- Department of Economics, School of Economics and Management, Anhui University of Chinese Medicine, Hefei, China
Objectives: This paper constructs a comprehensive evaluation index of the traditional Chinese medicine (TCM) medical service system and summarizes the development of TCM medical services in China.
Methods: We chose 31 provinces' TCM hospitals as research objects. The data were obtained from the Health Statistics Yearbook from 2013 to 2018 and from the National Statistics of Chinese Medicine from 2012 to 2017. The approaches to factor analysis and TOPSIS are used in this paper. It is found that the comprehensive evaluation indexes of the TCM medical service system can be divided into 4 first-level indicators and 14 second-level indicators.
Results: The development of the TCM medical service system in China is unbalanced and inadequate. North China and East China are generally superior to Northwest and Southwest China in terms of revenue and expenditure for TCM medical services. The per capita of medical resources in the Southwest and Northwest are stronger than those in Central and South China, but overall medical resources are weaker than those in East China and North China. TCM medical service institutions in East China, South China and Central China have achieved better service results and higher economic benefits with less resource input, which further indicates the efficient allocation of resources and the balanced operation of TCM medical service institutions.
Conclusion: The development of China's TCM medical service system shows the imbalance and inadequacy of “East is strong, West is weak” and “South is superior, North is inferior.”
Introduction
In June 2016, the Chinese government created a program of public policies within its planning called “Healthy China 2030.” A key issue that the outline of the Healthy China 2030 Plan involves is to highlight the unique advantages of traditional Chinese medicine (TCM), especially in disease prevention. There is evidence that TCM, with its unique advantages in health care, can be recognized as one of the most important treatments in the world. Therefore, the Chinese government has elevated the development of TCM as a national strategy (1). The Chinese health care system and its reform has long attracted international attention and achieved great success, although challenges remain (2, 3). In the last few decades, Western medicine has dominated in China, although traditional Chinese medicine still plays an important role in the Chinese health care system (4). In light of recent events in Chinese new medical reform, construction of the TCM medical service system is emphasized not only by the government, but also by individual TCM hospitals and various departments inside hospitals. Because TCM medical resource allocation is extremely unbalanced and inadequate, especially between regions and between urban and rural areas (5). That is to say, the balance and coordination of related resources should be a priority in shaping China's health-care system reform (6). Therefore, how to establish a Chinese TCM medical service system and meet the national demand for TCM services has become a major concern of stakeholders, such as TCM hospitals and local authorities (7). In fact, the construction of a high-quality, efficient TCM medical service system entails not only the upgrading and transformation of the existing health care system, but also comprehensively deepening reform and promoting the implementation of China's health strategy (8).
The TCM medical service system refers to the TCM health resources of TCM medical institutions and other medical institutions, which are formed in the process of providing TCM medical services (9). As the average resources of TCM medical institutions are relatively weak, development is uneven, and their service functions are limited, which further indicates that improving the TCM medical service system in China is the primary task for the development of TCM (10, 11). Only if the evaluation indexes of the TCM medical service system are determined, can we develop the TCM medical service correctly and reasonably. In fact, the comprehensive evaluation of TCM medical services also plays a role in promoting the development of TCM hospitals, the direction of hospital management, and the internal management of hospitals (12).
At the time of the current study, the construction of the TCM medical service system is still in the exploratory stage, and people have not reached a consensus on a comprehensive evaluation mechanism of the TCM service system. Gu constructed a comprehensive evaluation system of clinical departments with medical quality, work efficiency, sustainable development of departments, social benefits, and economic management as first-level indicators (13). Ni and Wang et al. took social responsibility as the starting point by using the information analysis method and Delphi expert consultation method to explore the establishment of three-level public hospitals' public welfare evaluation index system, which mainly includes three first-level indicators of service quality, service suitability, and professional ethics (14, 15). Liu also completed a comprehensive evaluation of the medical service capacity of state-owned hospitals by using the expert consultation method, including three first-level indicators, namely resource allocation, service capacity and medical technology (16). Only Zhou focused on traditional Chinese medicine hospitals and constructed a comprehensive evaluation model of TCM medical service quality, including seven first-level indicators, namely TCM technicians, TCM infrastructure, TCM revenue and expenditure, TCM medical technology, TCM services, operating efficiency and patient satisfaction (17). Although some research has been carried out on the TCM medical service system, there have been no empirical investigations into explaining the logical relationship between the indicators and the weight in the TCM medical service system. Additionally, previous studies have suffered from methodological flaws and limitations. For example, the Delphi method and expert consultation method are not exempt from significant methodological weaknesses, such as their basic source of information (who can be defined as an expert, what biases each expert has, etc.), the use of consensus as a way to approach the truth, the limitation of the interaction involved in written and controlled feedback, and the restriction to the possibility of social compensation for individual contributions to the group (18). However, the methodological approach taken in this study is a mixed methodology based on integrated Factor Analysis and TOPSIS. Finally, we are going to assess the trends and development of TCM medical services in 31 provinces of China.
In this context, the resource-based view (RBV) theory can provide a better explanation of the interplay of the strategic resources of the organization and the capability to gain a competitive advantage. The indicator system framework we constructed was based on RBV. The paper concludes that only by enhancing a hospital's profitability can the balance of hospital revenue and expenditure be increased, thus reducing financial pressure on hospital operation (7). Simultaneously, the enthusiasm of medical staff can be stimulated with the stabilization of a hospital's operation and development, which in turn will enhance patient satisfaction (19, 20). Moreover, talent recruiting, equipment procurement, performance and salary distribution all benefit from the hospital's own efficient operation and steady income (21). In the end, greater talent will participate in the construction and development of TCM hospitals. The details are shown in Figure 1.
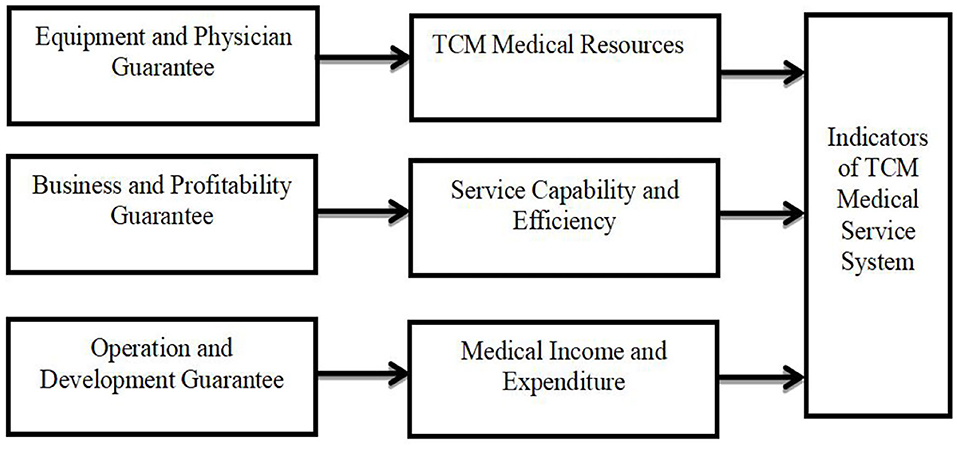
Figure 1. Framework of the TCM medical service system.
The paper makes three main contributions to the literature. First, to our knowledge, research on the TCM medical service system is still in the exploratory stage. The importance and originality of this study are that it explores the logical relationship between the indicators and the weight in the TCM medical service system. And, this is also the first study to undertake a comprehensive evaluation of the performances of the TCM medical service system in 31 provinces of China. Second, this paper focuses on TCM hospitals, so it expands the research scope of health economics and enriches its research contents. Specifically, our research can produce a batch of research results with strong instructive significance and application value, providing a basis for scientific decision-making. Third, existing evaluation methods tend to be based mainly on the perspective of the total medical service, ignoring medical service per Capita by individuals. And, some new evaluation indicators are added to make the evaluation results more practical and reliable. This article continues with section Introduction which briefly reviews the relevant literature on the TCM medical service system. Section Data and Methods discusses Materials and Methods, while section Empirical Analysis exhibits the empirical analysis of the TCM medical service system. We also illustrate the variables used in medical service system studies. Conclusions and suggestions for future research are presented in section Results.
Data and Methods
Data Sources
Data are obtained from the Health Statistics Yearbook from 2013 to 2018 and from the National Statistics of Chinese Medicine from 2012 to 2017. In this paper, TCM hospitals in 31 provinces are selected as the research objects. TCM hospitals are medical institutions that treat patients with TCM service and products to maintain public health (9). Using the Delphi consensus methodology, 12 experts from the field of health-care and reviewing research on hospital performance evaluation from China were asked during three rounds of questioning to score the feasibility and importance of indicators that could be used to determine the framework of the TCM medical service system. After multiple pre-evaluation and expert discussions, 14 indicators have been selected for empirical analysis. Descriptive statistics are shown in Table 1.
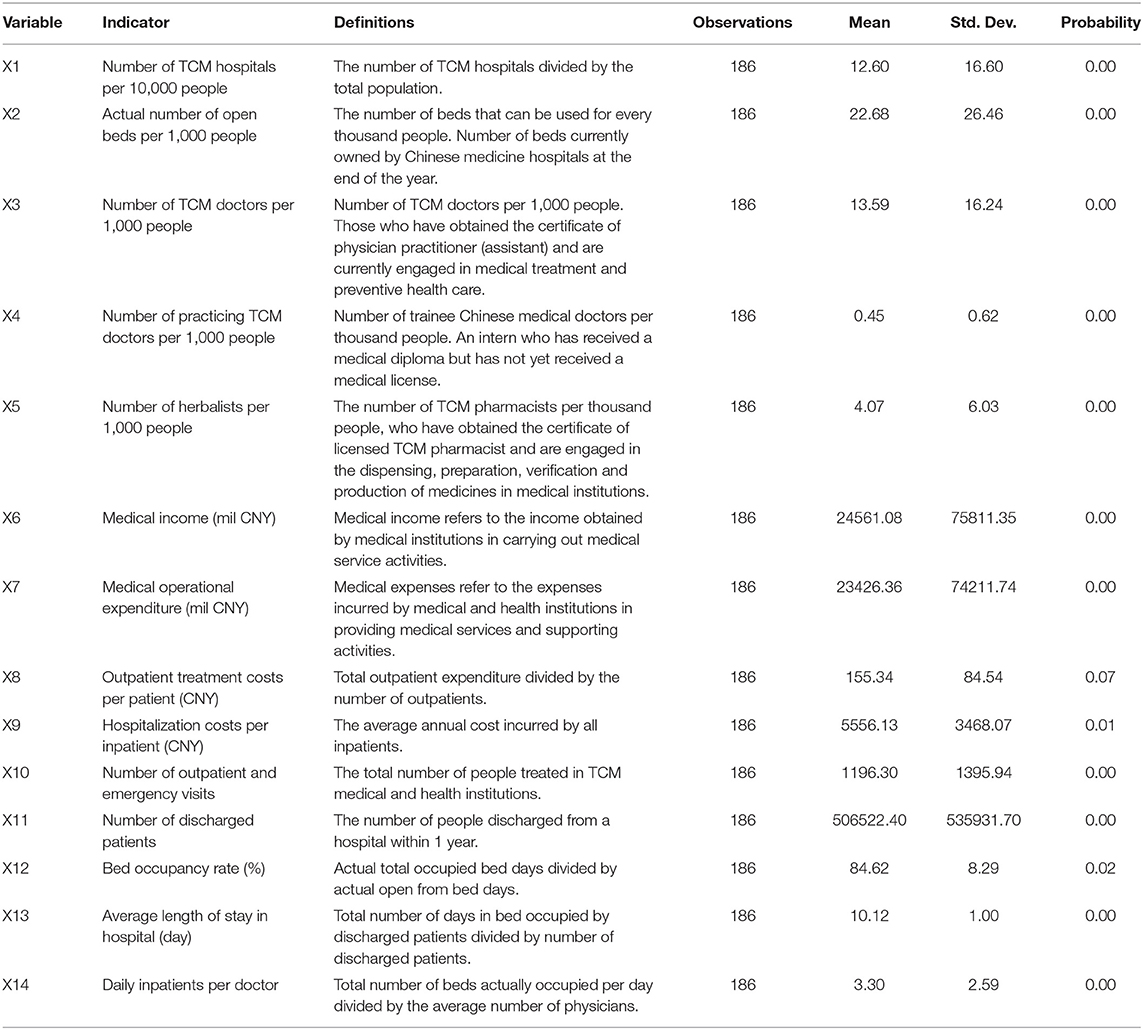
Table 1. Factor analysis index system.
Research Methods
Exploratory Factor Analysis (EFA) is a statistical approach for determining the correlation among the variables in a data set (22). This type of analysis provides a factor structure (a grouping of variables based on strong correlations). A critical assumption of the EFA is that it is only appropriate for sets of non-nominal items that theoretically belong to reflective latent factors. Based on the analysis of the correlation coefficient matrix of variables, data reduction factor analysis conducts dimensionality reduction processing on existing data in order to reflect the most information from the original variables with fewer indicators (23). Therefore, the problem studied can describe each component of the original observation through the sum of the linear function of the least number of common factors and special factors.
The Technique for Order of Preference by Similarity to Ideal Solution (TOPSIS) is a multi-criteria decision analysis method to identify solutions from a finite set of alternatives based upon simultaneous minimization of distance from an ideal point and maximization of distance from a nadir point (24). According to the degree to which the evaluation object and the idealized targets are close to each other, if a feasible solution is the closest to the ideal solution and the furthest away from the negative ideal solution, it means that the evaluation object is closer to the optimal level. The ranking scheme for integrated TOPSIS is shown in Figure 2 and described as follows.
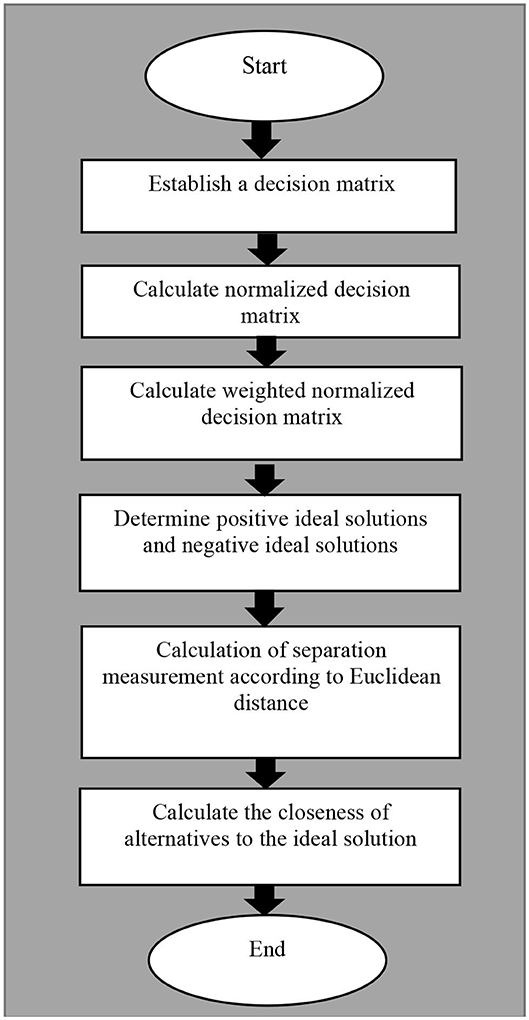
Figure 2. The ranking scheme for integrated TOPSIS.
Theory Model
Factor Analysis
Step 1: Construction of simultaneous equations
Suppose there are m test variables X1, X2, …, Xm that contain p independent common factors F1, F2, …, Fp (m ≥ p), test variable Xi contains unique factor Ui (i = 1,2, …,m), every Ui is not related to each other, and they are uncorrelated to Fi (j = 1,2, …,p). Each Xi can be linearly expressed by p common factors and its corresponding unique factor Ui, which is provided by the following:
Step 2: Construct the normalized decision matrix
In this process, the decision matrix is provided by the following:
subject to:
(I) p ≤ m;
(II) COV(F· U) = 0 (F is irrelevant to U);
(III) E(F) = 0 COV(F) = = Ip.
Common factors F1, F2, …, FP are not correlated, and the variances and the means are both 1 and 0.
(IV) E(U) = 0 COV(U) = Im
U1, U2,…,Um are irrelevant and they are both normalized variables. Assume that X1, X2,…, Xm are standardized, but not independent of each other. A is called factor loading matrix, and its element aij represents the load of the i-th variable Xi on the j-th common factor Fj, which is referred to as factor load. If Xi is regarded as a vector in the factor space of P dimension, aij represents the projection of Xi on the coordinate axis Fj. The purpose of factor analysis is to replace X with F through the model (1) or (2). Generally, p < m is used to simplify the dimension of variables.
TOPSIS
Step 1: Establish a decision matrix.
Suppose the decision matrix is A.
Step 2: Calculate normalized decision matrix.
Normalized decision matrix Z′ is formed by decision matrix A and its elements are , which is shown below.
Step 3: Calculate weighted normalized decision matrix.
Construct a normalized weighted decision matrix Z, and its elements are Zij.
Step 4: Determine positive ideal solutions and negative ideal solutions.
Step 5: Calculation of separation measurement according to Euclidean distance.
The Euclidean norm is used as the measure of distance, and the distance from any feasible solution Zi to Z+ is:
where, Zij is the normalized weighted value of the j-th target to the i-th scheme (solution).
Similarly, if is the negative ideal solution of the normalized weighted target, the distance between any feasible solutions and the negative ideal solutions is:
Step 6: Calculate the closeness of alternatives to the ideal solution.
Then, the relative proximity of a feasible solution to an ideal solution is defined as:
Therefore, Zi is closer to the ideal solution, Ci is closer to 1 accordingly. On the contrary, Zi is closer to the negative ideal solution, Ci is closer to 0 accordingly. Then, Ci values of each evaluation object can be compared to obtain a satisfactory solution (25–29).
Empirical Analysis
Factor Analysis
The measurement steps of factor analysis are shown in Figure 3 and described as following.
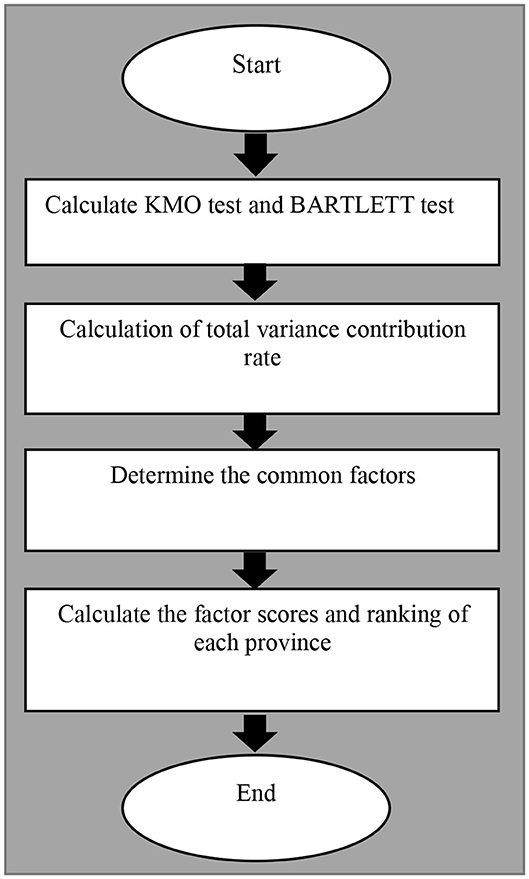
Figure 3. The measurement steps of factor analysis.
KMO Test and Bartlett Test
The Kaiser-Meyer-Olkin (KMO) Test is a measure of how suited data is for Factor Analysis. Bartlett's test for homogeneity of variances is used to test that variances are equal for all samples (30). The selected indicators were analyzed by principal component analysis, as shown in Table 2. The results showed that the KMO were all greater than the minimum standard of 0.5, and most of them were more than 0.6, which was suitable for factor analysis. The Bartlett Test of Sphericity rejected the null hypothesis of the unit correlation matrix, p < 0.001.
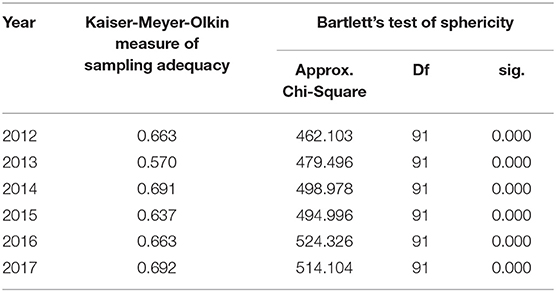
Table 2. KMO test and Bartlett test of cross-section data from 2012 to 2017.
Total Variance Contribution Rate
The total variance contribution rate of the cross-sectional data factor analysis method from 2012 to 2017 is shown in Table 3. The results show that the characteristic value of the first four principal components is >1, and their cumulative contribution rate is above 80%, indicating that the four common factors cover more than 80% of the secondary index information, with a high degree of interpretation. Therefore, the first four common factors are selected.
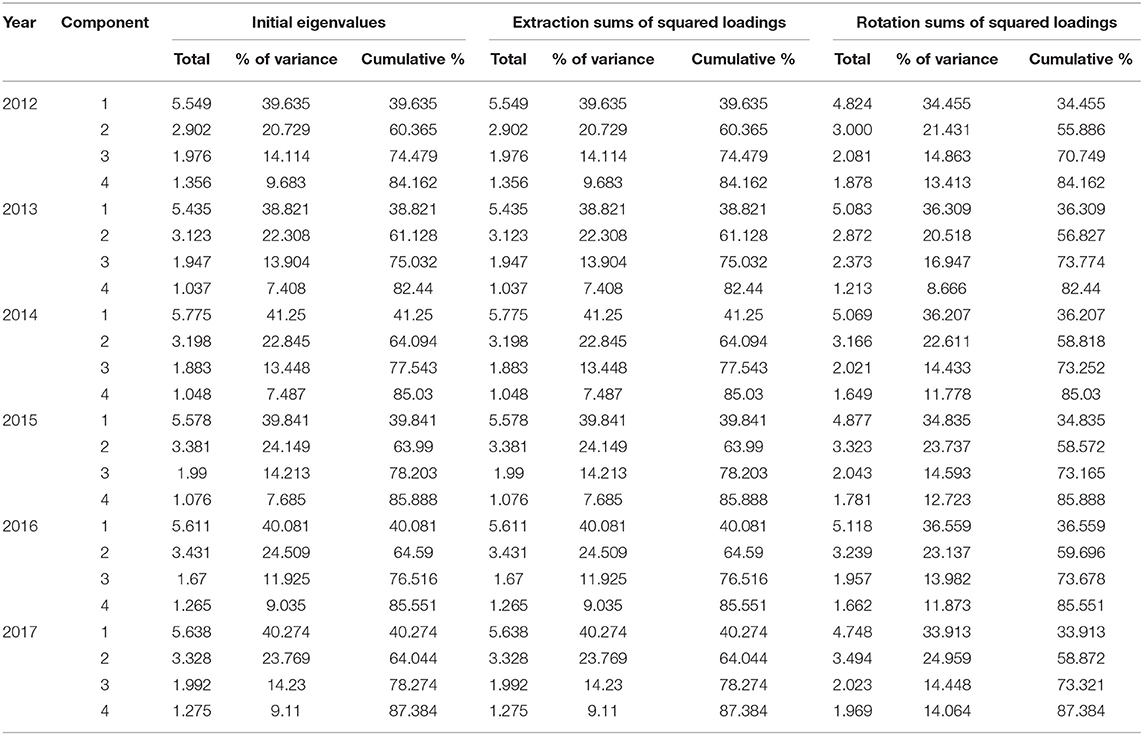
Table 3. Total variance contribution rate of cross- section data factor analysis method from 2012 to 2017.
Common Factors and Explanations
Principal component rotation is a series of mathematical methods to make the component load array easier to explain. We kept the selected components unrelated in order to make the common factor variables reflect the index information clearly. The initial factor loading matrix was rotated by the quartimax method, and the rotated factor loading matrix was obtained. Then, the common factors were named according to the indexes with high load under the common factors after rotation (31). This paper only takes the data of 2017 as an example to illustrate. Table 4 shows that the first common variable F1 has a large load on X6, X7, X8, X9, which can be named as medical income and expenditure. The second common variable F2 has a large load on X1, X2, X3, X4, and X5, which can be named as TCM medical resources. The third common variable F3 has a large load on X10, X11, which can be named as synthetic service capability in hospital. The fourth common variable F4 can be named as service efficiency, because it has a large load on X12, X13, and X14.
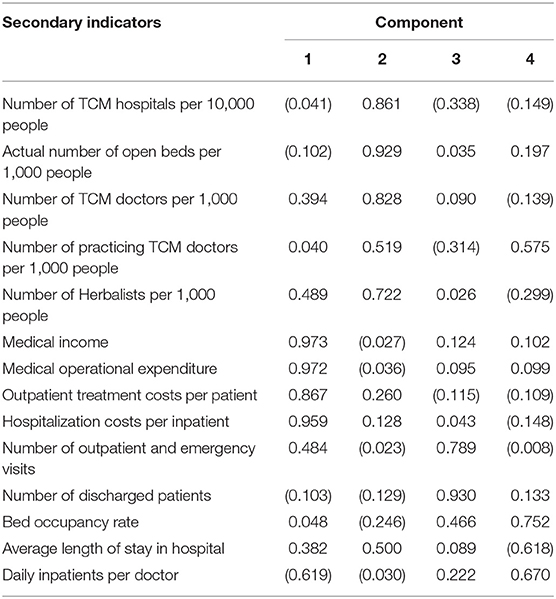
Table 4. Rotated component matrix in 2017.
Factor Scores
The scores of common variables were obtained by using the weighted least squares regression method. In this paper, the 2017 factor score coefficient matrix is obtained by taking the 2017 data as an example (see Table 5). Formula F1, F2, F3, and F4 are the scores of latent variables, which are shown below.
F1 = −0.059X1−0.077X2+…−0.102X14
F2 = 0.249X1+0.327X2+…+0.085X14
F3 = −0.082X1+0.095X2+…+0.088X14
F4 = −0.012X1+0.138X2+…+0.300X14
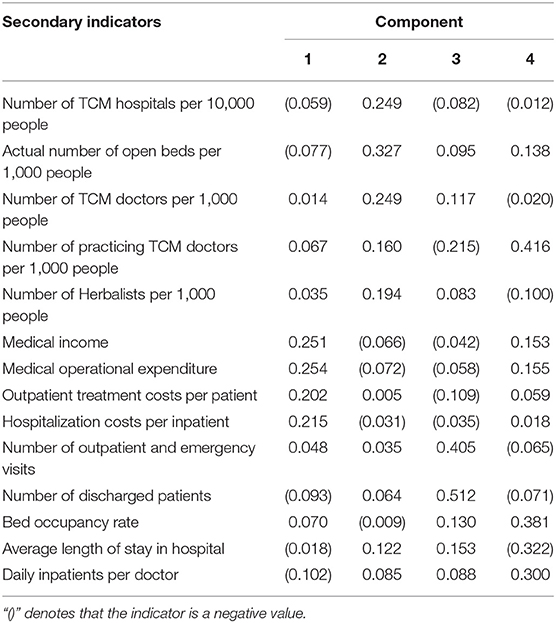
Table 5. 2017 component score coefficient matrix.
The scores of common factors are obtained by using the weighted least squares regression method (32). According to the results of the component score coefficient matrix, it is easy to obtain the common variables' scores and the ranking of TCM medical service system in 31 provinces from 2012 to 2017, as shown in Table 6. According to the scores of each common variable, the variance contribution rate of each latent variable is used as the weight. The ratio between the variance contribution rate of each common variable and the cumulative contribution rate is used as the latent variable value coefficient (33, 34). The comprehensive factor scores F of 31 provinces are calculated, and F reflects the development of TCM medical services in 31 provinces.
F = 0.388F1+0.286F2+0.165F3+0.161F4
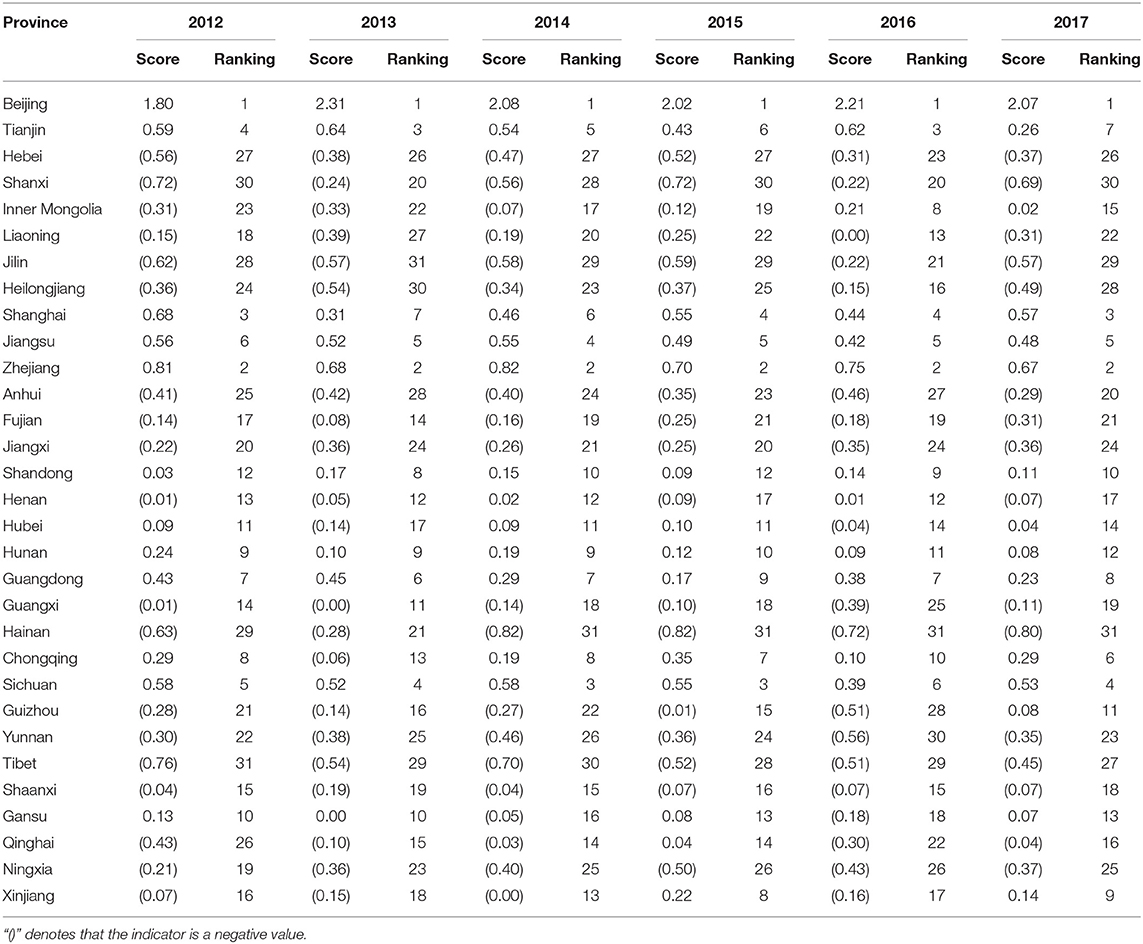
Table 6. China's comprehensive factor score and ranking of 31 provinces from 2012 to 2017.
By comparing F1 medical income and expenditure, Beijing, Shanghai, Tianjin, Zhejiang, Jiangsu, Guangdong, Shandong, Liaoning, Chongqing, and Fujian rank in the top 10. That means the revenue and expenditure capacity of TCM medical services in North and East China is generally higher than that in Northwest and Southwest China, and the average diagnosis and treatment cost per out-patient and average hospitalization cost per inpatient are also higher than that of Northwest and Southwest China. This is because East China and North China have witnessed rapid economic development compared with Northwest and Southwest China, with increasing disposable income and stronger consumption capacity of residents, which objectively provides an economic foundation for the development of public health services. Meanwhile, East China and North China are also stronger than the Northwest and Southwest in terms of education and international exchange and cooperation, which leads to talent gathering and medical technology upgrading. Eventually, some patients with severe diseases are referred to East China and North China for treatment. In addition, the scale and proportion of medical financial allocation in North China and East China are mostly higher than those in Northwest and Southwest China, which further widens the gap between East and North China and Northwest and Southwest China.
Comparing the F2 TCM medical resources, Beijing, the Inner Mongolia Autonomous Region, Qinghai, Tianjin, Gansu, Zhejiang, the Tibet Autonomous Region, Chongqing, Shanxi, and Sichuan are rich in medical resources per capita, ranking in the top 10. Currently, medical resources can be generally divided into the number of TCM medical service institutions, TCM medical technicians and instruments. Beijing, Tianjin and Zhejiang have gained obvious advantages in medical resources. Because Beijing is the political and economic center of China, its innovation, human capital, and ecology all provide fertile ground for the development of traditional Chinese medicine. Inner Mongolia, Qinghai, Gansu, and Tibet are sparsely populated but ethnic medicine is very advanced. Meanwhile, these provinces also attach great importance to the cultivation of TCM talent. Therefore, per capita allocation of medical resources in Southwest and Northwest regions are stronger than those in Central and South China, but the overall medical resources are weaker than those in East and North China.
Comparing F3 service capability, Sichuan, Guangdong, Jiangsu, Zhejiang, Henan, Shandong, Hubei, Hunan, Hubei, Shanghai, and Anhui rank in the top 10. This indicates that these regions have a prominent performance in the number of visits made by TCM medical institutions and the number of discharges from the hospital of TCM medical institutions. That is to say, they are more capable of providing TCM services than those provinces in Northwest and Southwest China.
Comparing F4 service efficiency, Shanghai, Beijing, Jiangsu, Tianjin, Zhejiang, Guangdong, Shandong, Chongqing, Hubei, and Hunan are at the forefront. This demonstrates that TCM medical service organizations in East China, South China, and Central China have achieved better service results and higher economic benefits with fewer service resources, which is one of the reasons for their relatively strong revenue and expenditure. At the same time, this further explains the efficient allocation of its resources and the balanced operation of the organization.
The Changing Trend of China's TCM Medical Service System
Next, from the perspective of regional analysis, the changing trend of China's TCM medical service system from 2012 to 2017 will be analyzed in detail. Figure 4 shows the dynamic fluctuations of TCM medical service systems in seven geographical regions of China. The ranking of the TCM medical service system in each region is North China > East China > Central China > Southwest China > Northwest China > South China > Northeast China. Specifically, Beijing had been far ahead in North China, with Tianjin showing a downward trend, Inner Mongolia and Hebei rising steadily, and Shanxi fluctuating greatly. East China, Central China, and South China were relatively stable, while Southwest China and Northwest China fluctuated greatly on the whole, especially Gansu, Xinjiang, and Qinghai showed an alternating leading. The performance of the TCM medical service system in Northeast China was first increased and then decreased, with Liaoning, Jilin, and Heilongjiang rising consistently since 2013 and reaching a peak in 2016.
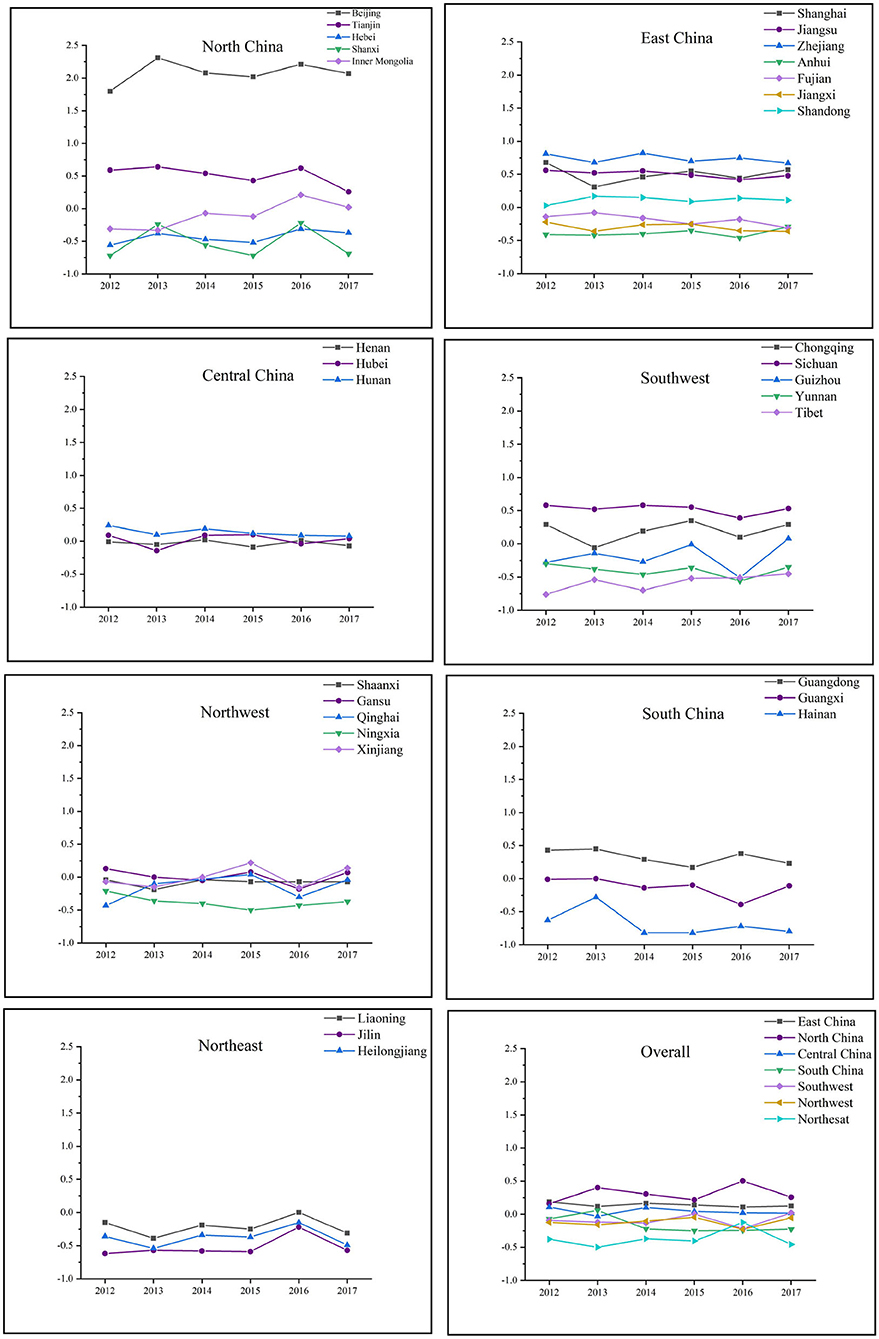
Figure 4. The changing trend of China's TCM medical service system.
The comprehensive factor scores and rankings of China's provinces from 2012 to 2017 are found, but the comprehensive scores of TCM medical services in 31 provinces are different in every year, and the order of comprehensive scores is not the same. This is because the data of each year are independent, so the comprehensive factor scores cannot be simply evaluated by summation. Instead, the results of factor analysis should be comprehensively evaluated by the TOPSIS method. In this way, the issue of factor analysis being unable sum up the panel data to reflect the comprehensive level of a region's TCM medical service system can be solved (35).
TOPSIS Comprehensive Evaluation
In order to evaluate the development of TCM medical service system of each province from 2012 to 2017 in a more reasonable way, TOPSIS is adopted to process the comprehensive score after factor analysis with MATLAB, so as to obtain the development level and rankings of the TCM medical service system of each province from 2012 to 2017. As shown in Table 7, the comprehensive development level of Beijing, Zhejiang, Sichuan, Tianjin, Shanghai, Jiangsu, Guangdong, and Chongqing is relatively good. The optimal solution proximity in East China and South China is higher than that of Northeast and Southwest China, which is consistent with the above factor analysis results and better reflects the development level of the TCM medical service system in China's 31 provinces.
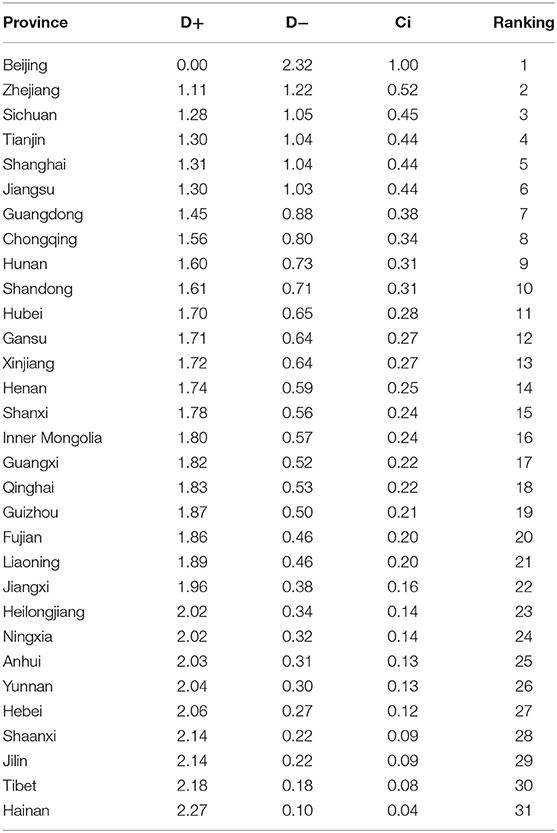
Table 7. Comprehensive evaluation results and rankings of development levels of 2012–2017 in China's 31 provinces.
Therefore, the comprehensive factor score is basically consistent with the result of the optimal solution closeness degree (36). For example, Beijing ranks first in the comprehensive factor scores from 2012 to 2017. Although there is a slight decrease in the comprehensive factor score of Sichuan province from 2012 to 2017, it shows an overall upward trend, and the overall development trend is relatively good, ranking third in the final optimal solution proximity. Therefore, provinces with higher comprehensive factor scores have bigger closeness of alternatives to the ideal solution, and provinces with lower comprehensive factor scores have smaller closeness of alternatives to the ideal solution. For example, the comprehensive factor score of Hainan province from 2012 to 2017 improved in 2013, but was at the bottom of the list for the rest of the year. The score of Hainan province is very low but undergoes great changes, which reflects its slow and unstable development, making the smallest closeness of alternatives to the ideal solution.
Further analysis shows that the closeness of alternatives to the ideal solution in 93.5% of China's provinces is distributed below 0.5, which indicates that the development level of the TCM medical system of provinces in China is still relatively backward, and there is lots of room for development. The proportion where the closeness of alternatives to the ideal solution is bigger than 0.5 only accounts for only 6.5%. The reasons for this may be related to the uneven allocation of resources in the TCM medical service system, a shortage of health technicians and service inefficiency.
Results
This paper illustrates the evaluation index of China's TCM medical service system and ranks the development of 31 provinces in China.
TCM Medical Service System
The evaluation index of the TCM medical service system includes TCM medical resources, medical service capability and efficiency, medical income, and expenditure. Doctors and medical equipment are the most important TCM medical resources. They are the technical guarantee for hospitals to provide services. Furthermore, the medical service capacity of TCM hospitals is reflected by the number of patients diagnosed and treated, and the number of patients discharged from hospitals. The service efficiency of TCM hospitals is related to the bed utilization rate, the average hospitalization days and the average hospitalization days for doctors. These factors are the business and economic guarantee of hospital operation. Medical income and expenditure refer to medical service income and medical service cost, which are the foundation of hospital operation and development.
Ranking of China's TCM Medical Service System
The paper gives the ranking of 31 provinces in China in terms of the TCM medical service system. It is indicated that Beijing, Zhejiang, Sichuan, Tianjin, Shanghai, Jiangsu, Guangdong, Chongqing, Hunan, and Shandong rank among the top 10 of China. The development of the TCM medical service system in Northwest and Southwest China is weaker than that in East China and Central China. The development of Northeast China tends to be balanced and the strength of each province is close. However, the provinces in North and South China have uneven development and large gaps. This fully reflects the imbalance and inadequacy of China's TCM medical service system in terms of medical resources, service capacity, service efficiency, and medical income and expenditure. To sum up, the development of China's TCM medical service system shows the imbalance and inadequacy of “East is strong, West is weak” and “South is superior, North is inferior.” The details are shown in Figure 5.
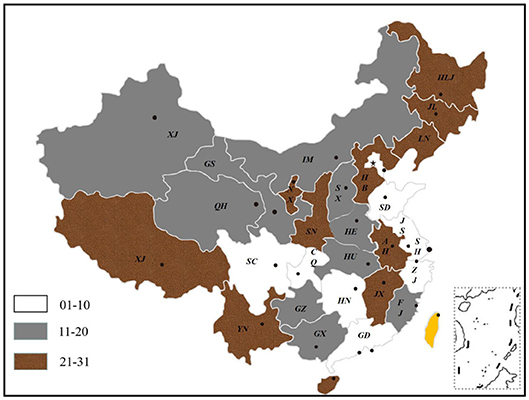
Figure 5. Ranking of China's TCM medical service system.
Conclusion and Discussion
This study's results are first aligned with findings from an initial stream of studies that the development of TCM medical service system is unbalanced in China (6). In addition, our study is more comprehensive regarding doctor qualifications, hospital levels and other indicators of TCM service quality. In Lu and Zeng's study, they focused on inequalities in the geographic distribution of hospital beds and doctors in traditional Chinese medicine, while we expand the breadth and depth of the evaluation of China's TCM medical service system. We also enrich the evaluation index of TCM medical resources, for example with the number of Herbalists per 1,000 people. Second, and similar to other prospects (2–4), TCM is a unique health resource in China and one of the main representative traditional medicines globally. Principles for the construction of a comprehensive evaluation of China's TCM medical service system are systematicness, applicability, pertinence, feasibility, and compatibility (7). We have fully considered the systematicness and feasibility of the structure when constructing the TCM medical service system. For example, we explained the internal logic between medical resources, service efficiency, and expenditure-income.
Nonetheless, several limitations of our study should be born in mind. Firstly, our research is based on the perspective of suppliers, and we lack an overview of patient experience of hospital care by a third party. Secondly, although we have made a comprehensive evaluation of the Chinese TCM medical service system, the results fluctuate greatly. We need to explore the essence behind this phenomenon. Therefore, additional research can focus on the performance of hospital services in various provinces or determinants and differences in hospital efficiency.
Based on the above analysis, the paper suggests that the government should increase its support for the TCM medical service system in terms of policies and investment, oversee the training of the next generation of talent in traditional Chinese medicine, improve the teaching quality of colleges and universities of traditional Chinese medicine, and transfer talent from the East to the Central and Western regions so as to enhance the strength of medical resources in these regions (37, 38). Furthermore, the capability of medical services in the Western regions can be improved through counterpart support, medical consortia and telemedicine services. Also, TCM hospitals should strengthen the standardized construction and scientific management of the TCM preventive treatment of diseases section, and improve the service ability of TCM preventive treatment of diseases.
Data Availability Statement
All datasets generated for this study are included in the article/supplementary material.
Author Contributions
Z-GL and HW participated in study design, drafted this manuscript, and have all reviewed and approved of the final manuscript. Z-GL conducted data collection and data analysis. All authors contributed to the article and approved the submitted version.
Funding
This study was funded Anhui Social Science under Grant No. AHSKQ2019D110.
Conflict of Interest
The authors declare that the research was conducted in the absence of any commercial or financial relationships that could be construed as a potential conflict of interest.
Abbreviations
TCM, traditional Chinese medicine; KMO, Kaiser-Meyer-Olkin.
References
1. Wang HY, Jin CL, Jiang QW. Price adjustment for traditional Chinese medicine procedures: based on a standardized value parity model. BioScience Trends. (2017) 11:524–32. doi: 10.5582/bst.2017.01227
2. Ma J, Lu MS, Quan HD. From a national, centrally planned health system to a system based on the market: lessons from China. Health Affairs. (2008) 27:937–48. doi: 10.1377/hlthaff.27.4.937
3. Xu J, Yang Y. Traditional Chinese medicine in the Chinese health care system. Health Policy. (2009) 90:133–9. doi: 10.1016/j.healthpol.2008.09.003
4. Chang SC, Lin CF, Yeh TC, Chang CW. Determinants of the performance of traditional Chinese medicine clinics in Taiwan. Health Policy. (2019) 123:379–87. doi: 10.1016/j.healthpol.2019.01.009
5. Pan J, Qin XZ, Li Q, Messina JP, Delamater PL. Does hospital competition improve health care delivery in China? China Econ Rev. (2015) 33:179–99. doi: 10.1016/j.chieco.2015.02.002
6. Lu LL, Zeng JC. Inequalities in the geographic distribution of hospital beds and doctors in traditional Chinese medicine from 2004 to 2014. Int J Equity Health. (2018) 17:165. doi: 10.1186/s12939-018-0882-1
7. Xu WJ, Wang LT, Zhao ZP, Zhu LM, Zu LH, Zhang Q, et al. Prospects of a comprehensive evaluation system for traditional Chinese medicine services. J Integrative Med. (2017) 15:426–32. doi: 10.1016/S2095-4964(17)60364-9
8. Gao HD, Chen H, Feng J, Qin XJ, Wang X, Liang SL, et al. Balanced scorecard-based performance evaluation of Chinese county hospitals in underdeveloped areas. J Int Med Res. (2018) 46:1947–62. doi: 10.1177/0300060518757606
9. Wang L, Suo SZ, Li J, Hu YJ, Li P, Wang Y, et al. An investigation into traditional Chinese medicine hospitals in China: development trend and medical service innovation. Int J Health Policy Manage. (2017) 6:19–25. doi: 10.15171/ijhpm.2016.72
10. Li M, Fan YC, McNeil EB, Chongsuvivatwon V. System review and patient survey on expectations and perceptions of quality of healthcare in Inner Mongolia, China. Evidence Based Complement Alternative Med. (2018) 2018:2698461. doi: 10.1155/2018/2698461
11. Wu TP, Tsai CH, Su YT, Wang CC, Chen TJ, Chang CM, et al. The evaluation of professional divisions of traditional Chinese medicine in Taiwan through patient visit records of 2012. Int J Environ Res Public Health. (2018) 15:1992. doi: 10.3390/ijerph15091992
12. Chen D, Li F, Wang J, Su JY, Jin CL, Zhao ZP, et al. Effect analysis on comprehensive assessment system of traditional Chinese medicine services. Chinese Health Resources. (2016) 19:480–4. doi: 10.13688/j.cnki.chr.2016.16420
13. Gu XD, Wang F, Lin J. Research on clinical department comprehensive evaluation index system in hospitals. Chinese Hospital Manag. (2011) 31:36–8. doi: 10.13688/j.cnki.chr.2018.18160
14. Ni M. Preliminary Research on Establishing Evaluation Indicator System for Social responsibility of Tertiary Public Hospitals. (M.S. thesis). School of Public Health, Fudan University, Shanghai, China. (2012).
15. Wang H, Bian C, Li NN, Xu SM, Wu JY, Zhao YW. Establishing the county-level medical institutions performance evaluation indicator system based on the PATH model. Chinese J Hospital Admin. (2018) 34:366–70. doi: 10.3760/cma.j.issn.1000-6672.2018.05.003
16. Liu HQ. The Medical Service Ability Evaluation and Influence Factors Analysis on County General Hospital in Fujian. (M.S. thesis). School of Public Health, Fujian Medical University, Fuzhou, China. (2016).
17. Zhou YL. Comprehensive TCM Medical Service Quality Evaluation Model Construction Study of AAA-grade TCM Hospitals-Based on Hubei Province. (M.S. thesis). School of Public health, Hubei University of Chinese Medicine, Hunan, China. (2017).
18. Landeta J. Current validity of the Delphi method in social sciences. Technol Forecast Soc Change. (2006) 73:467–82. doi: 10.1016/j.techfore.2005.09.002
19. Batbaatar E, Dorjdagva J, Luvsannyam A, Savino MM, Amenta P. Determinants of patient satisfaction: a systematic review. Perspect Public Health. (2017) 137:89–101. doi: 10.1177/1757913916634136
20. Hu G, Chen Y, Liu Q, Wu S, Guo J, Liu S, et al. Patient experience of hospital care in China: major findings from the Chinese Patient Experience Questionnaire Survey (2016–2018). BMJ Open. (2019) 9:e031615. doi: 10.1136/bmjopen-2019-031615
21. Chowdhury H, Zelenyuk V. Performance of hospital services in Ontario: DEA with truncated regression approach. Omega. (2016) 63:111–22. doi: 10.1016/j.omega.2015.10.007
22. Sakaluk JK, Short SD. A methodological review of exploratory factor analysis in sexuality research: used practices, best practices, and data analysis resources. J Sex Res. (2017) 54:1–9. doi: 10.1080/00224499.2015.1137538
23. Howard MC. A review of exploratory factor analysis decisions and overview of current practices: what we are doing and how can we improve? Int J Hum Comp Interaction. (2016) 32:51–62. doi: 10.1080/10447318.2015.1087664
24. Yoon KP, Kim WK. The behavioral TOPSIS. Expert Syst Appl. (2017) 89:266–72. doi: 10.1016/j.eswa.2017.07.045
25. Olson DL. Comparison of weights in TOPSIS models. Math Comput Model. (2004) 40:721–7. doi: 10.1016/j.mcm.2004.10.003
26. Yu L, Shen X, Pan Y, Wu Y. Scholarly journal evaluation based on panel data analysis. J Informetrics. (2009) 3:312–20. doi: 10.1016/j.joi.2009.04.003
27. Jahanshahloo GR, Lotfi FH, Izadikhah M. Extension of the TOPSIS method for decision-making problems with fuzzy data. Appl Math Comput. (2006) 181:1544–51. doi: 10.1016/j.amc.2006.02.057
28. Kalid N, Zaidan AA, Zaidan BB, Salman OH, Hashim M, Albahri OS, et al. Based on real time remote health monitoring systems: a new approach for prioritization “large scales data” patients with chronic heart diseases using body sensors and communication technology. J Med Syst. (2018) 42:69. doi: 10.1007/s10916-018-0916-7
29. Enaizan O, Zaidan AA, Alwi NHM, Zaidan BB, Alsalem MA, Albahri OS, et al. Electronic medical record systems: decision support examination framework for individual, security and privacy concerns using multi-perspective analysis. Health Technol. (2018) 10:795–822. doi: 10.1007/s12553-018-0278-7
30. Williams B, Onsman A, Brown T. Exploratory factor analysis: a five-step guide for novices. J Emergency Primary Health Care. (2010) 8:1–13. doi: 10.33151/ajp.8.3.93
31. Reio TG, Shuck B. Exploratory factor analysis: implications for theory, research, and practice. Adv Develop Hum Resour. (2015) 17:12–25. doi: 10.1177/1523422314559804
32. Barendse MT, Oort FJ, Timmerman ME. Using exploratory factor analysis to determine the dimensionality of discrete responses. Struct Equation Model. (2015) 22:87–101. doi: 10.1080/10705511.2014.934850
33. Kumar K, Garg H. Connection number of set pair analysis based TOPSIS method on intuitionistic fuzzy sets and their application to decision making. Appl Intelligence. (2017) 48:2112–9. doi: 10.1007/s10489-017-1067-0
34. Li FX, Liu QQ. The comprehensive evaluation of China's Regional Financial Development–based on panel data empirical research by factor analysis and topsis. J Indus Technol Econ. (2016) 35:152–60. doi: 10.3969/j.issn.1004-910X.2016.03.020
35. Luo GW, Liu YM, Mo XL. Factor analysis model based on the theory of the TOPSIS in the application research. Discrete Dyn Nat Soc. (2017) 2017:1–8. doi: 10.1155/2017/9173460
36. Yang X, He YC. Growth evaluation of traditional Chinese medicine listed companies-by Topsis evaluation method based on factor analysis. Chinese Tradition Herbal Drugs. (2018) 49:5220–8. doi: 10.7501/j.issn.0253-2670.2018.21.038
37. Hu NZ, Lee CY, Hou MC, Chen YL. A cloud system for mobile medical services of traditional Chinese medicine. J Med Syst. (2013) 37:9978. doi: 10.1007/s10916-013-9978-8
Keywords: traditional Chinese medicine, Healthy China 2030, health care system, medical reform, factor analysis, TOPSIS
Citation: Li Z-G and Wei H (2020) A Comprehensive Evaluation of China's TCM Medical Service System: An Empirical Research by Integrated Factor Analysis and TOPSIS. Front. Public Health 8:532420. doi: 10.3389/fpubh.2020.532420
Received: 04 February 2020; Accepted: 14 August 2020;
Published: 29 September 2020.
Edited by:
Mirjana Ratko Jovanovic, University of Kragujevac, SerbiaReviewed by:
Enver Envi Roshi, University of Medicine, Tirana, AlbaniaPeng Wu, Nanjing University of Chinese Medicine, China
Copyright © 2020 Li and Wei. This is an open-access article distributed under the terms of the Creative Commons Attribution License (CC BY). The use, distribution or reproduction in other forums is permitted, provided the original author(s) and the copyright owner(s) are credited and that the original publication in this journal is cited, in accordance with accepted academic practice. No use, distribution or reproduction is permitted which does not comply with these terms.
*Correspondence: Hua Wei, d2VpaHVhQGFodGNtLmVkdS5jbg==